chapter 9: plotting: graph layers plotting: graph...
TRANSCRIPT
Chapter 9: Plotting: Graph Layers
Understanding Layers • 239
Plotting: Graph Layers Understanding Layers
The layer is the fundamental building block for Origin graphs. Put most simply, a layer is an object consisting of one set of axes. A layer’s axes control how the data plot is displayed in the layer. Axes have scales that determine the range of data displayed, and tick marks and tick labels that give the data plot meaning. Origin automatically determines how to scale and label the axes depending on the data plot, but Origin also provides control over the organization and look of the graph. This fact, and the fact that a graph window can have multiple layers that may themselves be independent of each other or “linked,” allows Origin to produce very complex graphs with minimum effort.
Note: To learn more about layers, review the LINE & SCATTER PLOTS.OPJ project and the INSET.OPJ project located in your Origin \SAMPLES\GRAPHING\2D PLOTS folder.
Defining the Layer A layer is an Origin object that contains one set of controlling axes that may or may not be displayed. In addition, the layer can contain data plots or labels (objects) that may or may not be displayed.
A layer necessarily resides in a window and a graph window necessarily contains at least one layer.
The page of the Origin graph window can hold up to 50 layers. Each layer can be moved or sized on the page. Additionally, each layer has a layer icon located in the upper-left corner of the graph that visually displays whether the layer is active or not.
Finally, a layer possesses properties and methods that are addressable from LabTalk and which can alter the layer's appearance and function.
Reasons for Adding Another Layer to a Graph In general, new layers are added to a graph for the following reasons:
1) Display the same data plot, but on different axis scales (for example, Celsius and Fahrenheit, or miles and kilometers).
2) Create and arrange multiple graphs within one graph window.
3) Inset a graph within a graph.
Defining the Active Layer When a layer is active it is receptive to program commands. All operations, for example plotting or adding text labels, are always performed on the active layer. Only one layer can be active at a time.
Chapter 9: Plotting: Graph Layers
Understanding Layers • 240
Each layer has an associated layer icon in the upper-left corner of the graph window. The icon appears as a
small gray rectangle containing the layer number. Layer icons tell you which layer is the active layer, and allow you to set the active layer. When a layer is active, its layer icon depresses.
If the View:Show:Active Layer Indicator menu command is checked, the active layer will also be indicated by highlighted axes. This menu command is page specific, meaning you must select the menu command for individual graph windows.
Clicking once on a layer icon will cause that layer to become active. Double-clicking on a layer icon will open the Layer n dialog box for the layer. Origin provides the following alternative methods to set the active layer:
1) Click on the X or Y axis within the layer.
2) Click anywhere within the frame of the layer. This procedure may be difficult if multiple layers are not separated spatially.
3) Click on the plot type icon in the legend of the respective layer.
To ensure that a layer can be made active only by clicking on the layer icon, select Format:Page. This menu command opens the Plot Details dialog box with the page (graph) icon selected on the left side of the dialog box. Select the Miscellaneous tab and then select the Set Active Layer by Layer Icon Only check box.
Terminology: Parent Layer vs. Child Layer In a multiple layer graph, you can link layers to ensure that if one layer is moved or resized, other selected layers will move or resize to maintain the original spatial layer arrangement. Additionally, you can link layers to ensure that a selected layer's axis scale will always update to reflect the axis scale of the layer that it is linked to.
Origin uses specific terminology (child, parent) when referring to a layer that is linked to another layer. For example, if layer 4 is linked to layer 2, then layer 4 is termed the child layer and layer 2 is termed the parent layer. The child layer is always linked to the parent layer. Thus, you can customize the child layer's properties so that the child layer will always move or resize if the parent layer moves or resizes. Additionally, you can customize the child layer's properties so that the child layer's axes scales will always update to reflect any changes to the parent layer's axes scales.
Chapter 9: Plotting: Graph Layers
Controlling the Display of Elements Associated with a Layer • 241
Controlling the Display of Elements Associated with a Layer
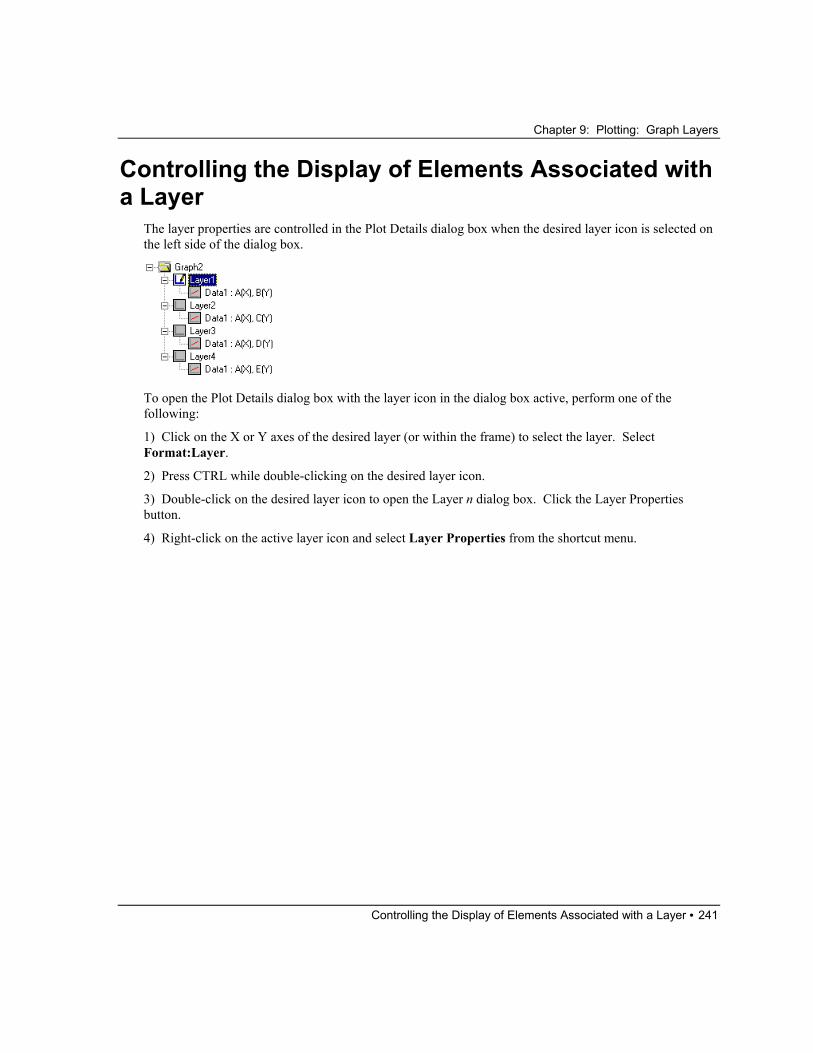
The layer properties are controlled in the Plot Details dialog box when the desired layer icon is selected on the left side of the dialog box.
To open the Plot Details dialog box with the layer icon in the dialog box active, perform one of the following:
1) Click on the X or Y axes of the desired layer (or within the frame) to select the layer. Select Format:Layer.
2) Press CTRL while double-clicking on the desired layer icon.
3) Double-click on the desired layer icon to open the Layer n dialog box. Click the Layer Properties button.
4) Right-click on the active layer icon and select Layer Properties from the shortcut menu.
Chapter 9: Plotting: Graph Layers
Controlling the Display of Elements Associated with a Layer • 242
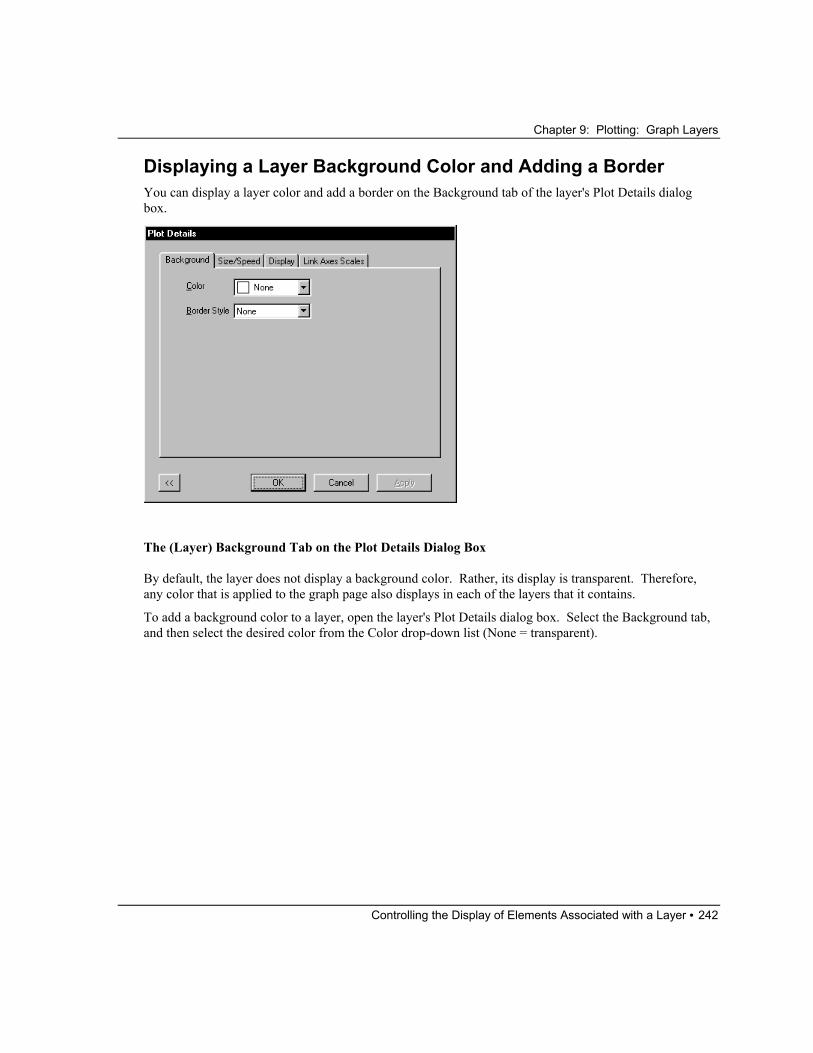
Displaying a Layer Background Color and Adding a Border You can display a layer color and add a border on the Background tab of the layer's Plot Details dialog box.
The (Layer) Background Tab on the Plot Details Dialog Box
By default, the layer does not display a background color. Rather, its display is transparent. Therefore, any color that is applied to the graph page also displays in each of the layers that it contains.
To add a background color to a layer, open the layer's Plot Details dialog box. Select the Background tab, and then select the desired color from the Color drop-down list (None = transparent).
Chapter 9: Plotting: Graph Layers
Controlling the Display of Elements Associated with a Layer • 243
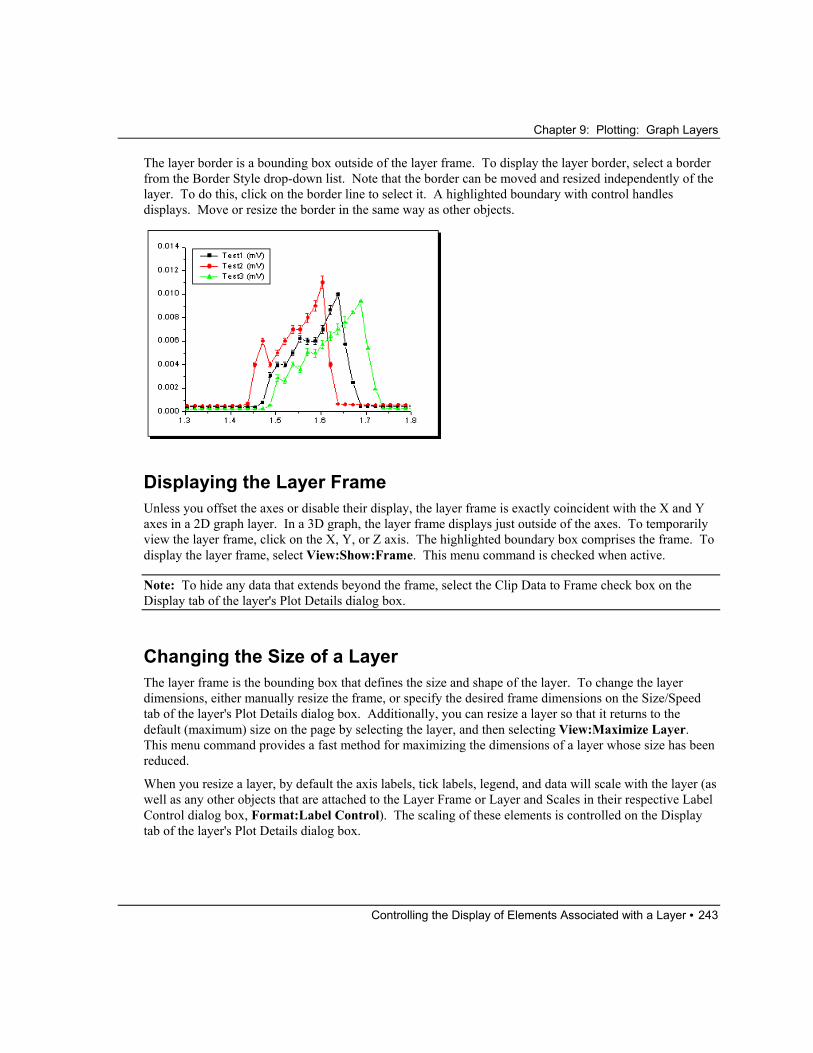
The layer border is a bounding box outside of the layer frame. To display the layer border, select a border from the Border Style drop-down list. Note that the border can be moved and resized independently of the layer. To do this, click on the border line to select it. A highlighted boundary with control handles displays. Move or resize the border in the same way as other objects.
Displaying the Layer Frame Unless you offset the axes or disable their display, the layer frame is exactly coincident with the X and Y axes in a 2D graph layer. In a 3D graph, the layer frame displays just outside of the axes. To temporarily view the layer frame, click on the X, Y, or Z axis. The highlighted boundary box comprises the frame. To display the layer frame, select View:Show:Frame. This menu command is checked when active.
Note: To hide any data that extends beyond the frame, select the Clip Data to Frame check box on the Display tab of the layer's Plot Details dialog box.
Changing the Size of a Layer The layer frame is the bounding box that defines the size and shape of the layer. To change the layer dimensions, either manually resize the frame, or specify the desired frame dimensions on the Size/Speed tab of the layer's Plot Details dialog box. Additionally, you can resize a layer so that it returns to the default (maximum) size on the page by selecting the layer, and then selecting View:Maximize Layer. This menu command provides a fast method for maximizing the dimensions of a layer whose size has been reduced.
When you resize a layer, by default the axis labels, tick labels, legend, and data will scale with the layer (as well as any other objects that are attached to the Layer Frame or Layer and Scales in their respective Label Control dialog box, Format:Label Control). The scaling of these elements is controlled on the Display tab of the layer's Plot Details dialog box.

Chapter 9: Plotting: Graph Layers
Controlling the Display of Elements Associated with a Layer • 244
Changing the Layer Dimensions by Manually Sizing the Frame Activate the layer frame for sizing by clicking on one of the axes in the layer. Once the frame is active, a sizing box with control handles displays.
1) To size the layer frame, drag a control handle. When dragging the control handle, an outline of the layer changes size. The actual layer frame remains at its current size until you release the mouse button and click outside the layer (but within the graph window).
2) To proportionally size the layer frame, press CTRL and then click on a control handle. Release the CTRL key (while still holding down the mouse button) and drag the layer to the desired size. Click outside the layer (but within the graph window) to fix the new size.
Specifying New Layer Dimensions in the Plot Details Dialog Box The layer dimensions are set on the Size/Speed tab of the layer's Plot Details dialog box.
Note: When you set the size of the layer, you are also setting the size of the axes in the layer. To set the layer (and thus the axes) to a specific width and height, select the desired units (for example, inch, cm, or mm) from the Units drop-down list in the Layer Area group. Then enter the desired dimensions in the Width and Height text boxes.
The (Layer) Size/Speed Tab on the Plot Details Dialog Box
To Specify the Layer Area:
To numerically position or resize the layer, type values in the Left, Top, Width, and Height text boxes. The Left text box value determines the position of the frame relative to the left side of the page. The Top
Chapter 9: Plotting: Graph Layers
Controlling the Display of Elements Associated with a Layer • 245
text box value determines the position of the frame relative to the top of the page. The Height and Width text box values determine the size of the frame. Select the desired units from the Units drop-down list.
1) The % of Page unit is useful for maintaining the same layer size relative to the page size. When this unit is selected, the Left, Top, Height, and Width text box values are in percentage of the graph page height and width.
2) The % of Linked Layer unit is useful for creating inset graphs. This unit allows you to specify the frame dimensions and offsets for a child layer in terms of the dimensions of the parent layer frame. When this unit is selected, the Left, Top, Height, and Width text box values are in percentage of the height and width of the parent layer frame. (This unit is not available unless the current layer is linked to a parent layer.)
Note: When the unit selection is changed in the drop-down list, the Left, Top, Height, and Width text box values are automatically updated so that the layer retains the same size and position.
To Increase the Redraw Speed of the Layer:
Select a buffering method from the Graphic Image Caching drop-down list. Graphic image caching can be used whenever a 2D or 3D graph layer needs to be redrawn without being refreshed. For example, when a graph window is overlaid by a worksheet window and then brought to the front again, or when the graph window is resized. For 2D graph layers, select Raster to use caching. For 3D graph layers, select Raster or Vector.
1) Vector (metafile) buffering provides Origin with a detailed description of how to draw the graph and is fully scaleable.
2) Raster (bitmap) buffering tells Origin how many pixels of what color to draw at what position. This information is based on a certain resolution and will become distorted when resized.
Note: If you resize your graph in raster caching mode, the graph may get a rough pixel appearance. If this occurs, select Window:Refresh to restore the display.
If you select None, Origin redraws the graph layer every time the graph window is moved, brought to the front, or resized.
In addition to graphic image caching, you can use Origin's speed mode to increase the redraw speed of your graph layer. With speed mode, you can control the number of data points displayed in a graph layer. This option is most useful when working with large data sets.
Select the Worksheet Data, Maximum Points Per Curve check box to enable speed mode for all the data plots in the layer that are created from worksheet data. Type the desired value (n) in the associated text box. If the number of data points in a data plot exceeds n, Origin displays a subset of the data plot that contains n points. This subset contains evenly spaced data - by the worksheet rows.
For 3D data plots created from a matrix or for contour data in the layer, select the Matrix Data, Maximum Points Per Dimension check box to enable speed mode. Type the desired value (n, m) in the X and Y text boxes. If the number of data points in a data plot exceeds n or m, Origin displays a subset of the data plot that contains n and m points. This subset contains evenly spaced data - by the matrix columns (X) and matrix rows (Y).
Chapter 9: Plotting: Graph Layers
Controlling the Display of Elements Associated with a Layer • 246
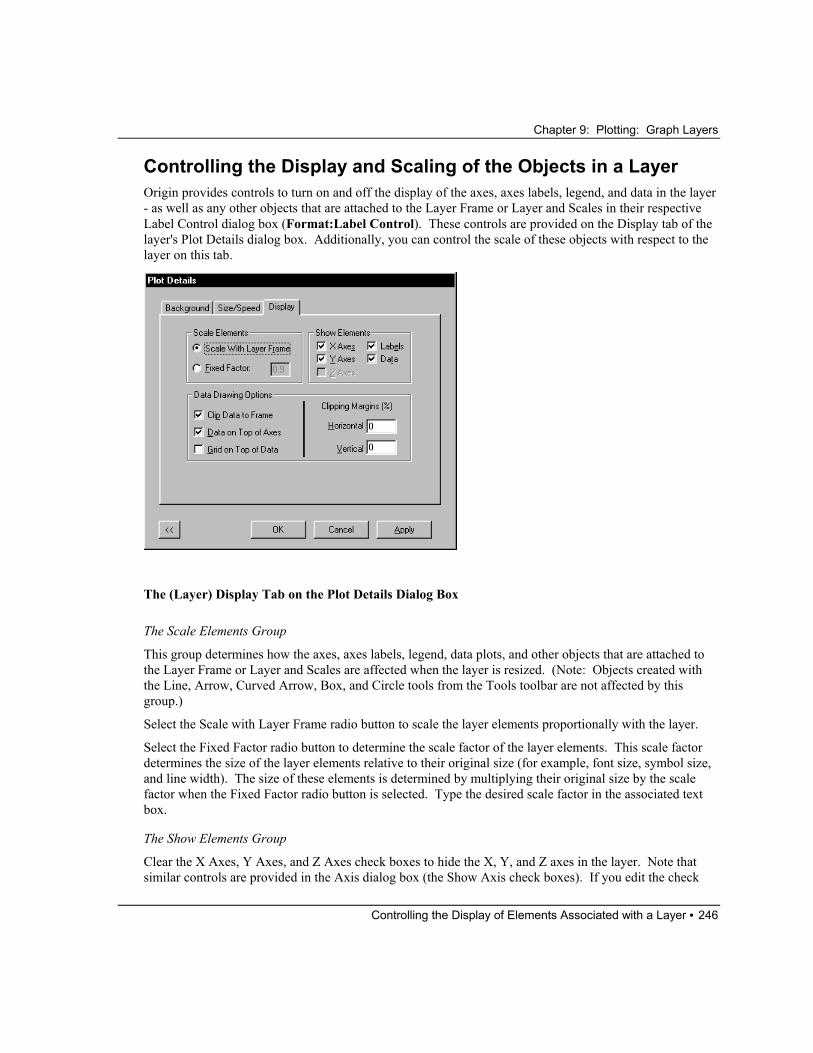
Controlling the Display and Scaling of the Objects in a Layer Origin provides controls to turn on and off the display of the axes, axes labels, legend, and data in the layer - as well as any other objects that are attached to the Layer Frame or Layer and Scales in their respective Label Control dialog box (Format:Label Control). These controls are provided on the Display tab of the layer's Plot Details dialog box. Additionally, you can control the scale of these objects with respect to the layer on this tab.
The (Layer) Display Tab on the Plot Details Dialog Box
The Scale Elements Group
This group determines how the axes, axes labels, legend, data plots, and other objects that are attached to the Layer Frame or Layer and Scales are affected when the layer is resized. (Note: Objects created with the Line, Arrow, Curved Arrow, Box, and Circle tools from the Tools toolbar are not affected by this group.)
Select the Scale with Layer Frame radio button to scale the layer elements proportionally with the layer.
Select the Fixed Factor radio button to determine the scale factor of the layer elements. This scale factor determines the size of the layer elements relative to their original size (for example, font size, symbol size, and line width). The size of these elements is determined by multiplying their original size by the scale factor when the Fixed Factor radio button is selected. Type the desired scale factor in the associated text box.
The Show Elements Group
Clear the X Axes, Y Axes, and Z Axes check boxes to hide the X, Y, and Z axes in the layer. Note that similar controls are provided in the Axis dialog box (the Show Axis check boxes). If you edit the check
Chapter 9: Plotting: Graph Layers
Controlling the Display of Elements Associated with a Layer • 247
boxes on the Plot Details dialog box Display tab, the controls on the Axis dialog box update to reflect your changes. Similarly, if you edit the check boxes on the Axis dialog box, the controls on the Plot Details dialog box update to reflect your changes.
Clear the Labels check box to hide all axis titles, arrows, text labels, shapes, and objects in the active layer. (To view the labels in the printout, remember to select the Labels check box before printing.)
Clear the Data check box to hide all data plots in the active layer. (To view the data in the printout, remember to select the Data check box before printing.)
The Data Drawing Options Group
Select the Clip Data to Frame check box to hide data that extends beyond the layer frame. If the Clipping Margins settings have been set, select this check box to hide all data outside of the customized clipping margins.
Select the Data on Top of Axes check box to display data plots and symbols superimposed over the layer axes.
Select the Grid on Top of Data check box to display axis grid lines superimposed over data plots and symbols.
Edit the Clipping Margins (%) sub-group to set the clipping margins inside, or outside, the active layer frame. The default units are in % of the layer frame size. Type a negative value to clip the data to a point outside the frame. Type a positive value to clip the data to a point inside the frame. To clip the data, select the Clip Data to Frame check box.
Increasing the Redraw Speed in a Layer Origin provides two methods to enhance the redraw speed of the graph layer: graphic image caching and controlling the number of data points that display in the data plot (speed mode). Both these methods are available on the Size/Speed tab of the layer's Plot Details dialog box. Additionally, you can select a graphic image caching method from the layer's shortcut menu.
In addition to enhancing the redraw speed of the layer, you can enhance the redraw speed of the graph page by controlling the display of elements on the graph page, and by controlling the graph page redraw criteria. These additional techniques are discussed in Plotting: Customizing the Page Display.
Controlling the 3D Axis Length, Rotation, and Perspective in a Layer Origin provides controls on the Axis tab of the layer's Plot Details dialog box to specify the X, Y, and Z axes physical length in relation to the layer frame. Additionally, controls are provided on this tab to manually set the rotation angle about the X, Y, or Z axes, and to change the perspective angle.
Note: Complementary tools for controlling the 3D rotation and perspective angle are provided on the 3D Rotation toolbar (View:Toolbars).

Chapter 9: Plotting: Graph Layers
Controlling the Display of Elements Associated with a Layer • 248
The (Layer) Axis Tab on the Plot Details Dialog Box
Setting the X, Y, and Z Axis Length
You can specify the X, Y, and Z axis length in the associated text boxes. The text boxes are in units of percent of the layer frame. Thus, to display the X axis at 50% of its full length, type 50 in the X Length text box.
Rotating the Graph About One of the Axes
To manually set the rotation angle about the X, Y, or Z axis, type the desired rotation angle in the associated text box. This text box value is in units of degrees, independent of the Angular Unit setting on the Numeric Format tab of the Options dialog box.
You can also use the 3D Rotation toolbar buttons to rotate the graph about the axes.
The Rotation Buttons on the 3D Rotation Toolbar
Select or type a rotation angle (in degrees) for the rotation buttons.
Rotate counterclockwise about the Z axis the specified rotation angle.
Rotate clockwise about the Z axis the specified rotation angle.
Tilt the top of the graph counterclockwise the specified rotation angle.
Tilt the top of the graph clockwise the specified rotation angle.
Chapter 9: Plotting: Graph Layers
Controlling the Display of Elements Associated with a Layer • 249
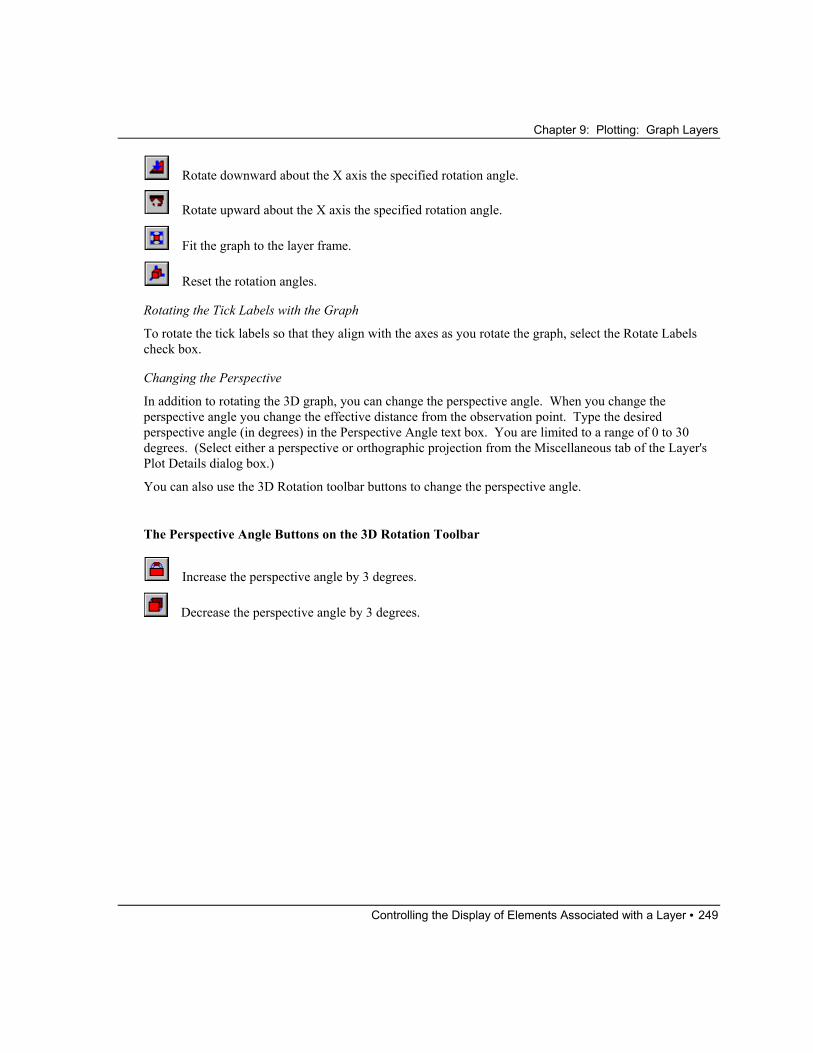
Rotate downward about the X axis the specified rotation angle.
Rotate upward about the X axis the specified rotation angle.
Fit the graph to the layer frame.
Reset the rotation angles.
Rotating the Tick Labels with the Graph
To rotate the tick labels so that they align with the axes as you rotate the graph, select the Rotate Labels check box.
Changing the Perspective
In addition to rotating the 3D graph, you can change the perspective angle. When you change the perspective angle you change the effective distance from the observation point. Type the desired perspective angle (in degrees) in the Perspective Angle text box. You are limited to a range of 0 to 30 degrees. (Select either a perspective or orthographic projection from the Miscellaneous tab of the Layer's Plot Details dialog box.)
You can also use the 3D Rotation toolbar buttons to change the perspective angle.
The Perspective Angle Buttons on the 3D Rotation Toolbar
Increase the perspective angle by 3 degrees.
Decrease the perspective angle by 3 degrees.
Chapter 9: Plotting: Graph Layers
Controlling the Display of Elements Associated with a Layer • 250
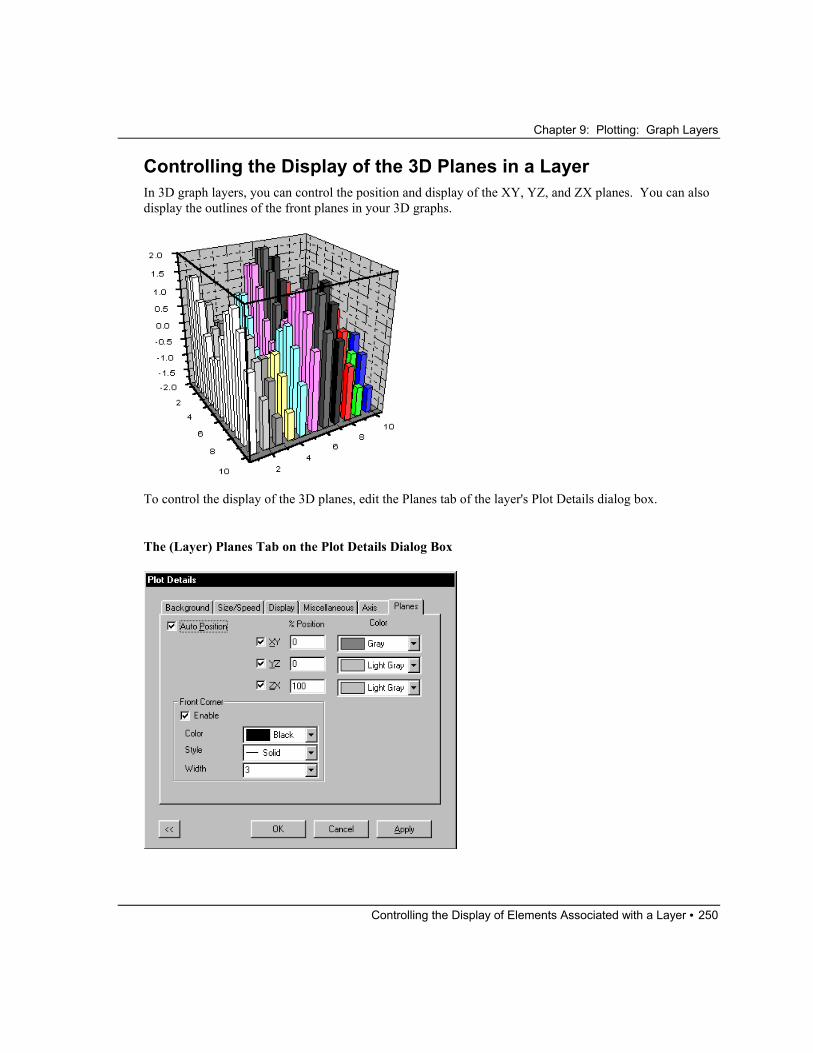
Controlling the Display of the 3D Planes in a Layer In 3D graph layers, you can control the position and display of the XY, YZ, and ZX planes. You can also display the outlines of the front planes in your 3D graphs.
To control the display of the 3D planes, edit the Planes tab of the layer's Plot Details dialog box.
The (Layer) Planes Tab on the Plot Details Dialog Box
Chapter 9: Plotting: Graph Layers
Controlling the Display of Elements Associated with a Layer • 251
To Specify the Position and Color of the Back Planes
Select the Auto Position check box to automatically re-display the back plane when the graph is rotated such that one of the planes shifts to the front. When this event occurs, the % Position text box values update. For example, a text box value displaying 100 before the rotation would display 0 after - if the rotation caused the plane to shift to the front.
To control the position and display color of the XY, YZ, or ZX planes, select the associated check box. The % Position text box value controls the position of the respective plane, from the bottom of its orthogonal axis, as a percentage of the axis's length. Select the plane color from the associated Color drop-down list.
To Display the Outlines of the Front Planes
In addition to controlling the display of the back planes, you control the display of the outline of the front planes. Selecting this option gives your graph a 3D cube effect. Select the Enable check box to display the front plane outlines. Control the line display from the associated controls.
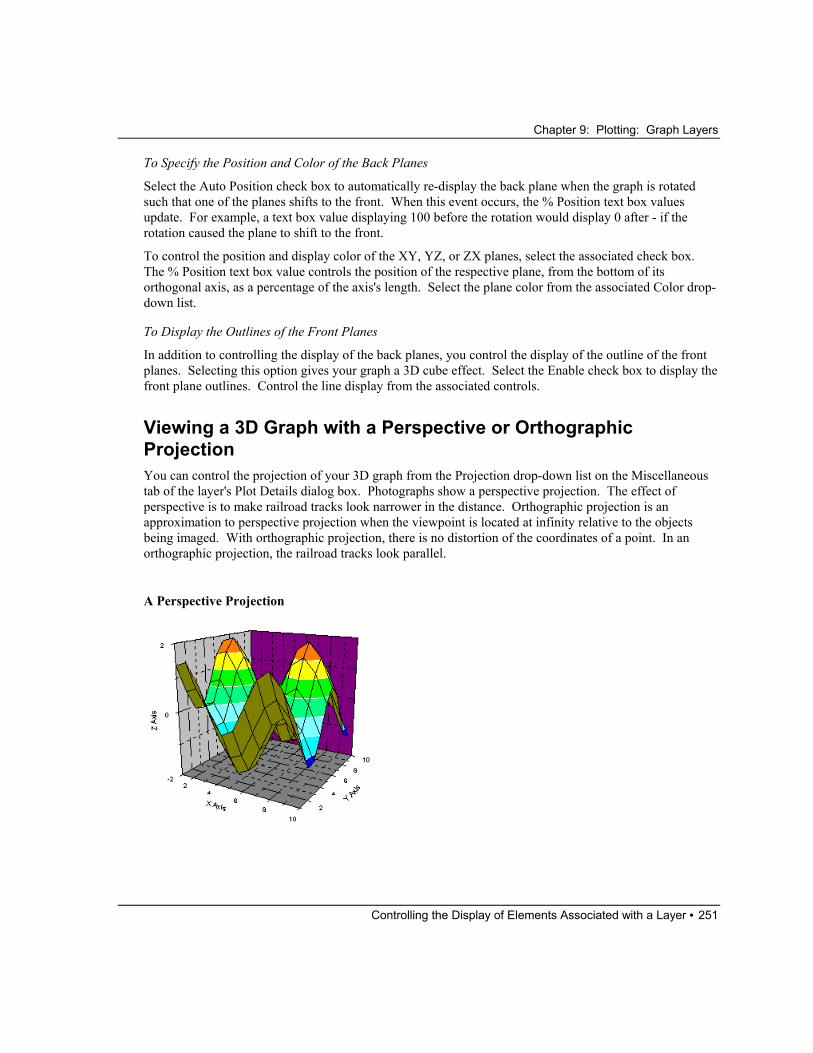
Viewing a 3D Graph with a Perspective or Orthographic Projection You can control the projection of your 3D graph from the Projection drop-down list on the Miscellaneous tab of the layer's Plot Details dialog box. Photographs show a perspective projection. The effect of perspective is to make railroad tracks look narrower in the distance. Orthographic projection is an approximation to perspective projection when the viewpoint is located at infinity relative to the objects being imaged. With orthographic projection, there is no distortion of the coordinates of a point. In an orthographic projection, the railroad tracks look parallel.
A Perspective Projection

Chapter 9: Plotting: Graph Layers
Controlling the Display of Elements Associated with a Layer • 252
An Orthographic Projection
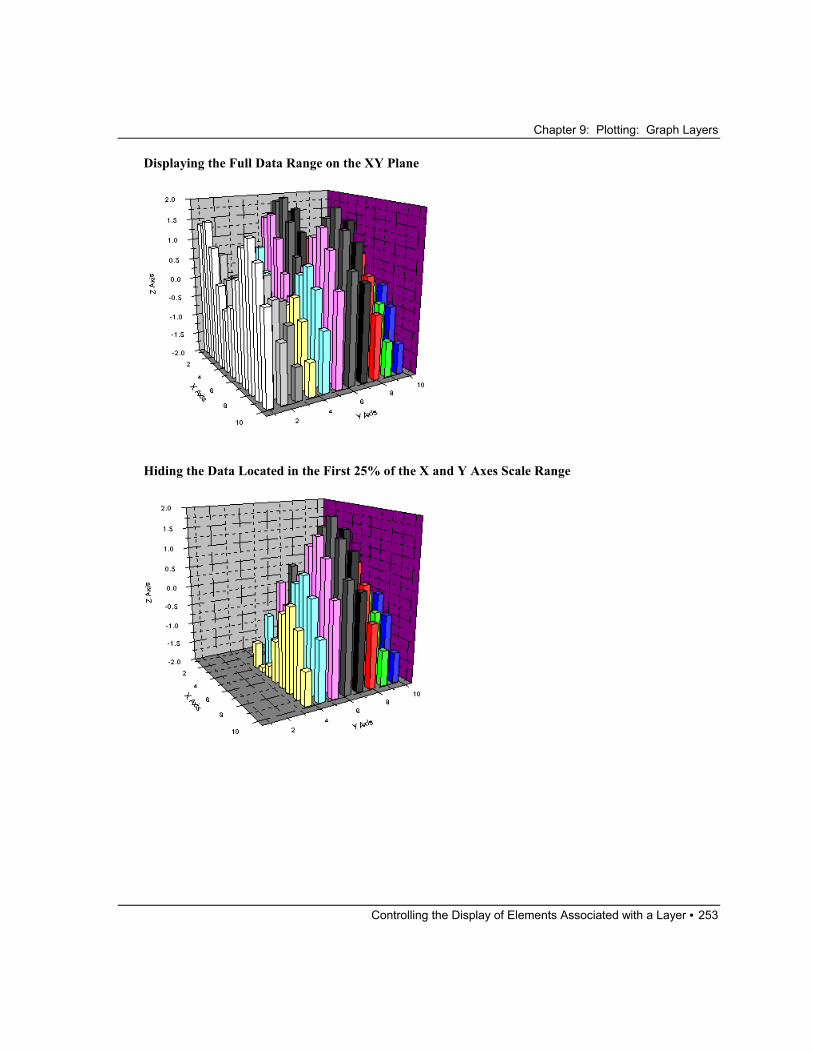
Hiding Data in the 3D XY Plane You can specify the plotting range on the XY plane of your 3D graph - without changing the axis range - by editing the XY Clipping group on the Miscellaneous tab of the layer's Plot Details dialog box.
The (Layer) Miscellaneous Tab on the Plot Details Dialog Box
Select the Enable check box to hide (clip) all data points with XY coordinates outside the range specified in the % From and % To text boxes. (Note that the axes will continue to display their current range.) Customize the clipping area by editing these text box values. The text box values are in units of percentage of the axes scales.
Chapter 9: Plotting: Graph Layers
Controlling the Display of Elements Associated with a Layer • 253
Displaying the Full Data Range on the XY Plane
Hiding the Data Located in the First 25% of the X and Y Axes Scale Range
Chapter 9: Plotting: Graph Layers
Adding New Layers to the Graph • 254
Adding New Layers to the Graph Origin provides a number of methods to add layers to your graph window. See the following topics to choose an appropriate method.
Note: For a step-by-step discussion on building multiple layer graphs, see Tutorial 3, "Creating Multiple Layer Graphs" in the Getting Started Manual.
Adding a New Set of Axes with a Scale Independent of the First Layer To add a set of XY axes which have a scale independent of the first set of axes, a new layer must be added. To add a new, independent layer, perform one of the following:
1) Select Edit:New Layer(Axes):(Normal):Bottom X + Left Y.
2) Open the Layer tool by selecting Tools:Layer. Click the Normal X and Y button on the Add tab.
3) Right-click on the page in the graph window (outside of the layer). Select New Layer(Axes):(Normal):Bottom X + Left Y from the shortcut menu.
When you add a new layer, the new layer always displays with the default layer size and placement, independent of the current layer arrangement.
Adding a New Set of Axes with a Scale which is Linked to the First Layer Origin provides a number of menu commands for adding additional layers in which the axes of the new layer have an association (or link) with the axes in the original layer:
Edit:New Layer(Axes):(Linked):Top X + Right Y
Edit:New Layer(Axes):(Linked):Top X
Edit:New Layer(Axes):(Linked):Right Y
Each of these menu commands creates a new layer that is linked to the layer that was active when the menu command was selected (as indicated by the depressed layer icon). The new layer becomes the child of the parent (active) layer. The new child layer then becomes the active layer.
For the Edit:New Layer(Axes):(Linked):Top X and Edit:New Layer(Axes):(Linked):Right Y menu commands, the axis that is not mentioned in the menu command is not displayed. It will, however, have its scale linked one-to-one with the corresponding axis in the parent layer.
Additionally, new linked layers can be added to the graph window using the Layer tool. To open the tool, select Tools:Layer. Click on the Add tab to access the “new layer” buttons.
1) Click the Linked Top X button to add a linked layer displaying a top X axis.
Chapter 9: Plotting: Graph Layers
Adding New Layers to the Graph • 255
2) Click the Linked Right Y button to add a linked layer displaying a right Y axis.
3) Click the Linked Top X and Right Y button to add a linked layer displaying a top X and right Y axis.
Converting a Single Layer Graph into Multiple Layers To convert a single layer graph window (that contains multiple data plots) into a multiple layer graph
window, click the Extract to Layers button on the Graph toolbar (View:Toolbars). This action opens the Total Number of Layers dialog box. Specify the layer arrangement in this dialog box. Subsequent dialog boxes verify the creation of the layers and their spacing on the page.
Copying Graphs Between Pages To copy a graph, including any labels or data, from one graph window to another, perform the following steps:
1) Select the existing layer you want to copy by clicking on the axis to generate a highlighted boundary.
2) Select Edit:Copy or click the Copy button on the Edit toolbar.
3) Click in the destination graph window. (Hint: The location in which you click becomes the upper-left corner of the layer.)
4) Select Edit:Paste or click the Paste button on the Edit toolbar.
Chapter 9: Plotting: Graph Layers
Adding New Layers to the Graph • 256
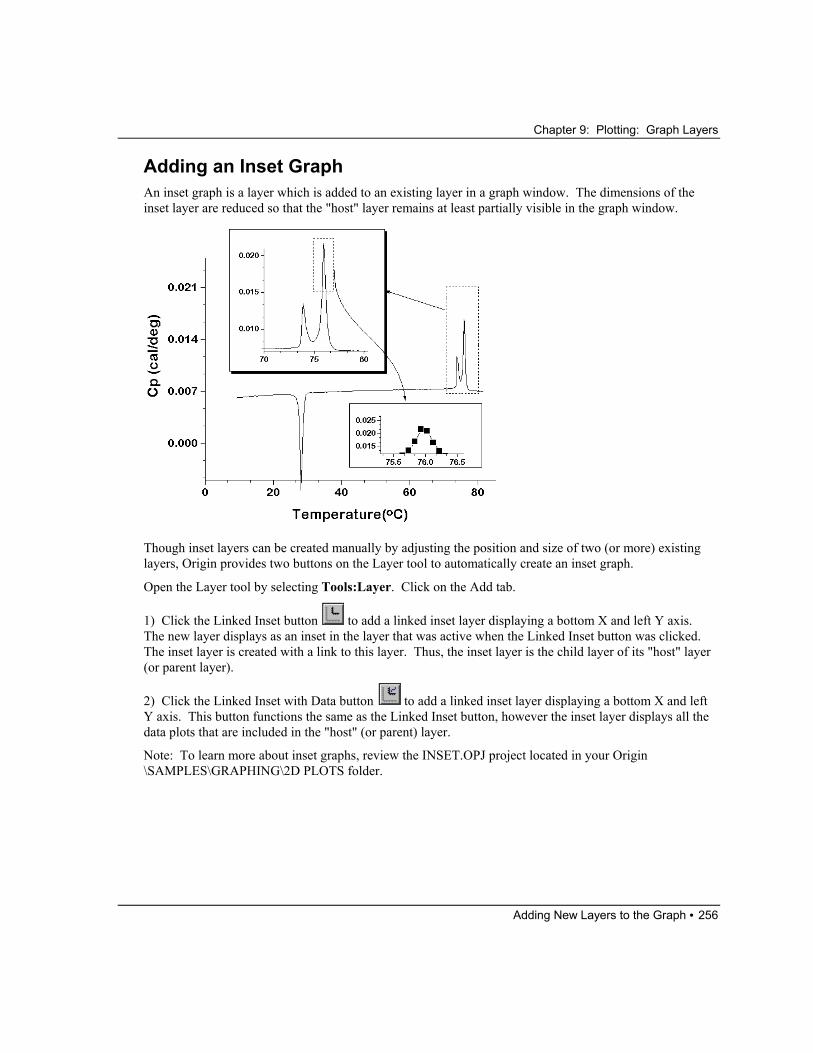
Adding an Inset Graph An inset graph is a layer which is added to an existing layer in a graph window. The dimensions of the inset layer are reduced so that the "host" layer remains at least partially visible in the graph window.
Though inset layers can be created manually by adjusting the position and size of two (or more) existing layers, Origin provides two buttons on the Layer tool to automatically create an inset graph.
Open the Layer tool by selecting Tools:Layer. Click on the Add tab.
1) Click the Linked Inset button to add a linked inset layer displaying a bottom X and left Y axis. The new layer displays as an inset in the layer that was active when the Linked Inset button was clicked. The inset layer is created with a link to this layer. Thus, the inset layer is the child layer of its "host" layer (or parent layer).
2) Click the Linked Inset with Data button to add a linked inset layer displaying a bottom X and left Y axis. This button functions the same as the Linked Inset button, however the inset layer displays all the data plots that are included in the "host" (or parent) layer.
Note: To learn more about inset graphs, review the INSET.OPJ project located in your Origin \SAMPLES\GRAPHING\2D PLOTS folder.
Chapter 9: Plotting: Graph Layers
Adding New Layers to the Graph • 257
Adding Layers During Layer Arrangement
Using the Add & Arrange Layers Menu Command To add a single set (or multiple sets) of axes with scales independent of the first layer, perform the following steps:
1) With the desired graph window active, select Edit:Add & Arrange Layers. This menu command opens the Total Number of Layers dialog box.
2) Type a row/column dimension that is greater than the number of layers currently present.
3) Click OK to close the dialog box.
Using the Arrange Tab on the Layer Tool To add a single set (or multiple sets) of axes with scales independent of the first layer, perform the following steps:
1) Open the Layer tool by selecting Tools:Layer.
2) Click on the Arrange tab.
3) Select the Add New Layers check box.
4) Type column and row dimensions in the Columns and Rows text boxes that are greater than the number of layers currently present in the active graph window.
5) Click the Array button to add the layers to the graph.
Adding Layers by Merging Pages To merge pages into one graph window preserving existing links, select Edit:Merge All Graph Windows
or click the Merge button on the Graph toolbar. Prior to selecting this menu command, make the layer that you want to be the parent layer in the new graph window, the active layer.
Using LabTalk to Add a Layer Enter the following LabTalk command in the Script window to add a new layer to the active graph window:
layer -n (ENTER)
The layer is added without links to the parent layer. Additionally, it displays with the default layer size and placement.
Chapter 9: Plotting: Graph Layers
Deleting Layers • 258
Deleting Layers To delete a layer, first select the layer by clicking on one of the axes in the layer. A highlighted boundary with control handles displays around the layer. After the layer is selected, press DELETE to delete the layer from the graph window. Alternatively, right-click on the active layer's layer icon and select Delete Layer from the shortcut menu.
Hiding Layers To reduce the screen redraw time on multiple layer graphs, or to enhance the display of a particular layer in a multiple layer graph, you can hide selected layers from view. To hide a layer, right-click on the layer icon for the layer that you want to hide and select Hide Layer from the shortcut menu.
Alternatively, to hide all but the active layer, select View:Show:All Layers to de-select the menu command. The menu command is checked when all the layers are displayed.
Note: To print the graph including all the layers, turn the layer view on before printing.
Linking Layers and Axes In multiple layer graphs, you can link layers so that a child layer will be positioned and sized in relation to a parent layer. Additionally, once layers are linked, you can set up an axis linking relationship between the child and parent layer.
Note: To learn more about linking layers, review the LINE & SCATTER PLOTS.OPJ project and the INSET.OPJ project located in your Origin \SAMPLES\GRAPHING\2D PLOTS folder.
Linking Layers to Control the Child Layer Position and Size To create a link between two layers, make the layer you want to be the child layer active - by clicking on its layer icon. Select Format:Layer to open the layer's Plot Details dialog box. Select the Link Axes Scales tab, and then select the layer to link to, from the Link To drop-down list. (Note: Click the Apply button to ensure that the % of Linked Layer option is available on the Size/Speed tab.)
Now that you've linked the child layer to the parent layer, you can force the child layer to follow the size and position of the parent layer. To do this, select the Size/Speed tab (the child layer icon must still be selected on the left side of the Plot Details dialog box). Select % of Linked Layer from the Units drop-down list. After clicking OK to close the Plot Details dialog box, whenever you make any changes to the parent layer's size or position, the child layer will update to maintain the same spatial relationship when the link was established.
Note: The parent layer must always have a lower layer number than the child layer. If necessary, you can change layer numbers with the following LabTalk command:
Chapter 9: Plotting: Graph Layers
Linking Layers and Axes • 259
page.reorder(Layer1, Layer2) (ENTER)
where Layer1 and Layer2 are layer numbers in the active graph window. The specified layers exchange layer numbers.
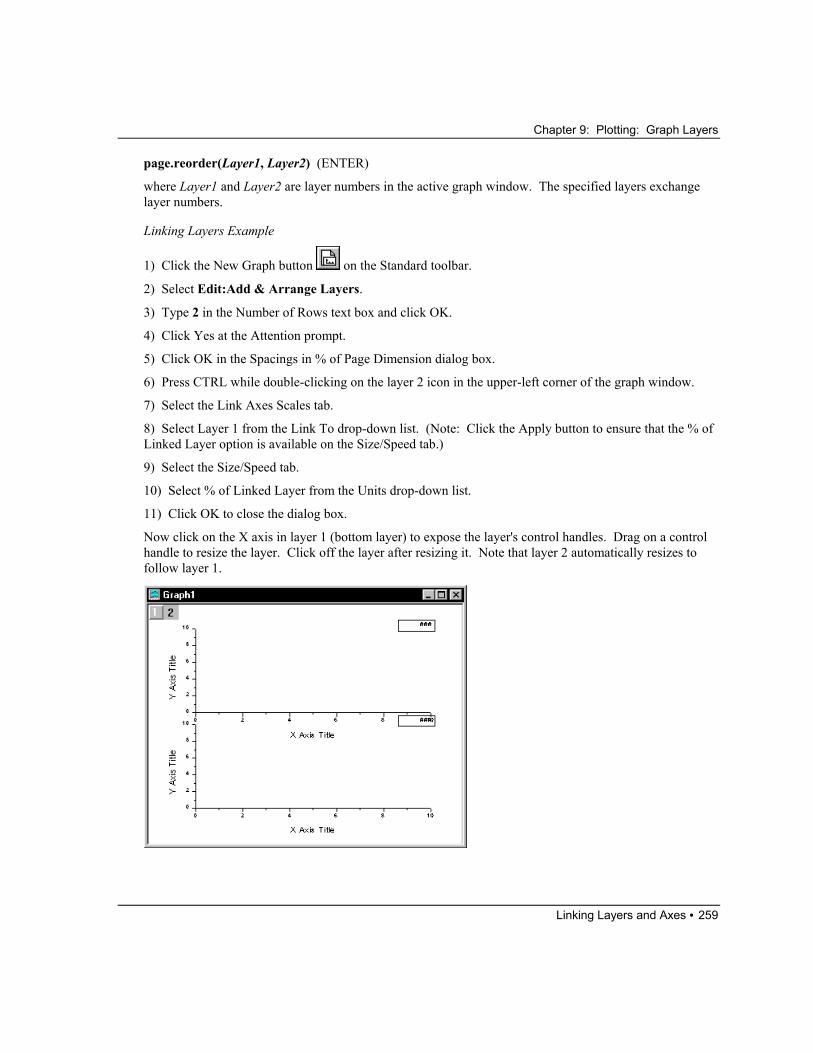
Linking Layers Example
1) Click the New Graph button on the Standard toolbar.
2) Select Edit:Add & Arrange Layers.
3) Type 2 in the Number of Rows text box and click OK.
4) Click Yes at the Attention prompt.
5) Click OK in the Spacings in % of Page Dimension dialog box.
6) Press CTRL while double-clicking on the layer 2 icon in the upper-left corner of the graph window.
7) Select the Link Axes Scales tab.
8) Select Layer 1 from the Link To drop-down list. (Note: Click the Apply button to ensure that the % of Linked Layer option is available on the Size/Speed tab.)
9) Select the Size/Speed tab.
10) Select % of Linked Layer from the Units drop-down list.
11) Click OK to close the dialog box.
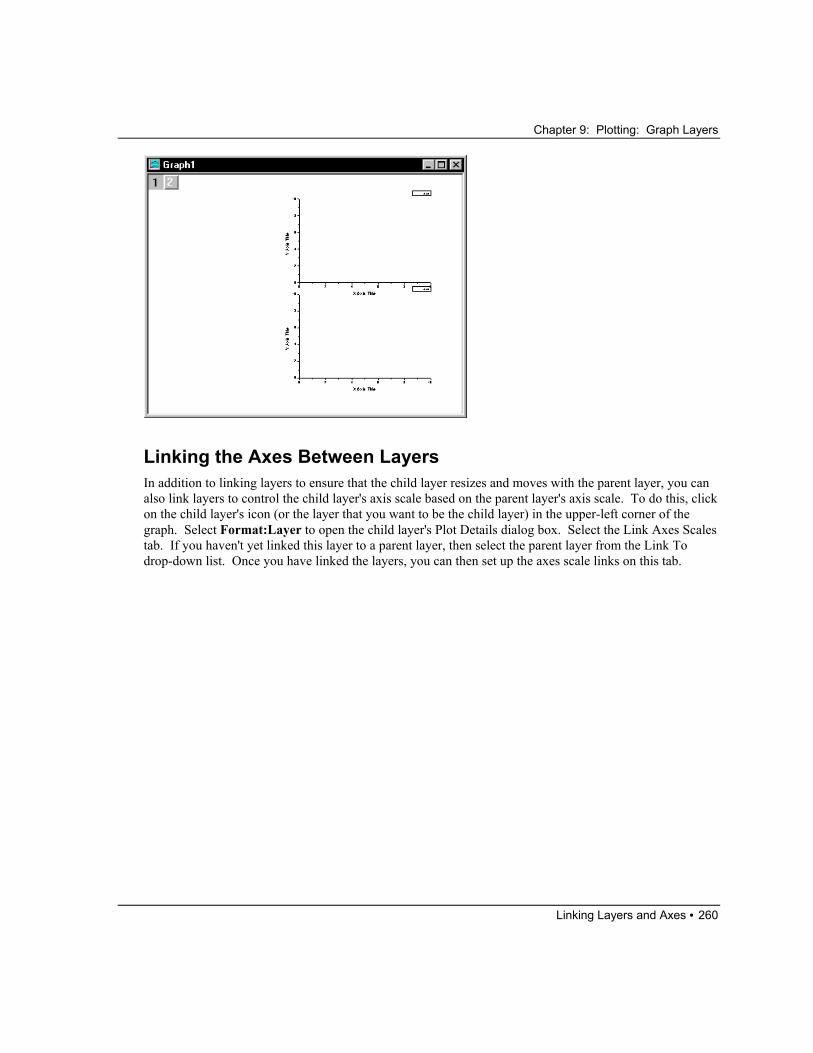
Now click on the X axis in layer 1 (bottom layer) to expose the layer's control handles. Drag on a control handle to resize the layer. Click off the layer after resizing it. Note that layer 2 automatically resizes to follow layer 1.
Chapter 9: Plotting: Graph Layers
Linking Layers and Axes • 260
Linking the Axes Between Layers In addition to linking layers to ensure that the child layer resizes and moves with the parent layer, you can also link layers to control the child layer's axis scale based on the parent layer's axis scale. To do this, click on the child layer's icon (or the layer that you want to be the child layer) in the upper-left corner of the graph. Select Format:Layer to open the child layer's Plot Details dialog box. Select the Link Axes Scales tab. If you haven't yet linked this layer to a parent layer, then select the parent layer from the Link To drop-down list. Once you have linked the layers, you can then set up the axes scale links on this tab.
Chapter 9: Plotting: Graph Layers
Linking Layers and Axes • 261
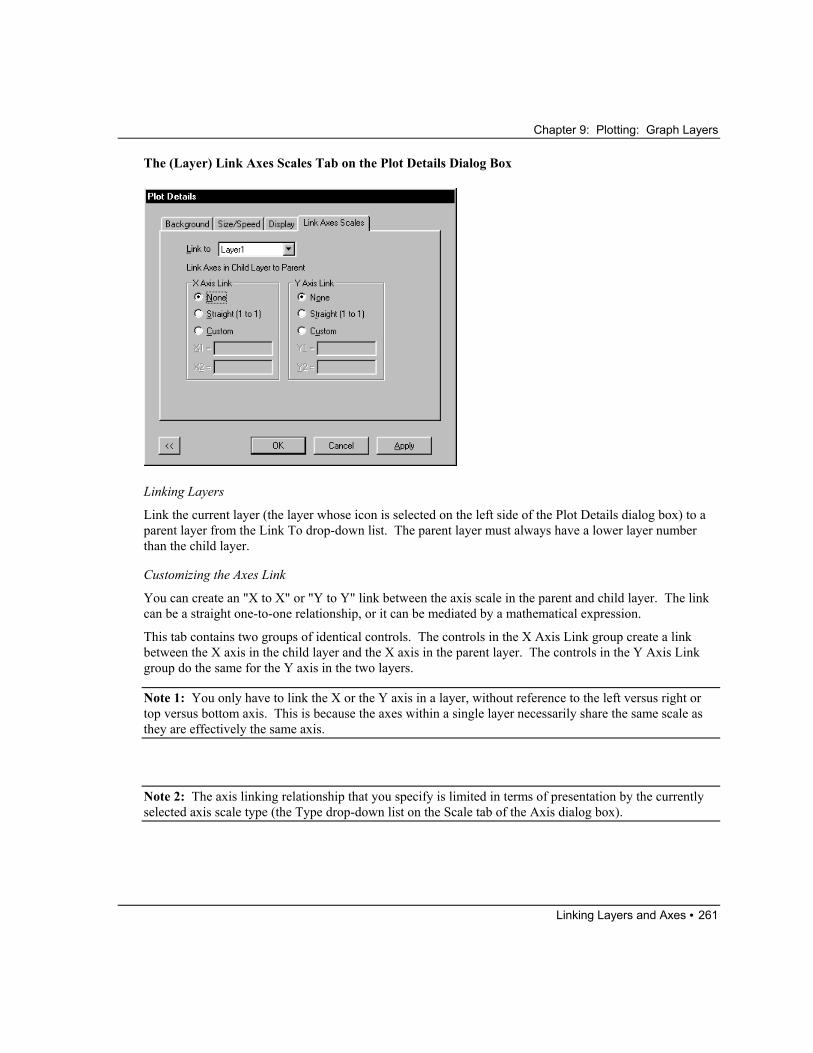
The (Layer) Link Axes Scales Tab on the Plot Details Dialog Box
Linking Layers
Link the current layer (the layer whose icon is selected on the left side of the Plot Details dialog box) to a parent layer from the Link To drop-down list. The parent layer must always have a lower layer number than the child layer.
Customizing the Axes Link
You can create an "X to X" or "Y to Y" link between the axis scale in the parent and child layer. The link can be a straight one-to-one relationship, or it can be mediated by a mathematical expression.
This tab contains two groups of identical controls. The controls in the X Axis Link group create a link between the X axis in the child layer and the X axis in the parent layer. The controls in the Y Axis Link group do the same for the Y axis in the two layers.
Note 1: You only have to link the X or the Y axis in a layer, without reference to the left versus right or top versus bottom axis. This is because the axes within a single layer necessarily share the same scale as they are effectively the same axis.
Note 2: The axis linking relationship that you specify is limited in terms of presentation by the currently selected axis scale type (the Type drop-down list on the Scale tab of the Axis dialog box).

Chapter 9: Plotting: Graph Layers
Linking Layers and Axes • 262
Note 3: If you add a layer to your graph by selecting either Edit:New Layer(Axes):(Linked):Right Y or Edit:New Layer(Axes):(Linked):Top X, an asterisk (*) displays in the X1 and X2 text boxes (linked right Y) or in the Y1 and Y2 text boxes (linked top X). This indicates that the respective link is a straight one-to-one relationship.
1) Select the None radio button to remove any link between the axes scales.
2) Select the Straight (1 to 1) radio button to create a 1 to 1 link in which both axes share the scale of the parent layer.
3) Select the Custom radio button to create a mathematical relationship between the axes’ scales. Specify the relationship between the axes’ scales in the X1= and X2= (or Y1= and Y2=) text boxes. These variables specify the “From” and “To” values for the axes of the child layer. The expression you type in the text box provides the initial and final scale values for the child layer in terms of the parent layer.
Creating a Custom Link Between Temperature Scales The custom link option on the Link Axes Scales tab of the child layer's Plot Details dialog box is particularly useful if you want to display the same data plot on two scales, such as Celsius and Fahrenheit.
1) Create the following worksheet.
2) Highlight the B(Y) column and click the Scatter button on the 2D Graphs toolbar.
3) Double-click on the X axis title to open the associated Text Control dialog box. In the center text box, type Centigrade. Click OK to close the dialog box.
4) Select Tools:Layer to open the Layer tool. Click on the Add tab. Click the Linked Top X button to add a linked layer (2) displaying a top X axis.
Chapter 9: Plotting: Graph Layers
Merging Existing Graph Windows • 263
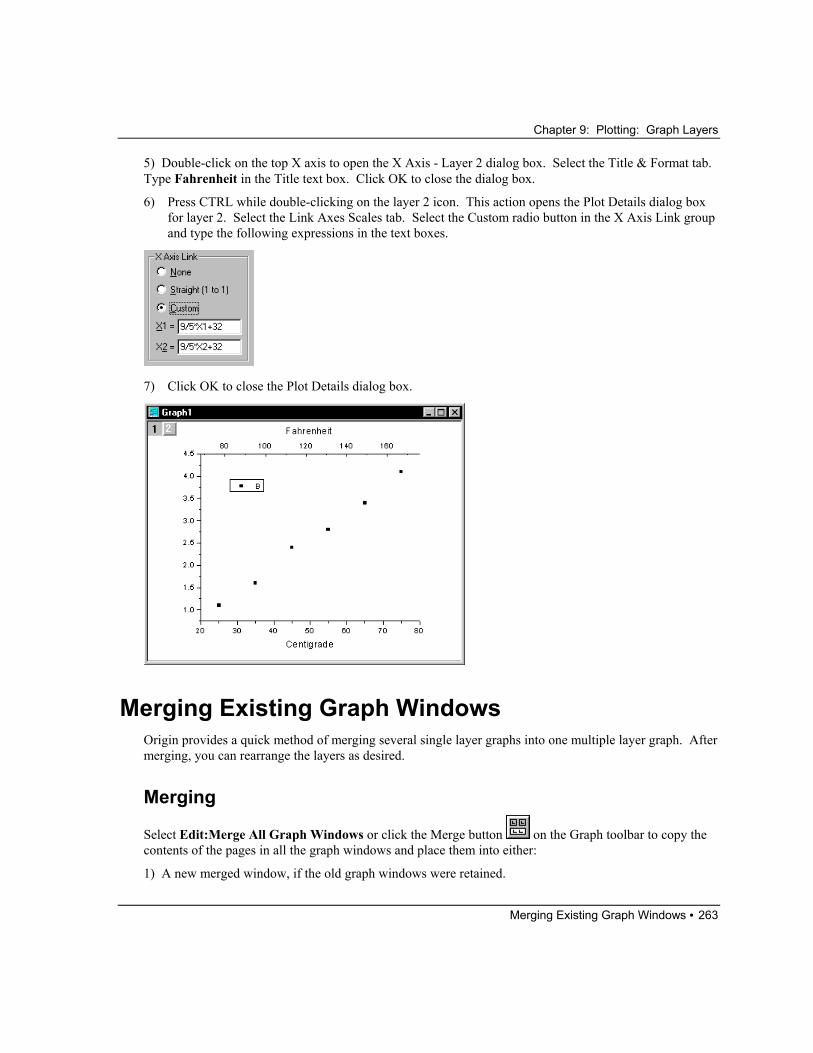
5) Double-click on the top X axis to open the X Axis - Layer 2 dialog box. Select the Title & Format tab. Type Fahrenheit in the Title text box. Click OK to close the dialog box.
6) Press CTRL while double-clicking on the layer 2 icon. This action opens the Plot Details dialog box for layer 2. Select the Link Axes Scales tab. Select the Custom radio button in the X Axis Link group and type the following expressions in the text boxes.
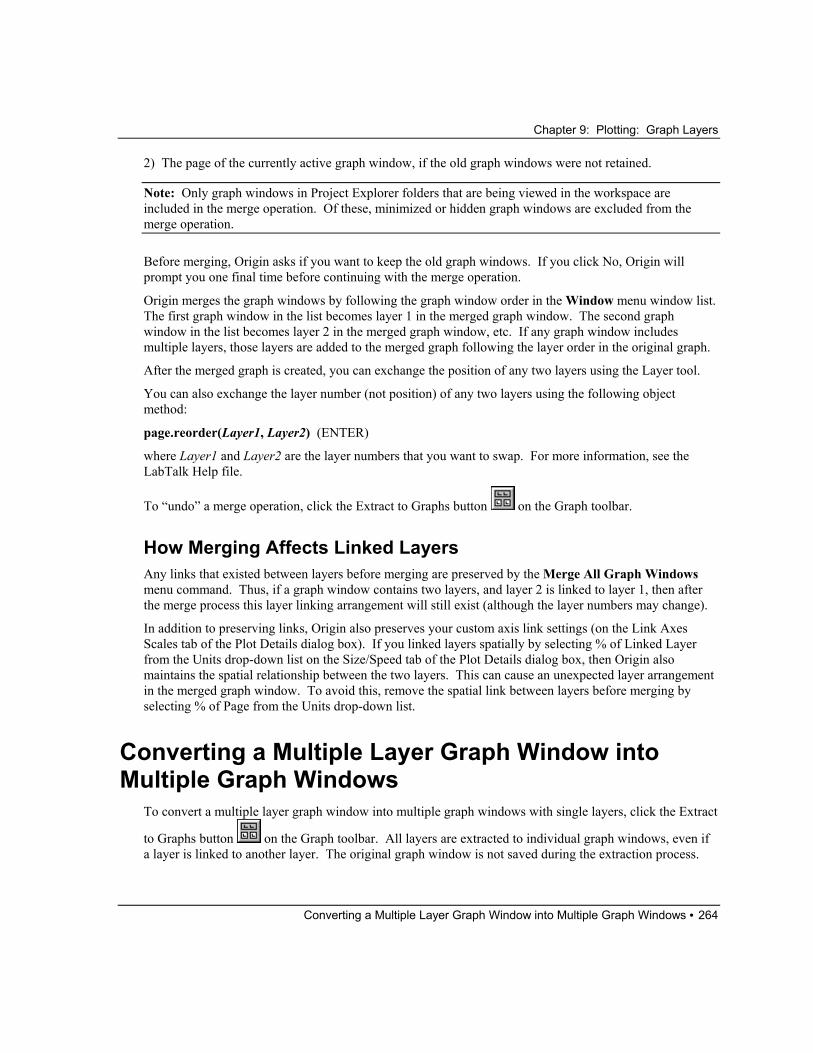
7) Click OK to close the Plot Details dialog box.
Merging Existing Graph Windows Origin provides a quick method of merging several single layer graphs into one multiple layer graph. After merging, you can rearrange the layers as desired.
Merging
Select Edit:Merge All Graph Windows or click the Merge button on the Graph toolbar to copy the contents of the pages in all the graph windows and place them into either:
1) A new merged window, if the old graph windows were retained.
Chapter 9: Plotting: Graph Layers
Converting a Multiple Layer Graph Window into Multiple Graph Windows • 264
2) The page of the currently active graph window, if the old graph windows were not retained.
Note: Only graph windows in Project Explorer folders that are being viewed in the workspace are included in the merge operation. Of these, minimized or hidden graph windows are excluded from the merge operation.
Before merging, Origin asks if you want to keep the old graph windows. If you click No, Origin will prompt you one final time before continuing with the merge operation.
Origin merges the graph windows by following the graph window order in the Window menu window list. The first graph window in the list becomes layer 1 in the merged graph window. The second graph window in the list becomes layer 2 in the merged graph window, etc. If any graph window includes multiple layers, those layers are added to the merged graph following the layer order in the original graph.
After the merged graph is created, you can exchange the position of any two layers using the Layer tool.
You can also exchange the layer number (not position) of any two layers using the following object method:
page.reorder(Layer1, Layer2) (ENTER)
where Layer1 and Layer2 are the layer numbers that you want to swap. For more information, see the LabTalk Help file.
To “undo” a merge operation, click the Extract to Graphs button on the Graph toolbar.
How Merging Affects Linked Layers Any links that existed between layers before merging are preserved by the Merge All Graph Windows menu command. Thus, if a graph window contains two layers, and layer 2 is linked to layer 1, then after the merge process this layer linking arrangement will still exist (although the layer numbers may change).
In addition to preserving links, Origin also preserves your custom axis link settings (on the Link Axes Scales tab of the Plot Details dialog box). If you linked layers spatially by selecting % of Linked Layer from the Units drop-down list on the Size/Speed tab of the Plot Details dialog box, then Origin also maintains the spatial relationship between the two layers. This can cause an unexpected layer arrangement in the merged graph window. To avoid this, remove the spatial link between layers before merging by selecting % of Page from the Units drop-down list.
Converting a Multiple Layer Graph Window into Multiple Graph Windows
To convert a multiple layer graph window into multiple graph windows with single layers, click the Extract
to Graphs button on the Graph toolbar. All layers are extracted to individual graph windows, even if a layer is linked to another layer. The original graph window is not saved during the extraction process.
Chapter 9: Plotting: Graph Layers
Arranging Layers on the Page • 265
Arranging Layers on the Page Origin provides tools to arrange the layers in your multiple layer graph. Multiple layers can be arranged in a grid, or they can be positioned and sized using custom measurements.
Using the Add & Arrange Layers Menu Command To arrange layers on the page, select Edit:Add & Arrange Layers. This menu command opens the Total Number of Layers dialog box, prompting you for the number of rows and columns you want to include in the page layout. Select the dimensions of the layer arrangement and click OK. This action opens the Spacings in % of Page Dimension dialog box, prompting you for spacing information. If you are unsure of the desired spacing, leave the settings at the default values. If needed, re-select the Add & Arrange Layers menu command to adjust the spacing.
When you select the Add & Arrange Layers menu command, Origin requires that you specify a “complete” layer arrangement. Therefore, if you specify a three by four arrangement and only have 11 layers, Origin will request permission to create an additional layer. If you decline, Origin arranges the existing layers. All layers are necessarily the same size after the arrangement process. If you require layers of non-uniform size or spacing, size the desired layers on the Size/Speed tab of the layer's Plot Details dialog box.
Note: If you have any child layers that are spatially linked to a parent layer (% of Linked Layer is selected from the Units drop-down list on the Size/Speed tab of the child layer's Plot Details dialog box), then Origin maintains the parent/child relationship during layer arrangement. For example, if your graph window contains five layers and layer 2 is a linked right Y axis of layer 1, then when you select Edit:Add & Arrange Layers and specify a two column by two row arrangement, Origin will arrange the layers such that layer 2 maintains its right Y position with layer 1.
Exchanging Layer Positions with the Layer Tool You can exchange the physical location of any two layers on your graph using the Swap Layers A and B button on the Arrange tab of the Layer tool (Tools:Layer). First specify the two layers whose locations you want to exchange in the A and B text boxes. Then click the button to exchange their locations. Note that the layers maintain their original layer numbers.
If one or both of the layers is spatially linked to a parent layer (% of Linked Layer is selected from the Units drop-down list on the Size/Speed tab of the Plot Details dialog box), Origin will still exchange the layer locations. However, Origin will update the Layer Area group on the Size/Speed tab of the linked layer's Plot Details dialog box with the new location.
If one or both of the layers is a parent layer, Origin will still exchange the layer locations. However, for each child layer of the parent, Origin will change the selection from the Units drop-down list on the Size/Speed tab of the child layer's Plot Details dialog box from % of Linked Layer to % of Page.
Chapter 9: Plotting: Graph Layers
Arranging Layers on the Page • 266
Overlaying Layers with the Layer Tool You can select and move a layer so that it completely overlays in the same position as another layer. To do this open the Layer tool (Tools:Layer) and select the Arrange tab. Type the layer number that you want to move in the A text box. Type the layer number that you want layer "A" to move to in the B text box. Click the Move Layer A to B button to move layer "A" to the position of layer "B." If necessary, Origin will resize layer "A" so that it is the same size as layer "B."
Note: The layer with the higher layer number always displays as the top layer.
Arranging Layers with the Layer Tool Use the Layer tool to arrange layers on the page of the active graph window. Select Tools:Layer to open the Layer tool. Select the Arrange tab to access the layer arrangement controls.
Note: In the following button descriptions, if you have any child layers that are spatially linked to a parent layer (% of Linked Layer is selected from the Units drop-down list on the Size/Speed tab of the child layer's Plot Details dialog box), then Origin maintains the parent/child relationship during layer arrangement. For example, if your graph window contains five layers and layer 2 is a linked right Y axis of layer 1, then when you click one of the following buttons, Origin will arrange the layers such that layer 2 maintains its right Y position with layer 1.
1) To arrange the layers in the active graph window in a column, click the Single Column button . To modify the gap between layers, edit the value in the associated text box and click again on the Single Column button.
2) To arrange the layers in the active graph window in a row, click the Single Row button . To modify the gap between layers, edit the value in the associated text box and click again on the Single Row button.
3) To arrange the layers in the active graph window into an array, click the Array button . The dimensions of the array are determined by the values in the associated Columns and Rows text boxes. To alter the array dimensions, edit the values in the associated text boxes and click again on the Array button.
If the Add New Layers check box is selected, Origin adds the required layers to complete the array. The size of the existing layers are reduced to accommodate the new layers in the page.
If the Add New Layers check box is cleared, Origin configures the page for the specified number of rows and columns. However, no new layers are created. The size of the existing layers are reduced to accommodate potential layers.
For each of these buttons, Origin uses the text box values in the Margins group to set the page margins.
Arranging Layers using the Layer's Plot Details Dialog Box You can arrange multiple layers in your graph by explicitly specifying the size and location for each layer. Layer dimensions are specified on the Size/Speed tab of the Plot Details dialog box when the layer icon is
Chapter 9: Plotting: Graph Layers
The Layer Tool • 267
selected on the left side of the dialog box. To open the layer's Plot Details dialog box, click on the desired layer to make it active and select Format:Layer.
The layer frame is the bounding box that defines the size and shape of the layer. Type values for the width, height and offsets for the layer in the associated text boxes of the Layer Area group. Select the desired units used to measure the frame from the Units drop-down list.
Manually Positioning Layers on the Page To move a layer, first select the layer by clicking on an axis to generate a highlighted boundary. Then click anywhere within the layer and drag to a new location within the page. Click outside of the layer, but within the graph window, to fix the new location.
To facilitate positioning of the layer in the page, Origin provides an axis grid. You can use the axis grid to aid in manually positioning axes on the page of the active graph window. To display the axis grid, select View:Show:Axis Grid. Select the layer you want to move by clicking on the axis to generate a highlighted boundary. Move the axis using the grid lines as a guide. To ensure that the layer's axes position on a grid line, select Format:Snap Axes to Grid. This menu command is checked when selected.
To control the spacing of the axis grid, select Tools:Options to open the Options dialog box. Select the Page tab and type or select the desired value (in pixels) from the Axis combination box.
Note: If a layer extends outside of the page (for example, after manually arranging layers), right-click outside of the graph page and select Fit Page to Layers to resize the graph page to include all the layers. (This shortcut menu command is only available if a layer extends beyond the graph page.)
The Layer Tool The Layer tool provides easy access to layer procedures including the following:
1) Adding layers to the active graph window.
2) Specifying the axes scale type for added layers.
3) Arranging layers on the page.
4) Specifying the page dimensions.
5) Swapping the page location of two layers.
Chapter 9: Plotting: Graph Layers
The Layer Tool • 268
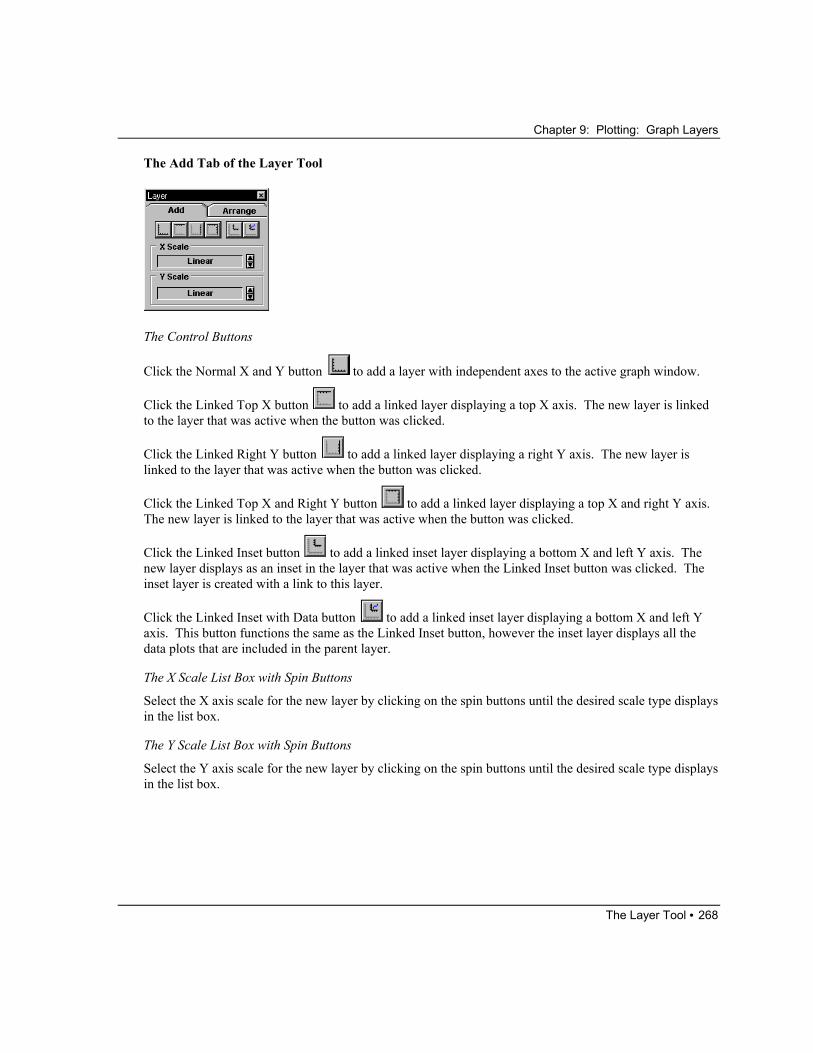
The Add Tab of the Layer Tool
The Control Buttons
Click the Normal X and Y button to add a layer with independent axes to the active graph window.
Click the Linked Top X button to add a linked layer displaying a top X axis. The new layer is linked to the layer that was active when the button was clicked.
Click the Linked Right Y button to add a linked layer displaying a right Y axis. The new layer is linked to the layer that was active when the button was clicked.
Click the Linked Top X and Right Y button to add a linked layer displaying a top X and right Y axis. The new layer is linked to the layer that was active when the button was clicked.
Click the Linked Inset button to add a linked inset layer displaying a bottom X and left Y axis. The new layer displays as an inset in the layer that was active when the Linked Inset button was clicked. The inset layer is created with a link to this layer.
Click the Linked Inset with Data button to add a linked inset layer displaying a bottom X and left Y axis. This button functions the same as the Linked Inset button, however the inset layer displays all the data plots that are included in the parent layer.
The X Scale List Box with Spin Buttons
Select the X axis scale for the new layer by clicking on the spin buttons until the desired scale type displays in the list box.
The Y Scale List Box with Spin Buttons
Select the Y axis scale for the new layer by clicking on the spin buttons until the desired scale type displays in the list box.
Chapter 9: Plotting: Graph Layers
The Layer Tool • 269
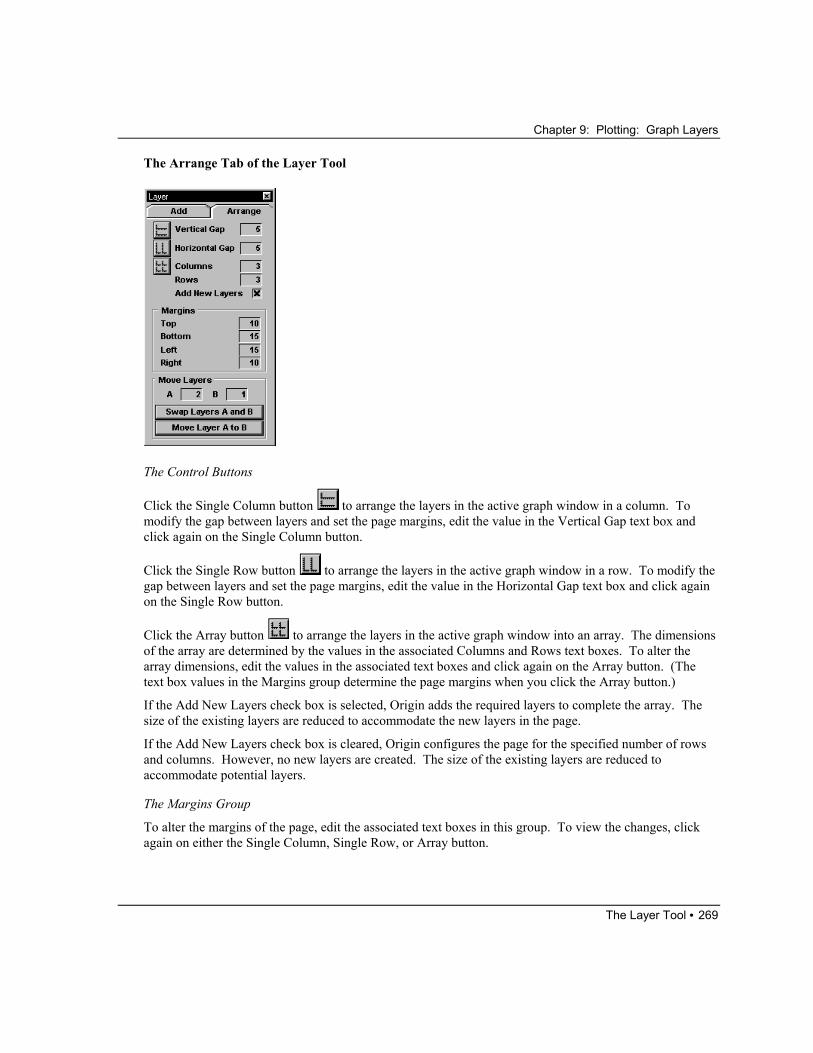
The Arrange Tab of the Layer Tool
The Control Buttons
Click the Single Column button to arrange the layers in the active graph window in a column. To modify the gap between layers and set the page margins, edit the value in the Vertical Gap text box and click again on the Single Column button.
Click the Single Row button to arrange the layers in the active graph window in a row. To modify the gap between layers and set the page margins, edit the value in the Horizontal Gap text box and click again on the Single Row button.
Click the Array button to arrange the layers in the active graph window into an array. The dimensions of the array are determined by the values in the associated Columns and Rows text boxes. To alter the array dimensions, edit the values in the associated text boxes and click again on the Array button. (The text box values in the Margins group determine the page margins when you click the Array button.)
If the Add New Layers check box is selected, Origin adds the required layers to complete the array. The size of the existing layers are reduced to accommodate the new layers in the page.
If the Add New Layers check box is cleared, Origin configures the page for the specified number of rows and columns. However, no new layers are created. The size of the existing layers are reduced to accommodate potential layers.
The Margins Group
To alter the margins of the page, edit the associated text boxes in this group. To view the changes, click again on either the Single Column, Single Row, or Array button.
Chapter 9: Plotting: Graph Layers
The Layer Tool • 270
The Move Layers Group
To exchange the physical location of any two layers on your graph, specify the layers in the A and B text boxes and then click the Swap Layers A and B button.
To move a layer so that it displays in the same position (and size) as another layer, specify the layers in the A and B text boxes and then click the Move Layer A to B button.