chapter 9 multicollinearity - iit...
TRANSCRIPT
Regression Analysis | Chapter 9 | Multicollinearity | Shalabh, IIT Kanpur 1 1 1
Chapter 9
Multicollinearity A basic assumption is multiple linear regression model is that the rank of the matrix of observations on
explanatory variables is same as the number of explanatory variables. In other words, such matrix is of
full column rank. This in turn implies that all the explanatory variables are independent, i.e., there is no
linear relationship among the explanatory variables. It is termed that the explanatory variables are
orthogonal.
In many situations in practice, the explanatory variables may not remain independent due to various
reasons. The situation where the explanatory variables are highly intercorrelated is referred to as
multicollinearity.
Consider the multiple regression model
2
11, ~ (0, )
n k nky X N Iβ ε ε σ
× ××= +
with k explanatory variables 1 2, ,..., kX X X with usual assumptions including Rank ( ) .X k=
Assume the observations on all 'iX s and 'iy s are centered and scaled to unit length. So
- 'X X becomes a k k× matrix of correlation coefficients between the explanatory variables and
- 'X y becomes a 1k × vector of correlation coefficients between explanatory and study variables.
Let [ ]1 2, ,..., kX X X X= where jX is the thj column of X denoting the n observations on .jX The
column vectors 1 2, ,..., kX X X are linearly dependent if there exists a set of constants 1 2, ,..., ,k not all
zero, such that
1
0.k
j jj
X=
=∑
If this holds exactly for a subset of the 1 2, ,..., kX X X , then rank ( ' ) .X X k< Consequently 1( ' )X X − does
not exist. If the condition 1
0k
j jj
X=
=∑ is approximately true for some subset of 1 2, ,..., kX X X , then there
will be a near-linear dependency in ' .X X In such a case, the multicollinearity problem exists. It is also
said that 'X X becomes ill-conditioned.
Regression Analysis | Chapter 9 | Multicollinearity | Shalabh, IIT Kanpur 2 2 2
Source of multicollinearity:
1. Method of data collection: It is expected that the data is collected over the whole cross-section of variables. It may happen that the
data is collected over a subspace of the explanatory variables where the variables are linearly dependent.
For example, sampling is done only over a limited range of explanatory variables in the population.
2. Model and population constraints There may exists some constraints on the model or on the population from where the sample is drawn. The
sample may be generated from that part of population having linear combinations.
3. Existence of identities or definitional relationships: There may exist some relationships among the variables which may be due to the definition of variables
or any identity relation among them. For example, if data is collected on the variables like income, saving
and expenditure, then income = saving + expenditure. Such relationship will not change even when the
sample size increases.
4. Imprecise formulation of model The formulation of the model may unnecessarily be complicated. For example, the quadratic (or
polynomial) terms or cross product terms may appear as explanatory variables. For example, let there be
3 variables 1 2,X X and 3X , so 3.k = Suppose their cross-product terms 1 2 2 3,X X X X and 1 3X X are also
added. Then k rises to 6.
5. An over-determined model Sometimes, due to over enthusiasm, large number of variables are included in the model to make it more
realistic and consequently the number of observations ( )n becomes smaller than the number of
explanatory variables ( )k . Such situation can arise in medical research where the number of patients may
be small but information is collected on a large number of variables. In another example, if there is time
series data for 50 years on consumption pattern, then it is expected that the consumption pattern does not
remain same for 50 years. So better option is to choose smaller number of variables and hence it results
into .n k<
Regression Analysis | Chapter 9 | Multicollinearity | Shalabh, IIT Kanpur 3 3 3
Consequences of multicollinearity To illustrate the consequences of presence of multicollinearity, consider a model
21 1 2 2 , ( ) 0, ( )y x x E V Iβ β ε ε ε σ= + + = =
where 1 2,x x and y are scaled to length unity.
The normal equation ( ' ) 'X X b X y= in this model becomes
11
22
11
y
y
rbrrbr
=
where r is the correlation coefficient between 1x and 2x ; jyr is the correlation coefficient between jx and
( 1,2)y j = and ( )1 2, 'b b b= is the OLSE of β .
( ) 12
1 21 2
2 12 2
11'11
1
.1
y y
y y
rX X
rrr r r
br
r r rb
r
− − = −− −
⇒ =−−
=−
So the covariance matrix is 2 1( ) ( ' )V b X Xσ −=
2
1 2 2
2
1 2 2
( ) ( )1
( , ) .1
Var b Var br
rCov b br
σ
σ
⇒ = =−
= −−
If 1x and 2x are uncorrelated, then 0r = and
1 0
'0 1
X X =
rank ( ' ) 2.X X =
If 1x and 2x are perfectly correlated, then 1r = ± and rank ( ' ) 1.X X =
If 1,r →± then 1 2( ) ( )Var b Var b= →∞ .
So if variables are perfectly collinear, the variance of OLSEs becomes large. This indicates highly
unreliable estimates and this is an inadmissible situation.
Regression Analysis | Chapter 9 | Multicollinearity | Shalabh, IIT Kanpur 4 4 4
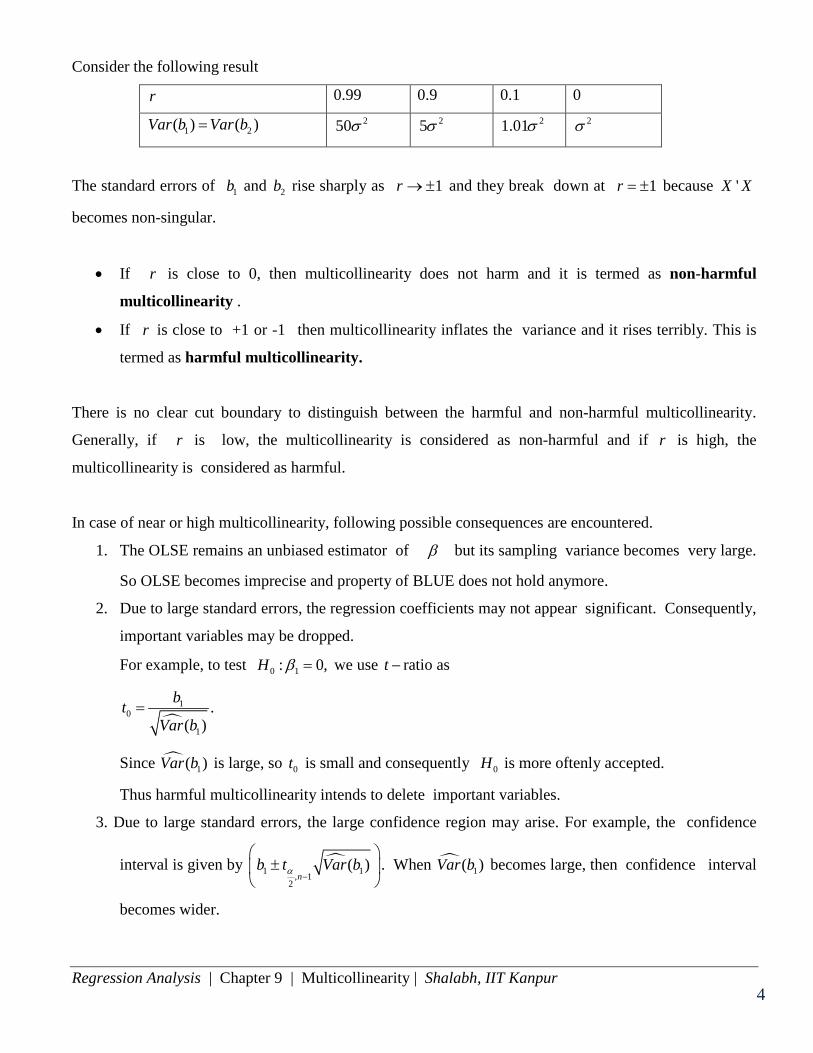
Consider the following result
r 0.99 0.9 0.1 0
1 2( ) ( )Var b Var b= 250σ 25σ 21.01σ 2σ
The standard errors of 1b and 2b rise sharply as 1r →± and they break down at 1r = ± because 'X X
becomes non-singular.
• If r is close to 0, then multicollinearity does not harm and it is termed as non-harmful
multicollinearity .
• If r is close to +1 or -1 then multicollinearity inflates the variance and it rises terribly. This is
termed as harmful multicollinearity.
There is no clear cut boundary to distinguish between the harmful and non-harmful multicollinearity.
Generally, if r is low, the multicollinearity is considered as non-harmful and if r is high, the
multicollinearity is considered as harmful.
In case of near or high multicollinearity, following possible consequences are encountered.
1. The OLSE remains an unbiased estimator of β but its sampling variance becomes very large.
So OLSE becomes imprecise and property of BLUE does not hold anymore.
2. Due to large standard errors, the regression coefficients may not appear significant. Consequently,
important variables may be dropped.
For example, to test 0 1: 0,H β = we use t − ratio as
10
1
.( )
btVar b
=
Since 1( )Var b is large, so 0t is small and consequently 0H is more oftenly accepted.
Thus harmful multicollinearity intends to delete important variables.
3. Due to large standard errors, the large confidence region may arise. For example, the confidence
interval is given by
1 1, 12
( )n
b t Var bα−
±
. When 1( )Var b becomes large, then confidence interval
becomes wider.
Regression Analysis | Chapter 9 | Multicollinearity | Shalabh, IIT Kanpur 5 5 5
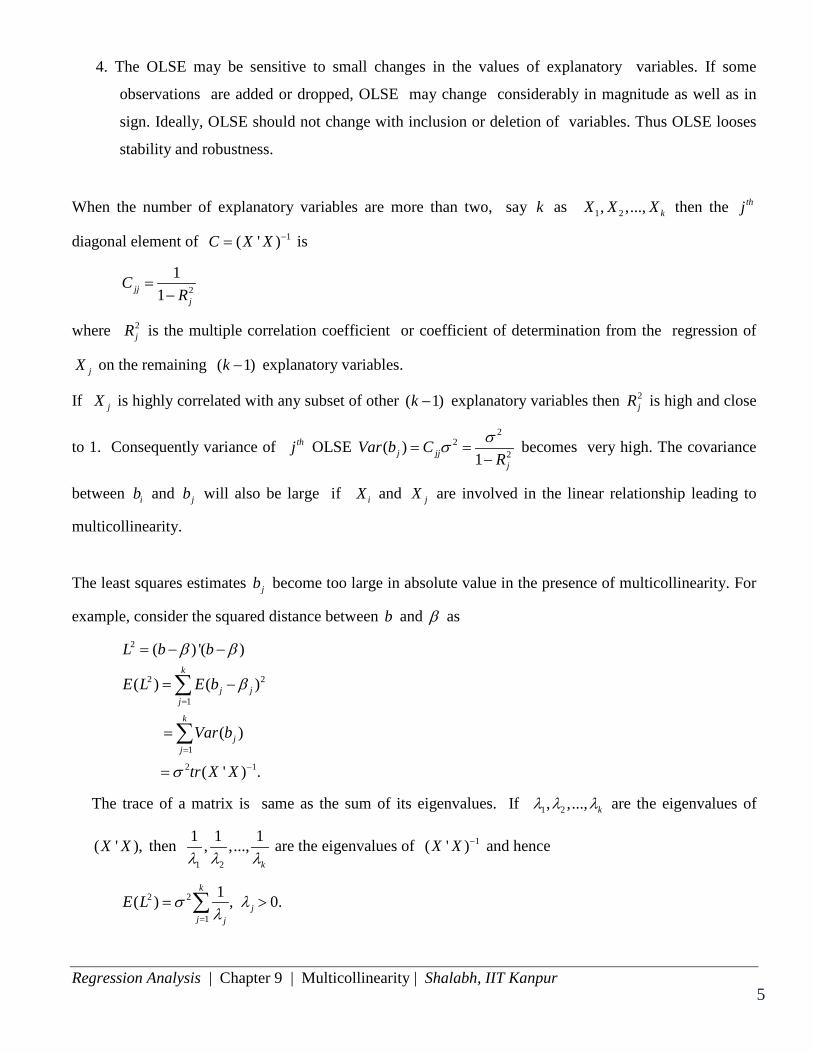
4. The OLSE may be sensitive to small changes in the values of explanatory variables. If some
observations are added or dropped, OLSE may change considerably in magnitude as well as in
sign. Ideally, OLSE should not change with inclusion or deletion of variables. Thus OLSE looses
stability and robustness.
When the number of explanatory variables are more than two, say k as 1 2, ,..., kX X X then the thj
diagonal element of 1( ' )C X X −= is
2
11jj
j
CR
=−
where 2jR is the multiple correlation coefficient or coefficient of determination from the regression of
jX on the remaining ( 1)k − explanatory variables.
If jX is highly correlated with any subset of other ( 1)k − explanatory variables then 2jR is high and close
to 1. Consequently variance of thj OLSE 2
22( )
1j jjj
Var b CR
σσ= =−
becomes very high. The covariance
between ib and jb will also be large if iX and jX are involved in the linear relationship leading to
multicollinearity.
The least squares estimates jb become too large in absolute value in the presence of multicollinearity. For
example, consider the squared distance between b and β as
2
2 2
1
1
2 1
( ) '( )
( ) ( )
( )
( ' ) .
k
j jj
k
jj
L b b
E L E b
Var b
tr X X
β β
β
σ
=
=
−
= − −
= −
=
=
∑
∑
The trace of a matrix is same as the sum of its eigenvalues. If 1 2, ,..., kλ λ λ are the eigenvalues of
( ' ),X X then 1 2
1 1 1, ,...,kλ λ λ
are the eigenvalues of 1( ' )X X − and hence
2 2
1
1( ) , 0.k
jj j
E L σ λλ=
= >∑

Regression Analysis | Chapter 9 | Multicollinearity | Shalabh, IIT Kanpur 6 6 6
If ( ' )X X is ill-conditioned due to the presence of multicollinearity then at least one of the eigenvalue
will be small . So the distance between b and β may also be large. Thus
2
2 1
2 1
( ) ( ) '( )( ' ) ( ' 2 ' ' )( ' ) ( ' ) '
E L E b btr X X E b b bE b b tr X X
β β
σ β β β
σ β β
−
−
= − −
= − +
⇒ = +
b⇒ is generally longer than β
⇒OLSE are too large in absolute value.
The least squares produces bad estimates of parameters in the presence of multicollinearity. This does
not imply that the fitted model produces bad predictions also. If the predictions are confined to x-space
with non-harmful multicollinearity, then predictions are satisfactory.
Multicollinearity diagnostics An important question arises that how to diagnose the presence of multicollinearity in the data on the basis
of given sample information. Several diagnostic measures are available and each of them is based on a
particular approach. It is difficult to say that which of the diagnostic is best or ultimate. Some of the
popular and important diagnostics are described further. The detection of multicollinearity involves 3
aspects:
(i) Determining its presence.
(ii) Determining its severity.
(iii) Determining its form or location.
1. Determinant of ( )' 'X X X X
This measure is based on the fact that the matrix 'X X becomes ill conditioned in the presence of
multicollinearity. The value of determinant of ' ,X X i.e., 'X X declines as degree of multicollinearity
increases.
If Rank ( ' )X X k< then 'X X will be singular and so ' 0.X X = So as ' 0X X → , the degree of
multicollinearity increases and it becomes exact or perfect at ' 0.X X = Thus 'X X serves as a measure
of multicollinearity and 'X X =0 indicates that perfect multicollinearity exists.

Regression Analysis | Chapter 9 | Multicollinearity | Shalabh, IIT Kanpur 7 7 7
Limitations: This measure has following limitations
(i) It is not bounded as 0 ' .X X< < ∞
(ii) It is affected by dispersion of explanatory variables. For example, if 2,k = then
21 1 2
1 1
22 1 2
1 1
'
n n
i i ii i
n n
i i ii i
x x xX X
x x x
= =
= =
=∑ ∑
∑ ∑
( )2 2 21 2 12
1 11
n n
i ii i
x x r= =
= − ∑ ∑
where 12r is the correlation coefficient between 1 2andx x . So 'X X depends on correlation
coefficient and variability of explanatory variable. If explanatory variables have very low
variability, then 'X X may tend to zero which will indicate the presence of multicollinearity
and which is not the case so.
(iii) It gives no idea about the relative effects on individual coefficients. If multicollinearity is
present, then it will not indicate that which variable in 'X X is causing multicollinearity and
is hard to determine.
2. Inspection of correlation matrix The inspection of off-diagonal elements ijr in 'X X gives an idea about the presence of multicollinearity.
If iX and jX are nearly linearly dependent then ijr will be close to 1. Note that the observations in X
are standardized in the sense that each observation is subtracted from mean of that variable and divided by
the square root of corrected sum of squares of that variable.
When more than two explanatory variables are considered and if they are involved in near-linear
dependency, then it is not necessary that any of the ijr will be large. Generally, pairwise inspection of
correlation coefficients is not sufficient for detecting multicollinearity in the data.
Regression Analysis | Chapter 9 | Multicollinearity | Shalabh, IIT Kanpur 8 8 8
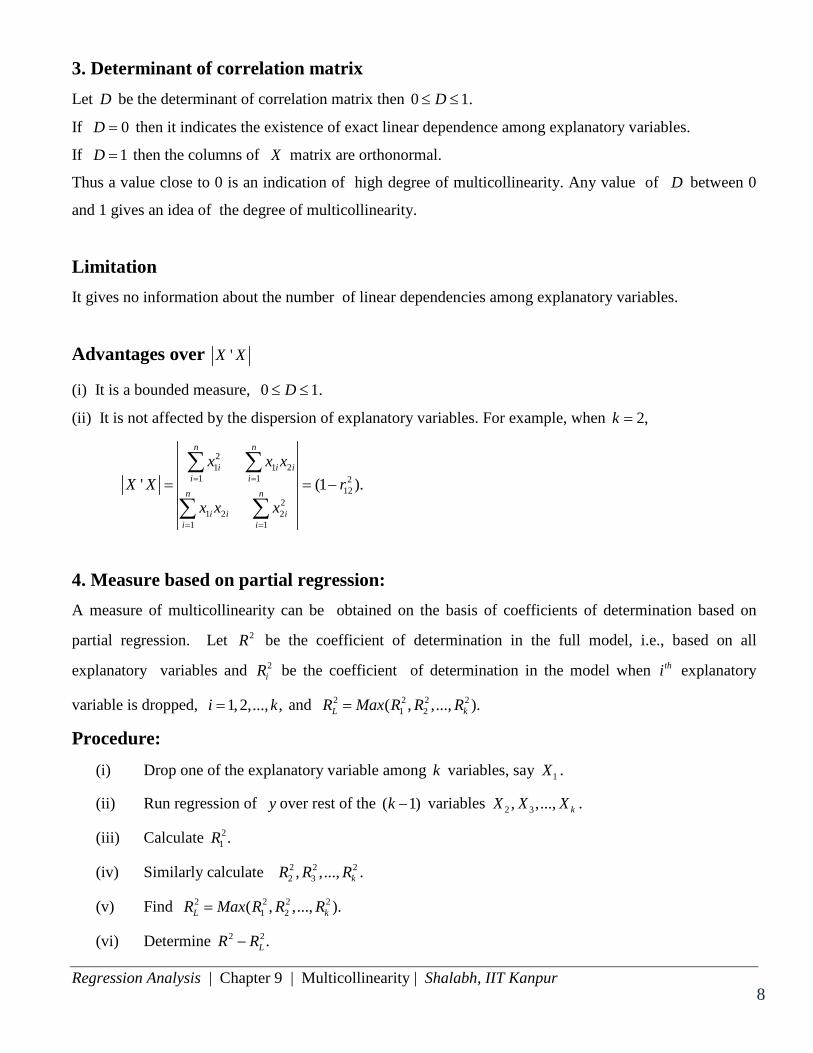
3. Determinant of correlation matrix Let D be the determinant of correlation matrix then 0 1.D≤ ≤
If 0D = then it indicates the existence of exact linear dependence among explanatory variables.
If 1D = then the columns of X matrix are orthonormal.
Thus a value close to 0 is an indication of high degree of multicollinearity. Any value of D between 0
and 1 gives an idea of the degree of multicollinearity.
Limitation It gives no information about the number of linear dependencies among explanatory variables.
Advantages over 'X X
(i) It is a bounded measure, 0 1.D≤ ≤
(ii) It is not affected by the dispersion of explanatory variables. For example, when 2,k =
21 1 2
1 1 212
21 2 2
1 1
' (1 ).
n n
i i ii i
n n
i i ii i
x x xX X r
x x x
= =
= =
= = −∑ ∑
∑ ∑
4. Measure based on partial regression: A measure of multicollinearity can be obtained on the basis of coefficients of determination based on
partial regression. Let 2R be the coefficient of determination in the full model, i.e., based on all
explanatory variables and 2iR be the coefficient of determination in the model when thi explanatory
variable is dropped, 1, 2,..., ,i k= and 2 2 2 21 2( , ,..., ).L kR Max R R R=
Procedure: (i) Drop one of the explanatory variable among k variables, say 1X .
(ii) Run regression of y over rest of the ( 1)k − variables 2 3, ,..., kX X X .
(iii) Calculate 21 .R
(iv) Similarly calculate 2 2 22 3, ,..., kR R R .
(v) Find 2 2 2 21 2( , ,..., ).L kR Max R R R=
(vi) Determine 2 2.LR R−
Regression Analysis | Chapter 9 | Multicollinearity | Shalabh, IIT Kanpur 9 9 9
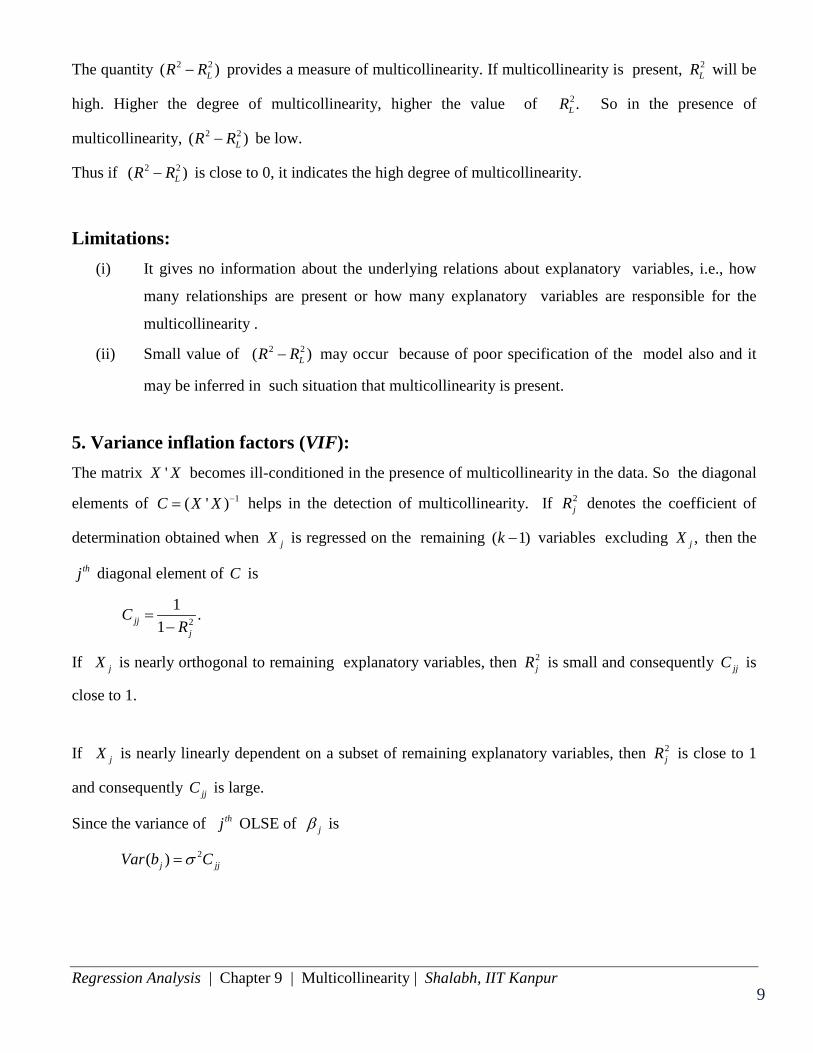
The quantity 2 2( )LR R− provides a measure of multicollinearity. If multicollinearity is present, 2LR will be
high. Higher the degree of multicollinearity, higher the value of 2.LR So in the presence of
multicollinearity, 2 2( )LR R− be low.
Thus if 2 2( )LR R− is close to 0, it indicates the high degree of multicollinearity.
Limitations: (i) It gives no information about the underlying relations about explanatory variables, i.e., how
many relationships are present or how many explanatory variables are responsible for the
multicollinearity .
(ii) Small value of 2 2( )LR R− may occur because of poor specification of the model also and it
may be inferred in such situation that multicollinearity is present.
5. Variance inflation factors (VIF): The matrix 'X X becomes ill-conditioned in the presence of multicollinearity in the data. So the diagonal
elements of 1( ' )C X X −= helps in the detection of multicollinearity. If 2jR denotes the coefficient of
determination obtained when jX is regressed on the remaining ( 1)k − variables excluding ,jX then the
thj diagonal element of C is
2
1 .1jj
j
CR
=−
If jX is nearly orthogonal to remaining explanatory variables, then 2jR is small and consequently jjC is
close to 1.
If jX is nearly linearly dependent on a subset of remaining explanatory variables, then 2jR is close to 1
and consequently jjC is large.
Since the variance of thj OLSE of jβ is
2( )j jjVar b Cσ=
Regression Analysis | Chapter 9 | Multicollinearity | Shalabh, IIT Kanpur 10 10 10
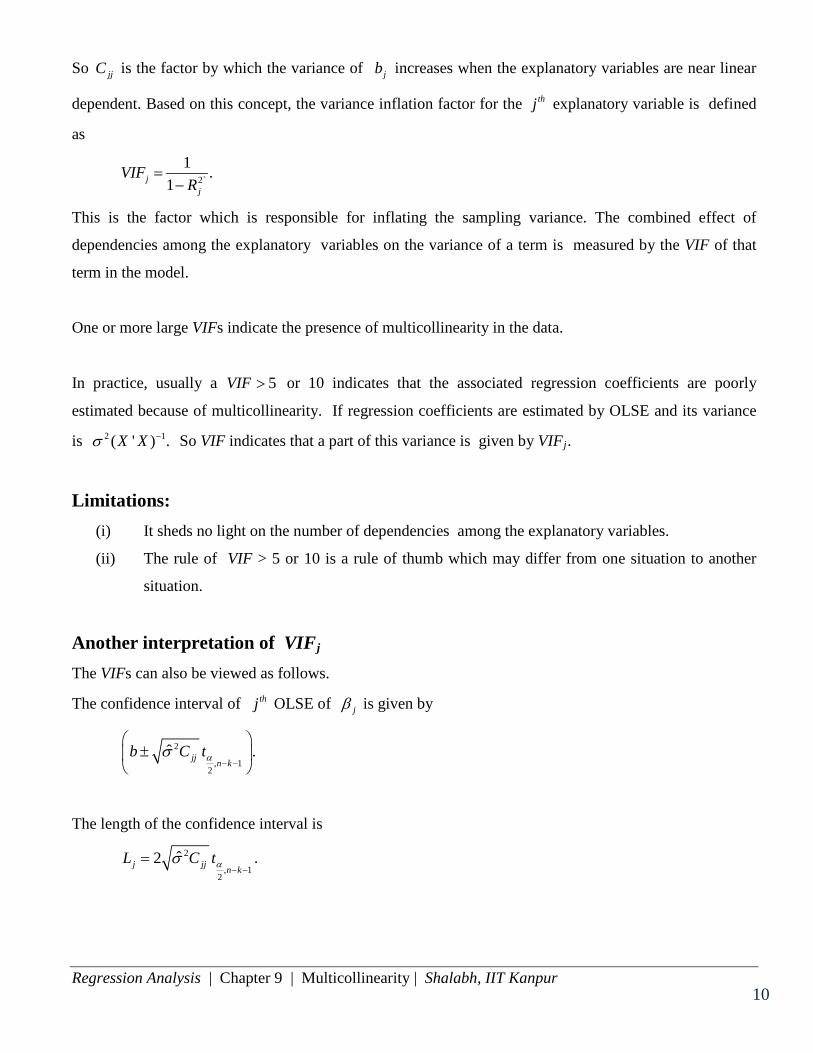
So jjC is the factor by which the variance of jb increases when the explanatory variables are near linear
dependent. Based on this concept, the variance inflation factor for the thj explanatory variable is defined
as
2`
1 .1j
j
VIFR
=−
This is the factor which is responsible for inflating the sampling variance. The combined effect of
dependencies among the explanatory variables on the variance of a term is measured by the VIF of that
term in the model.
One or more large VIFs indicate the presence of multicollinearity in the data.
In practice, usually a 5VIF > or 10 indicates that the associated regression coefficients are poorly
estimated because of multicollinearity. If regression coefficients are estimated by OLSE and its variance
is 2 1( ' ) .X Xσ − So VIF indicates that a part of this variance is given by VIFj.
Limitations: (i) It sheds no light on the number of dependencies among the explanatory variables.
(ii) The rule of VIF > 5 or 10 is a rule of thumb which may differ from one situation to another
situation.
Another interpretation of VIFj The VIFs can also be viewed as follows.
The confidence interval of thj OLSE of jβ is given by
2
, 12
ˆ .jj n kb C tασ
− −
±
The length of the confidence interval is
2
, 12
ˆ2j jj n kL C tασ
− −= .
Regression Analysis | Chapter 9 | Multicollinearity | Shalabh, IIT Kanpur 11 11 11
Now consider a situation where X is an orthogonal matrix, i.e., 'X X I= so that 1,jjC = sample size is
same as earlier and same root mean squares 2
1
1 ( )n
ij ji
x xn =
− ∑ , then the length of confidence interval
becomes
, 1
2
ˆ* 2 .n k
L tασ− −
=
Consider the ratio
.*j
jj
LC
L=
Thus jVIF indicates the increase in the length of confidence interval of thj regression coefficient due
to the presence of multicollinearity.
6. Condition number and condition index: Let 1 2, ,..., kλ λ λ be the eigenvalues (or characteristic roots) of ' .X X Let
max 1 2
min 1 2
( , ,..., )( , ,..., ).
k
k
MaxMin
λ λ λ λλ λ λ λ
==
The condition number ( )CN is defined as
max
min
, 0CN CNλλ
= < <∞ .
The small values of characteristic roots indicates the presence of near-linear dependency in the data. The
CN provides a measure of spread in the spectrum of characteristic roots of ' .X X
The condition number provides a measure of multicollinearity.
• If 100,CN < then it is considered as non-harmful multicollinearity.
• If 100 1000,CN< < then it indicates that the multicollinearity is moderate to severe (or strong).
This range is referred to as danger level.
• If 1000,CN > then it indicates a severe (or strong) multicollinearity.
The condition number is based only or two eigenvalues: min maxandλ λ . Another measures are condition
indices which use information on other eigenvalues.
Regression Analysis | Chapter 9 | Multicollinearity | Shalabh, IIT Kanpur 12 12 12
The condition indices of 'X X are defined as
max , 1, 2,..., .jj
C j kλλ
= =
In fact, largest .jC CN=
The number of condition indices that are large, say more than 1000, indicate the number of near-linear
dependencies in ' .X X
A limitation of CN and jC is that they are unbounded measures as 0 CN< < ∞ , 0 jC< < ∞ .
7. Measure based on characteristic roots and proportion of variances: Let 1 2, ,.., kλ λ λ be the eigenvalues of 1 2' , ( , ,..., )kX X diag λ λ λΛ = is k k× matrix and V is a k k×
matrix constructed by the eigenvectors of ' .X X Obviously, V is an orthogonal matrix. Then 'X X can
be decomposed as ' 'X X V V= Λ . Let 1 2, ,..., kV V V be the column of V . If there is near-linear
dependency in the data, then jλ is close to zero and the nature of linear dependency in described by the
elements of associated eigenvector jV .
The covariance matrix of OLSE is
2 1
2 1
2 1
2 2 22 1 2
1 2
( ) ( ' )( ')
'
( ) ...i i iki
k
V b X XV V
V V
v v vVar b
σ
σ
σ
σλ λ λ
−
−
−
=
= Λ
= Λ
⇒ = + + +
where 1 2, ,...,i i ikv v v are the elements in .V
The condition indices are
max , 1, 2,..., .jj
C j kλλ
= =

Regression Analysis | Chapter 9 | Multicollinearity | Shalabh, IIT Kanpur 13 13 13
Procedure: (i) Find condition index 1 2, ,..., .kC C C
(ii) (a) Identify those 'i sλ for which jC is greater than the danger level 1000.
(b) This gives the number of linear dependencies.
(c) Don’t consider those 'jC s which are below the danger level.
(iii) For such ' sλ with condition index above the danger level, choose one such eigenvalue, say
.jλ
(iv) Find the value of proportion of variance corresponding to jλ in 1 2( ), ( ),..., ( )kVar b Var b Var b as
2 2
2
1
( / ) /
( / )
ij j ij jij k
jij j
j
v vp
VIF v
λ λ
λ=
= =
∑.
Note that 2ij
j
vλ
can be found from the expression
2 2 2
2 1 2
1 2
( ) ...i i iki
k
v v vVar b σλ λ λ
= + + +
i.e., corresponding to thj factor.
The proportion of variance ijp provides a measure of multicollinearity.
If 0.5,ijp > it indicates that ib is adversely affected by the multicollinearity, i.e., estimate of iβ is
influenced by the presence of multicollinearity.
It is a good diagnostic tool in the sense that it tells about the presence of harmful multicollinearity as well
as also indicates the number of linear dependencies responsible for multicollinearity. This diagnostic is
better than other diagnostics.
The condition indices are also defined by the singular value decomposition of X matrix as follows:
'X UDV=
where U is n k× matrix, V is k k× matrix, ' , ' , U U I V V I D= = is k k× matrix,
1 2( , ,..., )kD diag µ µ µ= and 1 2, ,..., kµ µ µ are the singular values of ,X V is a matrix whose columns are
Regression Analysis | Chapter 9 | Multicollinearity | Shalabh, IIT Kanpur 14 14 14
eigenvectors corresponding to eigenvalues of 'X X and U is a matrix whose columns are the
eigenvectors associated with the k nonzero eigenvalues of ' .X X
The condition indices of X matrix are defined as
max , 1, 2,...,jj
j kµηµ
= =
where max 1 2( , ,..., ).kMaxµ µ µ µ=
If 1 2, ,..., kλ λ λ are the eigenvalues of 'X X then
2' ( ') ' ' ' ',X X UDV UDV VD V V V= = = Λ
so 2 , 1, 2,..., .j j j kµ λ= =
Note that with 2 ,j jµ λ=
22
21
2
21
2 2
( )
( / ).
kji
ji i
kji
ji i
ij iij
j
vVar b
vVIF
vp
VIF
σµ
µ
µ
=
=
=
=
=
∑
∑
The ill-conditioning in X is reflected in the size of singular values. There will be one small singular
value for each non-linear dependency. The extent of ill conditioning is described by how small is jµ
relative to max .µ
It is suggested that the explanatory variables should be scaled to unit length but should not be centered
when computing ijp . This will helps in diagnosing the role of intercept term in near-linear dependence.
No unique guidance is available in literature on the issue of centering the explanatory variables. The
centering makes the intercept orthogonal to explanatory variables. So this may remove the ill conditioning
due to intercept term in the model.
Regression Analysis | Chapter 9 | Multicollinearity | Shalabh, IIT Kanpur 15 15 15
Remedies for multicollinearity: Various techniques have been proposed to deal with the problems resulting from the presence of
multicollinearity in the data.
1. Obtain more data
The harmful multicollinearity arises essentially because rank of 'X X falls below k and 'X X is close
to zero. Additional data may help in reducing the sampling variance of the estimates. The data need to be
collected such that it helps in breaking up the multicollinearity in the data.
It is always not possible to collect additional data to various reasons as follows.
• The experiment and process have finished and no longer available.
• The economic constrains may also not allow to collect the additional data.
• The additional data may not match with the earlier collected data and may be unusual.
• If the data is in time series, then longer time series may force to take ignore data that is too far in
the past.
• If multicollinearity is due to any identity or exact relationship, then increasing the sample size will
not help.
• Sometimes, it is not advisable to use the data even if it is available. For example, if the data on
consumption pattern is available for the years 1950-2010, then one may not like to use it as the
consumption pattern usually does not remains same for such a long period.
2. Drop some variables that are collinear: If possible, identify the variables which seems to causing multicollinearity. These collinear variables can
be dropped so as to match the condition of fall rank of X −matrix. The process of omitting the variables
way be carried out on the basis of some kind of ordering of explanatory variables, e.g., those variables
can be deleted first which have smaller value of t -ratio. In another example, suppose the experimenter is
not interested in all the parameters. In such cases, one can get the estimators of the parameters of interest
which have smaller mean squared errors them the variance of OLSE by dropping some variables.
If some variables are eliminated, then this may reduce the predictive power of the model. Sometimes there
is no assurance that how the model will exhibit less multicollinearity.
Regression Analysis | Chapter 9 | Multicollinearity | Shalabh, IIT Kanpur 16 16 16
3. Use some relevant prior information: One may search for some relevant prior information about the regression coefficients. This may lead to
specification of estimates of some coefficients. More general situation includes the specification of some
exact linear restrictions and stochastic linear restrictions. The procedures like restricted regression and
mixed regression can be used for this purpose. The relevance and correctness of information play an
important role in such analysis but it is difficult to ensure it in practice. For example, the estimates
derived in U.K. may not be valid in India.
4. Employ generalized inverse If rank ( ' )X X k< , then the generalized inverse can be used to find the inverse of 'X X . Then β can
be estimated by ˆ ( ' ) ' .X X X yβ −=
In such case, the estimates will not be unique except in the case of use of Moore-Penrose inverse of
( ' ).X X Different methods of finding generalized inverse may give different results. So applied workers
will get different results. Moreover, it is also not known that which method of finding generalized
inverse is optimum.
5. Use of principal component regression The principal component regression is based on the technique of principal component analysis. The k
explanatory variables are transformed into a new set of orthogonal variables called as principal
components. Usually this technique is used for reducing the dimensionality of data by retaining some
levels of variability of explanatory variables which is expressed by the variability in study variable. The
principal components involves the determination of a set of linear combinations of explanatory variables
such that they retain the total variability of the system and these linear combinations are mutually
independent of each other. Such obtained principal components are ranked in the order of their
importance. The importance being judged in terms of variability explained by a principal component
relative to the total variability in the system. The procedure then involves eliminating some of the
principal components which contribute in explaining relatively less variation. After elimination of the
least important principal components, the set up of multiple regression is used by replacing the
explanatory variables with principal components. Then study variable is regressed against the set of
selected principal components using ordinary least squares method. Since all the principal components
are orthogonal, they are mutually independent and so OLS is used without any problem. Once the
estimates of regression coefficients for the reduced set of orthogonal variables (principal components)
Regression Analysis | Chapter 9 | Multicollinearity | Shalabh, IIT Kanpur 17 17 17
have been obtained, they are mathematically transformed into a new set of estimated regression
coefficients that correspond to the original correlated set of variables. These new estimated coefficients
are the principal components estimators of regression coefficients.
Suppose there are k explanatory variables 1 2, ,..., .kX X X Consider the linear function of 1 2, ,.., kX X X
like
1
1
21
etc.
k
i ii
k
i ii
Z a X
Z b X
=
=
=
=
∑
∑
The constants 1 2, ,..., ka a a are determined such that the variance of 1Z is maximized subject to the
normalizing condition that 2
11.i
ia
=
=∑ The constant 1 2, ,..., kb b b are determined such that the variance of
2Z is maximized subject to the normality condition that 2
11i
ib
=
=∑ and is independent of the first principal
component.
We continue with such process and obtain k such linear combinations such that they are orthogonal to
their preceding linear combinations and satisfy the normality condition. Then we obtain their variances.
Suppose such linear combinations are 1 2, ,.., kZ Z Z and for them, 1 2( ) ( ) ... ( ).kVar Z Var Z Var Z> > > The
linear combination having the largest variance is the first principal component. The linear combination
having the second largest variance is the second largest principal component and so on. These principal
components have the property that 1 1
( ) ( ).k k
i ii i
Var Z Var X= =
=∑ ∑ Also, the 1 2, ,..., kX X X are correlated but
1 2, ,.., kZ Z Z are orthogonal or uncorrelated. So there will be zero multicollinearity among 1 2, ,.., kZ Z Z .
The problem of multicollinearity arises because 1 2, ,..., kX X X are not independent. Since the principal
components based on 1 2, ,..., kX X X are mutually independent, so they can be used as explanatory
variables and such regression will combat the multicollinearity.
Regression Analysis | Chapter 9 | Multicollinearity | Shalabh, IIT Kanpur 18 18 18
Let 1 2, ,..., kλ λ λ be the eigenvalues of 1 2' , ( , ,..., )kX X diag λ λ λΛ = is k k× diagonal matrix, V is a k k×
orthogonal matrix whose columns are the eigenvectors associated with 1 2, ,..., kλ λ λ . Consider the
canonical form of the linear model
'y X
XVVZ
β εβ ε
α ε
= += += +
where , ' , ' ' 'Z XV V V X XV Z Zα β= = = = Λ .
Columns of ( )1 2, ,..., kZ Z Z Z= define a new set of explanatory variables which are called as principal
components.
The OLSE of α is 1
1
ˆ ( ' ) ''
Z Z Z yZ y
α −
−
=
= Λ
and its covariance matrix is 2 1
2 1
2
1 2
ˆ( ) ( ' )
1 1 1 , ,...,k
V Z Z
diag
α σ
σ
σλ λ λ
−
−
=
= Λ
=
Note that jλ is the variance of thj principal component and 1 1
'k k
i ji j
Z Z Z Z= =
= = Λ∑∑ . A small eigenvalue
of 'X X means that the linear relationship between the original explanatory variable exist and the
variance of corresponding orthogonal regression coefficient is large which indicates that the
multicollinearity exists. If one or more jλ are small, then it indicates that multicollinearity is present.
Retainment of principal components: The new set of variables, i.e., principal components are orthogonal, and they retain the same magnitude of
variance as of original set. If multicollinearity is severe, then there will be at least one small value of
eigenvalue. The elimination of one or more principal components associated with smallest eigenvalues
will reduce the total variance in the model. Moreover, the principal components responsible for creating
multicollinearity will be removed and the resulting model will be appreciably improved.
Regression Analysis | Chapter 9 | Multicollinearity | Shalabh, IIT Kanpur 19 19 19
The principal component matrix [ ]1 2, ,..., kZ Z Z Z= with 1 2, ,..., kZ Z Z contains exactly the same
information as the original data in X in the sense that the total variability in X and Z is same. The
difference between them is that the original data are arranged into a set of new variables which are
uncorrelated with each other and can be ranked with respect to the magnitude of their eigenvalues. The thj column vector jZ corresponding to the largest jλ accounts for the largest proportion of the variation
in the original data. Thus the jZ ’s are indexed so that 1 2 ... 0kλ λ λ> > > > and jλ is the variance of jZ .
A strategy of elimination of principal components is to begin by discarding the component associated with
the smallest eigenvalue. The idea behind to do so is that the principal component with smallest eigenvalue
is contributing least variance and so is least informative.
Using this procedure, principal components are eliminated until the remaining components explain some
preselected variance is terms of percentage of total variance. For example, if 90% of total variance is
needed, and suppose r principal components are eliminated which means that ( )k r− principal
components contributes 90% variation, then r is selected to satisfy
1
1
0.90.
k r
iik
ii
λ
λ
−
=
=
>∑
∑
Various strategies to choose required number of principal components are also available in the literature.
Suppose after using such a rule, the r principal components are eliminated. Now only ( )k r−
components will be used for regression. So Z matrix is partitioned as
( ) ( )r k r r k rZ Z Z X V V− −= =
where rZ submatrix is of order n r× and contains the principal components to be eliminated. The
submatrix k rZ − is of order ( )n k r× − and contains the principal components to be retained.
The reduced model obtained after the elimination of r principal components can be expressed as
*.k r k ry Z α ε− −= +
The random error component is represented as *ε just to distinguish with ε . The reduced coefficients
contain the coefficients associated with retained 'jZ s . So
Regression Analysis | Chapter 9 | Multicollinearity | Shalabh, IIT Kanpur 20 20 20
( )( )( )
1 2
1 2
1 2
, ,...,
, ,...,
, ,..., .
k r k r
k r k r
k r k r
Z Z Z Z
V V V V
α α α α− −
− −
− −
=
=
=
Using OLS on the model with retained principal components, the OLSE of k rα − is
' 1 'ˆ ( )k r k r k r k rZ Z Z yα −− − − −= .
Now it is transformed back to original explanatory variables as follows:
'
'
ˆ ˆk r k r
pc k r k r
VV
V
α β
α β
β α− −
− −
=
=
⇒ =
is the principal component regression estimator of .β
This method improves the efficiency as well as multicollinearity.
6. Ridge regression The OLSE is the best linear unbiased estimator of regression coefficient in the sense that it has minimum
variance in the class of linear and unbiased estimators. However if the condition of unbiased can be
relaxed then it is possible to find a biased estimator of regression coefficient say β that has smaller
variance them the unbiased OLSE b . The mean squared error (MSE) of β is
{ } { }2
2
2
2
ˆ ˆ( ) ( )
ˆ ˆ ˆ( ) ( )
ˆ ˆ( ) ( )
ˆ ˆ( ) ( ) .
MSE E
E E E
Var E
Var Bias
β β β
β β β β
β β β
β β
= −
= − + −
= + −
= +
Thus ˆ( )MSE β can be made smaller than ˆ( )Var β by introducing small bias is β . One of the approach to
do so is the ridge regression. The ridge regression estimator is obtained by solving the normal equations
of least squares estimation. The normal equations are modified as
( )
( ) 1
ˆ' 'ˆ ' '
ridge
ridge
X X I X y
X X I X y
δ β
β δ −
+ =
⇒ = +
is the ridge regression estimator of β and 0δ ≥ is any characterizing scalar termed as biasing
parameter.
Regression Analysis | Chapter 9 | Multicollinearity | Shalabh, IIT Kanpur 21 21 21
As ˆ ˆ0, ( ) and as , 0.b OLSEδ β δ β→ → →∞ →
So larger the value of δ , larger shrinkage towards zero. Note that the OLSE in inappropriate to use in the
sense that it has very high variance when multicollinearity is present in the data. On the other hand, a very
small value of β may tend to accept the null hypothesis 0 : 0H β = indicating that the corresponding
variables are not relevant. The value of biasing parameter controls the amount of shrinkage in the
estimates.
Bias of ridge regression estimator:
The bias of ˆridgeβ is
[ ]
1
1
1
1
ˆ ˆ( ) ( )
( ' ) ' ( )
( ' ) '
( ' ) ' '
( ' ) .
ridge ridgeBias E
X X I X E y
X X I X X I
X X I X X X X I
X X I
β β β
δ β
δ β
δ δ β
δ δ β
−
−
−
−
= −
= + −
= + − = + − −
= − +
Thus the ridge regression estimator is a biased estimator of β .
Covariance matrix:
The covariance matrix of ˆridgeβ is defined as
{ }{ }'ˆ ˆ ˆ ˆ ˆ( ) ( ) ( )ridge ridge ridge ridge ridgeV E E Eβ β β β β = − − .
Since
1 1
1
1
ˆ ˆ( ) ( ' ) ' ( ' ) '
( ' ) '( )( ' ) ' ,
ridge ridgeE X X I X y X X I X X
X X I X y XX X I X
β β δ δ β
δ β
δ ε
− −
−
−
− = + − +
= + −
= +
so
1 1
2 1 1
ˆ( ) ( ' ) ' ( ) ( ' )
( ' ) ' ( ' ) .ridgeV X X I X V X X X I
X X I X X X X I
β δ ε δ
σ δ δ
− −
− −
= + +
= + +

Regression Analysis | Chapter 9 | Multicollinearity | Shalabh, IIT Kanpur 22 22 22
Mean squared error:
The mean squared error of ˆridgeβ is
2
2
2 1 1 2 2
2 2 22
1
ˆ ˆ ˆ( ) ( ) ( )
ˆ ˆ( ) ( )
( ' ) ' ( ' ) '( ' )
'( ' )( )
ridge ridge ridge
ridge ridge
kj
j j
MSE Var bias
tr V bias
tr X X I X X X X I X X I
X X I
β β β
β β
σ δ δ δ β δ β
λσ δ β δ β
λ δ
− − −
−
=
= +
= + = + + + +
= + ++∑
where 1 2, ,..., kλ λ λ are the eigenvalues of ' .X X
Thus as δ increases, the bias in ˆridgeβ increases but its variance decreases. Thus the trade off between
bias and variance hinges upon the value ofδ . It can be shown that there exists a value of δ such that
ˆ( ) ( )ridgeMSE Var bβ <
provided 'β β is bounded.
Choice of δ : The estimation of ridge regression estimator depends upon the value of δ . Various approaches have been
suggested in the literature to determine the value of δ . The value of δ can be chosen on the bias of
criteria like
- stability of estimators with respect to δ .
- reasonable signs.
- magnitude of residual sum of squares etc.
We consider here the determination of δ by the inspection of ridge trace.
Ridge trace: Ridge trace is the graphical display of ridge regression estimator versus δ .
If multicollinearity is present and is severe, then the instability of regression coefficients is reflected in the
ridge trace. As δ increases, some of the ridge estimates vary dramatically and they stabilizes at some
value of δ . The objective in ridge trace is to inspect the trace (curve) and find the reasonable small
Regression Analysis | Chapter 9 | Multicollinearity | Shalabh, IIT Kanpur 23 23 23
value of δ at which the ridge regression estimators are stable. The ridge regression estimator with such
a choice of δ will have smaller MSE than the variance of OLSE.
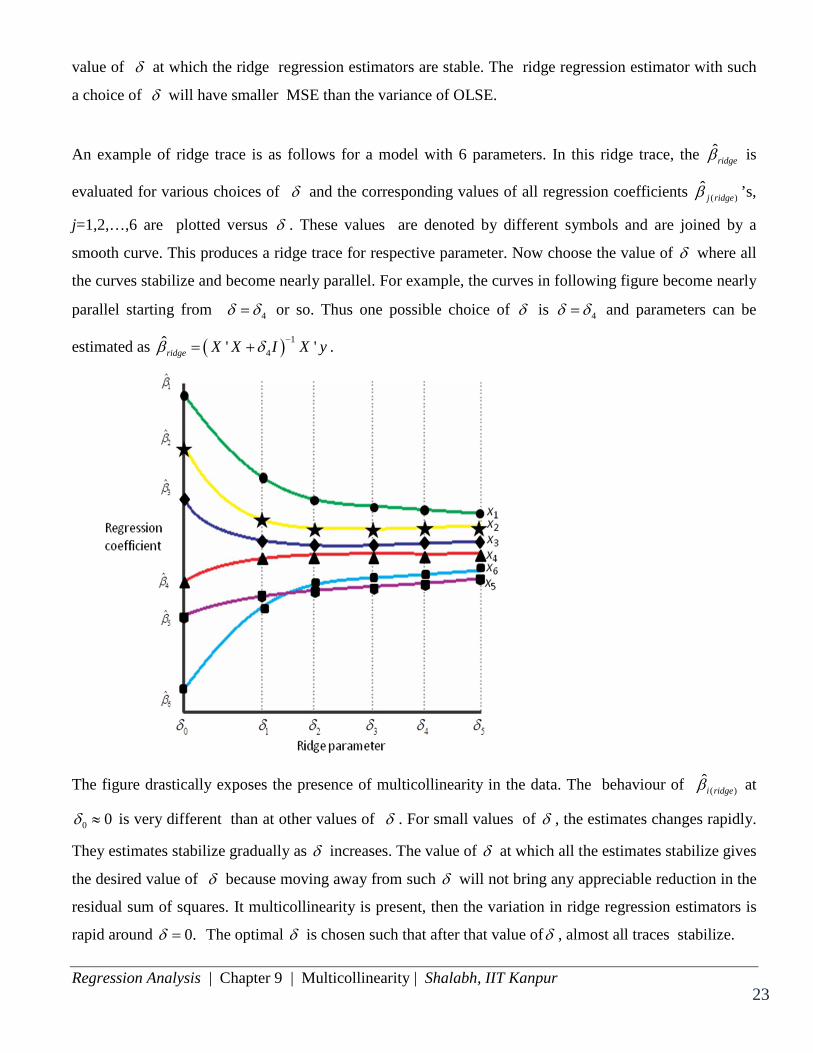
An example of ridge trace is as follows for a model with 6 parameters. In this ridge trace, the ˆridgeβ is
evaluated for various choices of δ and the corresponding values of all regression coefficients ( )ˆ
j ridgeβ ’s,
j=1,2,…,6 are plotted versus δ . These values are denoted by different symbols and are joined by a
smooth curve. This produces a ridge trace for respective parameter. Now choose the value of δ where all
the curves stabilize and become nearly parallel. For example, the curves in following figure become nearly
parallel starting from 4δ δ= or so. Thus one possible choice of δ is 4δ δ= and parameters can be
estimated as ( ) 14
ˆ ' 'ridge X X I X yβ δ −= + .
The figure drastically exposes the presence of multicollinearity in the data. The behaviour of ( )i ridgeβ at
0 0δ ≈ is very different than at other values of δ . For small values of δ , the estimates changes rapidly.
They estimates stabilize gradually as δ increases. The value of δ at which all the estimates stabilize gives
the desired value of δ because moving away from such δ will not bring any appreciable reduction in the
residual sum of squares. It multicollinearity is present, then the variation in ridge regression estimators is
rapid around 0.δ = The optimal δ is chosen such that after that value ofδ , almost all traces stabilize.

Regression Analysis | Chapter 9 | Multicollinearity | Shalabh, IIT Kanpur 24 24 24
Limitations: 1. The choice of δ is data dependent and therefore is a random variable. Using it as a random variable
violates the assumption that δ is a constant. This will disturb the optimal properties derived under the
assumption of constancy of δ .
2. The value of δ lies in the interval (0, )∞ . So large number of values are required for exploration.
This results is wasting of time. This is not a big issue when working with software.
3. The choice of δ from graphical display may not be unique. Different people may choose different δ
and consequently the values of ridge regression estimators will be changing. Another choice of δ is 2ˆ
'kb bσδ = where b and 2σ are obtained from the least squares estimation.
4. The stability of numerical estimates of ˆ 'i sβ is a rough way to determineδ . Different estimates may
exhibit stability for different δ and it may often be hard to strike a compromise. In such situation,
generalized ridge regression estimators are used.
5. There is no guidance available regarding the testing of hypothesis and for confidence interval
estimation.
Idea behind ridge regression estimator: The problem of multicollinearity arises because some of the eigenvalues roots of 'X X are close to zero
or are zero. So if 1 2, ,..., pλ λ λ are the characteristic roots, and if
1 2' ( , ,..., )kX X diag λ λ λ= Λ =
then
1 1ˆ ( )ridge I bβ δ − −= + Λ
where b is the OLSE of β given by 1 1( ' ) ' ' .b X X X y X y− −= = Λ
Thus a particular element will be of the forms
1 .1
ii i
i
i
b bλδ λ δλ
=++
So a small quantity δ is added to iλ so that if 0,iλ = even then i
i
λλ δ+
remains meaningful.

Regression Analysis | Chapter 9 | Multicollinearity | Shalabh, IIT Kanpur 25 25 25
Another interpretation of ridge regression estimator:
In the model ,y X β ε= + obtain the least squares estimator of β when 21
1,
k
iCβ
=
=∑ where C is some
constant. So minimize
( ) ( ) '( ) ( ' )y X y X Cδ β β β δ β β= − − + −
where δ is the Lagrangian multiplier. Differentiating ( )S β with respect to β , the normal equations are
obtained as
1
( ) 0 2 ' 2 ' 2 0
ˆ ( ' ) ' .ridge
S X y X X
X X I X y
β β δββ
β δ −
∂= ⇒ − + + =
∂
⇒ = +
Note that if C is very small, it may indicate that most of the regression coefficients are close to zero and if
C is large, then it may indicate that the regression coefficients are away from zero. So C puts a sort of
penalty on the regression coefficients to enable its estimation.