chapter 9 fixed assets accounting, 21 st edition warren reeve fess powerpoint presentation by...
TRANSCRIPT
Chapter Chapter 99Fixed AssetsFixed Assets
Accounting, 21st Edition
Warren Reeve Fess
PowerPoint Presentation by Douglas CloudProfessor Emeritus of AccountingPepperdine University
© Copyright 2004 South-Western, a division of Thomson Learning. All rights reserved.
Task Force Image Gallery clip art included in this electronic presentation is used with the permission of NVTech Inc.
NATURE OF FIXED ASSETSNATURE OF FIXED ASSETSNATURE OF FIXED ASSETSNATURE OF FIXED ASSETS
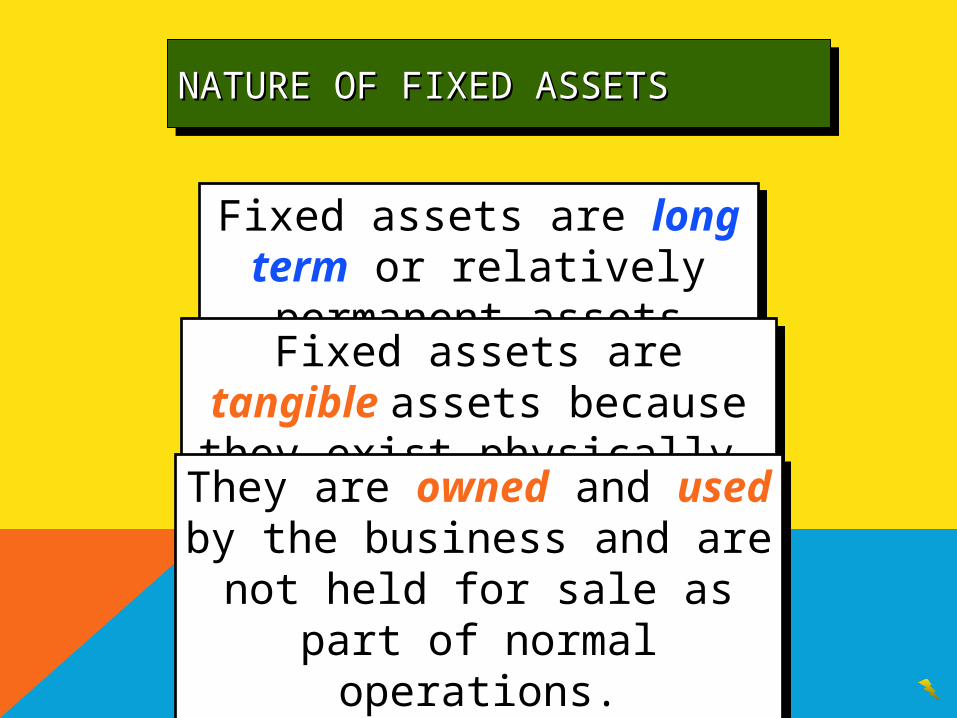
Fixed assets are long term or relatively permanent assets
Fixed assets are long term or relatively permanent assets
Fixed assets are tangible assets because they exist physically.
Fixed assets are tangible assets because they exist physically.
They are owned and used by the business and are not held for sale
as part of normal operations.
They are owned and used by the business and are not held for sale
as part of normal operations.
NATURE OF DEPRECIATIONNATURE OF DEPRECIATIONNATURE OF DEPRECIATIONNATURE OF DEPRECIATION
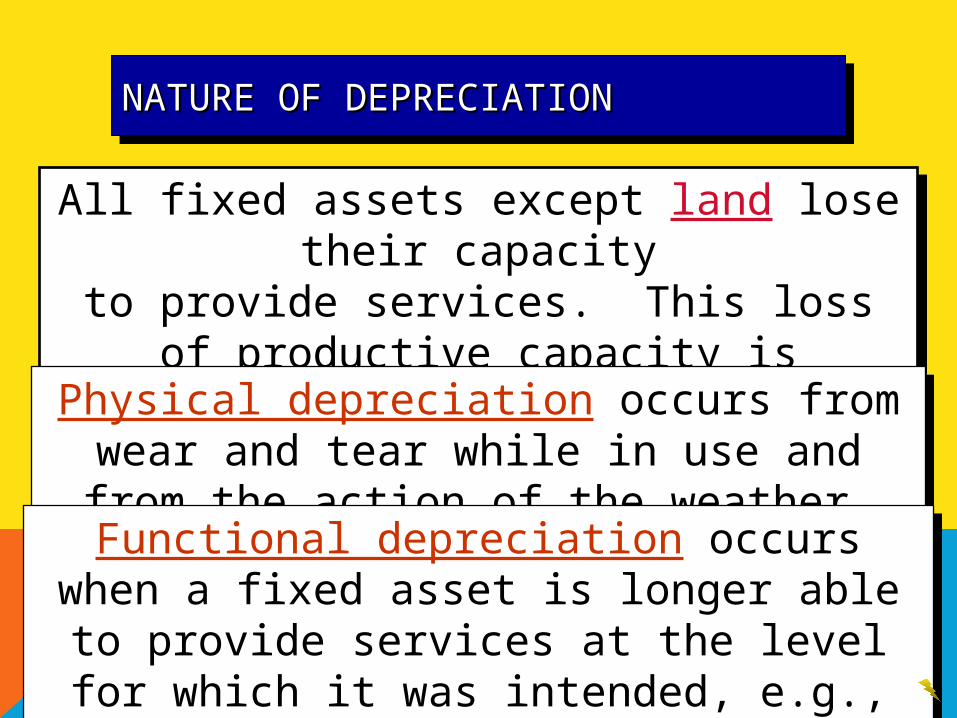
All fixed assets except land lose their capacityto provide services. This loss of productive
capacity is recognized as Depreciation Expense.
All fixed assets except land lose their capacityto provide services. This loss of productive
capacity is recognized as Depreciation Expense.
Physical depreciation occurs from wear and tear while in use and from the action of the weather.
Physical depreciation occurs from wear and tear while in use and from the action of the weather.
Functional depreciation occurs when a fixed asset is longer able to provide services at the level for
which it was intended, e.g., personal computer.
Functional depreciation occurs when a fixed asset is longer able to provide services at the level for
which it was intended, e.g., personal computer.
Straight-Line MethodStraight-Line MethodStraight-Line MethodStraight-Line Method
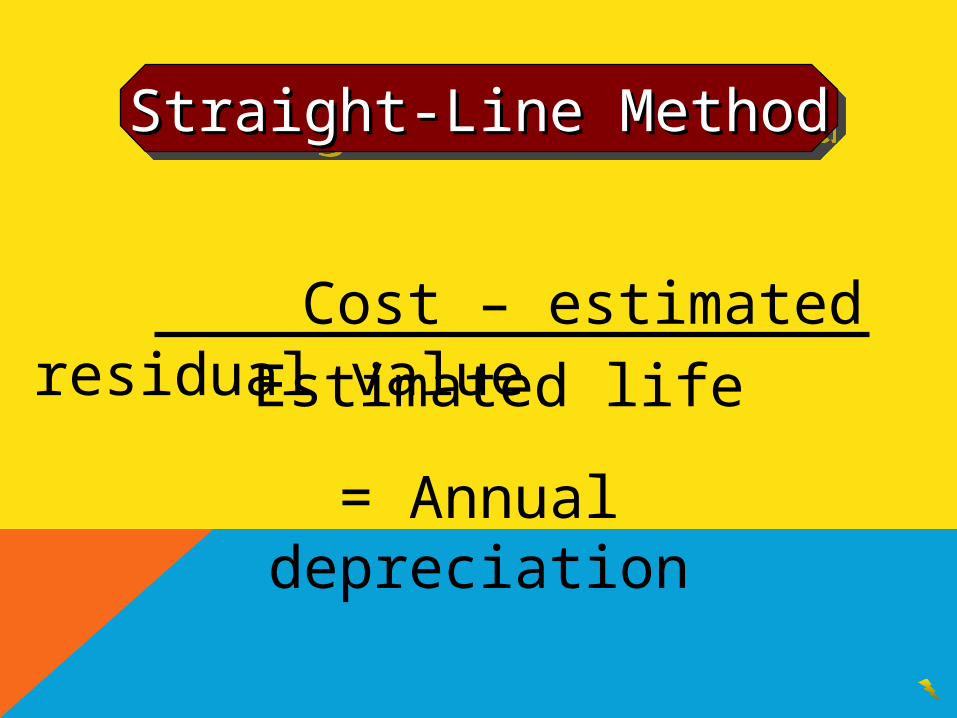
Cost – estimated residual value
Estimated life
= Annual depreciation
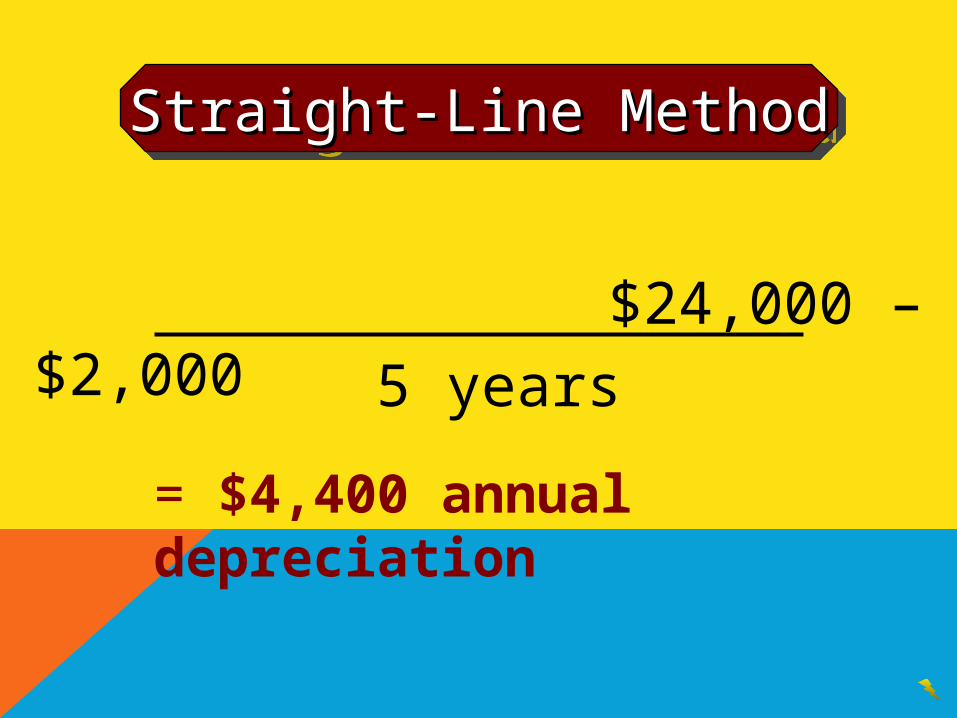
Straight-Line MethodStraight-Line MethodStraight-Line MethodStraight-Line Method
$24,000 – $2,000
5 years
= $4,400 annual depreciation

Units-of-Production MethodUnits-of-Production MethodUnits-of-Production MethodUnits-of-Production Method
Cost – estimated residual valueEstimated life in units, hours, etc.
= Depreciation per unit, hour, etc.
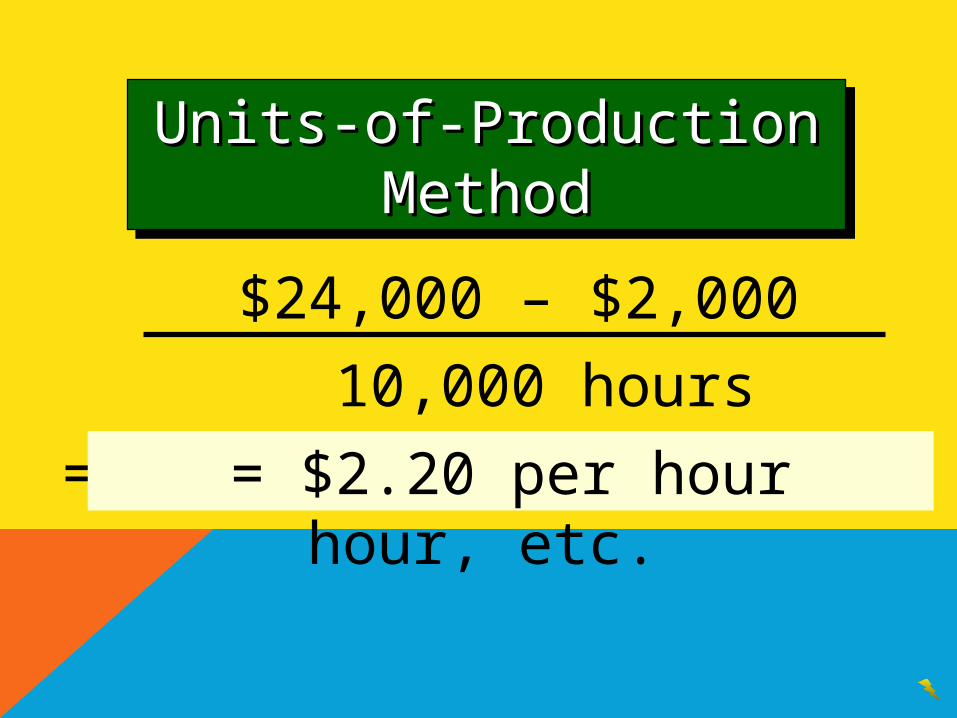
$24,000 – $2,000
10,000 hours
= Depreciation per unit, hour, etc.= $2.20 per hour
Units-of-Production MethodUnits-of-Production MethodUnits-of-Production MethodUnits-of-Production Method
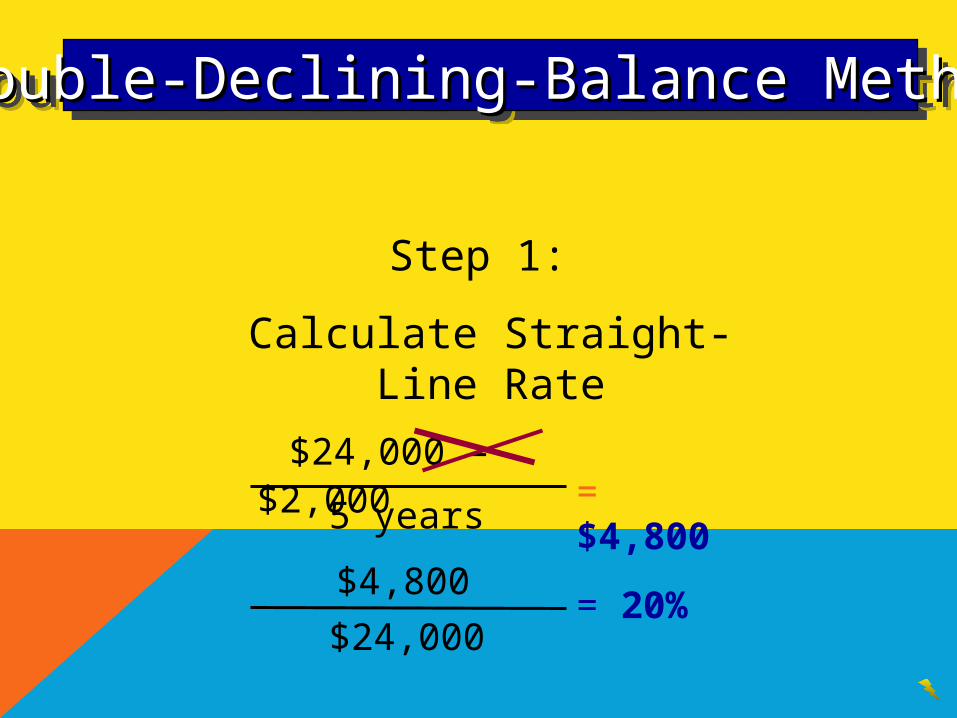
Double-Declining-Balance MethodDouble-Declining-Balance MethodDouble-Declining-Balance MethodDouble-Declining-Balance Method
Step 1:
Calculate Straight-Line Rate
= $4,800 $24,000 – $2,000
5 years
$4,800
$24,000= 20%

Double the straight-line rate.
Step 2Step 2
.20 x 2 = .40
For the first year, the cost of the asset is multiplied by 40 percent. After the first year,
the declining book value of the asset is multiplied 40 percent.
For the first year, the cost of the asset is multiplied by 40 percent. After the first year,
the declining book value of the asset is multiplied 40 percent.
Double-Declining-Balance MethodDouble-Declining-Balance MethodDouble-Declining-Balance MethodDouble-Declining-Balance Method
Build a table.
Step 3Step 3
Double-Declining-Balance MethodDouble-Declining-Balance MethodDouble-Declining-Balance MethodDouble-Declining-Balance Method
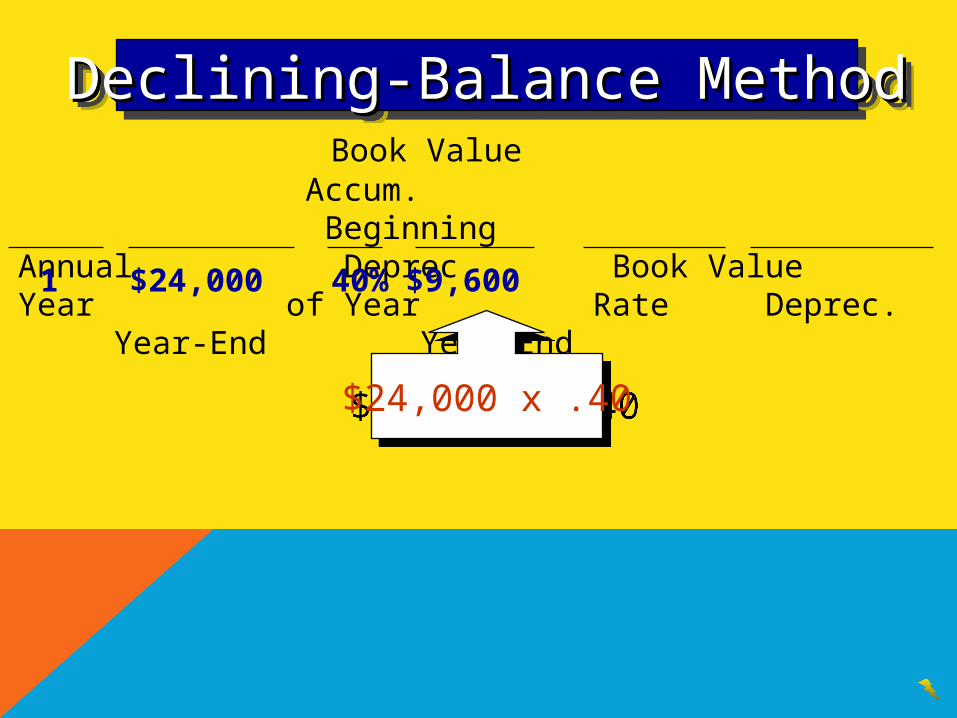
Book Value Accum. Beginning Annual Deprec. Book ValueYear of Year Rate Deprec. Year-End Year-End
1 $24,000 40% $9,600
Declining-Balance MethodDeclining-Balance MethodDeclining-Balance MethodDeclining-Balance Method
$24,000 x .40$24,000 x .40
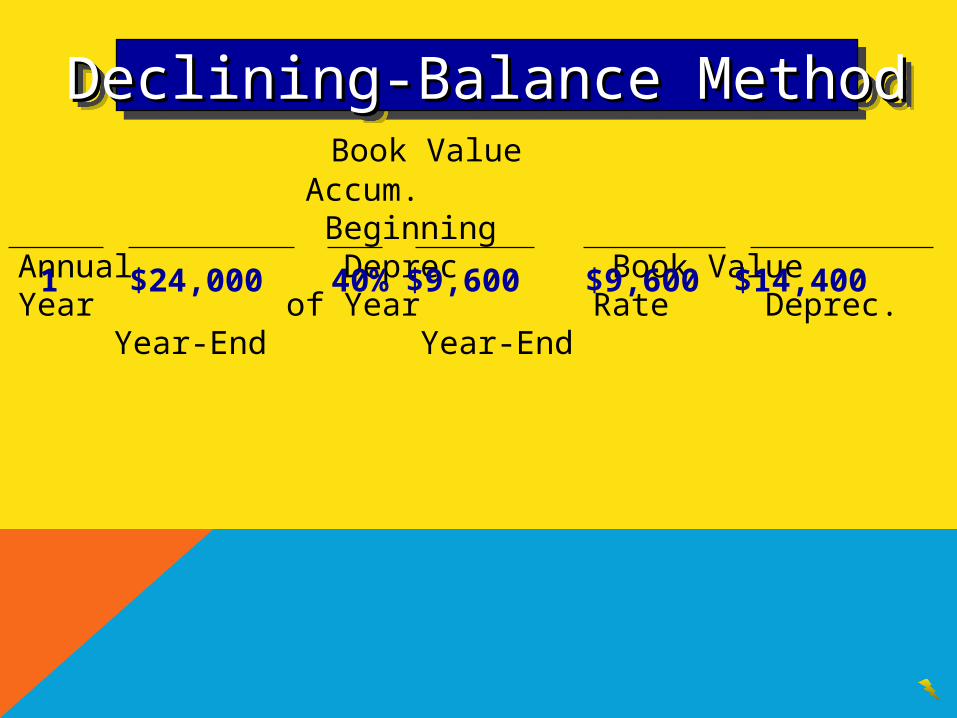
Book Value Accum. Beginning Annual Deprec. Book ValueYear of Year Rate Deprec. Year-End Year-End
1 $24,000 40% $9,600 $9,600 $14,400
Declining-Balance MethodDeclining-Balance MethodDeclining-Balance MethodDeclining-Balance Method
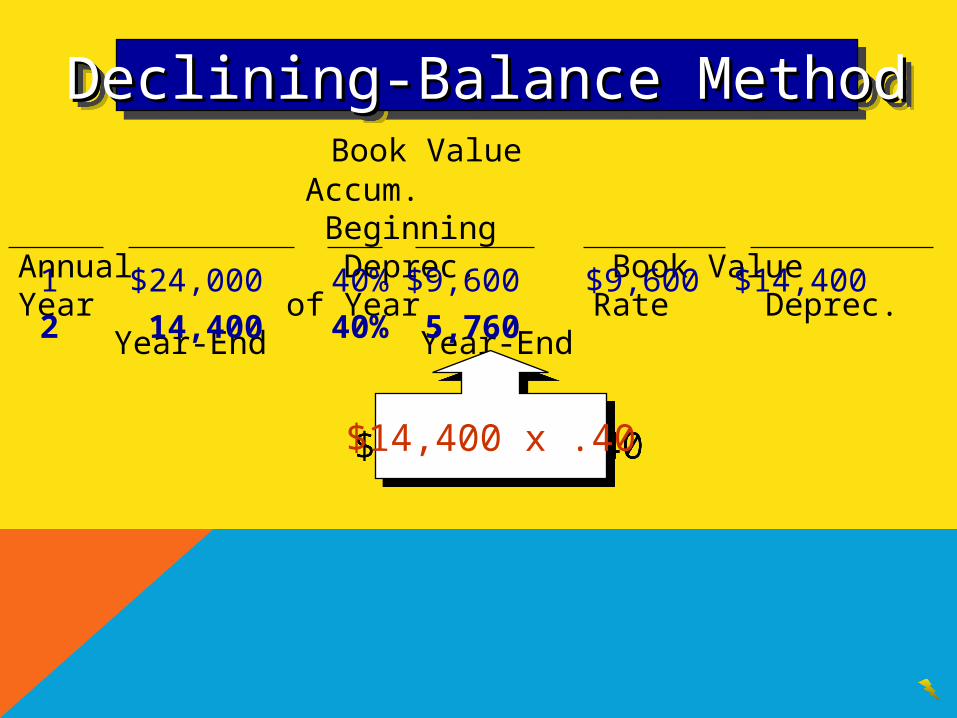
Book Value Accum. Beginning Annual Deprec. Book ValueYear of Year Rate Deprec. Year-End Year-End
1 $24,000 40% $9,600 $9,600 $14,400
2 14,400 40% 5,760
Declining-Balance MethodDeclining-Balance MethodDeclining-Balance MethodDeclining-Balance Method
$14,400 x .40$14,400 x .40
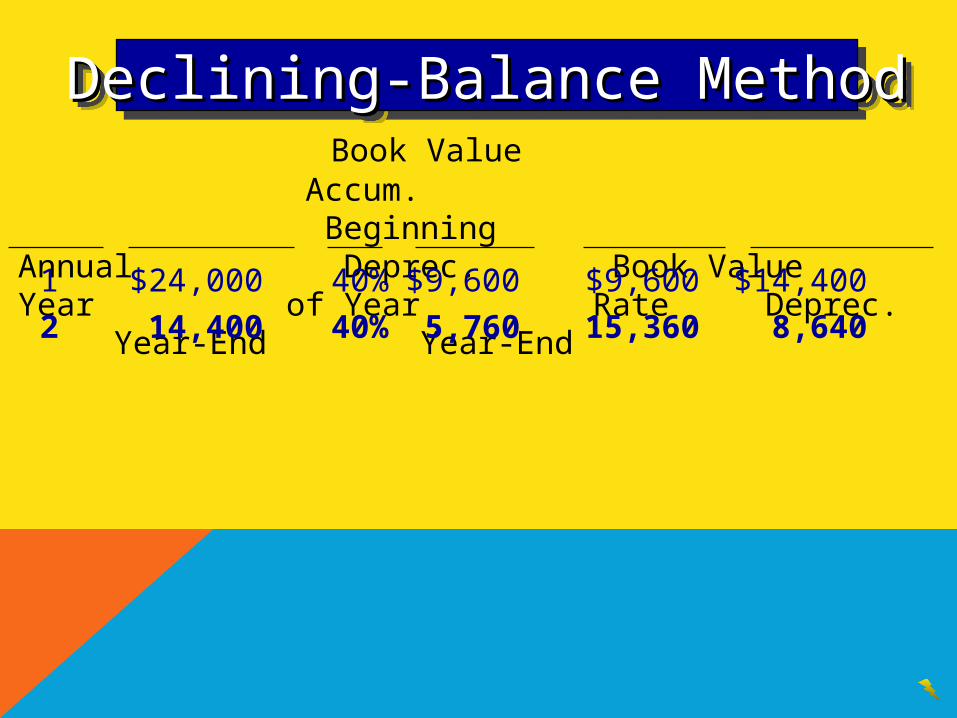
Book Value Accum. Beginning Annual Deprec. Book ValueYear of Year Rate Deprec. Year-End Year-End
1 $24,000 40% $9,600 $9,600 $14,400
2 14,400 40% 5,760 15,360 8,640
Declining-Balance MethodDeclining-Balance MethodDeclining-Balance MethodDeclining-Balance Method
Book Value Accum. Beginning Annual Deprec. Book ValueYear of Year Rate Deprec. Year-End Year-End
1 $24,000 40% $9,600 $9,600 $14,400
2 14,400 40% 5,760 15,360 8,640
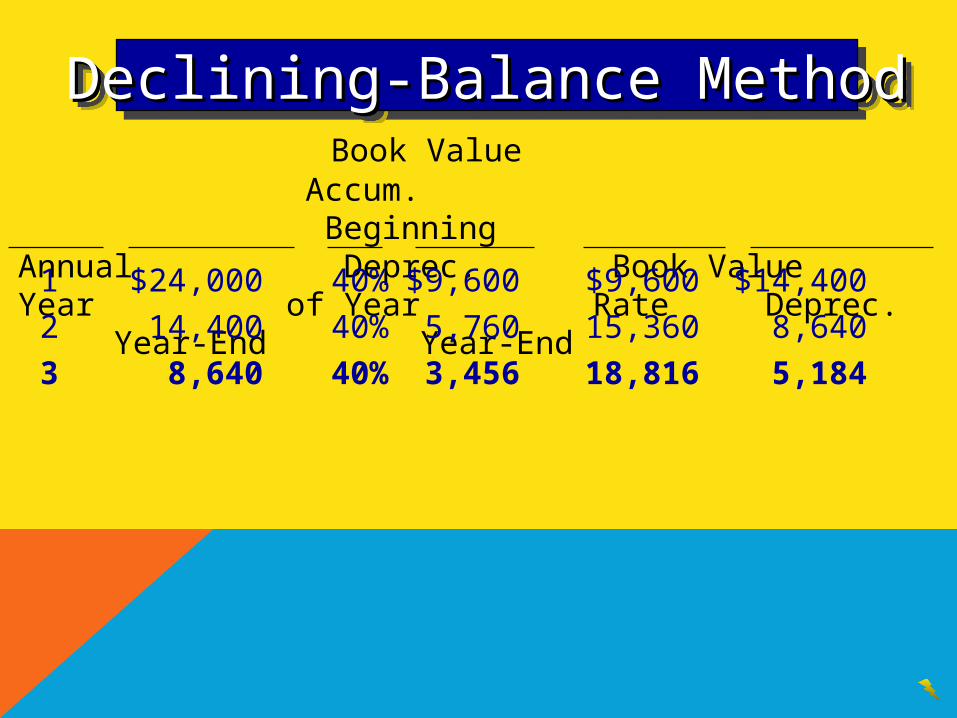
3 8,640 40% 3,456 18,816 5,184
Declining-Balance MethodDeclining-Balance MethodDeclining-Balance MethodDeclining-Balance Method
Book Value Accum. Beginning Annual Deprec. Book ValueYear of Year Rate Deprec. Year-End Year-End
1 $24,000 40% $9,600 $9,600 $14,400
2 14,400 40% 5,760 15,360 8,640
3 8,640 40% 3,456 18,816 5,184
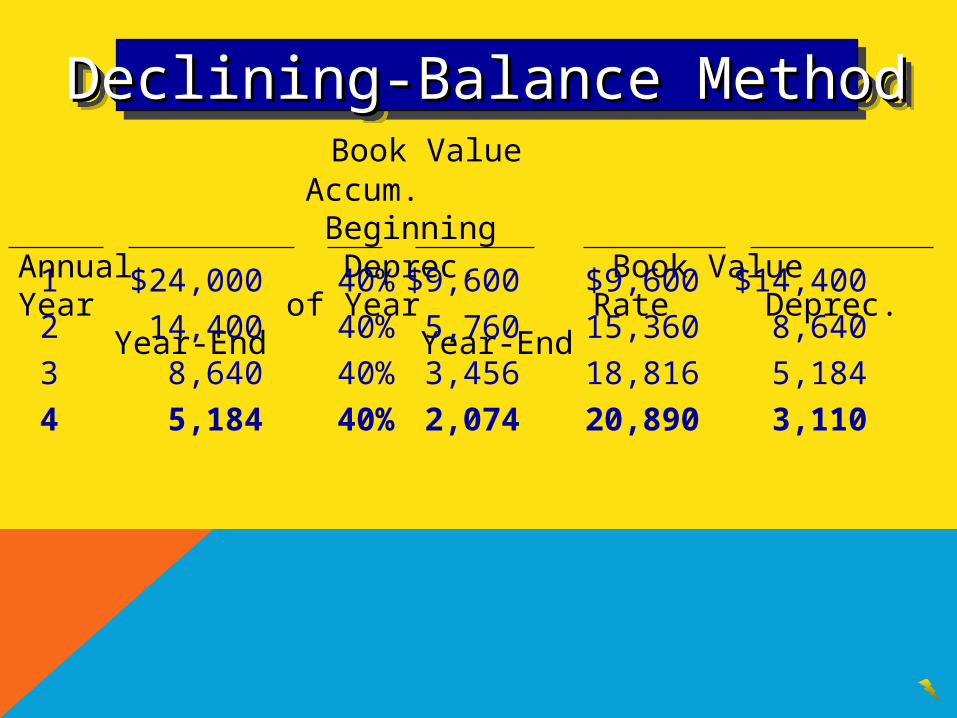
4 5,184 40% 2,074 20,890 3,110
Declining-Balance MethodDeclining-Balance MethodDeclining-Balance MethodDeclining-Balance Method

Book Value Accum. Beginning Annual Deprec. Book ValueYear of Year Rate Deprec. Year-End Year-End
1 $24,000 40% $9,600 $9,600 $14,400
2 14,400 40% 5,760 15,360 8,640
3 8,640 40% 3,456 18,816 5,184
4 5,184 40% 2,074 20,890 3,110
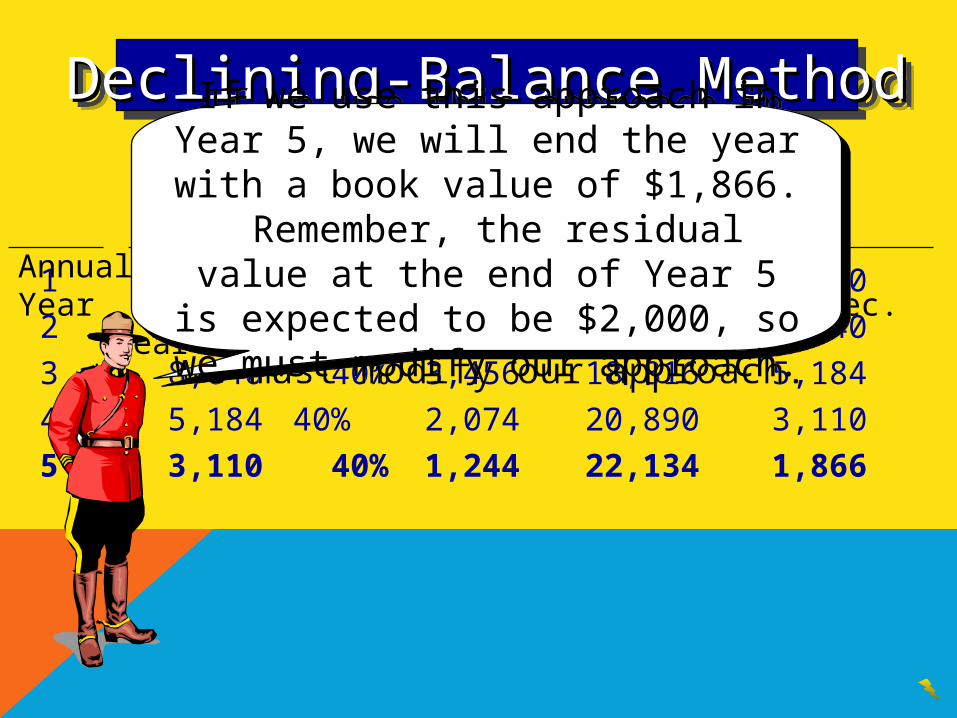
5 3,110 40% 1,244 22,134 1,866
Declining-Balance MethodDeclining-Balance MethodDeclining-Balance MethodDeclining-Balance Method
Book Value Accum. Beginning Annual Deprec. Book ValueYear of Year Rate Deprec. Year-End Year-End
1 $24,000 40% $9,600 $9,600 $14,400
2 14,400 40% 5,760 15,360 8,640
3 8,640 40% 3,456 18,816 5,184
4 5,184 40% 2,074 20,890 3,110
5 3,110 40% 1,244 22,134 1,866
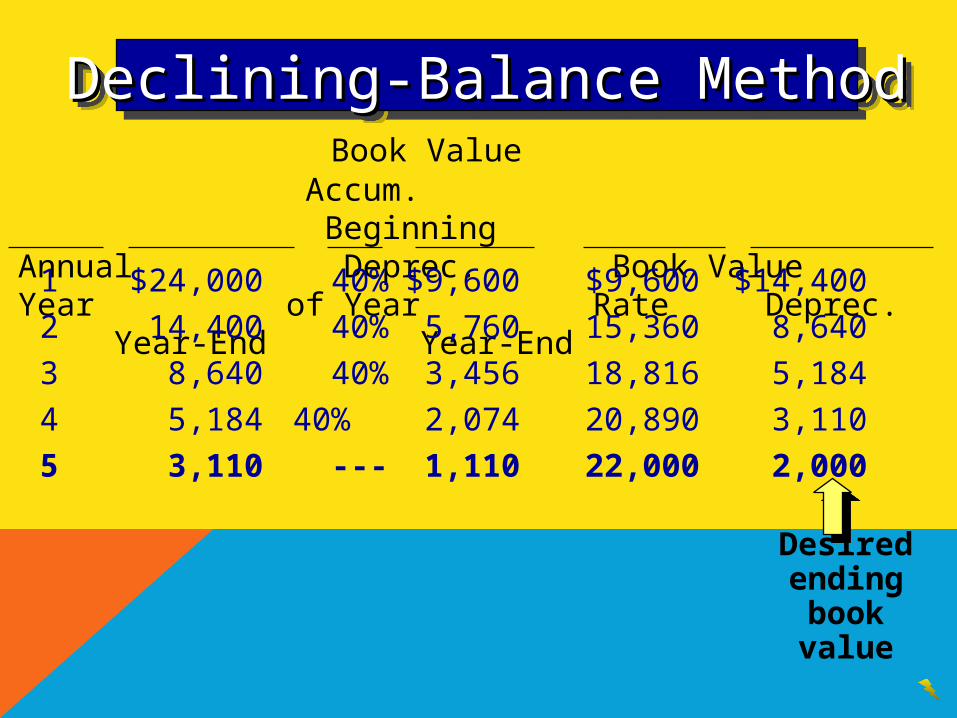
Declining-Balance MethodDeclining-Balance MethodDeclining-Balance MethodDeclining-Balance MethodIf we use this approach in Year 5, we will end the year with a book value of $1,866. Remember, the residual value at the end of
Year 5 is expected to be $2,000, so we must modify our approach.
If we use this approach in Year 5, we will end the year with a book value of $1,866. Remember, the residual value at the end of
Year 5 is expected to be $2,000, so we must modify our approach.
Book Value Accum. Beginning Annual Deprec. Book ValueYear of Year Rate Deprec. Year-End Year-End
1 $24,000 40% $9,600 $9,600 $14,400
2 14,400 40% 5,760 15,360 8,640
3 8,640 40% 3,456 18,816 5,184
4 5,184 40% 2,074 20,890 3,110
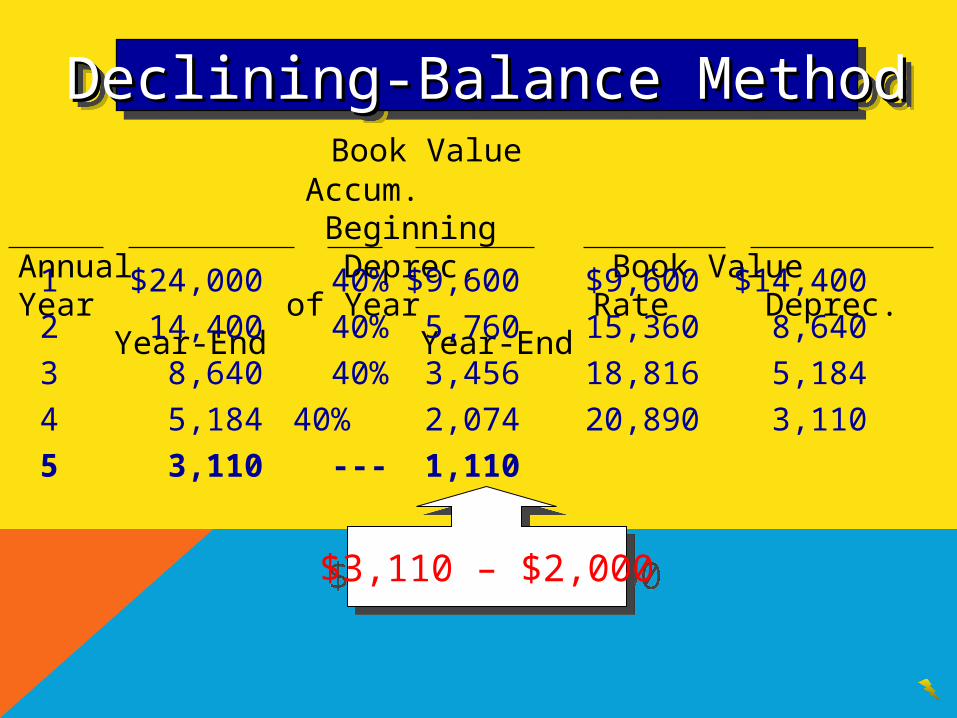
5 3,110 --- 1,110
Declining-Balance MethodDeclining-Balance MethodDeclining-Balance MethodDeclining-Balance Method
$3,110 – $2,000$3,110 – $2,000
Book Value Accum. Beginning Annual Deprec. Book ValueYear of Year Rate Deprec. Year-End Year-End
1 $24,000 40% $9,600 $9,600 $14,400
2 14,400 40% 5,760 15,360 8,640
3 8,640 40% 3,456 18,816 5,184
4 5,184 40% 2,074 20,890 3,110
5 3,110 --- 1,110 22,000 2,000
Desired ending book
value
Declining-Balance MethodDeclining-Balance MethodDeclining-Balance MethodDeclining-Balance Method
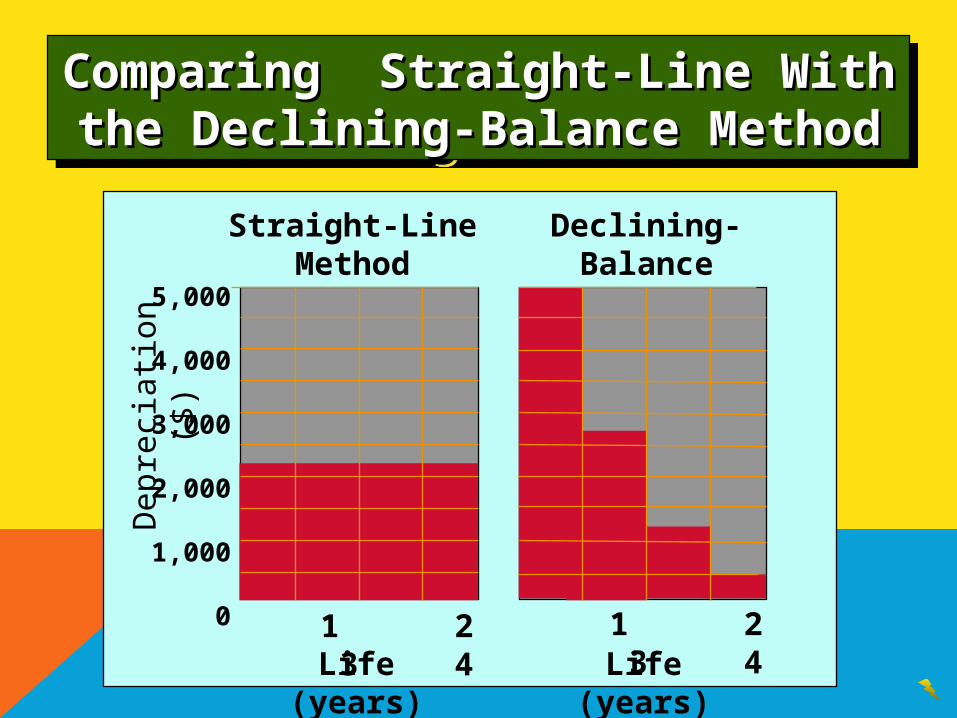
Comparing Straight-Line With the Comparing Straight-Line With the Declining-Balance MethodDeclining-Balance Method
Comparing Straight-Line With the Comparing Straight-Line With the Declining-Balance MethodDeclining-Balance Method
Straight-LineMethod
Dep
reci
atio
n ($
) 5,000
4,000
3,000
2,000
1,000
0
Life (years)
Declining-BalanceMethod
Life (years) 1 2 3 4 1 2 3 4
Revising Depreciation EstimatesRevising Depreciation EstimatesRevising Depreciation EstimatesRevising Depreciation Estimates
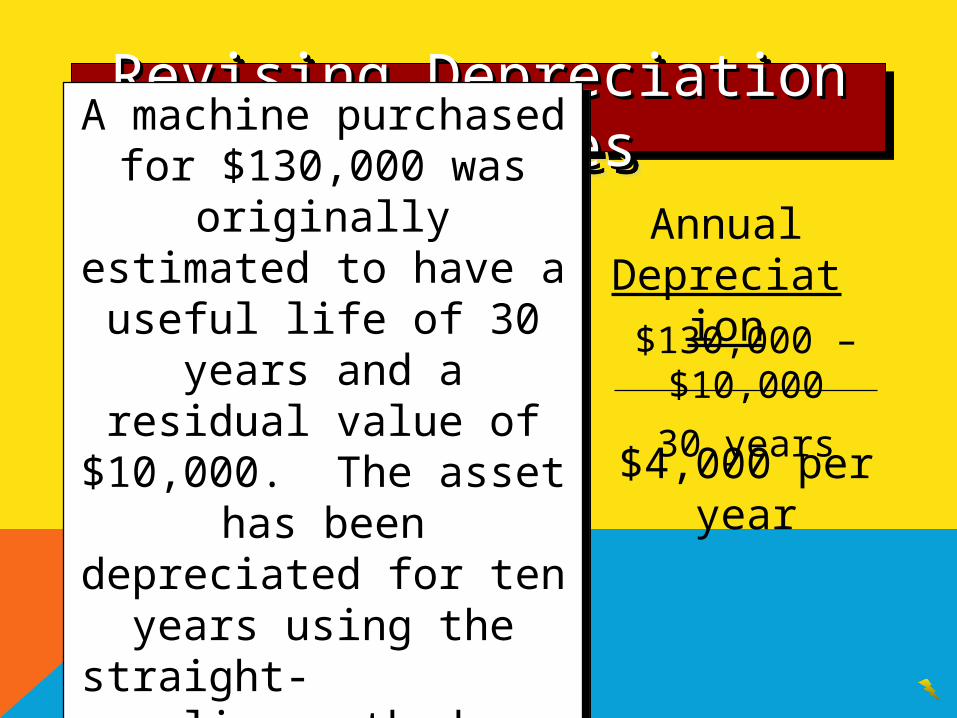
A machine purchased for $130,000 was originally
estimated to have a useful life of 30 years and a
residual value of $10,000. The asset has been
depreciated for ten years using the straight-
line method.
A machine purchased for $130,000 was originally
estimated to have a useful life of 30 years and a
residual value of $10,000. The asset has been
depreciated for ten years using the straight-
line method.
Annual Depreciation
$130,000 – $10,000
30 years
$4,000 per year
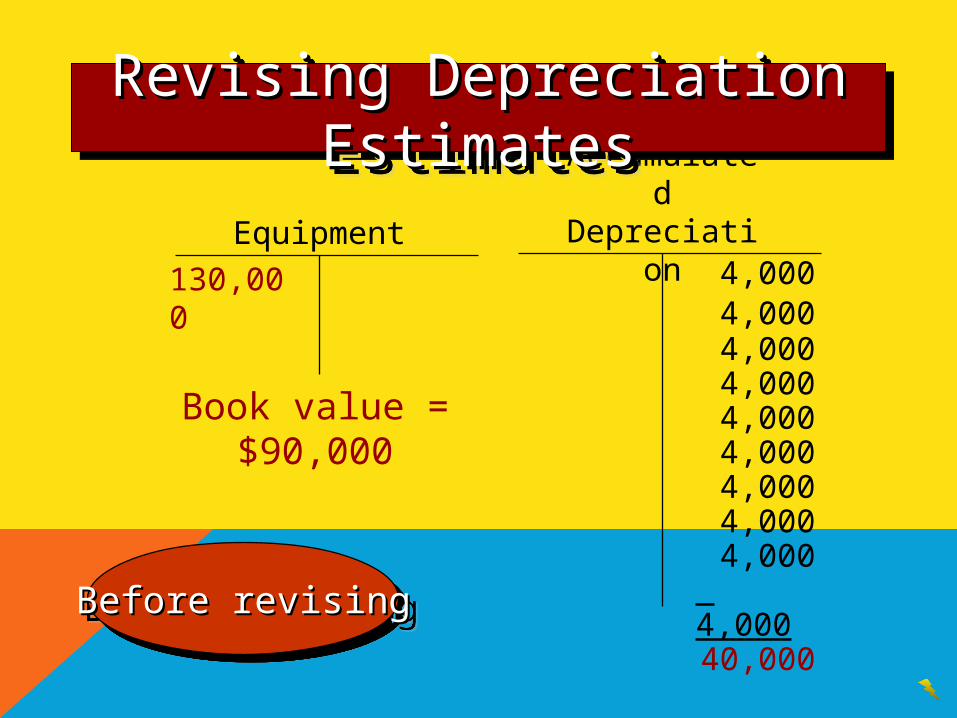
Equipment
130,000
Accumulated Depreciation
4,0004,0004,0004,0004,0004,0004,0004,0004,000
4,00040,000Before revisingBefore revisingBefore revisingBefore revising
Book value = $90,000
Revising Depreciation EstimatesRevising Depreciation EstimatesRevising Depreciation EstimatesRevising Depreciation Estimates
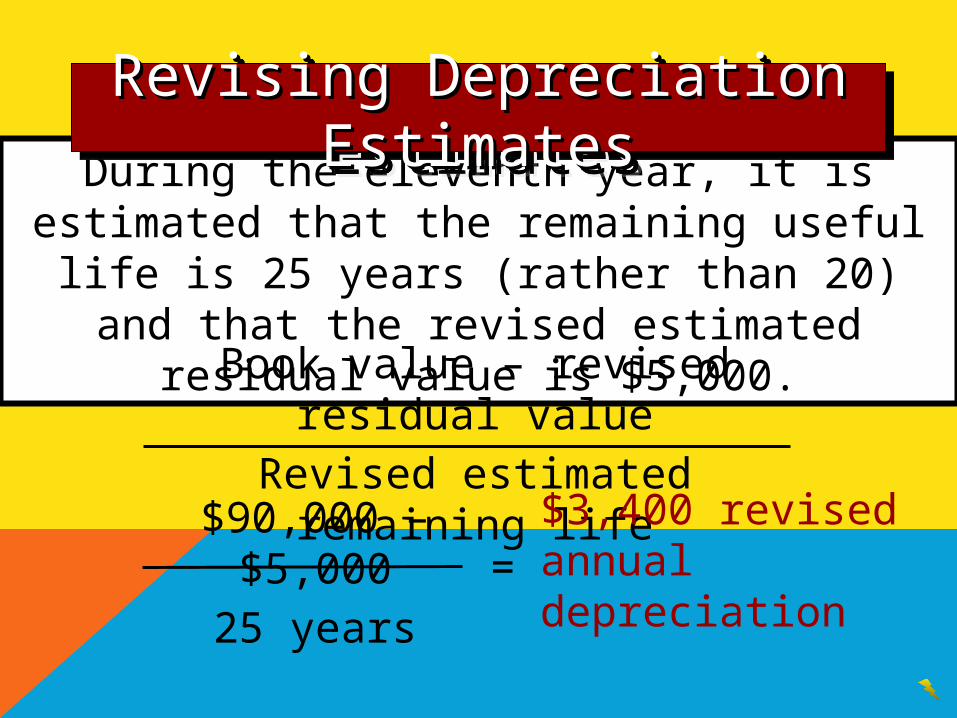
During the eleventh year, it is estimated that the remaining useful life is 25 years (rather than 20) and that the revised estimated residual value is $5,000.
Book value – revised residual value
Revised estimated remaining life
Revising Depreciation EstimatesRevising Depreciation EstimatesRevising Depreciation EstimatesRevising Depreciation Estimates
$90,000 – $5,000
25 years
$3,400 revised annual depreciation=
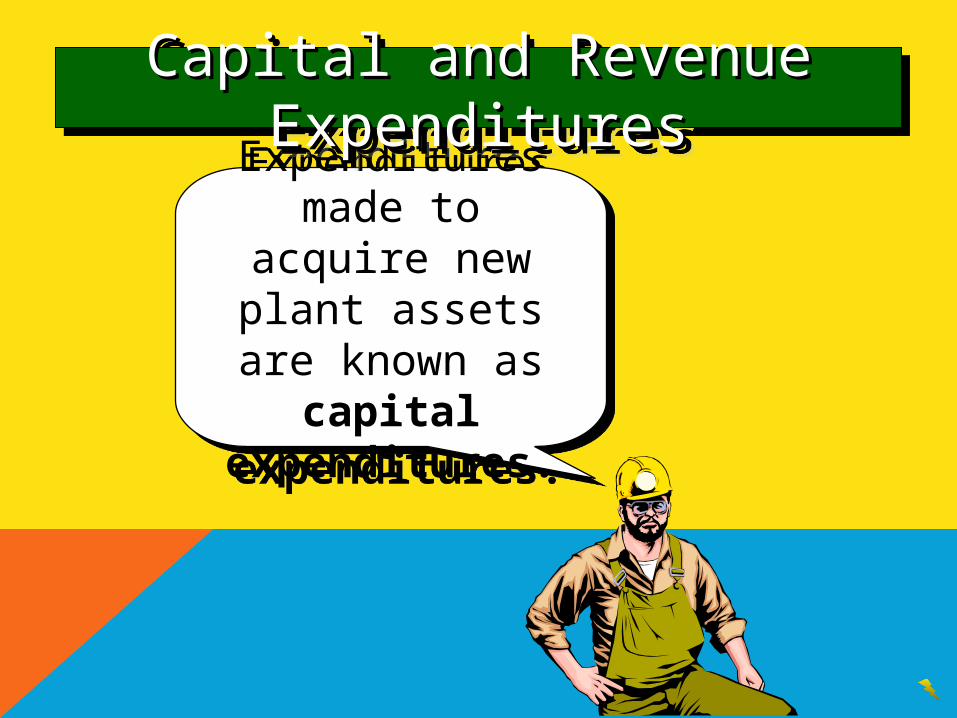
Expenditures made to acquire new plant
assets are known as capital expenditures.
Expenditures made to acquire new plant
assets are known as capital expenditures.
Capital and Revenue ExpendituresCapital and Revenue ExpendituresCapital and Revenue ExpendituresCapital and Revenue Expenditures
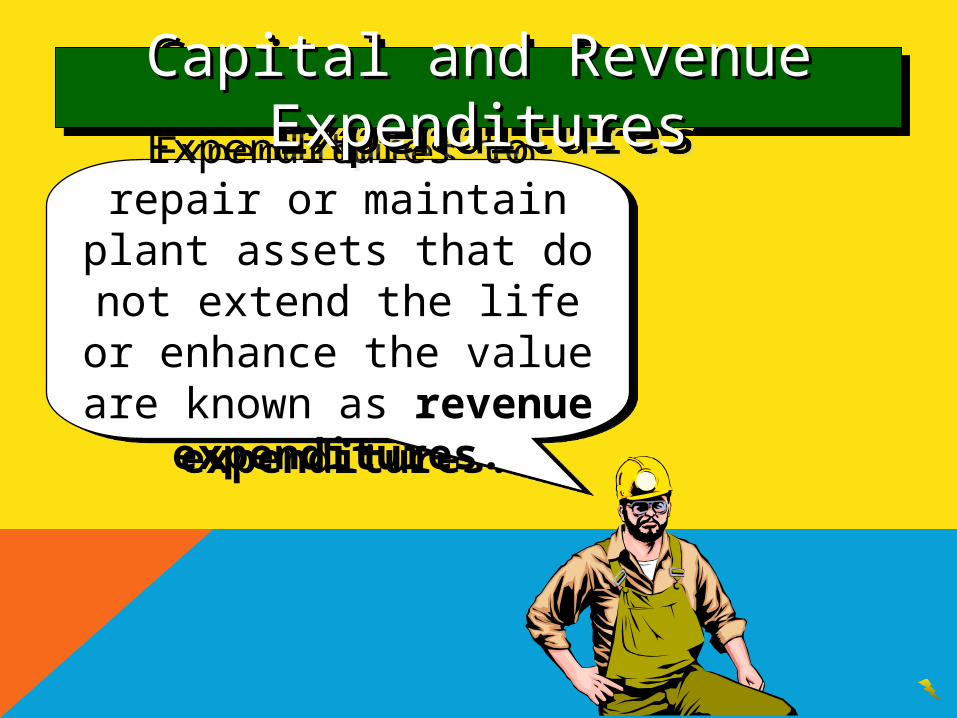
Expenditures to repair or maintain plant assets that do
not extend the life or enhance the value are known as revenue expenditures.
Expenditures to repair or maintain plant assets that do
not extend the life or enhance the value are known as revenue expenditures.
Capital and Revenue ExpendituresCapital and Revenue ExpendituresCapital and Revenue ExpendituresCapital and Revenue Expenditures
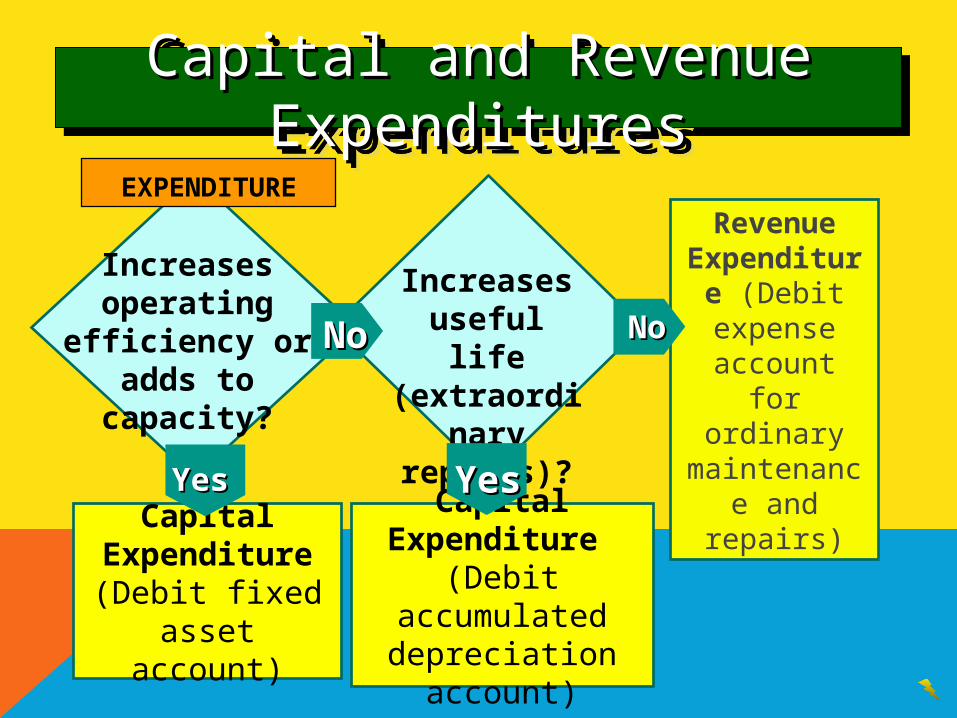
EXPENDITURE
Increases operating
efficiency or adds to capacity?
Capital Expenditure
(Debit fixed asset account)
YesYes
Capital and Revenue ExpendituresCapital and Revenue ExpendituresCapital and Revenue ExpendituresCapital and Revenue Expenditures
Increases useful life
(extraordinary repairs)?
NoNo
Capital Expenditure (Debit accumulated
depreciation account)
YesYes
Revenue Expenditure
(Debit expense account for
ordinary maintenance and repairs)
NoNo
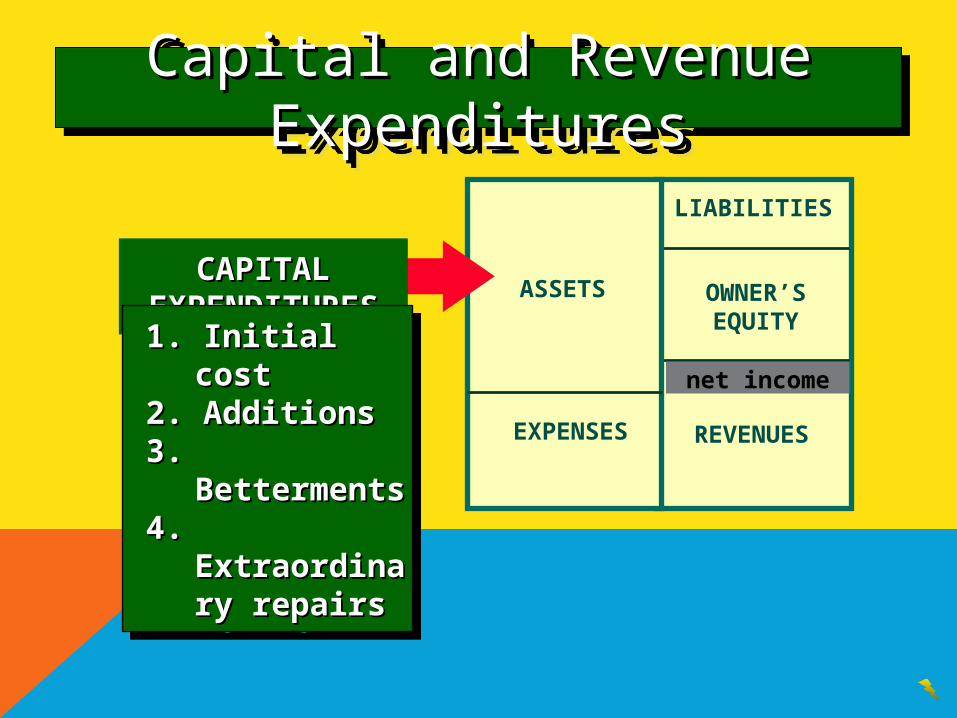
LIABILITIES
OWNER’SEQUITY
REVENUES
ASSETS
EXPENSES
CAPITAL CAPITAL EXPENDITURESEXPENDITURES
1. Initial cost1. Initial cost2. Additions2. Additions3. Betterments3. Betterments4. Extraordinary 4. Extraordinary
repairsrepairs
1. Initial cost1. Initial cost2. Additions2. Additions3. Betterments3. Betterments4. Extraordinary 4. Extraordinary
repairsrepairs
net income
Capital and Revenue ExpendituresCapital and Revenue ExpendituresCapital and Revenue ExpendituresCapital and Revenue Expenditures
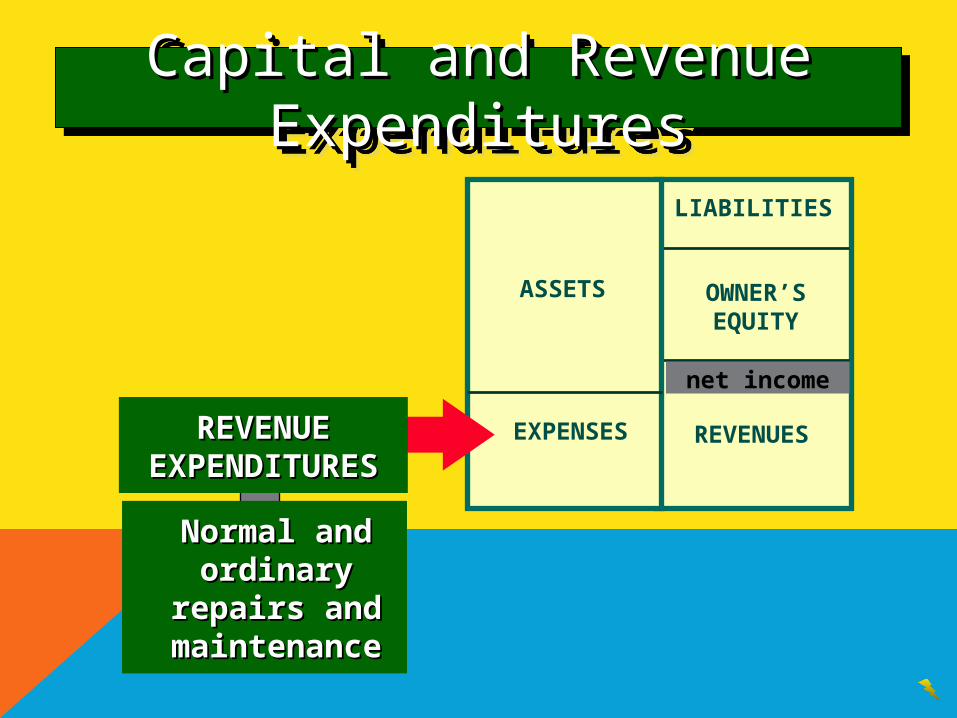
LIABILITIES
OWNER’SEQUITY
REVENUES
ASSETS
EXPENSES
net income
Normal and Normal and ordinary repairs ordinary repairs and maintenanceand maintenance
REVENUE REVENUE EXPENDITURESEXPENDITURES
Capital and Revenue ExpendituresCapital and Revenue ExpendituresCapital and Revenue ExpendituresCapital and Revenue Expenditures
ACCOUNTING FOR FIXED ASSET ACCOUNTING FOR FIXED ASSET DISPOSALSDISPOSALSACCOUNTING FOR FIXED ASSET ACCOUNTING FOR FIXED ASSET DISPOSALSDISPOSALS
When fixed assets lose their usefulness they may be disposed of in one of the following ways:
1. discarded,2. sold, or3. traded (exchanged) for similar assets.
Required entries will vary with type of disposition and circumstances, but the following entries will always be necessary:
An asset account must be credited to remove the asset from the ledger, and the related Accumulated Depreciation account must be debited to remove it’s balance from the ledger.
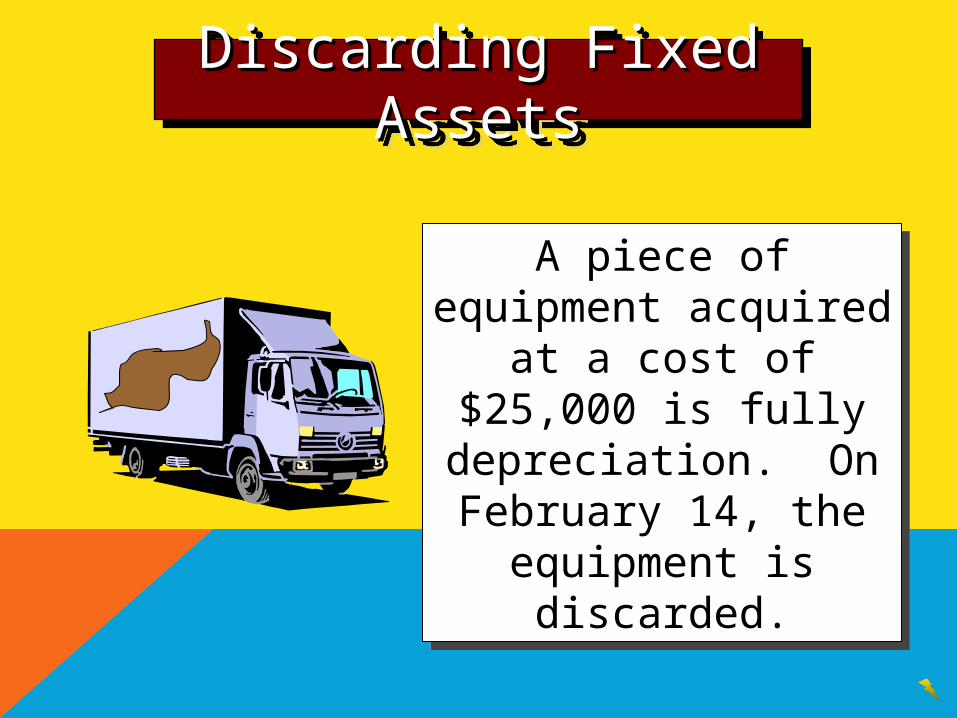
A piece of equipment acquired at a cost of
$25,000 is fully depreciation. On February 14, the
equipment is discarded.
A piece of equipment acquired at a cost of
$25,000 is fully depreciation. On February 14, the
equipment is discarded.
Discarding Fixed AssetsDiscarding Fixed AssetsDiscarding Fixed AssetsDiscarding Fixed Assets
Discarding Fixed AssetsDiscarding Fixed AssetsDiscarding Fixed AssetsDiscarding Fixed Assets
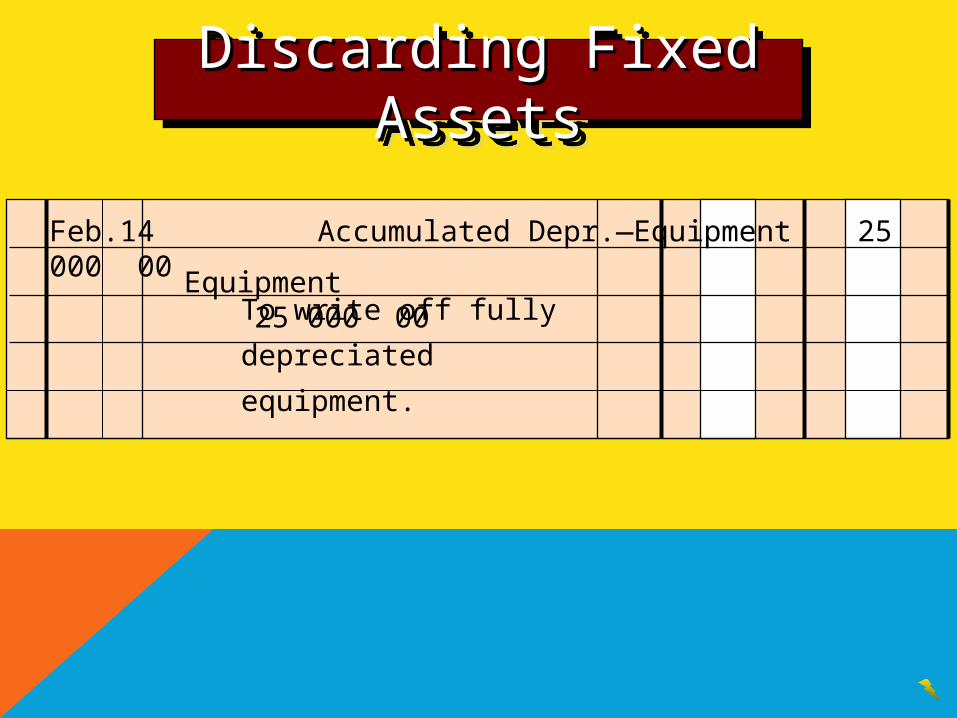
Feb. 14 Accumulated Depr.—Equipment 25 000 00
To write off fully depreciated
equipment.
Equipment 25 000 00
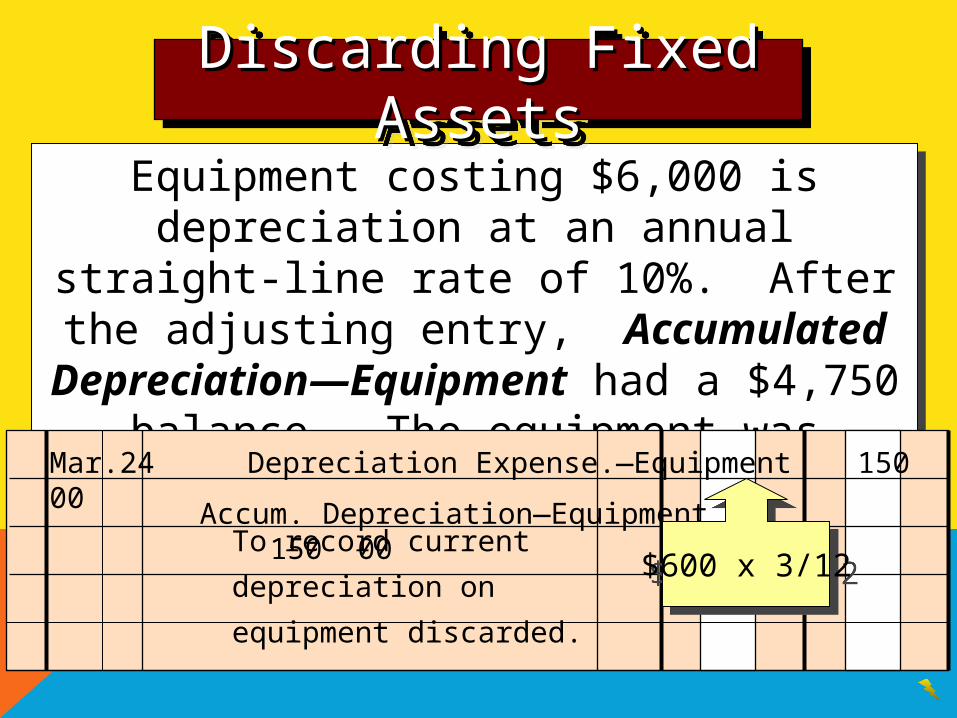
Equipment costing $6,000 is depreciation at an annual straight-line rate of 10%. After the
adjusting entry, Accumulated Depreciation—Equipment had a $4,750 balance. The equipment
was discarded on March 24.
Equipment costing $6,000 is depreciation at an annual straight-line rate of 10%. After the
adjusting entry, Accumulated Depreciation—Equipment had a $4,750 balance. The equipment
was discarded on March 24.
Mar. 24 Depreciation Expense.—Equipment 150 00
To record current depreciation
on equipment discarded.
Accum. Depreciation—Equipment 150 00
Discarding Fixed AssetsDiscarding Fixed AssetsDiscarding Fixed AssetsDiscarding Fixed Assets
$600 x 3/12$600 x 3/12
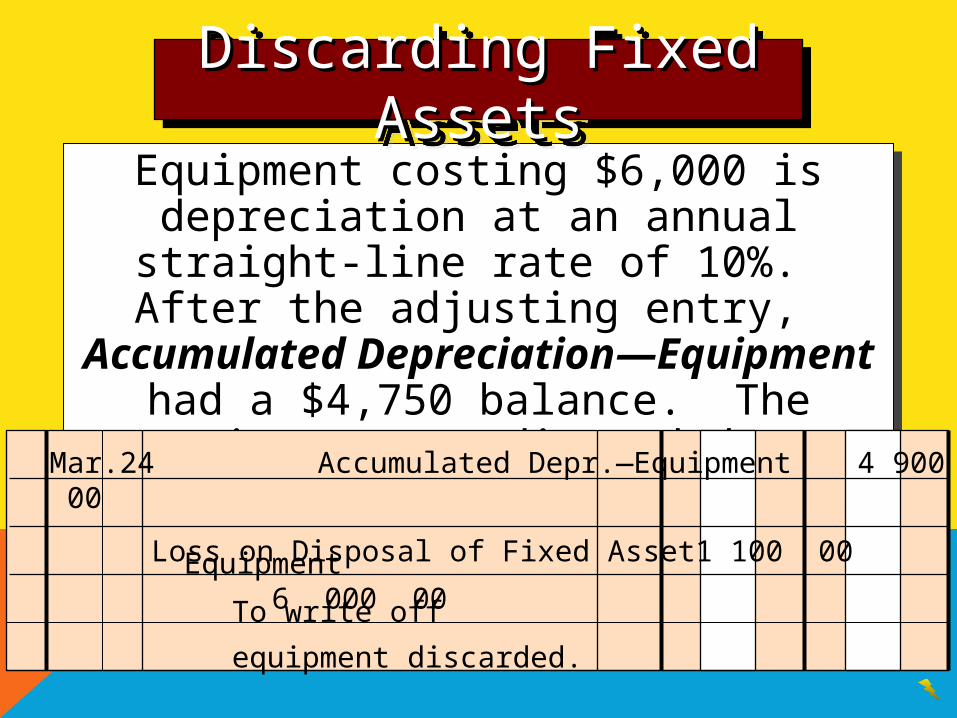
Equipment costing $6,000 is depreciation at an annual straight-line rate of 10%. After the
adjusting entry, Accumulated Depreciation—Equipment had a $4,750 balance. The equipment was discarded on March 24.
Equipment costing $6,000 is depreciation at an annual straight-line rate of 10%. After the
adjusting entry, Accumulated Depreciation—Equipment had a $4,750 balance. The equipment was discarded on March 24.
Mar. 24 Accumulated Depr.—Equipment 4 900 00
Loss on Disposal of Fixed Asset 1 100 00
To write off equipment
discarded.
Equipment 6 000 00
Discarding Fixed AssetsDiscarding Fixed AssetsDiscarding Fixed AssetsDiscarding Fixed Assets
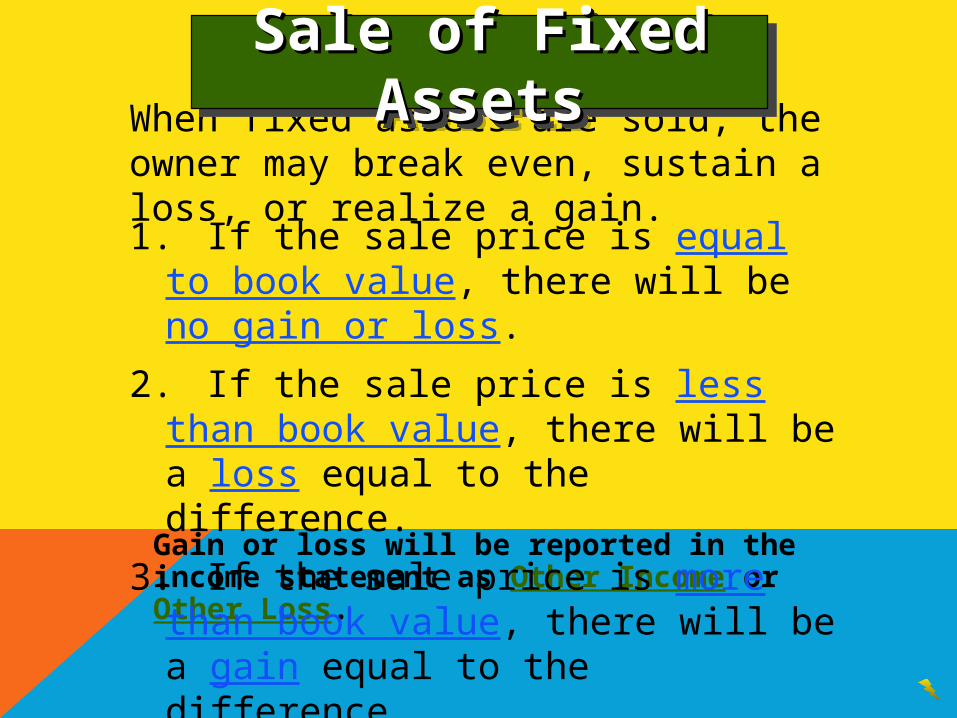
Gain or loss will be reported in the income statement as Other Income or Other Loss.
When fixed assets are sold, the owner may break even, sustain a loss, or realize a gain.1. If the sale price is equal to book value, there
will be no gain or loss.
2. If the sale price is less than book value, there will be a loss equal to the difference.
3. If the sale price is more than book value, there will be a gain equal to the difference.
Sale of Fixed AssetsSale of Fixed AssetsSale of Fixed AssetsSale of Fixed Assets
Sale of Fixed AssetsSale of Fixed AssetsSale of Fixed AssetsSale of Fixed Assets
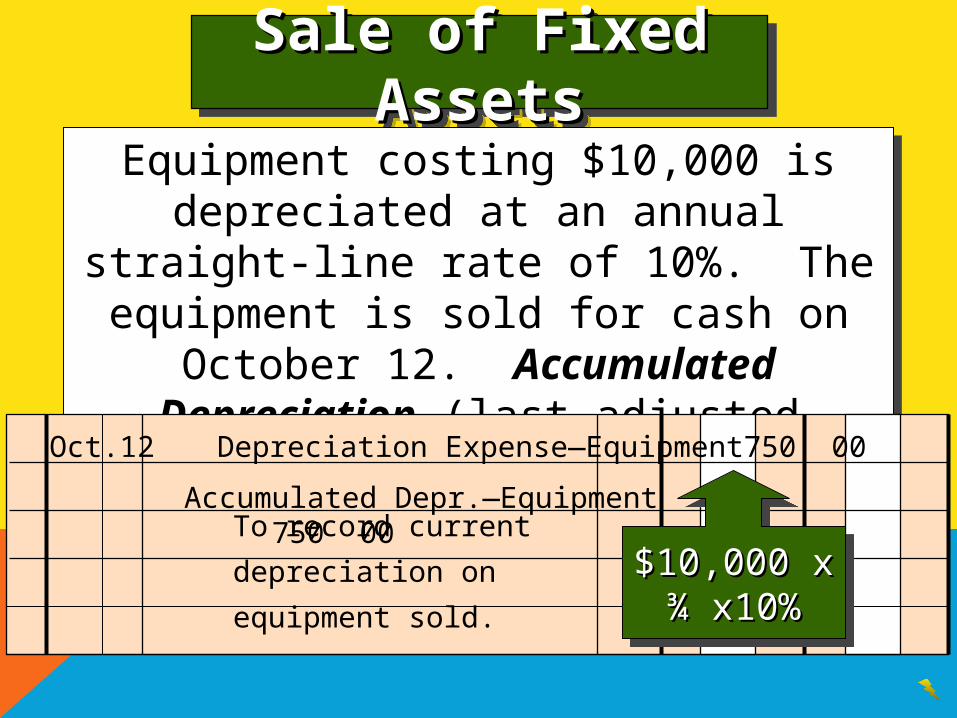
Equipment costing $10,000 is depreciated at an annual straight-line rate of 10%. The
equipment is sold for cash on October 12. Accumulated Depreciation (last adjusted December 31) has a balance of $7,000.
Equipment costing $10,000 is depreciated at an annual straight-line rate of 10%. The
equipment is sold for cash on October 12. Accumulated Depreciation (last adjusted December 31) has a balance of $7,000.
Oct. 12 Depreciation Expense—Equipment 750 00
To record current depreciation
on equipment sold.
Accumulated Depr.—Equipment 750 00
$10,000 x ¾ $10,000 x ¾ x10%x10%
$10,000 x ¾ $10,000 x ¾ x10%x10%
Sale of Fixed AssetsSale of Fixed AssetsSale of Fixed AssetsSale of Fixed Assets
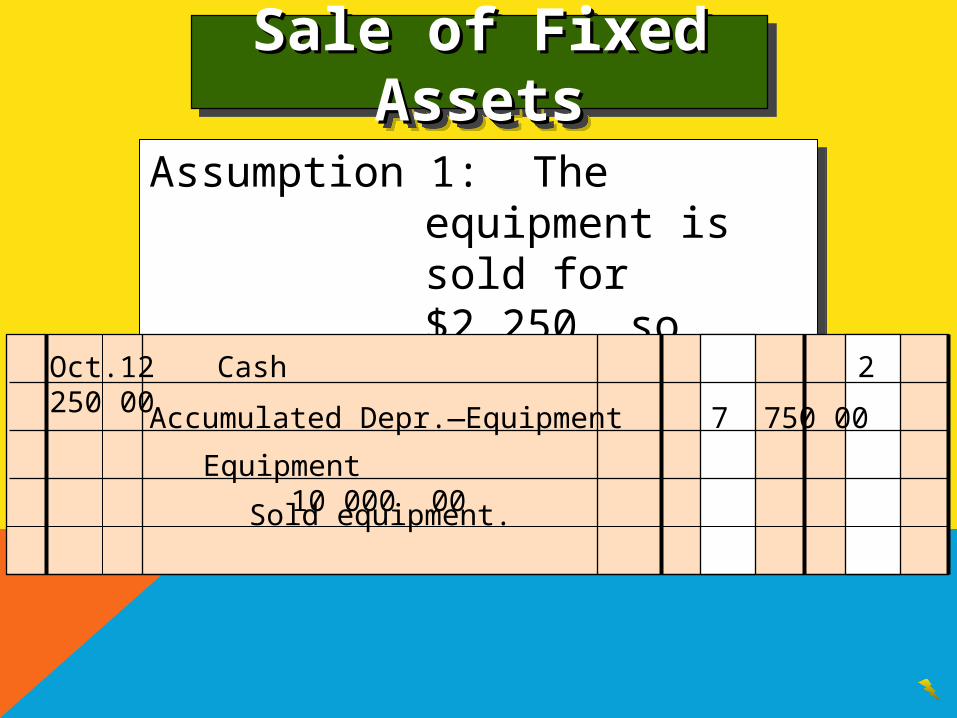
Assumption 1: The equipment is sold for $2,250, so there is no gain or loss.
Assumption 1: The equipment is sold for $2,250, so there is no gain or loss.
Oct. 12 Cash 2 250 00
Sold equipment.
Accumulated Depr.—Equipment 7 750 00
Equipment 10 000 00
Sale of Fixed AssetsSale of Fixed AssetsSale of Fixed AssetsSale of Fixed Assets
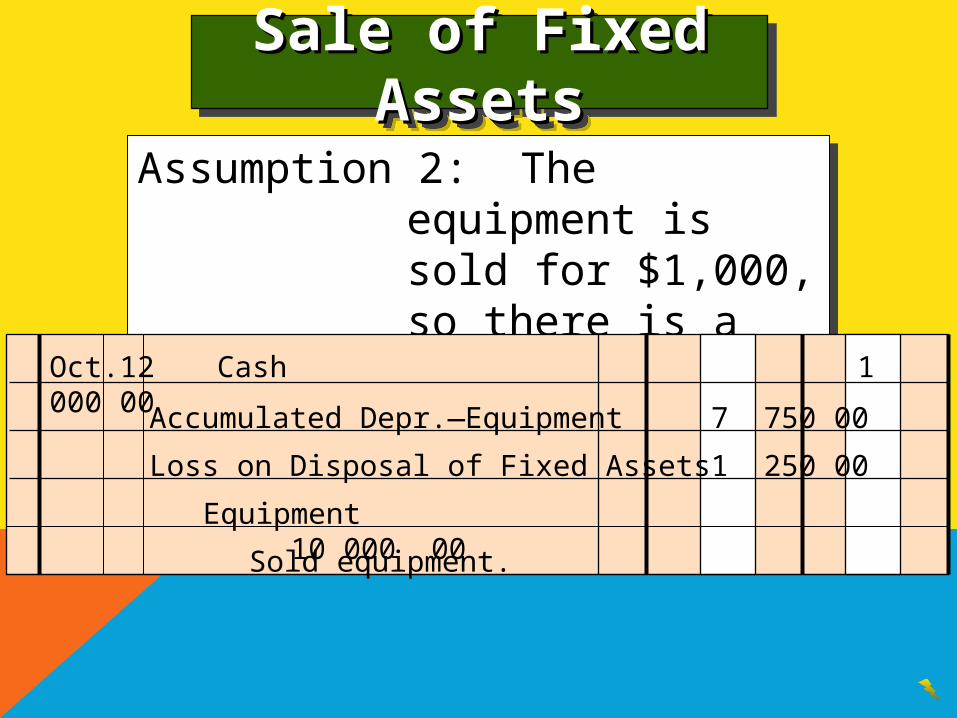
Assumption 2: The equipment is sold for $1,000, so there is a loss of $1,250.
Assumption 2: The equipment is sold for $1,000, so there is a loss of $1,250.
Oct. 12 Cash 1 000 00
Sold equipment.
Accumulated Depr.—Equipment 7 750 00
Equipment 10 000 00
Loss on Disposal of Fixed Assets 1 250 00
Sale of Fixed AssetsSale of Fixed AssetsSale of Fixed AssetsSale of Fixed Assets
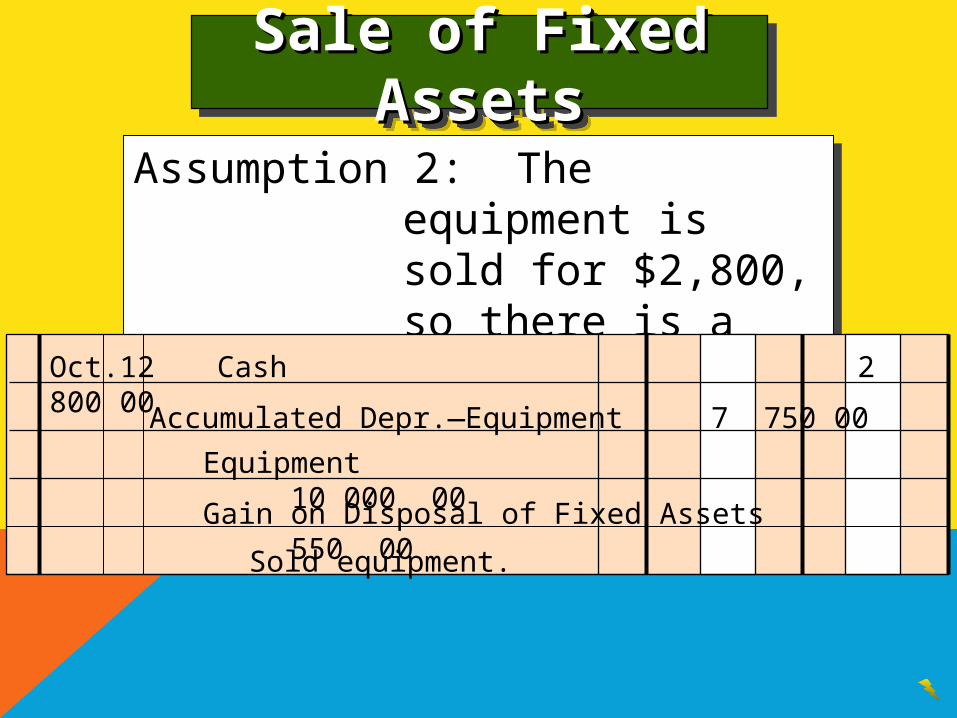
Assumption 2: The equipment is sold for $2,800, so there is a gain of $550.
Assumption 2: The equipment is sold for $2,800, so there is a gain of $550.
Sold equipment.
Equipment 10 000 00 Gain on Disposal of Fixed Assets 550 00
Accumulated Depr.—Equipment 7 750 00
Oct. 12 Cash 2 800 00
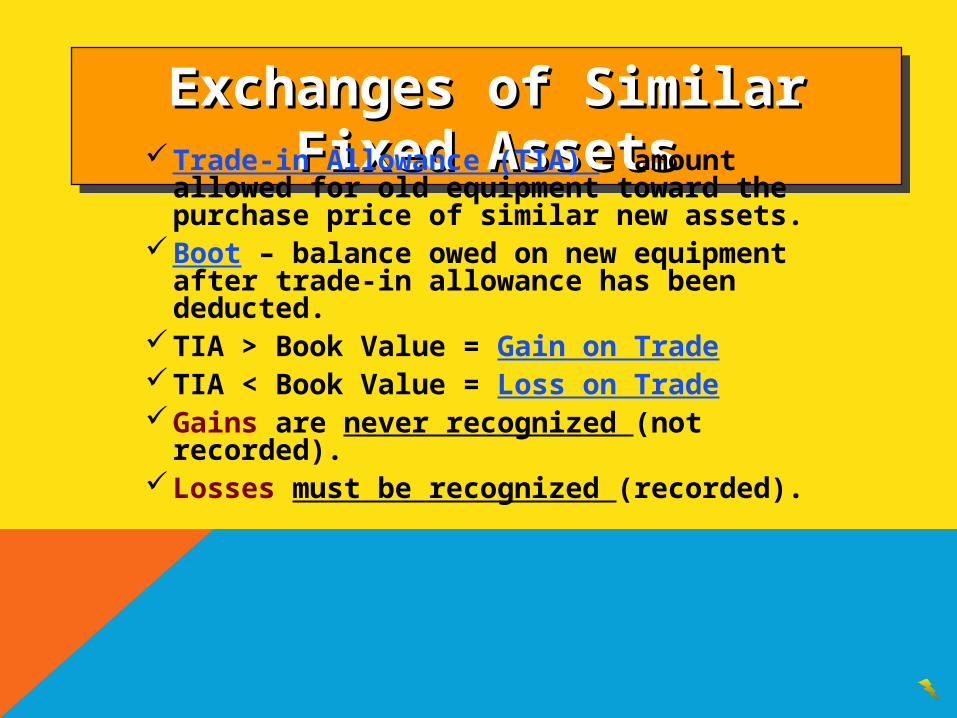
Exchanges of Similar Fixed AssetsExchanges of Similar Fixed AssetsExchanges of Similar Fixed AssetsExchanges of Similar Fixed AssetsTrade-in Allowance (TIA) – amount
allowed for old equipment toward the purchase price of similar new assets.
Boot – balance owed on new equipment after trade-in allowance has been deducted.
TIA > Book Value = Gain on TradeTIA < Book Value = Loss on TradeGains are never recognized (not recorded).Losses must be recognized (recorded).
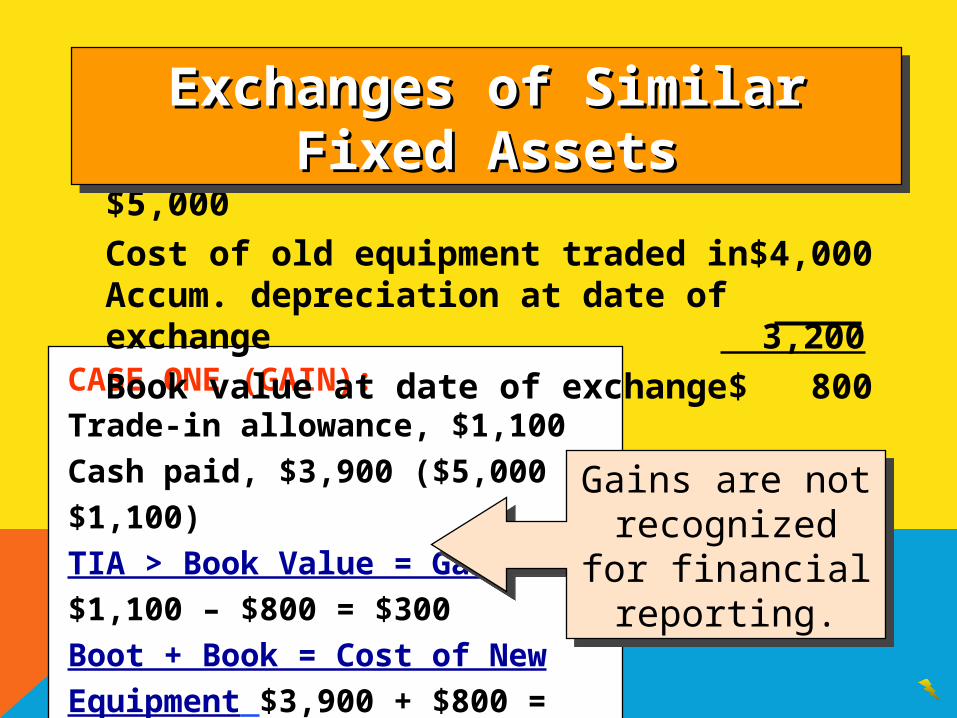
CASE ONE (GAIN):
Trade-in allowance, $1,100
Cash paid, $3,900 ($5,000 – $1,100)
TIA > Book Value = Gain
$1,100 – $800 = $300
Boot + Book = Cost of New Equipment
$3,900 + $800 = $4,700
List price of new equipment acquired $5,000
Cost of old equipment traded in $4,000Accum. depreciation at date of exchange 3,200
Book value at date of exchange $ 800
Exchanges of Similar Fixed AssetsExchanges of Similar Fixed AssetsExchanges of Similar Fixed AssetsExchanges of Similar Fixed Assets
Gains are not recognized for
financial reporting.
Gains are not recognized for
financial reporting.
Exchanges of Similar Fixed AssetsExchanges of Similar Fixed AssetsExchanges of Similar Fixed AssetsExchanges of Similar Fixed Assets
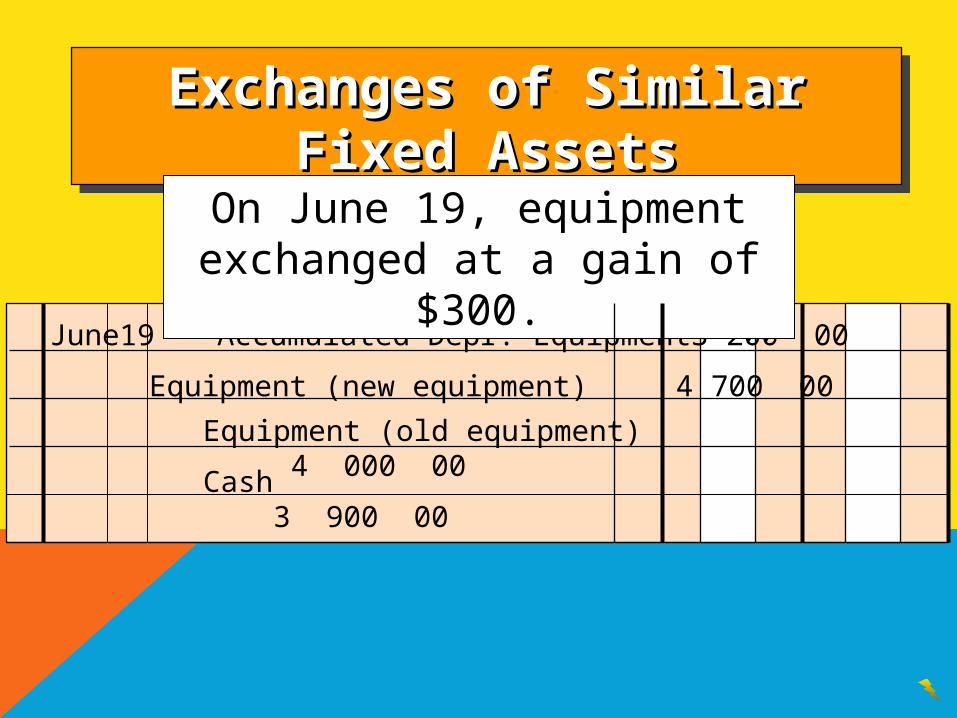
June 19 Accumulated Depr.—Equipment 3 200 00
Equipment (new equipment) 4 700 00
Equipment (old equipment) 4 000 00Cash 3 900 00
On June 19, equipment exchanged at a gain of $300.
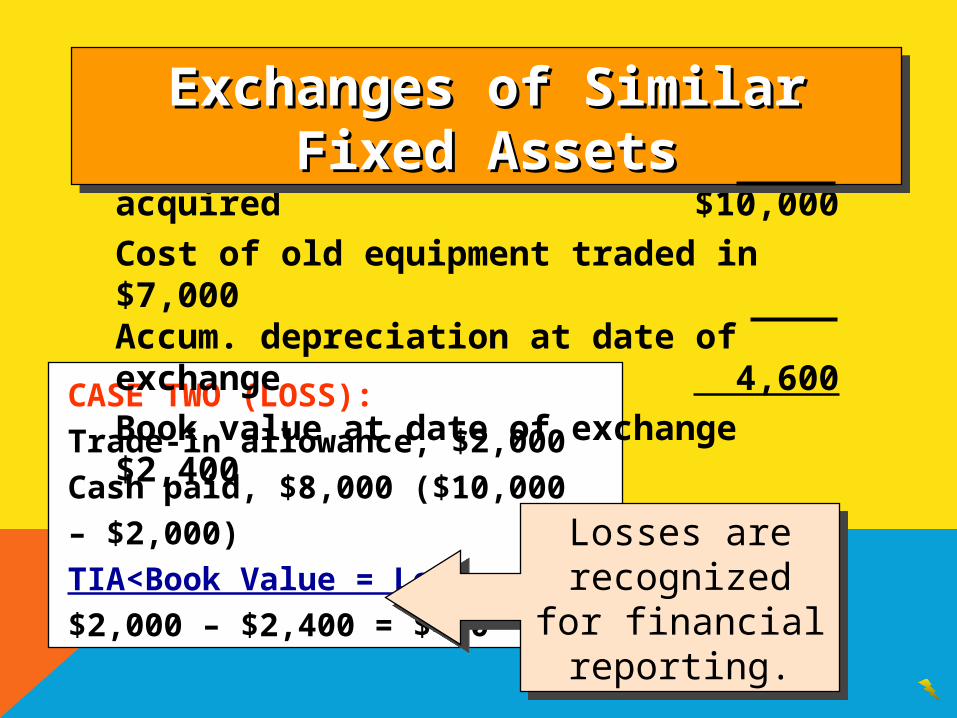
CASE TWO (LOSS):
Trade-in allowance, $2,000
Cash paid, $8,000 ($10,000 – $2,000)
TIA<Book Value = Loss
$2,000 – $2,400 = $400
List price of new equipment acquired $10,000
Cost of old equipment traded in $7,000Accum. depreciation at date of exchange 4,600
Book value at date of exchange $2,400
Exchanges of Similar Fixed AssetsExchanges of Similar Fixed AssetsExchanges of Similar Fixed AssetsExchanges of Similar Fixed Assets
Losses are recognized for
financial reporting.
Losses are recognized for
financial reporting.
Exchanges of Similar Fixed AssetsExchanges of Similar Fixed AssetsExchanges of Similar Fixed AssetsExchanges of Similar Fixed Assets
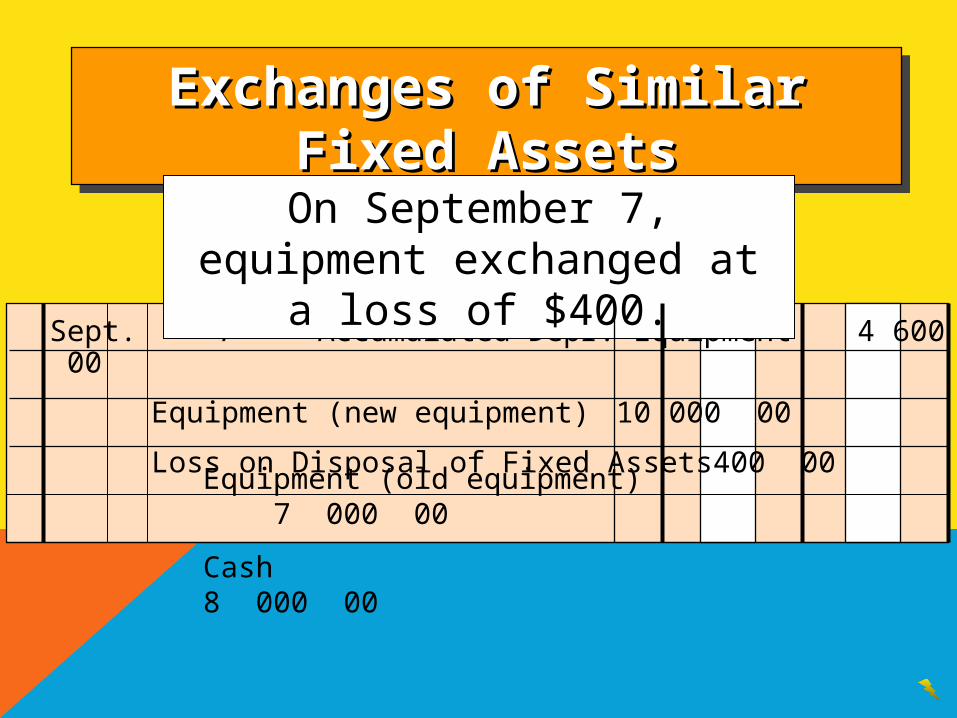
Sept. 7 Accumulated Depr.—Equipment 4 600 00
Equipment (new equipment) 10 000 00
Loss on Disposal of Fixed Assets 400 00
On September 7, equipment exchanged at a loss of $400.
Equipment (old equipment) 7 000 00
Cash8 000 00
Natural Resources and Natural Resources and DepletionDepletion
Natural Resources and Natural Resources and DepletionDepletion
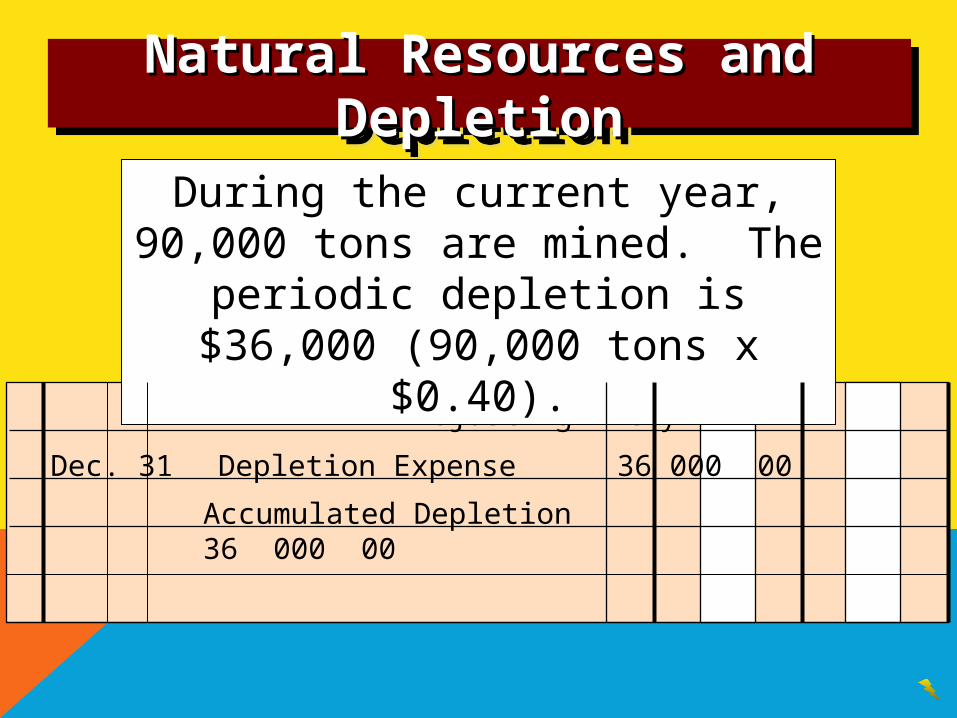
Depletion is the process of transferring the cost of natural
resources to an expense account.
Depletion is the process of transferring the cost of natural
resources to an expense account.
Natural Resources and DepletionNatural Resources and DepletionNatural Resources and DepletionNatural Resources and Depletion
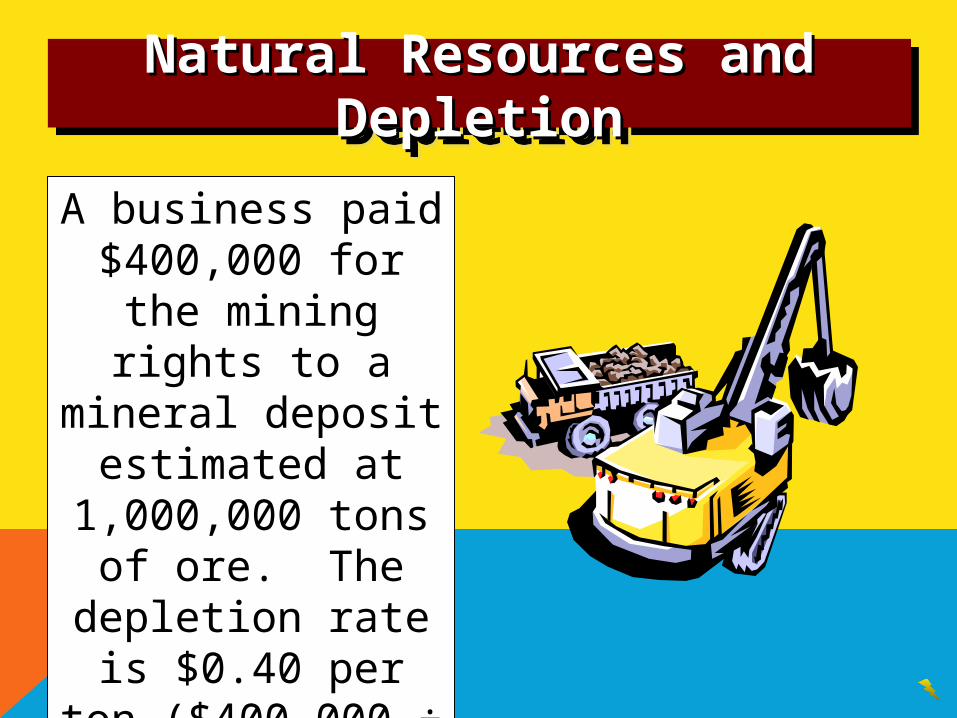
A business paid $400,000 for the mining rights to a mineral deposit
estimated at 1,000,000 tons of ore. The
depletion rate is $0.40 per ton ($400,000 ÷
1,000,000 tons).
Natural Resources and DepletionNatural Resources and DepletionNatural Resources and DepletionNatural Resources and Depletion
Adjusting Entry
Accumulated Depletion36 000 00
During the current year, 90,000 tons are mined. The periodic depletion is $36,000 (90,000 tons x $0.40).
Dec. 31 Depletion Expense 36 000 00
DateDate DescriptionDescription DebitDebit CreditCredit
Intangible Assets and AmortizationIntangible Assets and Amortization
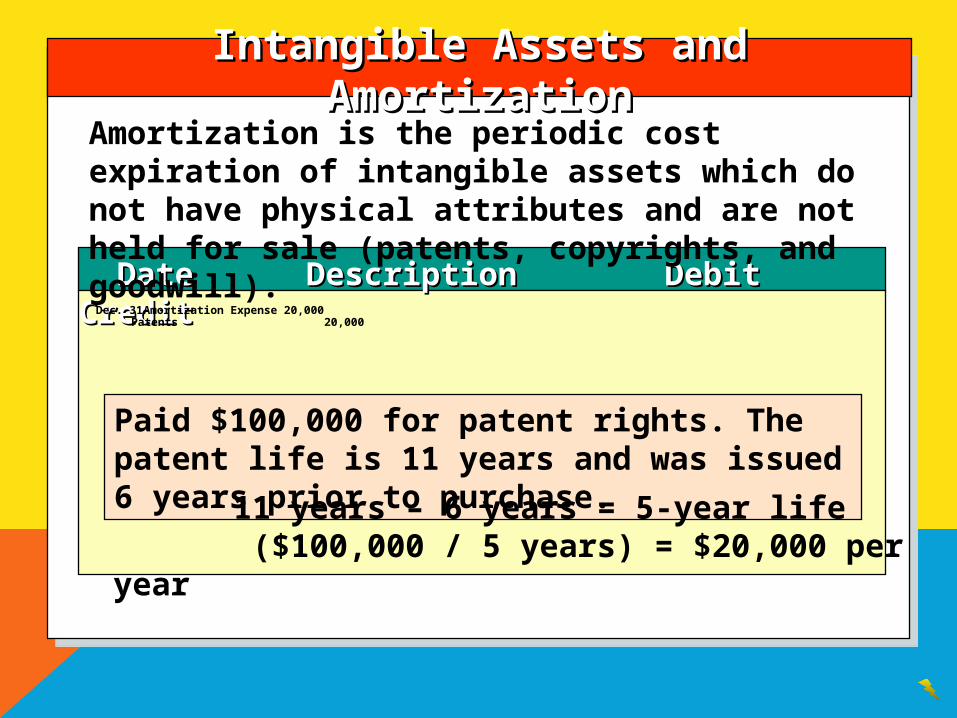
Dec. 31 Amortization Expense 20,000Patents 20,000
Paid $100,000 for patent rights. The patent life is 11 years and was issued 6 years prior to purchase.
Amortization is the periodic cost expiration of intangible assets which do not have physical attributes and are not held for sale (patents, copyrights, and goodwill).
11 years – 6 years = 5-year life ($100,000 / 5 years) = $20,000 per year
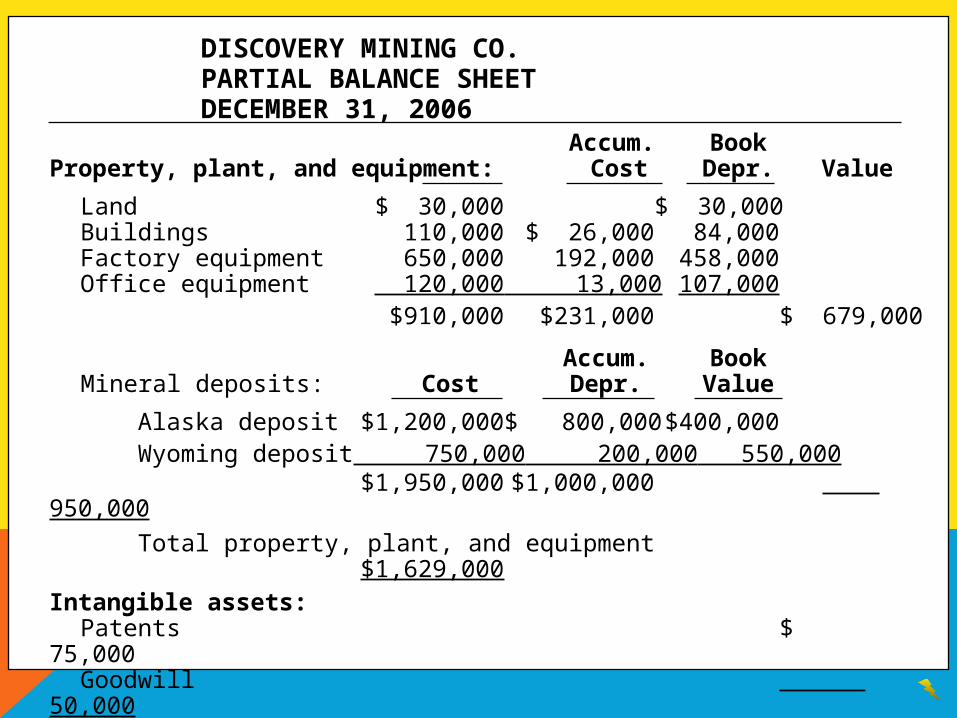
Alaska deposit $1,200,000 $ 800,000 $400,000 Wyoming deposit 750,000 200,000 550,000 $1,950,000 $1,000,000 950,000
Total property, plant, and equipment $1,629,000
Intangible assets:Patents $ 75,000Goodwill 50,000 Total intangible assets $ 125,000
DISCOVERY MINING CO.PARTIAL BALANCE SHEETDECEMBER 31, 2006
Accum. BookProperty, plant, and equipment: Cost Depr. Value
Land $ 30,000 $ 30,000Buildings 110,000 $ 26,000 84,000Factory equipment 650,000 192,000 458,000Office equipment 120,000 13,000 107,000
$910,000 $231,000 $ 679,000
Accum. Book Mineral deposits: Cost Depr. Value
Ratio of Fixed Assets to Long-Term LiabilitiesRatio of Fixed Assets to Long-Term Liabilities
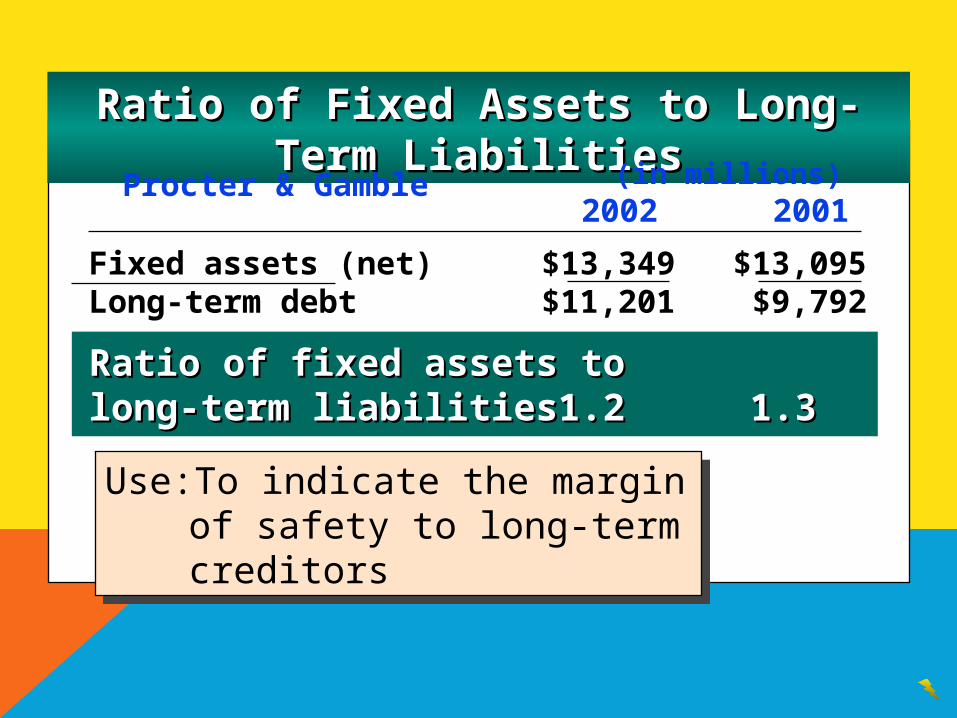
(in millions)2002 2001
Procter & Gamble
Fixed assets (net) $13,349 $13,095Long-term debt $11,201 $9,792
Ratio of fixed assets toRatio of fixed assets tolong-term liabilitieslong-term liabilities 1.2 1.2 1.3 1.3
Use: To indicate the margin of safety to long-term creditors
Use: To indicate the margin of safety to long-term creditors
The EndThe End
Chapter 10Chapter 10