chapter 8 environmental concerns -...
TRANSCRIPT
CHAPTER 8
AMBIENT AIR QUALITY LEVELS IN DELHI: 1997-2011
ENVIRONMENTAL CONCERNS
Statement 8.1
Rapid rise in population and speedy economic development has also raised the concern for the environmental degradation. The economics of environmental pollution, depletion and degradation of resources did not get as much attention as compared to the issues of growth and development. This chapter dwells upon the various dimension of pollution including sources, past and present status and efforts made to reduce the pollution level in Delhi. Sustained efforts by the Government of Delhi along with the cooperation of all stakeholders, Delhi is showing signs of improvement in reducing / controlling the pollution level since past few years.
2. Ambient Air Quality
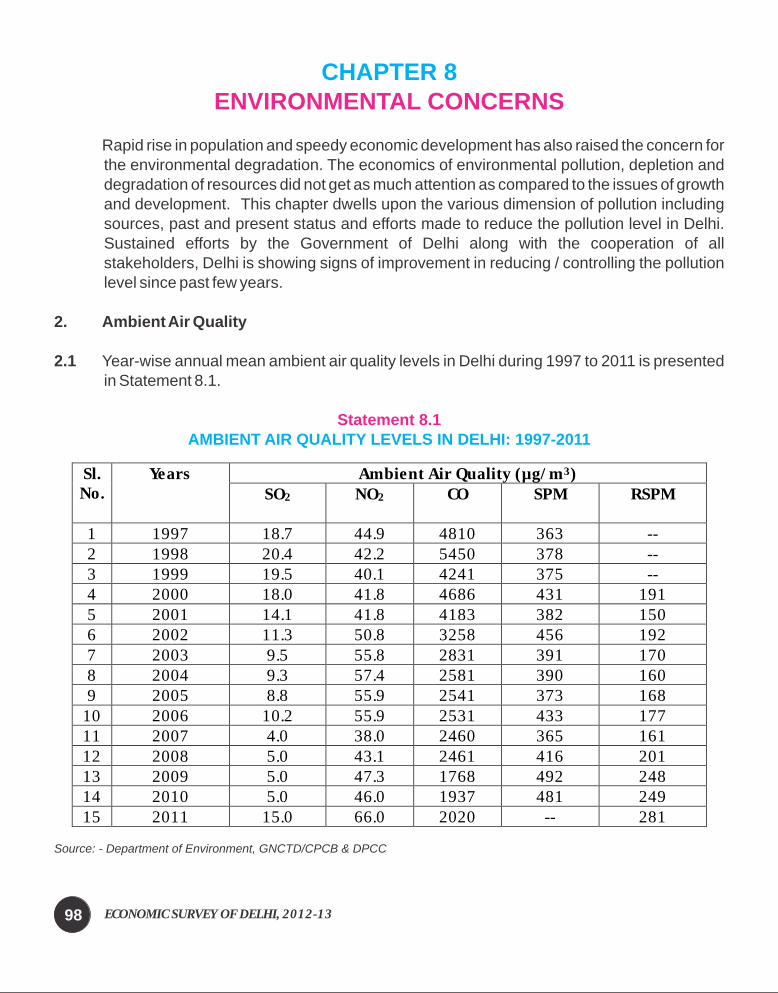
2.1 Year-wise annual mean ambient air quality levels in Delhi during 1997 to 2011 is presented in Statement 8.1.
Source: - Department of Environment, GNCTD/CPCB & DPCC
Sl. No.
Years Ambient Air Quality (µg/m3) SO2 NO2 CO SPM RSPM
1 1997 18.7 44.9 4810 363 -- 2 1998 20.4 42.2 5450 378 -- 3 1999 19.5 40.1 4241 375 -- 4 2000 18.0 41.8 4686 431 191 5 2001 14.1 41.8 4183 382 150 6 2002 11.3 50.8 3258 456 192 7 2003 9.5 55.8 2831 391 170 8 2004 9.3 57.4 2581 390 160 9 2005 8.8 55.9 2541 373 168
10 2006 10.2 55.9 2531 433 177 11 2007 4.0 38.0 2460 365 161 12 2008 5.0 43.1 2461 416 201 13 2009 5.0 47.3 1768 492 248 14 2010 5.0 46.0 1937 481 249 15 2011 15.0 66.0 2020 -- 281
ECONOMIC SURVEY OF DELHI, 2012-1398
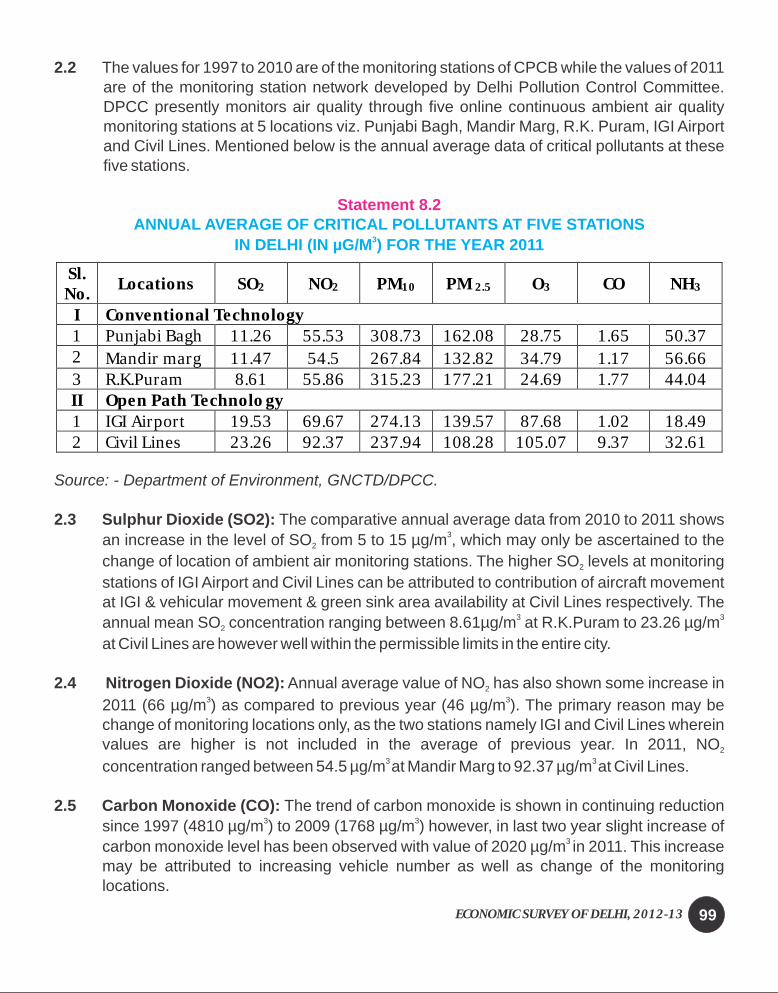
2.2 The values for 1997 to 2010 are of the monitoring stations of CPCB while the values of 2011 are of the monitoring station network developed by Delhi Pollution Control Committee. DPCC presently monitors air quality through five online continuous ambient air quality monitoring stations at 5 locations viz. Punjabi Bagh, Mandir Marg, R.K. Puram, IGI Airport and Civil Lines. Mentioned below is the annual average data of critical pollutants at these five stations.
Source: - Department of Environment, GNCTD/DPCC.
2.3 Sulphur Dioxide (SO2): The comparative annual average data from 2010 to 2011 shows 3
an increase in the level of SO from 5 to 15 µg/m , which may only be ascertained to the 2
change of location of ambient air monitoring stations. The higher SO levels at monitoring 2
stations of IGI Airport and Civil Lines can be attributed to contribution of aircraft movement at IGI & vehicular movement & green sink area availability at Civil Lines respectively. The
3 3annual mean SO concentration ranging between 8.61µg/m at R.K.Puram to 23.26 µg/m 2
at Civil Lines are however well within the permissible limits in the entire city.
2.4 Nitrogen Dioxide (NO2): Annual average value of NO has also shown some increase in 2
3 32011 (66 µg/m ) as compared to previous year (46 µg/m ). The primary reason may be change of monitoring locations only, as the two stations namely IGI and Civil Lines wherein values are higher is not included in the average of previous year. In 2011, NO 2
3 3 concentration ranged between 54.5 µg/m at Mandir Marg to 92.37 µg/m at Civil Lines.
2.5 Carbon Monoxide (CO): The trend of carbon monoxide is shown in continuing reduction 3 3since 1997 (4810 µg/m ) to 2009 (1768 µg/m ) however, in last two year slight increase of
3 carbon monoxide level has been observed with value of 2020 µg/m in 2011. This increase may be attributed to increasing vehicle number as well as change of the monitoring locations.
Statement 8.2ANNUAL AVERAGE OF CRITICAL POLLUTANTS AT FIVE STATIONS
3IN DELHI (IN µG/M ) FOR THE YEAR 2011
Sl. No.
Locations SO2 NO2 PM10 PM 2.5 O3 CO NH3
I Conventional Technology 1 Punjabi Bagh 11.26 55.53 308.73 162.08 28.75 1.65 50.37 2 Mandir marg 11.47 54.5 267.84 132.82 34.79 1.17 56.66 3 R.K.Puram 8.61 55.86 315.23 177.21 24.69 1.77 44.04 II Open Path Technolo gy 1 IGI Airport 19.53 69.67 274.13 139.57 87.68 1.02 18.49 2 Civil Lines 23.26 92.37 237.94 108.28 105.07 9.37 32.61
ECONOMIC SURVEY OF DELHI, 2012-13 99
2.6 Particulate Matter: Suspended Particular Matter (SPM) has been removed from the list of pollutants, which have prescribed standards. Now, two fractions of particulates PM and 10
3 3PM is measured. PM is showing slightly increasing trend 191µg/m in 2000 to 281 µg/m 2.5 10
in 2011. The increasing trend may be attributed to construction work and increasing number of vehicles. The inter-state movement of particulates and road re-suspension of
3dust may be the other reasons. The concentration of PM varied from 22.84 to 535 µg/m2.5
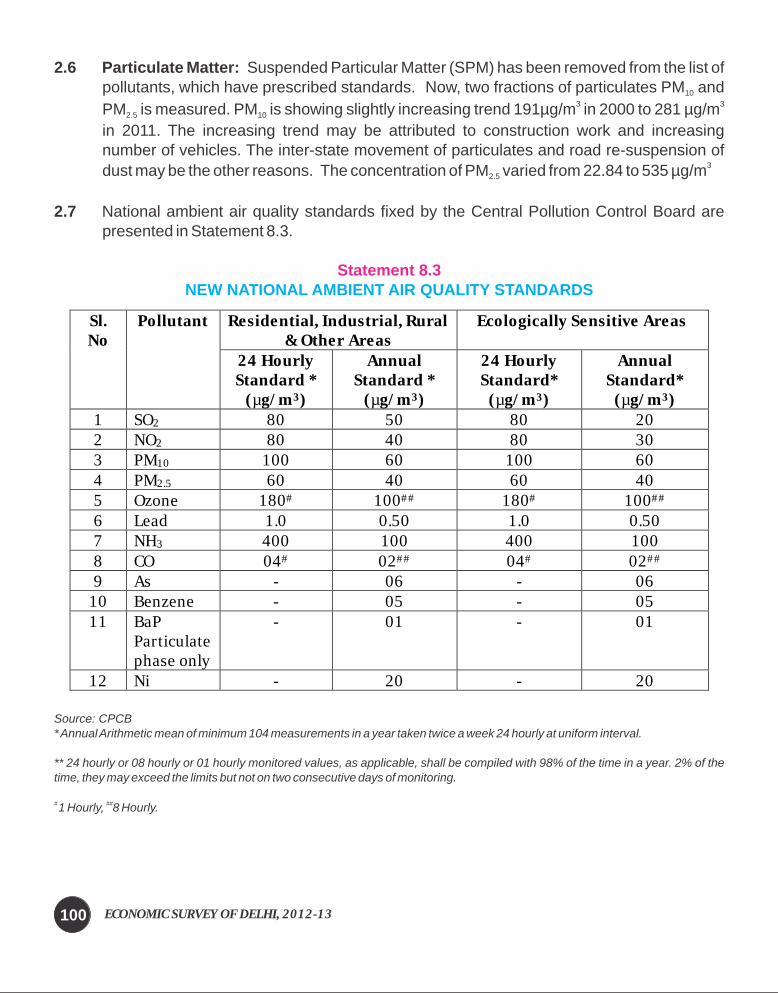
2.7 National ambient air quality standards fixed by the Central Pollution Control Board are presented in Statement 8.3.
Source: CPCB* Annual Arithmetic mean of minimum 104 measurements in a year taken twice a week 24 hourly at uniform interval.
** 24 hourly or 08 hourly or 01 hourly monitored values, as applicable, shall be compiled with 98% of the time in a year. 2% of the time, they may exceed the limits but not on two consecutive days of monitoring.
# ##1 Hourly, 8 Hourly.
Statement 8.3NEW NATIONAL AMBIENT AIR QUALITY STANDARDS
Sl. No
Pollutant Residential, Industrial, Rural & Other Areas
Ecologically Sensitive Areas
24 Hourly Standard *
(µg/m3)
Annual Standard *
(µg/m3)
24 Hourly Standard*
(µg/m3)
Annual Standard*
(µg/m3) 1 SO2 80 50 80 20 2 NO2 80 40 80 30 3 PM10 100 60 100 60 4 PM2.5 60 40 60 40 5 Ozone 180# 100## 180# 100## 6 Lead 1.0 0.50 1.0 0.50 7 NH3 400 100 400 100 8 CO 04# 02## 04# 02## 9 As - 06 - 06
10 Benzene - 05 - 05 11 BaP
Particulate phase only
- 01 - 01
12 Ni - 20 - 20
ECONOMIC SURVEY OF DELHI, 2012-13100
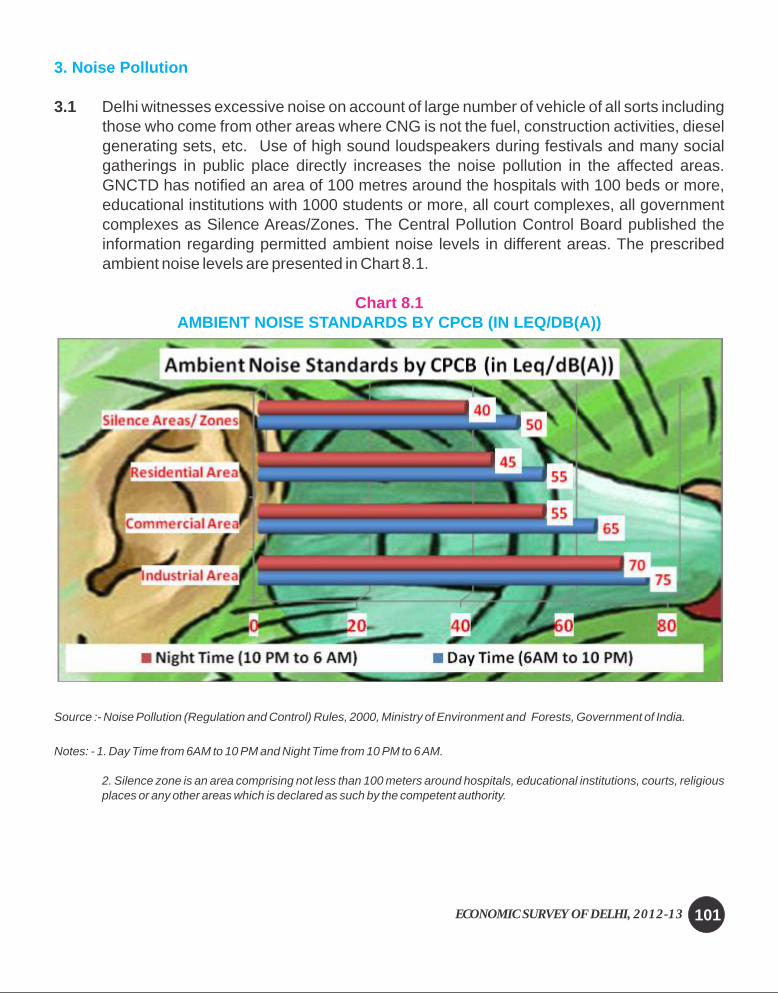
3. Noise Pollution
AMBIENT NOISE STANDARDS BY CPCB (IN LEQ/DB(A))
3.1 Delhi witnesses excessive noise on account of large number of vehicle of all sorts including those who come from other areas where CNG is not the fuel, construction activities, diesel generating sets, etc. Use of high sound loudspeakers during festivals and many social gatherings in public place directly increases the noise pollution in the affected areas. GNCTD has notified an area of 100 metres around the hospitals with 100 beds or more, educational institutions with 1000 students or more, all court complexes, all government complexes as Silence Areas/Zones. The Central Pollution Control Board published the information regarding permitted ambient noise levels in different areas. The prescribed ambient noise levels are presented in Chart 8.1.
Source :- Noise Pollution (Regulation and Control) Rules, 2000, Ministry of Environment and Forests, Government of India.
Notes: - 1. Day Time from 6AM to 10 PM and Night Time from 10 PM to 6 AM.
2. Silence zone is an area comprising not less than 100 meters around hospitals, educational institutions, courts, religious places or any other areas which is declared as such by the competent authority.
Chart 8.1
ECONOMIC SURVEY OF DELHI, 2012-13 101
4. Water Pollution
ANNUAL AVERAGE WATER QUALITY OF RIVER YAMUNA IN DELHI FROM APRIL 2011 TO MARCH 2012
4.1 The 48 kilometer stretch of the Yamuna River in Delhi is highly polluted due to the flow of untreated sewage and also the discharge of inadequate treated industrial effluents.
l DPCC has been conducting monthly water quality monitoring of river Yamuna (at 9 locations) and major drains (24 drains) falling into river Yamuna. Statement 8.4 indicates annual average water quality of River Yamuna from April 2011 till Match 2012. Recent water quality monitoring reports of river Yamuna indicate that the water quality parameters BOD & DO, are in the desirable/prescribed norms, with respect to Water Quality criteria of “C” class, at Palla, which is upstream of Wazirabad Barrage. However, the water quality of River Yamuna at the downstream of Wazirabad barrage after confluence of Nazafgarh Drain is not meeting the desirable/ prescribed norms.
l The annual average of DO has ranged from 0.7mg/l at Shahadra (Downstream) to 7.6 mg/l at Palla. The annual average of BOD has ranged from 2.07mg/l at Palla to 54.25mg/l at Khajuri Pantoolpul. The water quality standards for DO and BOD as per CPCB norms are 4mg/l and 3mg/l respectively for class 'C' of river water. The water quality monitoring results in Delhi stretch clearly indicates river water is grossly polluted.
Source: - Department of Environment, GNCTD/DPCC.
4.2 Water quality monitoring results of the drains indicate that most of the drains are not meeting the standards with respect to Bio-chemical Oxygen Demand(BOD), Chemical Oxygen Demand (COD) and Total Suspended Solids (TSS).
Statement 8.4
Sl. No.
Locations PH COD
(mg/l) BOD (mg/l) DO(mg/l)
1 Palla 8.06 19.50 2.07 7.61 2 Surghat 7.96 37.00 4.97 6.53 3 Khajuri Pantoolpul 7.74 212.67 54.25 NIL 4 Kudesia Ghat 7.69 90.00 21.50 2.17 5 ITO Bridge 7.59 150.00 35.25 1.10 6 Nizamuddin Bridge 7.68 75.33 19.17 2.77 7 Agra Canal Okhla 7.75 91.64 21.82 1.87 8 Shahdra (Downstream) 7.68 158.67 40.58 0.70 9 Agra Canal Jaitpur 7.74 73.09 19.09 1.90
ECONOMIC SURVEY OF DELHI, 2012-13102
Statement 8.5ANNUAL AVERAGE WATER QUALITY OF DRAINS AT
DIFFERENT LOCATIONS IN DELHI FROM APRIL 2011 TO MARCH 2012
* = "No Flow"Source: - Department of Environment, GNCTD/DPCC.
4.3 As sewerage system is not provided in unplanned habitats, the waste water generated in unplanned area is discharged into drains. Non-utilization of installed capacity (512.4 MGD) of sewage Treatment Plants is another important issue. Delhi Jal Board has prepared a plan to provide sewerage facilities in unauthorized colonies which are now regularized. This will however, be subject to feasibility. In such areas, about 1000 public toilets have been constructed with JBIC funds, in addition to public toilets being constructed by DUSIB under their plan scheme. Decentralized system of waste water treatment is the possible solution to this problem.
Sl. No.
Locations/ Drains PH TSS(mg/l) COD(mg/l) BOD(mg/l)
1 Najafgarh Drain 7.68 226.00 266.33 79.92 2 Metcalf House Drain 7.61 52.67 119.00 26.33 3 Khyber Pass Drain 7.70 45.00 53.83 12.33 4 Sweeper Colony Drain 7.47 137.78 188.00 51.00 5 Magazine Road Drain 7.43 342.89 452.83 149.58 6 ISBT Drain 7.60 102.44 261.67 71.33 7 Tonga Stand Drain 7.58 202.44 282.83 92.50 8 Moat Drain * * * * 9 Civil Mill Drain 7.62 219.33 349.09 110.45
10 Power House Drain 7.51 190.89 317.42 98.75 11 Sen Nursing Home Drain 7.53 269.56 377.00 131.08
12 Drain No. 12A * * * * 13 Drain No. 14 7.73 36.22 60.00 13.75 14 Barapulla Drain 7.60 162.89 190.00 62.67 15 Maharani Bagh Drain 7.49 188.00 305.25 99.08 16 Kalkaji Drain 7.63 44.00 89.33 27.22 17 Sarita Vihar Drain (Mathura
Road) 7.62 362.22 284.67 102.50 18 Tehkhand Drain 7.55 228.67 287.33 118.92
19 Tuglakabad Drain 7.75 230.67 186.33 62.75
20 Drain Near LPG Bottling Plant 7.74 137.00 257.82 86.45
21 Drain Near Sarita Vihar Bridge 7.67 89.33 190.67 54.92
22 Shahdara Drain 7.66 234.00 260.00 69.00
23 Sahibabad Drain 7.55 456.22 635.33 216.67
24 Indrapuri Drain 7.48 218.22 413.67 144.58
ECONOMIC SURVEY OF DELHI, 2012-13 103
4.4 Delhi Jal Board initiated the process of laying of interceptor sewers along 3 major drains (Najafgarh Drain, Supplementary Drain and Shahdara Drain). Sewage generated from the colonies will be trapped before reaching the major drains and the same would be diverted to the existing unutilized STPs/new STPs. At present 18 STPs are being monitored on monthly basis for the compliance of standards. Recent data of STPs shows that most of the STPs are meeting the standards.
4.5 One of the main sources of water pollution is the waste material discharged by industrial units. Waste materials like acids, alkalies, toxic metals, oil, grease, dyes, pesticides and even radioactive materials are poured into the drains by many industrial units. Some other important pollutants include polychlorinated biphenyl (PCB) compounds, lubricants, etc. The pollutants unloaded into the drains usually dissolve or remain suspended in water. Sometimes, they also accumulate on the bottom of the drains. All industrial units in Delhi have been directed to ensure linkage to conveyance system in 13 Common Effluent Treatment Plants (CETPs). 13 Common Effluent Treatment Plants (CETPs) are functioning at industrial areas of Lawrence Road, Wazirpur, Mangolpuri, Mayapuri, Nangloi,Badli, SMA, GTK, Okhla, Jhilmil, Narayana, Narela and Bawana. Recent data of CETPs shows that Lawrence Road, Okhla, Narela CETPs are not meeting standard w.r.t BOD mostly. These are also being checked for their water quality every month and necessary corrective measures also being ensured.
4.6 Delhi Pollution Control Committee, being pollution control statutory agency and regulator, collects samples of treated effluents from all operational STPs on monthly basis. Deficiencies and analysis reports are sent to Delhi Jal Board (DJB) for rectification so as to meet the norms stipulated.
5.1 The industrial waste water generated in Delhi is about 40 MGD. All industrial units have been directed to ensure linkage to conveyance system in Common Effluent Treatment Plants (CETPs). These are also being checked for their water quality every month and necessary corrective measures also being ensured. More than 1400 industrial units have installed ETPs to treat industrial wastewater, and thereafter it is sent to CETPs for further treatment.
5.2 Apart from collecting treated effluent samples from all operational CETPs, detailed inspections are carried out on quarterly basis. Deficiencies are communicated to respective CETPs for rectification.
5. Industrial Waste Water
ECONOMIC SURVEY OF DELHI, 2012-13104
6. Vehicular Pollution
7. Solid Waste
8. Bio-Medical Waste
The number of vehicles registered in Delhi has increased from 24.32 lakh in 1994-95 to more than 74 lakh in March 2012. The highest increase observed in Taxis at 416.47 per cent from 13511 in 2004-05 to 69780 in 2011-12. During the same period, the percentage of increase was observed in cars and jeeps, motor cycles and scooters, auto rickshaws, buses and goods vehicles at 63.67 per cent, 63.30 per cent, 64.37 per cent, 164.21 per cent and 62.35 per cent respectively. This has automatically enhanced the pollution levels of Delhi by the emission of pollutants by these vehicles.
7.1 Solid waste includes commercial and residential waste generated in municipal or notified areas and is governed by the Municipal Solid Wastes (Management and Handling) Rules, 2000. As per the data available with DPCC records, solid waste generation in Delhi was around 8500 TPD. This is slated to increase due to economic and population growth. 500-600 MGD sewage is also generated, which generates organic sludge. Municipal waste of Delhi is disposed in three landfill sites namely Bhalswa GT Road, Gazipur and Okhla.
7.2 Waste to Energy Plants: DPCC has granted temporary consent to operate & authorization to M/s Timarpur Okhla Waste Management Pvt. Ltd. for process of waste/ waste disposal facility of waste to energy at Okhla site for a period of 6 months for trial run. Another plant for generation of energy from municipal waste is being set up at Gazipur
Bio-medical waste means any waste, which generated during the diagnosis, treatment or immunization of human being or animals or in research activities and is governed by the Bio-Medical Waste (Management and Handling) Rules, 1998 and amended as to date. Government of NCT of Delhi in its notification dated 6th July, 1999 has authorized Delhi Pollution Control Committee (DPCC) to grant authorization for collection, reception, storage, treatment and disposal of bio medical waste. To implement the Bio Medical Waste Management Rules, 1998, Government of NCT of Delhi has also constituted an Advisory Committee and an Appellate Authority, in exercise of powers conferred under Bio Medical Rules. With the increase in the number of hospitals and nursing homes in Delhi, hospital waste has become another area of concern. In-house waste treatment facilities in terms of autoclave/ incinerators / shredders are available in major hospitals. While in small nursing homes, clinics and dispensaries are disposing off the waste through 'Operator of facility' who collects, treat, transport and dispose off the waste.
ECONOMIC SURVEY OF DELHI, 2012-13 105
9. Hazardous Waste
10. Electronic Waste
11. Measures to Combat Air Pollution
Hazardous waste means any waste which by reason of any of its physical, chemical, reactive, toxic, flammable, explosive or corrosive characteristics causes danger or is likely to cause danger to health or environment, and is governed by the Hazardous Wastes (Management and Handling) Rules, 1989 and amended to date. Approximately 2400 hazardous waste generating units have been listed in Delhi. Quantity of hazardous waste generated in Delhi is approximately 15000 -20000 tones / annum. Estimated quantity of hazardous waste oil / used oil is around 3000 KL / annum.
Electronic Waste, means any waste, which is generated due to product obsolescence and discarded electronic items, and may include data processing, telecommunications or entertainment in private households and businesses. The Ministry of Environment and Forest, Government of India has issued Electronic Waste Rules for handling electronic
stwaste which is effective from 1 May 2012.
11.1 The main source of air pollution in Delhi is vehicular exhaust. Therefore, a strategy for use of cleaner fuel, reduction in fuel consumption, efficient maintenance of engines and installation of pollution control devices was adopted.
11.2 Upto 50PPM sulphur content diesel has been made available in the City from April 2010.
11.3 500 Pollution under Control Certificate Centres have been linked on the website by March 2009 to generate daily reports for monitoring air emissions.
11.4 An amount of 116.04 Crore has been collected as Air Ambience Fund till March 2012 ( 2.79 crore till March 2008, 35.53 Crore in 2008-2009, 30.56 Crore in the 2009-2010, 20.47 Crore in 2010-2011 and 26.69 Crore in 2011-2012).
11.5 Till March 2012, 39.58 Crore ( 4.12 Crore in 2008-09, 14.00 Crore in 2009-10, 12.58 Crore in 2010-11 and 8.88 Crore in 2011-2012) has been spent from Air Ambience Fund for reimbursement of concession and DVAT on purchase of Battery Operated Vehicles (electric vehicles) in the City. With this concession, till March 2012, 212 REVA Cars and 46829 e-bikes have been sold in the City, which otherwise would have increased the number of petrol/ diesel emission vehicles.
11.6 VAT refund of 12.5 per cent allowed from Air Ambiance Fund for conversion of vehicles to clean fuel.
` `` ` `
`
` ` ` ``
ECONOMIC SURVEY OF DELHI, 2012-13106
11.7 It is estimated that air pollution generated from industrial activity in Delhi is about 20 per cent of total air pollution. Although several steps have been taken, industrial pollution may be reduced further. More than 1,300 industrial units that should not have been operating as per the MPD 2021 norms, have been closed. A scheme has been prepared to relocate industrial units that currently operate in residential areas. About 26,000 industrial plots have been allotted at new industrial estates being developed at Bawana, Narela and Bhorgarh industrial estates. Emission control system have been installed in about 600 industrial units.
11.8 All industries are being advised to control pollution from diesel generating sets. They have been asked to increase the stack height to a level of 2-3 metres above their building height and also take acoustic measures to reduce the noise level from diesel generating sets.
11.9 Mandatory DG sets norms of acoustic enclosures and stack height for 6000 Cell Phone Towers and 600 Nursing Homes being monitored closely. Encouragement to invertors in place of DG sets is also required.
11.10 The main pollutants from coal based thermal power plant are stack emissions, fly ash generation and fugitive emissions in coal handling. There are 2 Coal Based power plants namely Badarpur Thermal Power Station (705 MW), Rajghat Power Station (67.5x2 MW). Apart from this, there are 4 Gas Based Power Plants namely Pragati Power Station (330 MW), I.P. Gas Turbine Power Station (282 MW), Combined Cycle Power Station at Sector-11, Rohini, Delhi by NDPL (108 MW) & Pragati Power Station, Bawana (1500 MW)(partially at operational stage). Another 2 Gas Based Power Plants namely Pragati Power Corporation Ltd., Bamnauli (750 MW) & Badarpur Combined Cycle Power Plant (1050 MW) are proposed. IP Thermal Power Plant has closed its operations. Coal based thermal power plants located in Delhi have installed pollution control systems and are
3adhering to the national standards of 150 mg/Nm for which Thermal Power plants are in process of upgrading their pollution control system. Besides, the Power plants are using beneficiated coal (ash content less than 34 per cent since 1999).
11.11 The Fly Ash notification of Government of India regarding utilization of fly ash within the radius of fifty kilometres from coal or lignite based thermal power plants, being implemented in Delhi by different departments/user agencies, is being monitored by the Environment Department.
11.12. The specific interventions and strategies for abatement of air pollution are presented in Table 8.1 and 8.2.
ECONOMIC SURVEY OF DELHI, 2012-13 107
12. Yamuna Action Plan (Phase II& III)
13. Hazardous Waste Management
12.1 Yamuna Action Plan- Phase II (YAP II) is one of the major programme, implemented in Delhi by Delhi Jal Board. It is being implemented in three states of the country (Haryana, Delhi and Uttar Pradesh). During the first phase of the programme, it came out that the river water pollution cannot be lowered down without the active participation of the citizens. Therefore in YAP phase II, a special component named as Public Participation and Awareness has been brought in wherein Non Governmental Organisations (NGOs) are partnering to work at the community level on different identified themes. These themes include;
l Socio–economic up-gradation of the Community Toilet Complexes neighbourhood as the name suggests, the NGOs involved have to improve the lives and environment of the community residing in the neighbourhood of the community toilets.
l School health and hygiene programme wherein school going children have been targeted to sensitise upon the need for maintaining personal hygiene and sanitation
l Town Specific innovation programme wherein NGOs are given a flexibility to design and develop a programme specific to the town requirements and could be one of the most innovative approaches and not necessarily duplicating the target groups.
12.2 Total cost is 387.17 crore for the schemes under “Yamuna Action Plan Phase –II” in Delhi. The cost is shared between Government of India and GNCTD on 85:15 bases. Funds have been released to Delhi Jal Board (DJB) and Municipal Corporation of Delhi (MCD) by the Government of India for implementation of scheme.
12.3 Yamuna Action Plan phase-III has been approved for implementation of the selected projects involving cost of about 1657 crores by DJB. GOI will provide 85% of the cost and 15% will be provided by GNCTD.
12.4 The entire area of Delhi has been declared as notified area for regulation of ground water. No drawl of ground water without prior permission of DJB and permission shall be granted subject to the condition of installation of rain water harvesting system/ treatment of all wastewater and effective reuse of treated water.
13.1 Hazardous Waste (Management, Handling and Trans Boundary Movement) Amendment Rules, 2008 specifies various types of hazardous waste generating process as well as type of hazardous waste. Under the rules, it is the responsibility of all industrial units who generate specified hazardous waste to ensure that the hazardous waste is properly collected, treated, stored, transported and disposed of in environmentally sound manner.
`
`
ECONOMIC SURVEY OF DELHI, 2012-13108

13.2 As per Hon'ble Supreme Court order, Treatment, Storage and Disposal Facility (TSDF) is to be set up in each state. Department of Environment has decided to prepare the plan for development of its own facility site within Delhi at Gumanhera in Najafgarh Block. But the development of TSDF site within Delhi at Gumanhera in Najafgarh Block could not be finalized due to resistance of villagers. Govt of Delhi has identified a new site near Khanjawala for treatment, storage and disposal facility (TSDF) for Hazardous waste. However, the Kanjhawala site proposal also could not materialize and now, some portion of land is being alloted at MSW landfill project to be developed at Bawana.
14.1 The management of solid waste in Delhi is being improved through various measures adopted by concerned agencies. The Govt. of India has notified Municipal Solid Waste (Management & Handling) Rules, 2000 with the objective of collection, segregation, storage, transportation, processing and disposal of Municipal Solid Waste. Implementation of these rules is being taken care of by concerned local bodies in respective areas. Besides the above, the Municipal Corporations of Delhi, which are managing the solid waste, has taken the following policy level decision to improve the management system:
a) Private Sector Participation in transportation of solid waste in eight zones has already been awarded and for other four, it is in the process of award.
b) Setting up of processing facilities through private entrepreneurs.c) Infrastructure development at the local level collection and at the terminal processing level
for segregation of wastes.d) Municipal Waste Management in Delhi is presented in Statement 8.6.
e) Disposal of Municipal Solid Waste (MSW) sites in Delhi is presented in Statement 8.7.
14. Solid Waste Management
SOLID WASTE MANAGEMENT IN DELHIStatement 8.6
Sl. No.
Details Capacity / Quantity
1. Generation of Municipal Solid Waste (MSW) 8500 TPD 2. MCDs Collection Dhalaos 168 Nos. 3. Total Qua ntity of MSW through Sanitary
Landfill Sites 5700 TPD
4. Total Quantity of MSW treated 1000 TPD 5. Proposed Quantity for treatment of MSW 8800 TPD
ECONOMIC SURVEY OF DELHI, 2012-13 109

Statement 8.7DISPOSAL OF MSW DISPOSAL SITES IN DELHI
15. Bio Medical Waste Management
f) Disposal of MSW by way of Compost Plants also exist in three areas namely Bhalaswa, Khanpur/Tikri Khurd and Okhla with a capacity of 600, 200 and 200 TPD respectively. Delhi Pollution Control Committee has granted consent to establish & operate and authorisation of these plants.
g) Environmental clearance and authorisation under MSW Rules has been granted to two Waste to Energy Projects viz. project at Ghazipur (1300 TPD) and Sukhdev Vihar, Okhla (1950 TPD).From these waste to energy projects, 26 MW power will be generated.
h) Waste to Bio-fuel Project; Kitchen waste and horticulture waste can be converted into manure/ biogas by use of various technologies. As an initiative, Delhi Govt. has set up a pilot plant for waste to bio-fuel conversion at Delhi Secretariat for management of kitchen & horticulture waste. Cabinet has also approved for providing subsidy for setting up of waste to bio-fuel projects w.r.t. approved/ certified technologies.
15.1 About 10 M.T. Bio-medical Wastes is generated each day in Delhi. Delhi Pollution ControlCommittee has authorised three operators (Common Bio-medical Waste Treatment Facility) (CBWTF) for collecting the waste from the individual generators and treatment and disposal at their facility. With the commencement of facility from three operators, a number of major hospitals, who had installed incinerators, have closed down their incinerators and started availing the services of CBWTFs.
15.2 As on date, 10 incinerators, 22 autoclaves and 3 microwaves are in place for effective management of the Bio-Medical Waste (Management & Handling) Rules 1998. Besides, about 3800 individual Health Care establishments have made an agreement with the operators (CBWTFs) who have the facility for the treatment and disposal of Bio-Medical Waste.
Sl. No.
Details Capacity / Quantity
1. Sanitary Landfill Sites a) Bhalaswa 2000-2200 TPD b) Ghazipur 2000-2200 TPD c) Okhla 1200-1300 TPD
2. Proposed Landfill Sites a) Jaitpur/Tajpur 1000-1500 TPD b) Bawana – Narela Road 4000 TPD
ECONOMIC SURVEY OF DELHI, 2012-13110
16. Construction & Demolition Waste Management
17. Plastic Waste Management
18. E-Waste Management
19. Climate Change Mitigation Measures
16.1 Construction & Demolition (C&D) waste consists of the materials generated during the construction, renovation and demolition of building and other structure. The management of C&D Waste is a major concern due to the increasing quantum of demolition rubble, continuing shortage of dumping sites, increase in transportation and disposal cost. Delhi generates about 3000-5000 tones of construction and demolition waste per day.
16.2 M/s IL & FS Waste Management & Urban Services Limited has been granted consent to establish for the Processing of Construction and Demolition Waste debris at Jahangir Puri (Adjacent to Block-31, Gate No.1, Hanuman Mandir Road, Near MCD Colony, Jahangir Puri, Delhi – 33). The said facility is a Pilot Project for processing & recycling of 500 Tones per day of Construction & Demolition Waste.
l About 583 MT/Year of plastic waste is generated in Delhil Delhi Government has issued a notification forbidding use of plastic bags in the markets
and shopping centres.l Despite massive awareness campaigns and the notification dated 7.1.2009 also, the
plastic bags continue to create nuisance. Keeping this in view, Cabinet has decided for blanket ban on plastic carry bags in Delhi. Accordingly, Delhi Govt. had issued a Notification on 23.10.2012 imposing ban on manufacturing, sales storage, usage, import & transport of plastic carry bags in the NCT of Delhi.
Ministry of Environment & Forest (MoEF), GOI has notified E-Waste Management & st
Handling Rules in May 2011 to come into force from 1 May, 2012. Delhi Govt. has taken several initiatives for creating awareness about E-Waste / E-Waste Rules. E-Waste bins have been provided at various market locations, schools and Govt. offices for collection of e-waste. CPCB has designated authorized recyclers for E-Waste and one collection centre/ agency has also been designated by Delhi Govt. The DPCC in collaboration with Environment Department has conducted 4 workshops to create awareness among different stakeholders.
19.1 On the issue of Combating Climate Change, Delhi is the first city in the country to set a mandate and brought out a detailed Climate Change Agenda for 2009-2012, on the lines of National Action Plan for Climate Change released by the Government of India.
ECONOMIC SURVEY OF DELHI, 2012-13 111
19.2 65 important point climate change agenda have been identified for the city of Delhi under following sectors:
a) Enhanced Energy Efficiencyb) Sustainable Habitatc) Green Indiad) Water Missione) Strategic Knowledgef) Solar Mission
19. 3 Delhi State Action Plan on Climate Change (SAPCC) beyond 2012 is being prepared on the lines of National Action Plan on Climate Change (NAPCC).
20.1 Energy Efficiency and Renewable Energy Management Centre, Department of Environment, Govt. of Delhi has taken no. of steps to promote solar water heating systems in Delhi such as providing Rebate/Incentive of 6000/- for Domestic consumer (Residential accommodation) and up to 60000 to Non Commercial institutes depending on capacity of system. Capital Subsidy @ 3300/- per sq. m. for Flat plate collector and @ 3000/- per sq. m. for Evacuated tube collectors for domestic as well as commercial and
non commercial establishments is provided through Ministry of New & Renewable Energy. The installation of Solar Water Heater has also been made mandatory in different categories of buildings like Industries, Hotels, Hospitals, Canteens, Corporate and residential building having area of 500 sq. meters or above, Government buildings, etc
l Lightening & illumination through Solar photovoltaic Power plant of 10.4 kwp at Safdarjung Tomb, New Delhi & 9.0 kwp at Jantar Mantar, New Delhi have been commissioned.
l Various important Project are being undertaken namely Demonstration of Renewable Energy Systems/Devices at Tihar Prison Complex, SPV Plant of 30 KWp at Delhi Secretariat Building under SADP of MNRE, SPV Power plant of 100 KWp at Vikas Bhawan –II under Off Grid Scheme of MNRE, SPV Power Plant of 465 KWP by BSES & NDPL, 25 kwp SPV plant at 10 No's Govt. Hospital & 10 KWP SPV plant at 25 Schools and Development of NDMC Area as Solar City.
20.2 Energy Efficiency: Initiatives taken by EE&REM Centre towards energy efficiency are as follows:-
l Adoption of mandatory Energy Conservation Building Code in New Government Buildings. l Mandatory use of Compact Fluorescent Lamp and Electronics Chokes in Govt.
Building/Govt. aided institution/Boards, Corporations.
20. Solar Lighting & Heating System
``
``
ECONOMIC SURVEY OF DELHI, 2012-13112
l Mandatory use of ISI marked Motor pump sets, Power capacitor, and foot/Reflex valves in Agriculture Sector.
l Project on promotion of Energy Efficient LED at Jawahar Lal Nehru University is under progress.
21.1 Installation of Rain-Water Harvesting System has been made mandatory for plots having area of 100 Sq. Meters and above. The financial assistance of the 50 per cent of the project cost or 1 lakh whichever is less, is provided by Delhi Government / Delhi Jal Board to the Resident Welfare Associations or Schools for this purpose.
21.2 For Hotels / Malls / Construction Projects etc, installation of Rain Water Harvesting System has been made mandatory through contract mechanism.
Some of the important measures adopted by the Government / DPCC to control pollution and improve the environment are as follows;
l Re-use of treated waste water for gardening and cooling purposes.l Making use of Bio-degradable kitchen solid waste for Vermi Composting at community
level and utilizing compost for gardening purpose. l Environment Department has supported Schools for putting up paper re-cycling
equipments/plants.l Development and Protection of the Ridge Area.l Development of Wild Life Sanctuary at Bhatti, Asola.l Development and Preservation of lakes and water bodies.l Air Ambiance Fund created by levying a fee on the sale of diesel at the rate of 0.25 per
litre in NCT of Delhi, is being utilized for providing upto 29.5 percent concession in purchase of battery operated vehicles.
l For ground water regulations and management in the city, a notification containing th
directions under section 5 of Environment Protection Act has been issued on 12 July 2010.l Massive plantation drive is being organised each year with the involvement of some
Government Departments, Municipal bodies, NGO, Civil Society Organisations, Citizens, RWAs, Schools & Colleges, etc.
l New City forests are being developed to increase the green cover area in Delhi.l Improvement of parks and gardens and their maintenance is being taken care of by
providing adequate funds to local bodies and RWAs.l Providing Sewerage System in unplanned habitats i.e. unauthorised colonies and rural
villages.
21. Rain-Water Harvesting Structure
22. Other measures
`
`
ECONOMIC SURVEY OF DELHI, 2012-13 113

23. Forest in Delhi
FOREST AND TREE COVER AREA OF DELHI 1993-2009
FOREST AND TREE COVER AREA OF DELHI 1993-2009
23.1 Government of National Capital Territory of Delhi is safeguarding the existing forest and enhancing the city forest and tree cover area of Delhi through various initiatives. The information regarding forest and tree cover area of Delhi during 1993 to 2012 is presented in Statement 8.8.
(Sq. Km)
Source: Forest Department, Government of National Capital Territory of Delhi
23.2 It may be observed from Statement 8.8 that the growth of forest and tree cover area of Delhi increased from 22 Sq. Km in 1993 to 299 Sq. Km in 2009 recorded an annual growth at 98.44 per cent. The highest absolute percentage of growth recorded during 1999. The percentage of forest and tree cover area to the total area of Delhi has increased manifold from a mere level of 1.48 per cent in 1993 to 20 per cent in 2009.
Statement 8.8
Chart 8.2
Sl. No.
Year Forest and Tree Cover
Increase In Area % of Total Area Absolute Percentage
1. 1993 22 -- -- 1.48 2. 1995 26 4 18.18 1.75 3. 1997 26 -- -- 1.75 4. 1999 88 62 238.46 5.93 5. 2001 151 63 71.59 10.2 6. 2003 268 117 77.48 18.07 7. 2005 283 15 5.60 19.09 8. 2009 299.58 16.58 6.19 20.20
ECONOMIC SURVEY OF DELHI, 2012-13114
23.3 The information regarding the district-wise forest cover area and total geographical area of Delhi is presented in Statement 8.9.
(Sq. Km)
Source: Forest Department, Government of National Capital Territory of Delhi
23.4 It may be inferred from Statement 8.9 that the forest cover area of Delhi is 176.2 sq. km i.e. 11.88 per cent of the total area of Delhi. South Delhi constitutes the highest forest cover area at 78.32 sq. km, South West Delhi at 41.80 sq. km, North West Delhi at 16.41 sq. km, New Delhi at 16.49 sq. km, respectively. On the contrary the lowest forest cover observed in East Delhi at 2.99 sq. Km. The information regarding district-wise forest cover in Delhi is depicted in Chart 8.3.
(Sq. Km)
Statement 8.9
Chart 8.3
DISTRICT-WISE FOREST COVER IN DELHI
DISTRICT-WISE FOREST COVER IN DELHI
Sl. No.
Districts Geographical Area
Forest Cover Area
% of Geographical
Area 1. Central Delhi 25 5.05 20.20 2. East Delhi 64 2.99 04.67 3. New Delhi 35 16.31 46.60 4. North Delhi 59 4.81 8.15 5. North East Delhi 60 4.10 6.83 6. North West Delhi 440 16.49 3.75 7. South Delhi 250 78.32 31.33 8. South-West Delhi 421 41.80 9.93 9. West Delhi 129 6.33 04.91 Total 1483 176.2 11.88
ECONOMIC SURVEY OF DELHI, 2012-13 115
24. Asola Bhatti Wild Life Sanctuary
25. Reclamation of Bhatti area of Asola Bhatti Wild Life Sanctuary through ECO Task Force (ETF)
24.1 Asola Bhatti Wildlife Sanctuary spread over 6,800 acres is situated near Tughlakabad Fort
in South Delhi. The Wildlife Sanctuary is considered the breathing lung of the cosmopolitan
city of Delhi. It was established in 1992 with the aim to protect the wildlife in the area
between Delhi and Surajkund (Delhi-Haryana border). The Asola Bhatti wildlife sanctuary
actually lies in South Delhi District, all along Delhi Haryana Border along Faridabad and
Gurgaon.
24.2 The sanctuary is located on the Southern Ridge which is part of the northern terminal of
Aravalli Hills (Aravallis are one of the oldest mountain system of the world). The reason for
the biodiversity significance of the Ridge lies in its merger with Indo-Gangetic Plains. The
legal Status of the Southern Ridge was considered uncertain till 1986 when the community
land of villages Asola, Shapur and Maidangari (4707 Acre) were notified and land of Bhatti
mines area (2167 Acre) was notified in 1991 as Sanctuary. About 23 Check dams have
been constructed at Asola Wild Life Sanctuary for storing rain water. These check dams
have proved to be very effective for ground water recharge and creation of water bodies for
the sustenance of Wild Life in the Sanctuary.
25.1 Forest Department, Government of NCT of Delhi is implementing the project of
rehabilitation of about 2100 acres of Bhatti Mines area since October 2000 through ETF,
which is a part of Asola-Bhatti Wild Life Sanctuary. Project period for five years was
approved in 2000 at a cost of 8.23 crore, was extended for a further period of 3 years up to
8.10.2008 with an additional cost of 4.93 crore. The project was extended for one more thyear with the final estimated cost of 25.55 crore up to 8 October 2009. Further the project
stwas extended till 31 March 2012 with the total revised estimated cost of 33.37 crore of the
project. The project is now extended till 2017 with revised estimated cost of 44.82 crore.
The information regarding the area and plantation rose under this project up to 2011-12 is
presented in Statement 8.10.
`
`
`
`
`
ECONOMIC SURVEY OF DELHI, 2012-13116
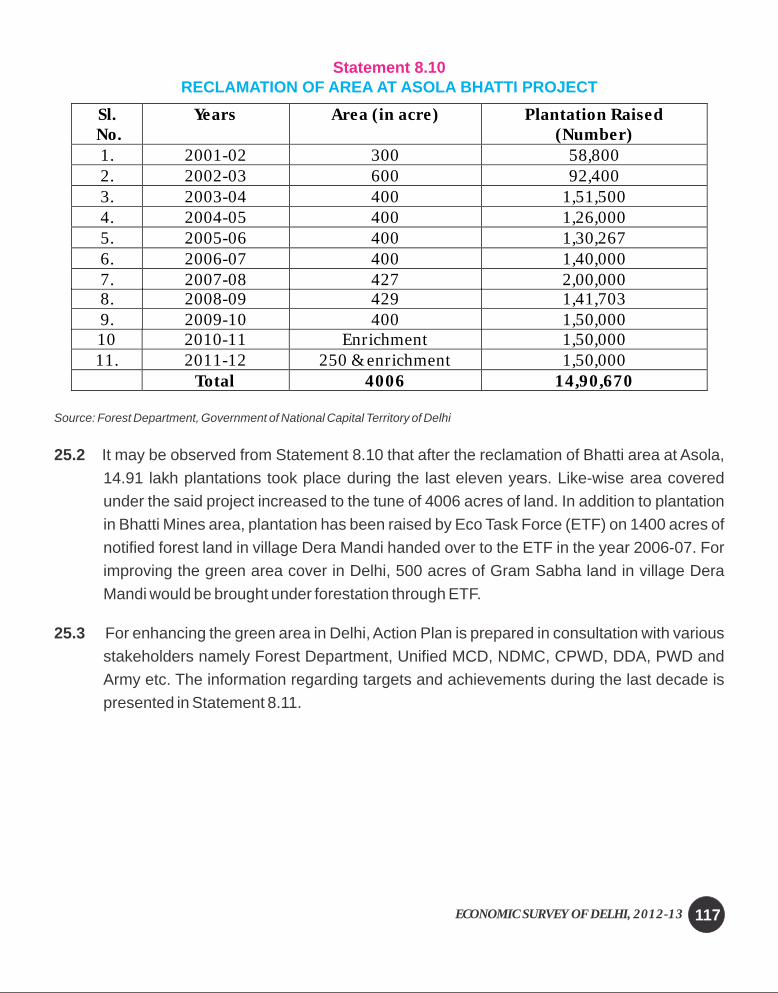
Statement 8.10RECLAMATION OF AREA AT ASOLA BHATTI PROJECT
Source: Forest Department, Government of National Capital Territory of Delhi
25.2 It may be observed from Statement 8.10 that after the reclamation of Bhatti area at Asola,
14.91 lakh plantations took place during the last eleven years. Like-wise area covered
under the said project increased to the tune of 4006 acres of land. In addition to plantation
in Bhatti Mines area, plantation has been raised by Eco Task Force (ETF) on 1400 acres of
notified forest land in village Dera Mandi handed over to the ETF in the year 2006-07. For
improving the green area cover in Delhi, 500 acres of Gram Sabha land in village Dera
Mandi would be brought under forestation through ETF.
25.3 For enhancing the green area in Delhi, Action Plan is prepared in consultation with various
stakeholders namely Forest Department, Unified MCD, NDMC, CPWD, DDA, PWD and
Army etc. The information regarding targets and achievements during the last decade is
presented in Statement 8.11.
8. 2008-09 429 1,41,703 9. 2009-10 400 1,50,000 10 2010-11 Enrichment 1,50,000 11. 2011-12 250 & enrichment 1,50,000
Total 4006 14,90,670
Sl. No.
Years Area (in acre) Plantation Raised (Number)
1. 2001-02 300 58,800 2. 2002-03 600 92,400 3. 2003-04 400 1,51,500 4. 2004-05 400 1,26,000 5. 2005-06 400 1,30,267 6. 2006-07 400 1,40,000 7. 2007-08 427 2,00,000
ECONOMIC SURVEY OF DELHI, 2012-13 117

Statement 8.11
Statement 8.12
PLANTATION UNDER GREEN DELHI
26. Development and Management of Ridge area
MANAGEMENT OF DELHI RIDGE
Source: Forest Department, Government of National Capital Territory of Delhi
26.1 The Delhi Ridge, an extension of the Aravali Mountains acts as the green lungs of the city. About 7784 hectares of the Ridge area have been notified as a reserve forest. The Ridge is divided into five portions. The details regarding the management of Delhi Ridge and area in each portion is presented in Statement 8.12.
Source : Forest Department, Government of National Capital Territory of Delhi
Sl.
No.
Ridges
Managing
Agency
(Area in Ha)
1.
Northern Ridge
Delhi Development Authority, Unified Municipal Corporation of Delhi & Forest Department
87
2.
Central Ridge
Forest Department, Delhi Development Authority, Army, Unified Municipal Corporation of Delhi, Central Public Works Department, New Delhi Municipal Council.
864
3.
South Central Ridge
(Near Mahrauli) Delhi Development Authority
626
4. Nanakpura South
Central Delhi Development Authority 7
5. Southern Ridge Forest Department, De lhi Development Authority, Sports Authority of India
6200
Total
7784
Sl. No.
Years Target (Lakh
Plantation)
Achievement (Lakh) No. of
Plantation done
Plantation by Forest
Department
Plantation by Other
Department
Free Distribution of Seedlings
1.
2000-01
9.30
9.38
3.35
2.13
3.90 2.
2001-02
9.00
9.10
3.39
3.86
1.85
3.
2002-03
9.85
9.16
2.69
4.01
2.46
4.
2003-04
10.50
11.44
3.27
5.17
3.00
5.
2004-05
12.54
13.30
3.01
6.03
4.26
6.
2005-06
15.66
16.34
3.53
6.64
6.18
7.
2006-07
17.11
18.58
3.50
8.29
6.79
8.
2007-08
18.90
17.62
3.93
8.67
5.02
9.
2008-09
18.48
16.38
3.15
8.18
5.05
10.
2009-10
18.07
21.38
3.65
10.01
7.72
11.
2010-11
17.34
18.04
4.33
7.96
5.75
12.
2011-12
15.96
17.34
2.81
6.76
7.77
ECONOMIC SURVEY OF DELHI, 2012-13118
26.2 It may be observed from Statement 8.12 that southern ridge occupies major area and it constitutes nearly four fifths of the total area of ridges in Delhi.
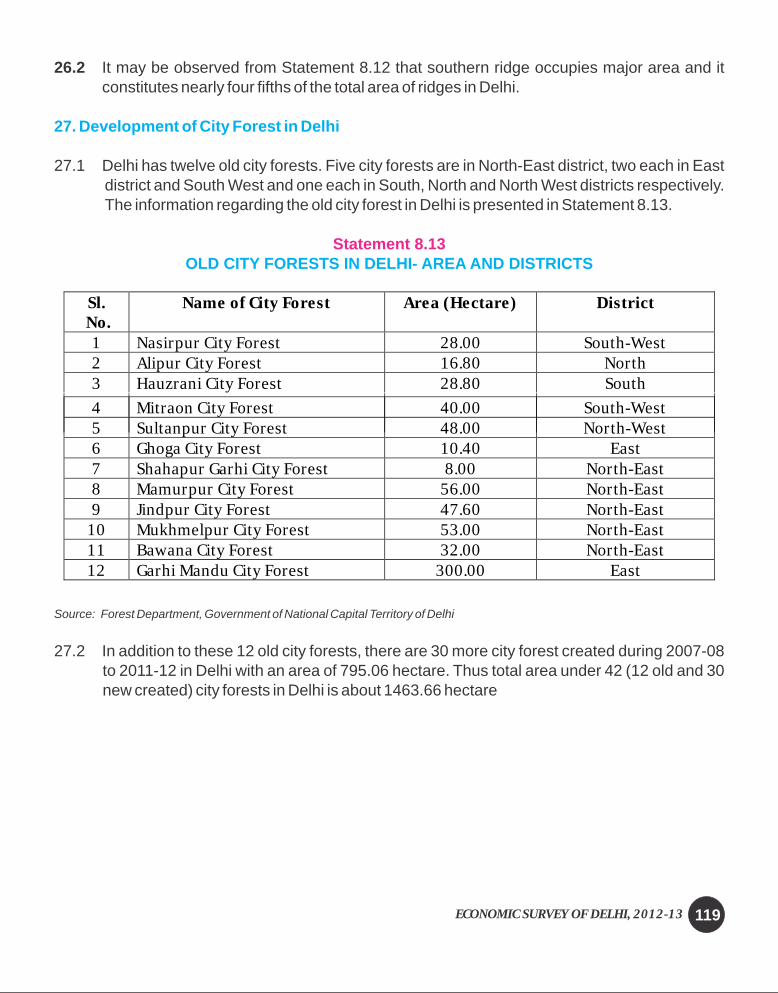
27.1 Delhi has twelve old city forests. Five city forests are in North-East district, two each in East district and South West and one each in South, North and North West districts respectively. The information regarding the old city forest in Delhi is presented in Statement 8.13.
Source: Forest Department, Government of National Capital Territory of Delhi
27.2 In addition to these 12 old city forests, there are 30 more city forest created during 2007-08 to 2011-12 in Delhi with an area of 795.06 hectare. Thus total area under 42 (12 old and 30 new created) city forests in Delhi is about 1463.66 hectare
27. Development of City Forest in Delhi
OLD CITY FORESTS IN DELHI- AREA AND DISTRICTSStatement 8.13
Sl. No.
Name of City Forest Area (Hectare) District
1 Nasirpur City Forest 28.00 South-West 2 Alipur City Forest 16.80 North 3 Hauzrani City Forest 28.80 South
4 Mitraon City Forest 40.00 South-West 5 Sultanpur City Forest 48.00 North-West 6 Ghoga City Forest 10.40 East 7 Shahapur Garhi City Forest 8.00 North-East 8 Mamurpur City Forest 56.00 North-East 9 Jindpur City Forest 47.60 North-East
10 Mukhmelpur City Forest 53.00 North-East 11 Bawana City Forest 32.00 North-East 12 Garhi Mandu City Forest 300.00 East
ECONOMIC SURVEY OF DELHI, 2012-13 119