chapter 7 - appraising investment risk
DESCRIPTION
financial managementTRANSCRIPT
INVESTMENT RISK APPRAISAL
CHAPTER 7
Chapter outline
• Introduction• What are uncertainty and risk and why do they need to
be assessed?• Types of risk in investment projects• Probability distributions and expected values• Using scenario analysis, sensitivity analysis and
simulation analysis to assess risk• Break-even analysis as a measure of dealing with risk• Conclusion
Learning outcomes
By the end of this chapter, you should be able to:• Understand the importance of recognizing risk in
investment appraisal• Identify the various types of risk involved in
investment projects• Discuss the use of probability distributions and
expected values in risk assessment• Discuss scenario analysis, sensitivity analysis
and simulation analysis in investment projects• Apply break-even analysis as a measure of
dealing with risk.
Introduction
• Capital investment decisions carry level of risk• Risk may impact on end result of investment,
especially investments in businesses or projects in foreign countries
• Capital investment decisions are about the future
• Risk and uncertainty need to be taken into account when decisions are made
Uncertainty and risk
• Certainty – where there is no doubt about the outcome of something
• Uncertainty – where one does not know which events or factors will influence the end result of a project and cannot attach probabilities to the occurrence of possible events
• Risk – there is the possibility of incurring loss or misfortune because of uncertainty about the future
• Probability – refers to the likelihood that a particular event will occur
Risk vs return
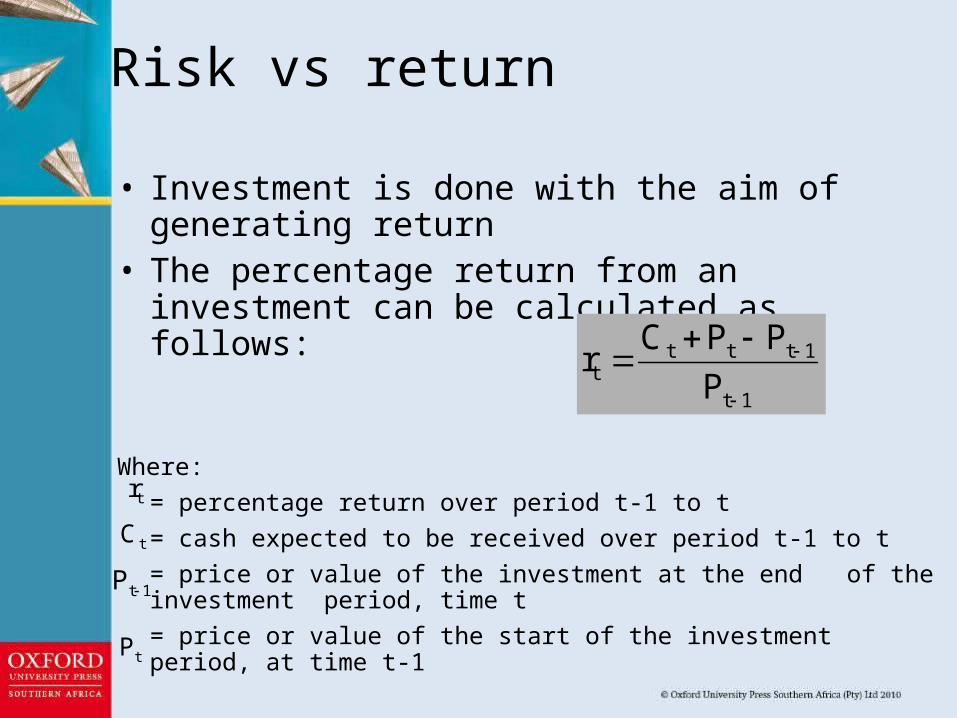
• Investment is done with the aim of generating return
• The percentage return from an investment can be calculated as follows:
Where: = percentage return over period t-1 to t= cash expected to be received over period t-1 to t= price or value of the investment at the end of the investment period, time t= price or value of the start of the investment period, at time t-1
1t
1tttt P
PPCr
tr
tC
1tP
tP

Example 7.1
Beta Ltd purchased shares in Charlie Ltd as an investment. Financial analysts predicted that Charlie Ltd will do very well and that Beta Ltd will generate a healthy return from an investment in Charlie Ltd. However, after two years of having the investment, the board of directors want to know what percentage of return the investment is generating. The company’s required rate of return is 15% on similar investments, and the board wants to make sure it is worth holding on to the investment.
The investment originally cost Beta Ltd R1 500 000. Beta Ltd received R40 000 in dividends over the two-year period of holding the investment. Based on market values, the investment is worth R1 700 000 after the two years.
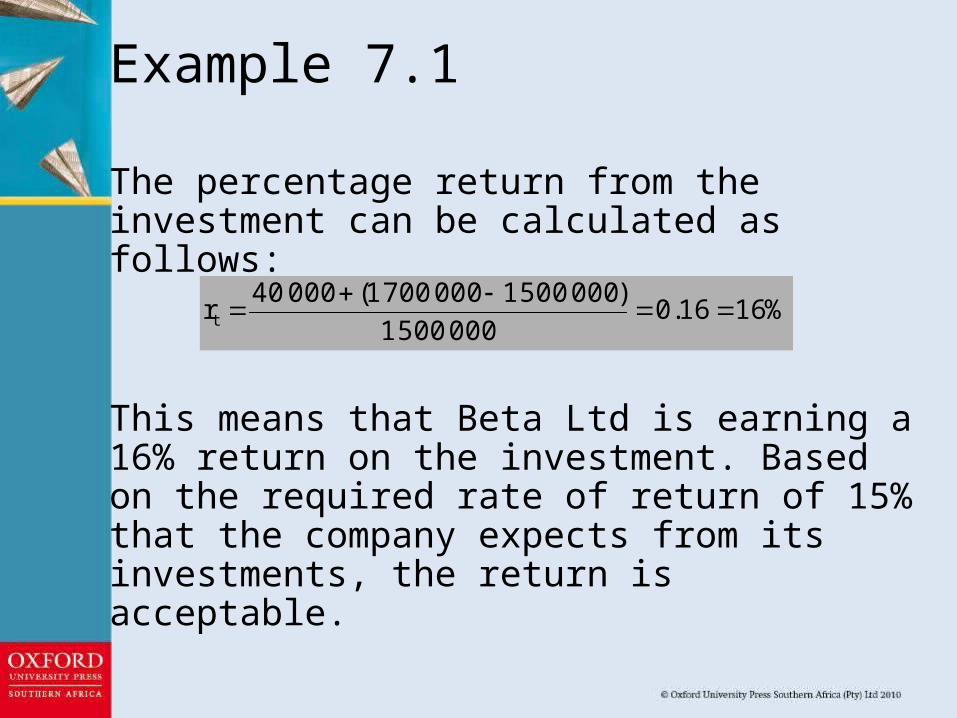
The percentage return from the investment can be calculated as follows:
This means that Beta Ltd is earning a 16% return on the investment. Based on the required rate of return of 15% that the company expects from its investments, the return is acceptable.
%1616.00005001
)00050010007001(00040rt
Example 7.1
Approaches to risk in investment appraisal• Risk tolerance – amount of risk a company is
willing to take when making an investment • Company-specific – based on perceptions of
management and financial position of the company
• Usually an individual or company is willing to accept more risk if a greater return can be expected
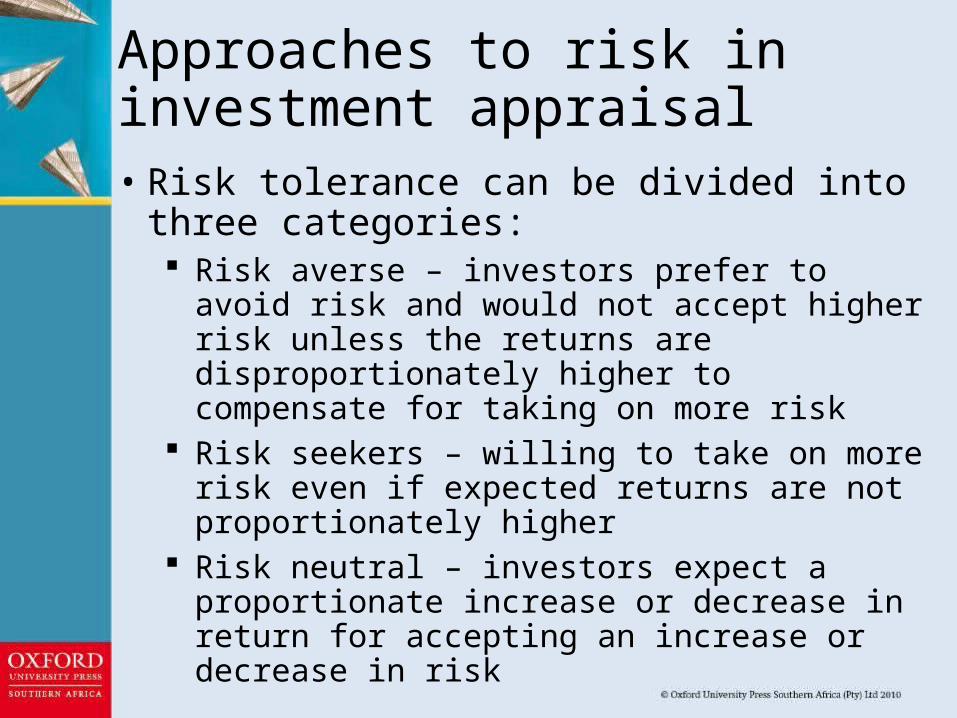
Approaches to risk in investment appraisal• Risk tolerance can be divided into three
categories: Risk averse – investors prefer to avoid risk and
would not accept higher risk unless the returns are disproportionately higher to compensate for taking on more risk
Risk seekers – willing to take on more risk even if expected returns are not proportionately higher
Risk neutral – investors expect a proportionate increase or decrease in return for accepting an increase or decrease in risk
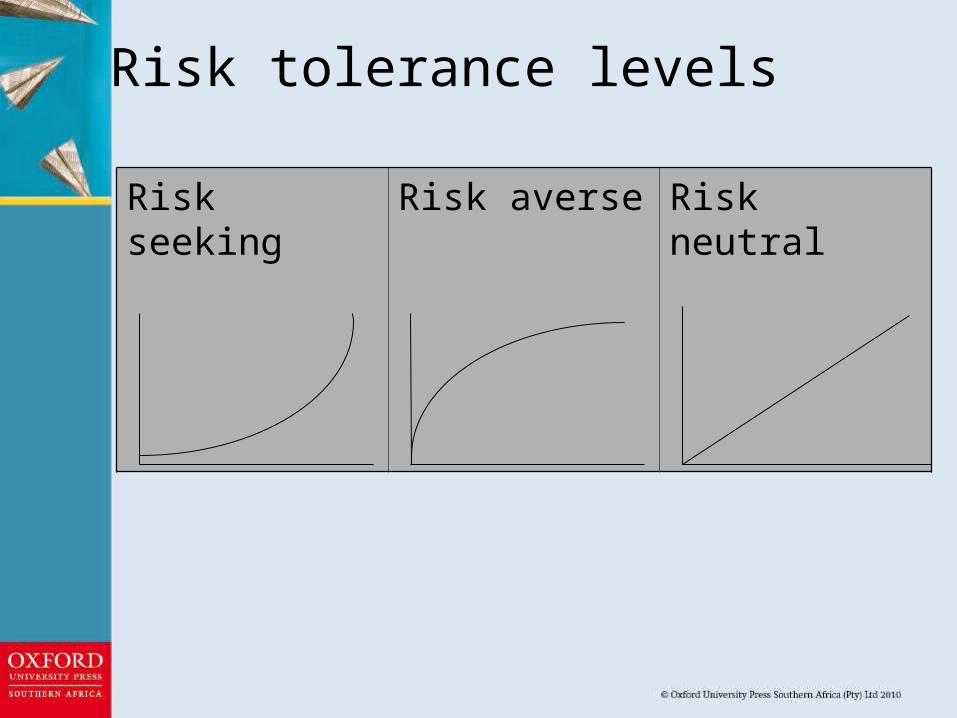
Risk tolerance levels
Risk seeking Risk averse Risk neutral
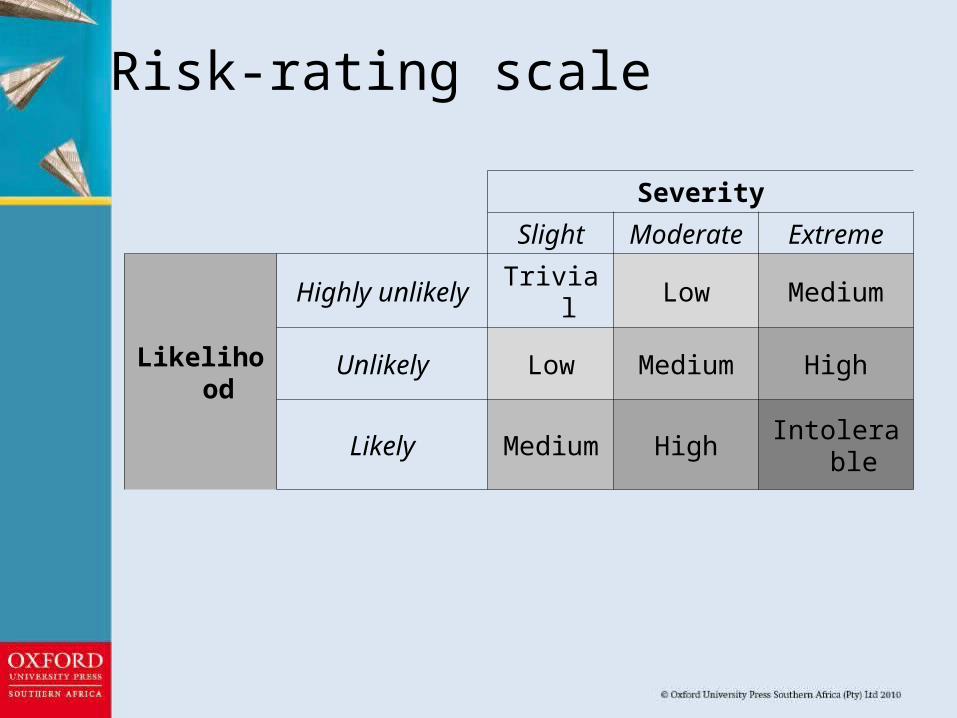
Risk-rating scale
Severity Slight Moderate Extreme
Likelihood
Highly unlikely Trivial Low Medium
Unlikely Low Medium High
Likely Medium High Intolerable
Types of risk in investment projects• Elementary risks
Systematic – basic market risk because of economic changes or other events, e.g. political event which affects portfolio
Unsystematic – more specific, affects fewer investments at the same time, e.g. fire at factory
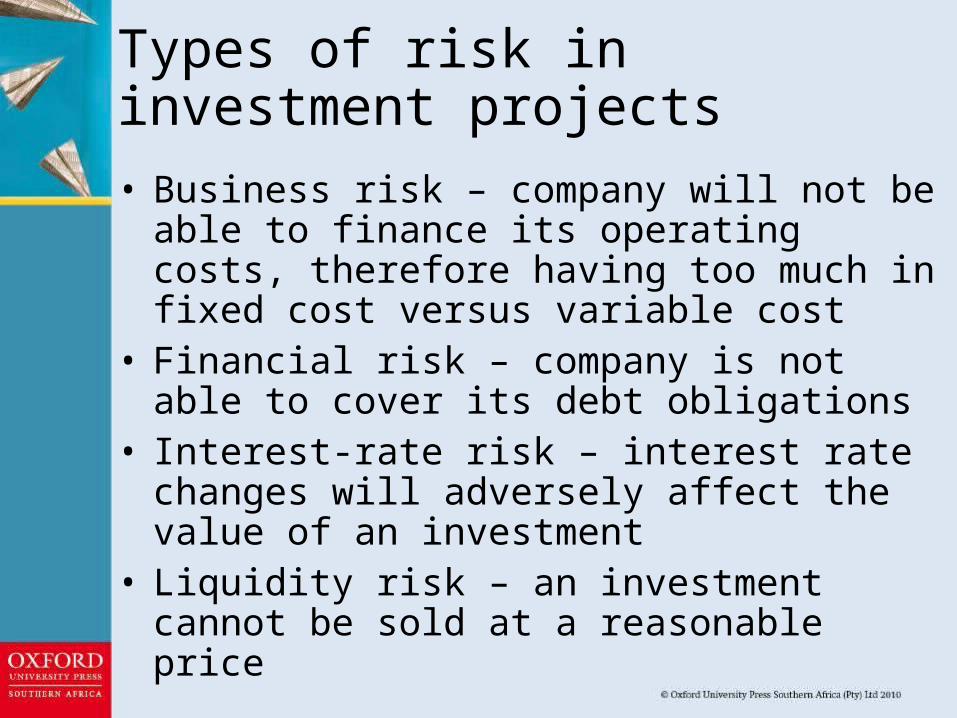
Types of risk in investment projects• Business risk – company will not be able to
finance its operating costs, therefore having too much in fixed cost versus variable cost
• Financial risk – company is not able to cover its debt obligations
• Interest-rate risk – interest rate changes will adversely affect the value of an investment
• Liquidity risk – an investment cannot be sold at a reasonable price
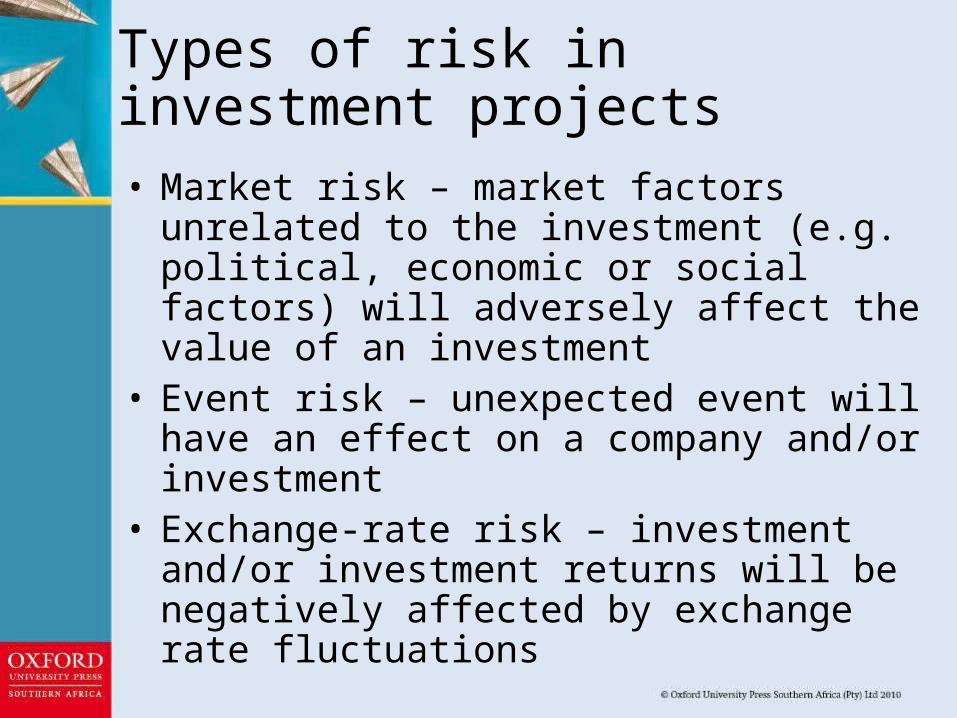
Types of risk in investment projects• Market risk – market factors unrelated to the
investment (e.g. political, economic or social factors) will adversely affect the value of an investment
• Event risk – unexpected event will have an effect on a company and/or investment
• Exchange-rate risk – investment and/or investment returns will be negatively affected by exchange rate fluctuations
Types of risk
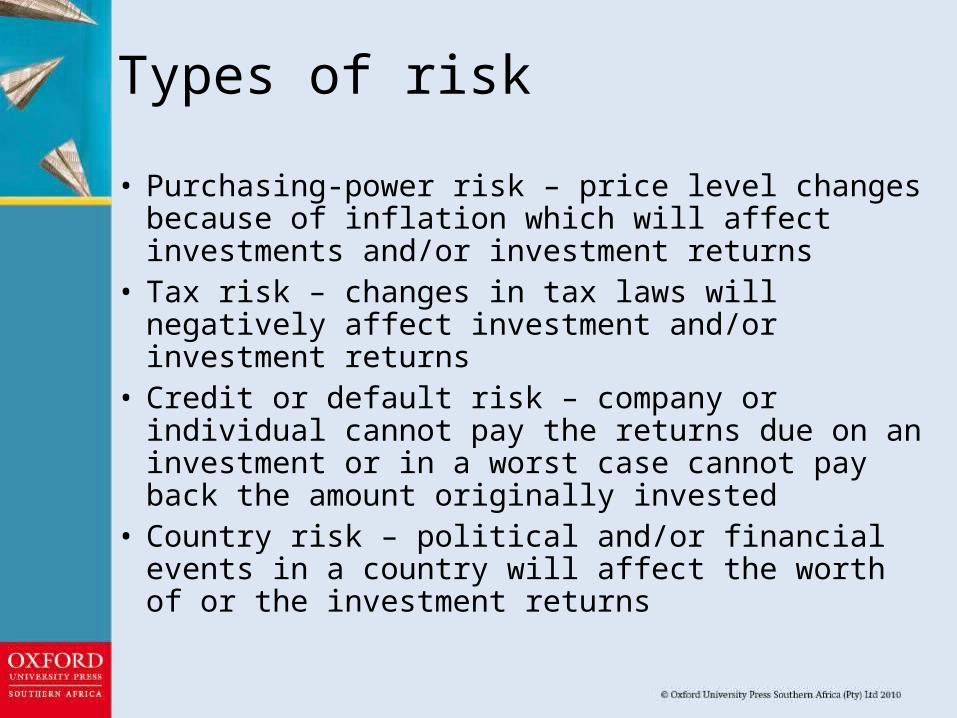
• Purchasing-power risk – price level changes because of inflation which will affect investments and/or investment returns
• Tax risk – changes in tax laws will negatively affect investment and/or investment returns
• Credit or default risk – company or individual cannot pay the returns due on an investment or in a worst case cannot pay back the amount originally invested
• Country risk – political and/or financial events in a country will affect the worth of or the investment returns

Probability distribution
• Probability distribution – statistical technique that establishes what the likely outcome of an uncertain event will be
• Depicted on a graph as follows:

Expected value
Average of the possible outcomes, weighted by the probability of the outcomes actually occurring, calculated as follows:
__
Where: r = expected (average) returnrj = the return for the jth outcomePrj = the probability of occurrence for the jth
outcomen = the number of outcomes considered to
calculate an expected value
Example 7.3
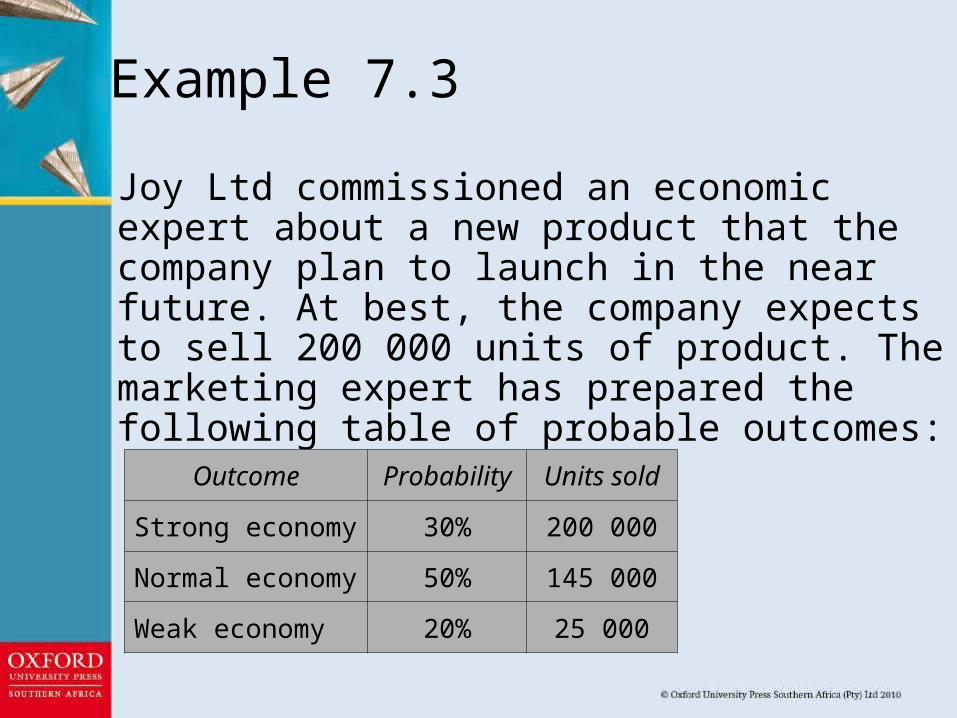
Joy Ltd commissioned an economic expert about a new product that the company plan to launch in the near future. At best, the company expects to sell 200 000 units of product. The marketing expert has prepared the following table of probable outcomes:
Outcome Probability Units sold
Strong economy 30% 200 000
Normal economy 50% 145 000
Weak economy 20% 25 000
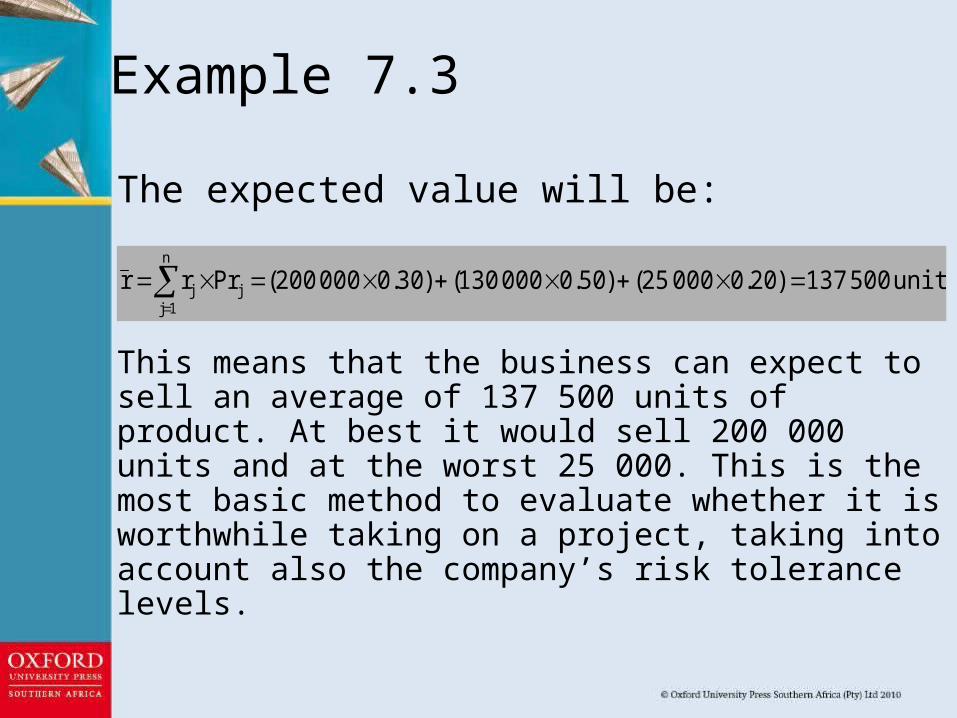
The expected value will be:
This means that the business can expect to sell an average of 137 500 units of product. At best it would sell 200 000 units and at the worst 25 000. This is the most basic method to evaluate whether it is worthwhile taking on a project, taking into account also the company’s risk tolerance levels.
n
1jjj units500137)20.000025()50.0000130()30.0000200(Prrr
Example 7.3
Scenario analysis
• Analyses future events by considering alternative possible outcomes What happens to NPV under different cash flow
scenarios?• Various scenarios are indicated and effect on
the outcome of investment is evaluated• Useful for indicating viability of an investment
or capital project if the values of the variables are different to what is expected both in a positive and negative sense
• Useful for indicating potential downside
Scenario analysis
• Has limitations: It analyses the effect on return if one
changes the value of one variable at a time – the other variables are held constant
Does not indicate whether the project should be accepted or rejected
Sensitivity analysis
• Method of establishing how sensitive the expected return is to a change in the value of a key variable What happens to NPV when one variable at a time
is changed?• Variables include discount rate, annual
operating revenues, annual operating costs, expected project life and residual value
• Using several different variables shows which variables’ best- and worst-case scenarios produce the biggest changes to NPV
Sensitivity analysis
• First step is to calculate a single expected outcome for an investment and to use as base value
• Using additional information, two or more situations can be formulated by making changes to relevant variables
Simulation analysis
• Statistical method using probability distributions and random numbers to estimate a variety of risk outcomes Simulation is really just an expanded sensitivity and
scenario analysis• By applying and repeating the process, a
probability distribution of project returns can be established
• More times the analyst can repeat the process, the more feasible the end result is likely to be
• Gives investor a better risk-adjusted indication of return
• Computers and advanced statistical software have made analyses easier and cost-effective
• Monte Carlo Method – randomly generates values for different uncertain variables
Simulation analysis
Break-even analysis
• Common tool for analyzing the relationship between sales volume and profitability
• Measures the point at which a capital project breaks even and identifies the sales level below which it will start losing money
• Indicates the level to which revenue could fall without there being a reduction in the value of the firm
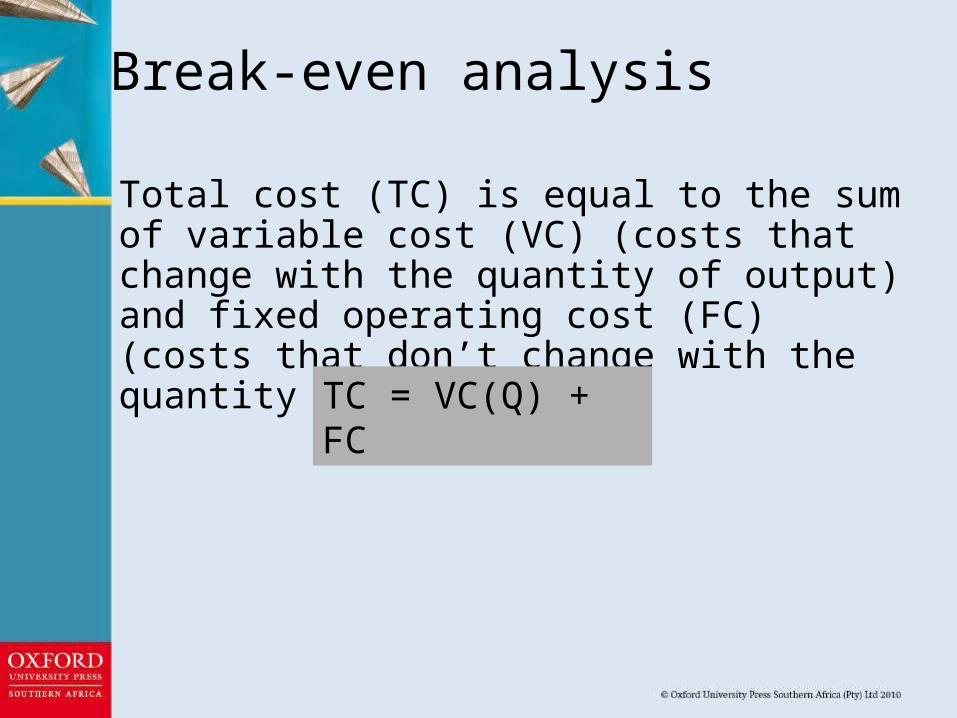
Total cost (TC) is equal to the sum of variable cost (VC) (costs that change with the quantity of output) and fixed operating cost (FC) (costs that don’t change with the quantity of output)
Break-even analysis
TC = VC(Q) + FC
Break-even analysis
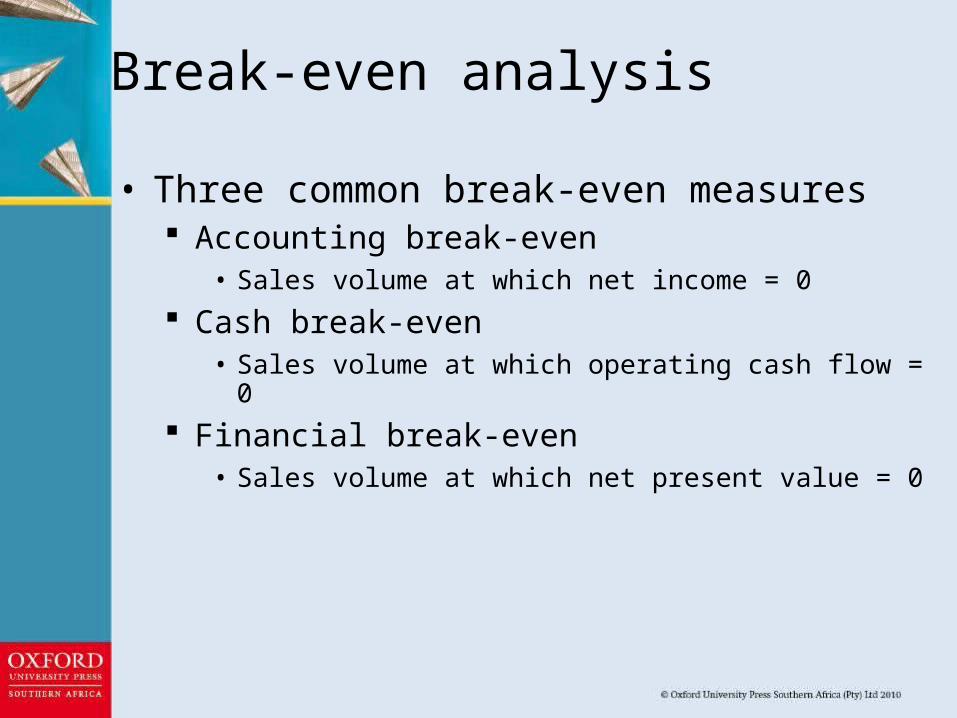
• Three common break-even measures Accounting break-even
• Sales volume at which net income = 0 Cash break-even
• Sales volume at which operating cash flow = 0 Financial break-even
• Sales volume at which net present value = 0
Conclusion
• It is important to incorporate risk into the evaluation of investments and when deciding about accepting or rejecting projects.
• Risk is the likelihood that the return on an investment can be affected in an unfavorable way.
• Certainty is a state where only one end result is possible.
• Uncertainty is a state where it is impossible to exactly predict the future return on an investment.
Conclusion (cont.)
• Sensitivity analysis is used to establish how sensitive the return on an investment is to changes in the values of key variables in the evaluation of investment projects.
• Scenario analysis overcomes the limitations of sensitivity analysis by taking into consideration the probability of changes in key variables associated with inputs in the cash flows.
Conclusion (cont.)
• Break even analysis is a measure of dealing with risk.
• These methods make is possible to reduce the risk of unforeseen circumstances having a negative impact on the value of investments