chapter 5 wicking behaviour of manmade cellulosic fibres...
TRANSCRIPT
92
CHAPTER 5
WICKING BEHAVIOUR OF MANMADE CELLULOSIC FIBRES
LIKE VISCOSE, MODAL, TENCEL AND BAMBOO FIBRES
5.1 INTRODUCTION
This chapter is concerned with the study of properties of viscose, modal,
bamboo and tencel staple fibres and also their wicking behaviour.
5.2 MATERIALS AND METHODS
These have been already discussed in Chapter 3
5.3 RESULTS AND DISCUSSION
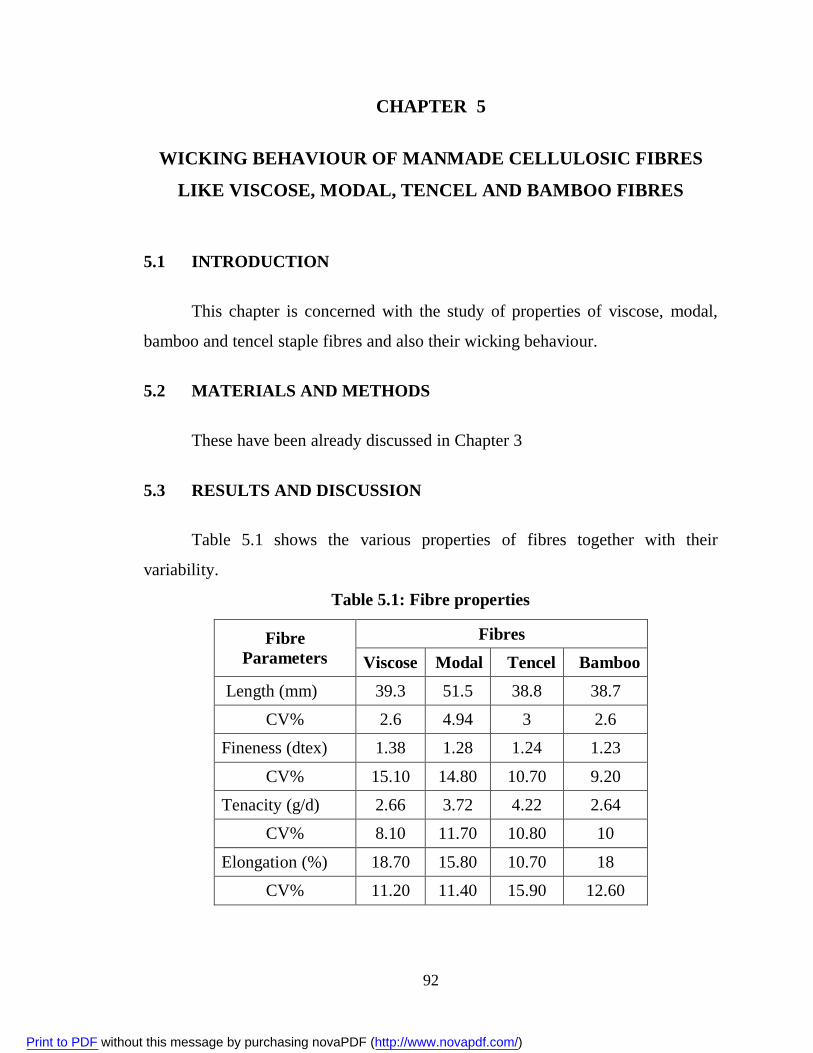
Table 5.1 shows the various properties of fibres together with their
variability.
Table 5.1: Fibre properties
Fibre Parameters
Fibres Viscose Modal Tencel Bamboo
Length (mm) 39.3 51.5 38.8 38.7
CV% 2.6 4.94 3 2.6
Fineness (dtex) 1.38 1.28 1.24 1.23
CV% 15.10 14.80 10.70 9.20
Tenacity (g/d) 2.66 3.72 4.22 2.64
CV% 8.10 11.70 10.80 10
Elongation (%) 18.70 15.80 10.70 18
CV% 11.20 11.40 15.90 12.60
Print to PDF without this message by purchasing novaPDF (http://www.novapdf.com/)
93
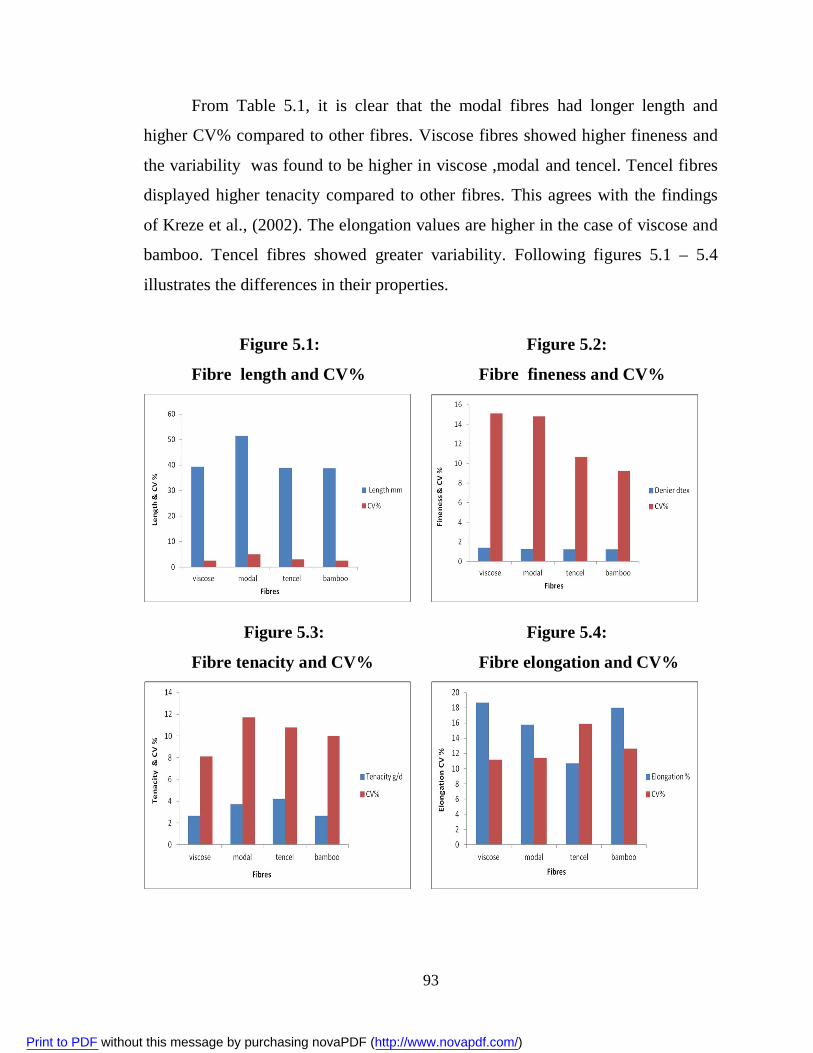
From Table 5.1, it is clear that the modal fibres had longer length and
higher CV% compared to other fibres. Viscose fibres showed higher fineness and
the variability was found to be higher in viscose ,modal and tencel. Tencel fibres
displayed higher tenacity compared to other fibres. This agrees with the findings
of Kreze et al., (2002). The elongation values are higher in the case of viscose and
bamboo. Tencel fibres showed greater variability. Following figures 5.1 – 5.4
illustrates the differences in their properties.
Figure 5.1: Figure 5.2:
Fibre length and CV% Fibre fineness and CV%
Figure 5.3: Figure 5.4:
Fibre tenacity and CV% Fibre elongation and CV%
Print to PDF without this message by purchasing novaPDF (http://www.novapdf.com/)
94
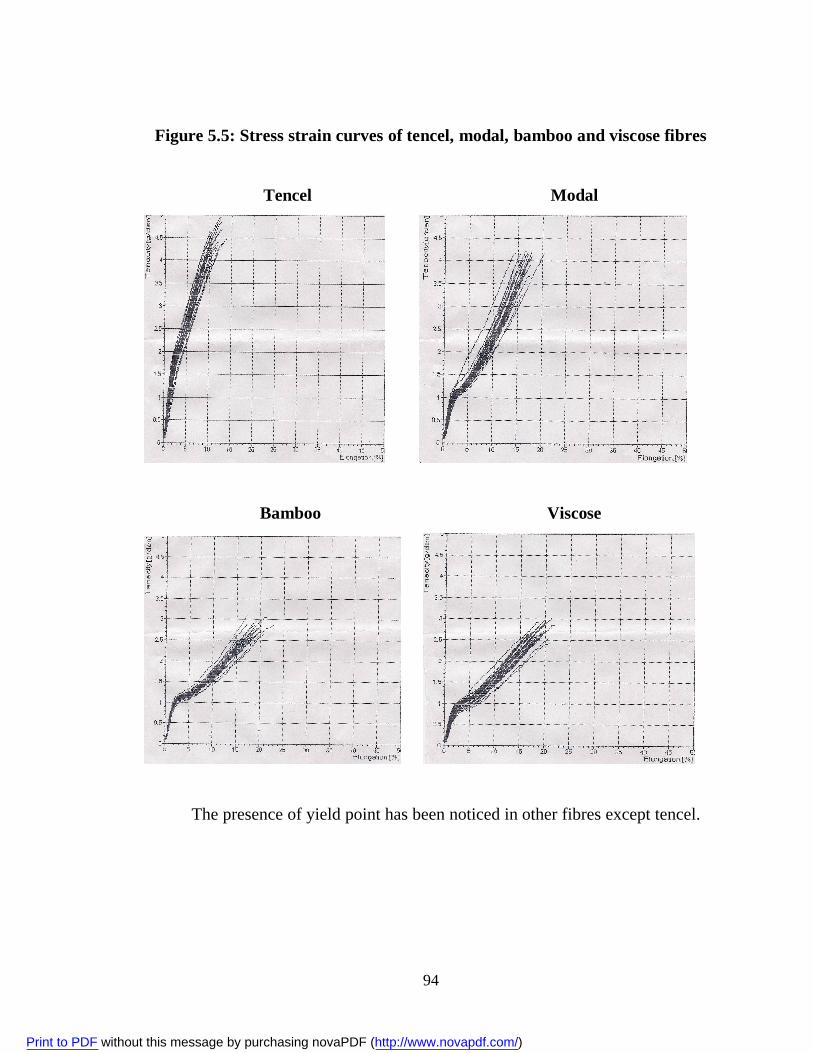
Figure 5.5: Stress strain curves of tencel, modal, bamboo and viscose fibres
Tencel Modal
Bamboo Viscose
The presence of yield point has been noticed in other fibres except tencel.
Print to PDF without this message by purchasing novaPDF (http://www.novapdf.com/)
95
WICKING RESULTS
Data on wicking height and time were analysed by four methods
Plotting height vs time and carrying out linear regression analysis.
Plotting height and square root of time so that the curve follows Lucas
Washburn trend. This is based on the method followed by Kamath et al.,
(1994).
Plotting H2 vs time and carrying out regression analysis as per the analysis
followed by Sharabathy et al., (2008) and Mazloompour et al., (2011).
Plotting logarithm of height vs logarithm of time and carrying out linear
regression analysis.
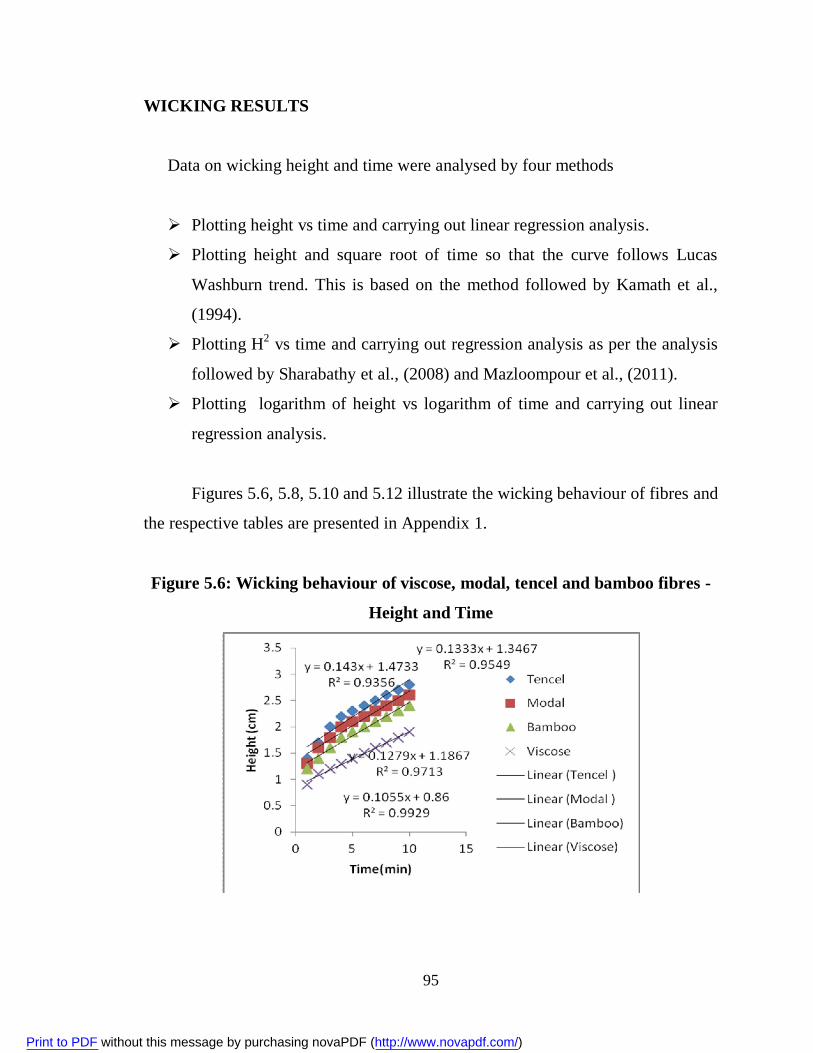
Figures 5.6, 5.8, 5.10 and 5.12 illustrate the wicking behaviour of fibres and
the respective tables are presented in Appendix 1.
Figure 5.6: Wicking behaviour of viscose, modal, tencel and bamboo fibres -
Height and Time
Print to PDF without this message by purchasing novaPDF (http://www.novapdf.com/)
96
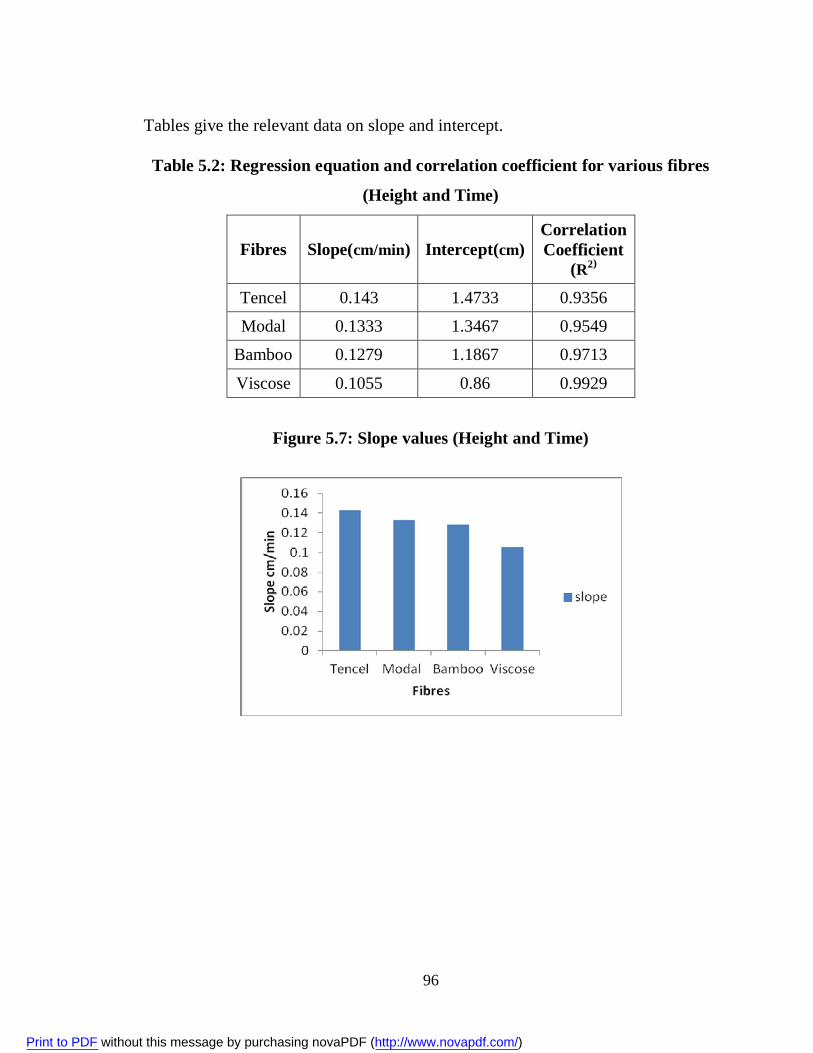
Tables give the relevant data on slope and intercept. Table 5.2: Regression equation and correlation coefficient for various fibres
(Height and Time)
Fibres Slope(cm/min) Intercept(cm) Correlation Coefficient
(R2)
Tencel 0.143 1.4733 0.9356
Modal 0.1333 1.3467 0.9549
Bamboo 0.1279 1.1867 0.9713
Viscose 0.1055 0.86 0.9929
Figure 5.7: Slope values (Height and Time)
Print to PDF without this message by purchasing novaPDF (http://www.novapdf.com/)
97
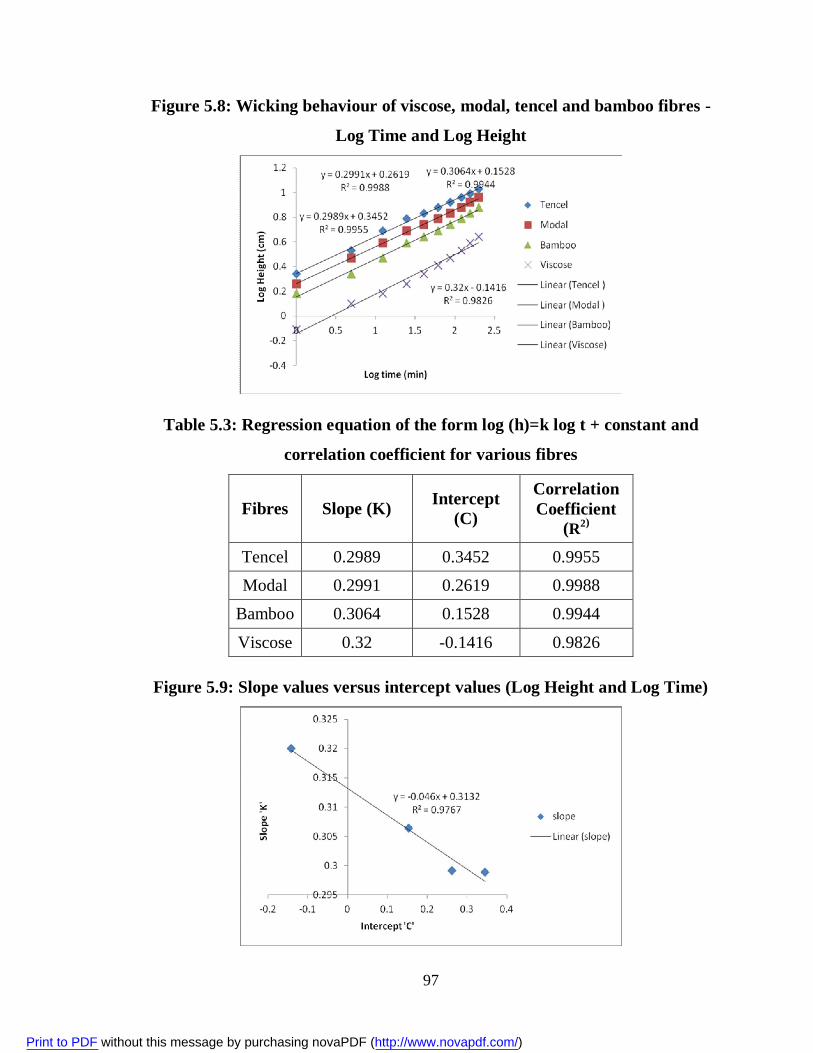
Figure 5.8: Wicking behaviour of viscose, modal, tencel and bamboo fibres -
Log Time and Log Height
Table 5.3: Regression equation of the form log (h)=k log t + constant and
correlation coefficient for various fibres
Fibres Slope (K) Intercept (C)
Correlation Coefficient
(R2)
Tencel 0.2989 0.3452 0.9955
Modal 0.2991 0.2619 0.9988
Bamboo 0.3064 0.1528 0.9944
Viscose 0.32 -0.1416 0.9826
Figure 5.9: Slope values versus intercept values (Log Height and Log Time)
Print to PDF without this message by purchasing novaPDF (http://www.novapdf.com/)
98
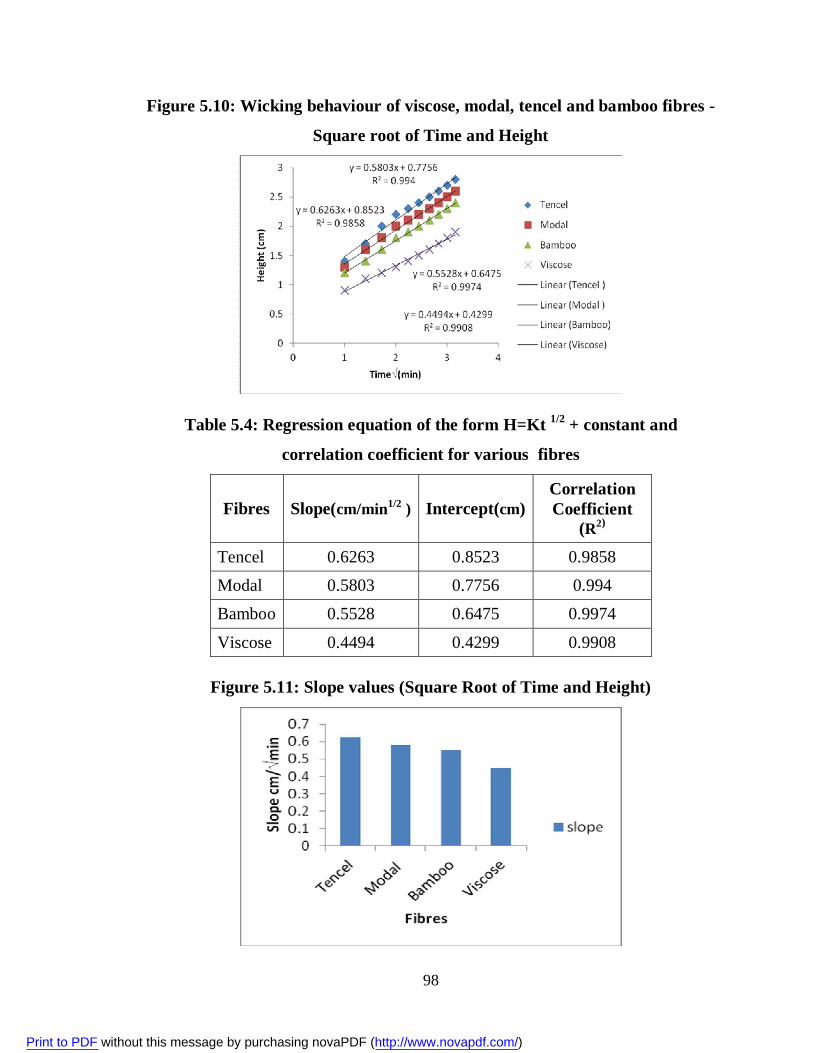
Figure 5.10: Wicking behaviour of viscose, modal, tencel and bamboo fibres -
Square root of Time and Height
Table 5.4: Regression equation of the form H=Kt 1/2 + constant and
correlation coefficient for various fibres
Fibres Slope(cm/min1/2 ) Intercept(cm) Correlation Coefficient
(R2)
Tencel 0.6263 0.8523 0.9858
Modal 0.5803 0.7756 0.994
Bamboo 0.5528 0.6475 0.9974
Viscose 0.4494 0.4299 0.9908
Figure 5.11: Slope values (Square Root of Time and Height)
Print to PDF without this message by purchasing novaPDF (http://www.novapdf.com/)
99
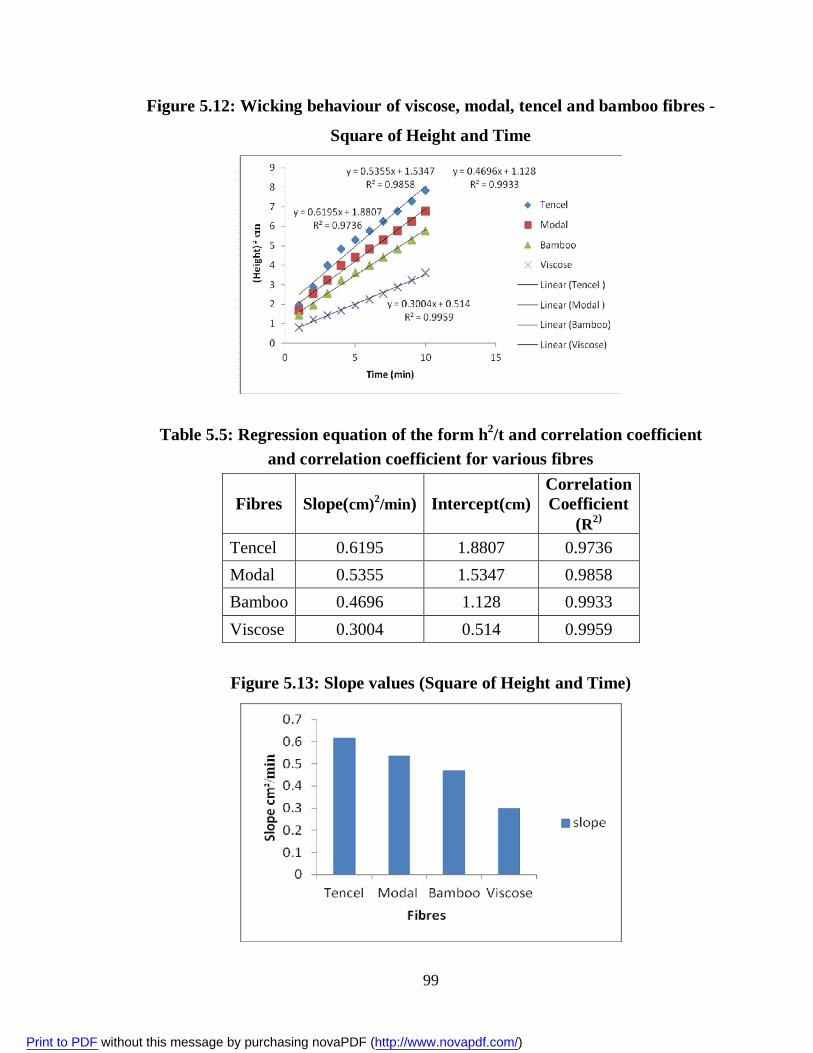
Figure 5.12: Wicking behaviour of viscose, modal, tencel and bamboo fibres -
Square of Height and Time
Table 5.5: Regression equation of the form h2/t and correlation coefficient and correlation coefficient for various fibres
Fibres Slope(cm)2/min) Intercept(cm) Correlation Coefficient
(R2)
Tencel 0.6195 1.8807 0.9736 Modal 0.5355 1.5347 0.9858 Bamboo 0.4696 1.128 0.9933 Viscose 0.3004 0.514 0.9959
Figure 5.13: Slope values (Square of Height and Time)
Print to PDF without this message by purchasing novaPDF (http://www.novapdf.com/)
100
In the first method of analyzing wicking, the wicking time was plotted
against the wicking height and the regression equation and correlation coefficient
were computed and shown in Table 5.2.Tencel fibres show higher values of slope
and intercept followed by modal, bamboo and viscose fibres. The correlation
between height and time was found to be good. This is due to the molecular
structure of tencel which consists of fine crystalline micro fibrils with fine pores.
The space between these micro fibrils acts like capillaries giving rise to enhanced
capillary effect. Also such crystalline arrangement of micro fibrils is uniformly
distributed in tencel unlike viscose, bamboo and modal. Hence tencel fibres
showed maximum wicking behaviour compared to other fibres In the second
method of analyzing wicking, the logarithm of wicking time was plotted against
the logarithm of wicking height. Values of the time exponent (K) and intercept
values were computed and shown in Table 5.3. Higher values of ‘C’ and lower
values of ‘K’ indicate good wickability and vice versa. Slopes and intercepts
obtained from log h –log t values were plotted to illustrate the trend as shown in
Figure 5.9. There was a negative correlation between slope K and intercept C as
suggested by Laughlin and Davies (1961) which has to be considered for
interpreting wickability. It is clear that there is an interdependency between K
and C.
In the third method , the wicking height was plotted against the square root
of time which is based on the Kamath et al.’s procedure adopted for the studies.
Table 5.4 shows the slopes and intercept values (Model assumed Kt ½ + constant,
where K is the slope) whereas the h2/t values are shown in Table 5.5. In this
method, square of height was plotted against time. In both the cases, tencel fibres
with higher values of slopes and intercepts exhibited good wickability and the
correlation was found to be good. Slope values obtained from height and time,
height and square root of time, square of height and time were plotted to illustrate
the trend as shown in Figures 5.7, 5.11 and 5.13.
Print to PDF without this message by purchasing novaPDF (http://www.novapdf.com/)
101
5.4 CONCLUSION
Among the fibres studied for wickability, it has been noticed that tencel
exhibits maximum wicking behaviour. The tenacity was also found to be higher
compared to other fibres.
Print to PDF without this message by purchasing novaPDF (http://www.novapdf.com/)