chapter 5 incineration and open burning of waste … · chapter 5: incineration and open burning of...
TRANSCRIPT
Chapter 5: Incineration and Open Burning of Waste
2006 IPCC Guidelines for National Greenhouse Gas Inventories 5.1
C H A P T E R 5
INCINERATION AND OPEN BURNING OF WASTE

Volume 5: Waste
5.2 2006 IPCC Guidelines for National Greenhouse Gas Inventories
Authors
G.H. Sabin Guendehou (Benin), Matthias Koch (Germany)
Leif Hockstad (USA), Riitta Pipatti (Finland), and Masato Yamada (Japan)
Chapter 5: Incineration and Open Burning of Waste
2006 IPCC Guidelines for National Greenhouse Gas Inventories 5.3
Contents
5 Incineration and Open Burning of Waste
5.1 Introduction ..................................................................................................................................................... 5.5 5.2 Methodological issues ..................................................................................................................................... 5.6
5.2.1 Choice of method for estimating CO2 emissions ................................................................................... 5.6 5.2.2 Choice of method for estimating CH4 emissions ................................................................................. 5.11 5.2.3 Choice of method for estimating N2O emissions ................................................................................. 5.13
5.3 Choice of activity data .................................................................................................................................. 5.15 5.3.1 Amount of waste incinerated ................................................................................................................ 5.15 5.3.2 Amount of waste open-burned ............................................................................................................. 5.16 5.3.3 Dry matter content ................................................................................................................................ 5.17
5.4 Choice of emission factors ............................................................................................................................ 5.18 5.4.1 CO2 emission factors ............................................................................................................................ 5.18 5.4.2 CH4 emission factors ............................................................................................................................ 5.20 5.4.3 N2O emission factors ............................................................................................................................ 5.21
5.5 Completeness ................................................................................................................................................ 5.22 5.6 Developing a consistent time series .............................................................................................................. 5.23 5.7 Uncertainty assessment ................................................................................................................................. 5.23
5.7.1 Emission factor uncertainties ............................................................................................................... 5.23 5.7.2 Activity data uncertainties .................................................................................................................... 5.24
5.8 QA/QC, Reporting and Documentation ....................................................................................................... 5.24 5.8.1 Inventory Quality Assurance/Quality Control (QA/QC) .................................................................... 5.24 5.8.2 Reporting and Documentation ............................................................................................................. 5.25
References ...................................................................................................................................................................... 5.25
Volume 5: Waste
5.4 2006 IPCC Guidelines for National Greenhouse Gas Inventories
Equations
Equation 5.1 CO2 emission estimate based on the total amount of waste combusted ....................................... 5.7 Equation 5.2 CO2 emission estimate based on the MSW composition .............................................................. 5.7 Equation 5.3 CO2 emission from incineration of fossil liquid waste ................................................................ 5.10 Equation 5.4 CH4 emission estimate based on the total amount of waste combusted ..................................... 5.12 Equation 5.5 N2O emission estimate based on the waste input to the incinerators .......................................... 5.14 Equation 5.6 N2O emission estimate based on influencing factors .................................................................. 5.14 Equation 5.7 Total amount of municipal solid waste open-burned .................................................................. 5.16 Equation 5.8 Dry matter content in MSW ........................................................................................................ 5.17 Equation 5.9 Total carbon content in MSW ...................................................................................................... 5.19 Equation 5.10 Fossil carbon fraction (FCF) in MSW ......................................................................................... 5.19
Figures
Figure 5.1 Decision Tree for CO2 emissions from incineration and open burning of waste ......................... 5.9 Figure 5.2 Decision Tree for CH4 and N2O emissions from incineration/open-burning of waste .............. 5.12
Tables
Table 5.1 Overview of data sources of different tier levels ............................................................................ 10 Table 5.2 Default data for CO2 emission factors for incineration and open burning of waste ...................... 18 Table 5.3 CH4 emission factors for incineration of MSW ............................................................................. 20 Table 5.4 N2O emission factors for incineration of MSW ............................................................................. 21 Table 5.5 N2O emission factors for incineration of sludge and industrial waste ........................................... 21 Table 5.6 Default N2O emission factors for different types of waste and management practices ................ 22
Boxes
Box 5.1 Example of estimating MSWB ..................................................................................................... 5.17
Chapter 5: Incineration and Open Burning of Waste
2006 IPCC Guidelines for National Greenhouse Gas Inventories 5.5
5 INCINERATION AND OPEN BURNING OF WASTE
5.1 INTRODUCTION Waste incineration is defined as the combustion of solid and liquid waste in controlled incineration facilities. Modern refuse combustors have tall stacks and specially designed combustion chambers, which provide high combustion temperatures, long residence times, and efficient waste agitation while introducing air for more complete combustion. Types of waste incinerated include municipal solid waste (MSW), industrial waste, hazardous waste, clinical waste and sewage sludge1. The practice of MSW incineration is currently more common in developed countries, while it is common for both developed and developing countries to incinerate clinical waste.
Emissions from waste incineration without energy recovery are reported in the Waste Sector, while emissions from incineration with energy recovery are reported in the Energy Sector, both with a distinction between fossil and biogenic carbon dioxide (CO2) emissions. The methodology described in this chapter is applicable in general both to incineration with and without energy recovery. Co-firing of specific waste fractions with other fuels is not addressed in this chapter, as co-firing is covered in Volume 2, Energy. Emissions from agricultural residue burning are considered in the AFOLU Sector, Chapter 5 of Volume 4.
Open burning of waste can be defined as the combustion of unwanted combustible materials such as paper, wood, plastics, textiles, rubber, waste oils and other debris in nature (open-air) or in open dumps, where smoke and other emissions are released directly into the air without passing through a chimney or stack. Open burning can also include incineration devices that do not control the combustion air to maintain an adequate temperature and do not provide sufficient residence time for complete combustion. This waste management practice is used in many developing countries while in developed countries open burning of waste may either be strictly regulated, or otherwise occur more frequently in rural areas than in urban areas.
Incineration and open burning of waste are sources of greenhouse gas emissions, like other types of combustion. Relevant gases emitted include CO2, methane (CH4) and nitrous oxide (N2O). Normally, emissions of CO2 from waste incineration are more significant than CH4 and N2O emissions.
Consistent with the 1996 Guidelines (IPCC, 1997), only CO2 emissions resulting from oxidation, during incineration and open burning of carbon in waste of fossil origin (e.g., plastics, certain textiles, rubber, liquid solvents, and waste oil) are considered net emissions and should be included in the national CO2 emissions estimate. The CO2 emissions from combustion of biomass materials (e.g., paper, food, and wood waste) contained in the waste are biogenic emissions and should not be included in national total emission estimates. However, if incineration of waste is used for energy purposes, both fossil and biogenic CO2 emissions should be estimated. Only fossil CO2 should be included in national emissions under Energy Sector while biogenic CO2 should be reported as an information item also in the Energy Sector. Moreover, if combustion, or any other factor, is causing long term decline in the total carbon embodied in living biomass (e.g., forests), this net release of carbon should be evident in the calculation of CO2 emissions described in the Agriculture, Forestry and Other Land Use (AFOLU) Volume of the 2006 Guidelines.
This chapter provides guidance on methodological choices for estimating and reporting CO2, CH4 and N2O emissions from incineration and open burning of all types of combustible waste. Where possible, default values for activity data, emission factors and other parameters are provided.
Traditional air pollutants from combustion - non-methane volatile organic compounds (NMVOCs), carbon monoxide (CO), nitrogen oxides (NOx), sulphur oxides (SOx) - are covered by existing emission inventory systems. Therefore, the IPCC does not provide new methodologies for these gases here, but recommends that national experts or inventory compilers use existing published methods under international agreements. Some key examples of the current literature providing methods include EMEP/CORINAIR Guidebook (EMEP 2004), US EPA's Compilation of Air Pollutant Emissions Factors, AP-42, Fifth Edition (USEPA, 1995), EPA Emission Inventory Improvement Program Technical Report Series, Vol. III Chapter 16: Open Burning (USEPA, 2001).
The estimation of indirect N2O emissions, resulting from the conversion of nitrogen deposition to soils due to NOx emissions from waste incineration and open burning, is addressed in Section 5.4.3 of this chapter. General background
1 Waste generation, composition and management practices, including waste incineration and open burning, are addressed in detail
in Chapter 2 of this volume.
Volume 5: Waste
5.6 2006 IPCC Guidelines for National Greenhouse Gas Inventories
and information on the reporting of the indirect N2O emissions is given in Chapter 7, Precursors and Indirect Emissions, of Volume 1, General Guidance and Reporting.
5.2 METHODOLOGICAL ISSUES The choice of method will depend on national circumstances, including whether incineration and open burning of waste are key categories in the country, and to what extent country- and plant-specific information is available or can be gathered.
For waste incineration, the most accurate emission estimates can be developed by determining the emissions on a plant-by-plant basis and/or differentiated for each waste category (e.g., MSW, sewage sludge, industrial waste, and other waste including clinical waste and hazardous waste). The methods for estimating CO2, CH4 and N2O emissions from incineration and open burning of waste vary because of the different factors that influence emission levels. Estimation of the amount of fossil carbon in the waste burned is the most important factor determining the CO2 emissions. The non-CO2 emissions are more dependent on the technology and conditions during the incineration process.
Intentional burning of waste on solid waste disposal sites is sometimes used as a management practice in some countries. Emissions from this practice and those from unintentional fires (accidental fires on solid waste disposal sites) should be estimated and reported according to the methodology and guidance provided for open burning of waste.
The general approach to calculate greenhouse gas emissions from incineration and open burning of waste is to obtain the amount of dry weight of waste incinerated or open-burned (preferably differentiated by waste type) and to investigate the related greenhouse gas emission factors (preferably from country-specific information on the carbon content and the fossil carbon fraction). For CO2 emissions from incineration and open burning of waste, the basic approach is given here as an example of a consecutive approach:
• Identify types of wastes incinerated/open-burned: MSW, sewage sludge, industrial solid waste, and other wastes (especially hazardous waste and clinical waste) incinerated/open-burned.
• Compile data on the amount of waste incinerated/open-burned including documentation on methods used and data sources (e.g., waste statistics, surveys, expert judgement): Regional default data are also provided in Table 2.1 in Chapter 2, Waste Generation, Composition and Management Data, and country-specific data for a limited number of countries in Annex 2A.1 of this Volume. The default data should be used only when country-specific data are not available. For open burning, the amount of waste can be estimated based on demographic data. This is addressed in Section 5.3.2.
• Use default values provided on dry matter content, total carbon content, fossil carbon fraction and oxidation factor (see Section 5.4.1.3) for different types of wastes: For MSW, preferably identify the waste composition and calculate the respective dry matter content, total carbon content, and fossil carbon fraction using default data provided for each MSW component (plastic, paper, etc) in Section 2.3, Waste composition, of this Volume.
• Calculate the CO2 emissions from incineration and open burning of solid wastes.
• Provide data in the worksheets given in Annex 1 of this Volume.
For other waste types and other greenhouse gases, the approach usually does not differentiate as much as for the MSW in terms of waste composition. Detailed guidance on the choice of method, activity data and emission factors for all major types of waste to estimate the emissions from relevant waste incineration and burning practices is outlined in the following sections.
5.2.1 Choice of method for estimating CO2 emissions The common method for estimating CO2 emissions from incineration and open burning of waste is based on an estimate of the fossil carbon content in the waste combusted, multiplied by the oxidation factor, and converting the product (amount of fossil carbon oxidised) to CO2. The activity data are the waste inputs into the incinerator or the amount of waste open-burned, and the emission factors are based on the oxidised carbon content of the waste that is of fossil origin. Relevant data include the amount and composition of the waste, the dry matter content, the total carbon content, the fossil carbon fraction and the oxidation factor.
The following sections describe the tiers to be applied for the estimation of CO2 emissions from incineration and open burning of waste. The tiers differ to what extent the total amount of waste, the emission factors and parameters used are default (Tier 1), country-specific (Tier 2a, Tier 2b) or plant-specific (Tier 3).
Chapter 5: Incineration and Open Burning of Waste
2006 IPCC Guidelines for National Greenhouse Gas Inventories 5.7
5.2.1.1 TIER 1 The Tier 1 method is a simple method used when CO2 emissions from incineration/open burning are not a key category. Data on the amount of waste incinerated/open-burned are necessary2 . Default data on characteristic parameters (such as dry matter content, carbon content and fossil carbon fraction) for different types of waste (MSW, sewage sludge, industrial waste and other waste such as hazardous and clinical waste) are provided in Table 5.2 in this chapter and Tables 2.3 to 2.6 in Section 2.3, on waste composition in Chapter 2 of this Volume. The calculation of the CO2 emissions is based on an estimate of the amount of waste (wet weight) incinerated or open-burned taking into account the dry matter content, the total carbon content, the fraction of fossil carbon and the oxidation factor. The method based on the total amount of waste combusted is outlined in Equation 5.1, and the method based on the MSW composition is given in Equation 5.2. It is preferable to apply Equation 5.2 for MSW, but if the required MSW data are not available, Equation 5.1 should be used instead.
EQUATION 5.1 CO2 EMISSION ESTIMATE BASED ON THE TOTAL AMOUNT OF WASTE COMBUSTED
( ) 12/44•••••= ∑i
iiiii2 OFFCFCFdmSWEmissionsCO
Where:
CO2 Emissions = CO2 emissions in inventory year, Gg/yr
SWi = total amount of solid waste of type i (wet weight) incinerated or open-burned, Gg/yr
dmi = dry matter content in the waste (wet weight) incinerated or open-burned, (fraction)
CFi = fraction of carbon in the dry matter (total carbon content), (fraction)
FCFi = fraction of fossil carbon in the total carbon, (fraction)
OFi = oxidation factor, (fraction)
44/12 = conversion factor from C to CO2
i = type of waste incinerated/open-burned specified as follows:
MSW: municipal solid waste (if not estimated using Equation 5.2), ISW: industrial solid waste, SS: sewage sludge, HW: hazardous waste, CW: clinical waste, others (that must be specified)
If the activity data of wastes are available on a dry matter basis, which is preferable, the same equation can be applied without specifying the dry matter content and the wet weight separately. Also if a country has data on the fraction of fossil carbon in the dry matter, it does not need to provide CFi and FCFi separately but instead it should combine them into one component.
For MSW, it is good practice to calculate the CO2 emissions on the basis of waste types/material (such as paper, wood, plastics) in the waste incinerated or open-burned as shown in Equation 5.2.
EQUATION 5.2 CO2 EMISSION ESTIMATE BASED ON THE MSW COMPOSITION
( ) 12/44••••••= ∑j
jjjjj2 OFFCFCFdmWFMSWEmissionsCO
Where:
CO2 Emissions = CO2 emissions in inventory year, Gg/yr
MSW = total amount of municipal solid waste as wet weight incinerated or open-burned, Gg/yr
WFj = fraction of waste type/material of component j in the MSW (as wet weight incinerated or open- burned)
dmj = dry matter content in the component j of the MSW incinerated or open-burned, (fraction)
CFj = fraction of carbon in the dry matter (i.e., carbon content) of component j
2 The methodology is addressed under Section 5.3, Choice of Activity data, and Chapter 2, Waste Generation, Composition and
Management.
Volume 5: Waste
5.8 2006 IPCC Guidelines for National Greenhouse Gas Inventories
FCFj = fraction of fossil carbon in the total carbon of component j
OFj = oxidation factor, (fraction)
44/12 = conversion factor from C to CO2
with: 1=∑j
jWF
j = component of the MSW incinerated/open-burned such as paper/cardboard, textiles, food waste, wood, garden (yard) and park waste, disposable nappies, rubber and leather, plastics, metal, glass, other inert waste.
If data by waste type/material are not available, the default values for waste composition given in Section 2.3 Waste composition could be used.
If CO2 emissions from incineration and open burning of waste is a key category, it is good practice to apply a higher tier.
5.2.1.2 TIER 2 The Tier 2 method is based on country-specific data regarding waste generation, composition and management practices. Here, Equations 5.1 and 5.2 are also applied, as outlined for the Tier 1 method. It is good practice to use the Tier 2 method when CO2 emission from incineration and open burning of waste is a key category or when more detailed data are available or can be gathered.
Tier 2a requires the use of country-specific activity data on the waste composition and default data on other parameters for MSW (Equation 5.2). For other categories of waste, country-specific data on the amounts are required (Equation 5.1). Country-specific MSW composition, even if using default data on other parameters, will reduce uncertainties compared to the use of aggregated MSW statistics.
A Tier 2a method for open burning of waste could incorporate annual surveys on the amounts and the composition of waste burned by households, authorities and companies responsible for the waste management.
Tier 2b requires country-specific data on the amount of waste incinerated/open-burned by waste type (Equation 5.1) or MSW composition (Equation 5.2), dry matter content, carbon content, fossil carbon fraction and oxidation factor, in addition to country-specific waste composition data. If these data are available, an estimate according to Tier 2b will have lower uncertainty than Tier 2a.
A Tier 2b method for open burning of waste could incorporate annual and detailed surveys on the amounts and the composition of waste burned by households, authorities and companies responsible for the waste management described in Tier 2a, with a combined measurement programme for emission factors related to the practices of open burning in the country.
It is good practice to implement those measurement programmes in different periods of the year to allow consideration of all seasons since emission factors depend on the combustion conditions. For example, in some countries where there is a rainy season and open burning is practised, more waste is burned during the dry season because of better burning conditions. Under these circumstances emission factors may vary with season.
In any case, all country-specific methods, activity data and parameters used should be described and justified in a transparent manner. The documentation should include descriptions on any experimental procedures, measurements and analyses made as well as information on atmospheric parameters such as temperature, wind, and rainfall in the case of open burning.
5.2.1.3 TIER 3 The Tier 3 method utilises plant-specific data to estimate CO2 emissions from waste incineration. It is good practice at this tier level to consider parameters affecting both the fossil carbon content and the oxidation factor. Factors affecting the oxidation factor include:
• type of installation/technology: fixed bed, stoker, fluidised bed, kiln,
• operation mode: continuous, semi-continuous, batch type,
• size of the installation,
• parameters such as the carbon content in the ash.
Chapter 5: Incineration and Open Burning of Waste
2006 IPCC Guidelines for National Greenhouse Gas Inventories 5.9
The total fossil CO2 emissions from waste incineration are calculated as the sum of all plant-specific fossil CO2 emissions. It is good practice to include all waste types and the entire amount incinerated as well as all types of incinerators in the inventory. The estimation is done similarly as in the Tier 1 and Tier 2 methods and at the end, the CO2 emissions from all plants, installations and other subcategories are added up to estimate the total emissions from waste incineration in the country.
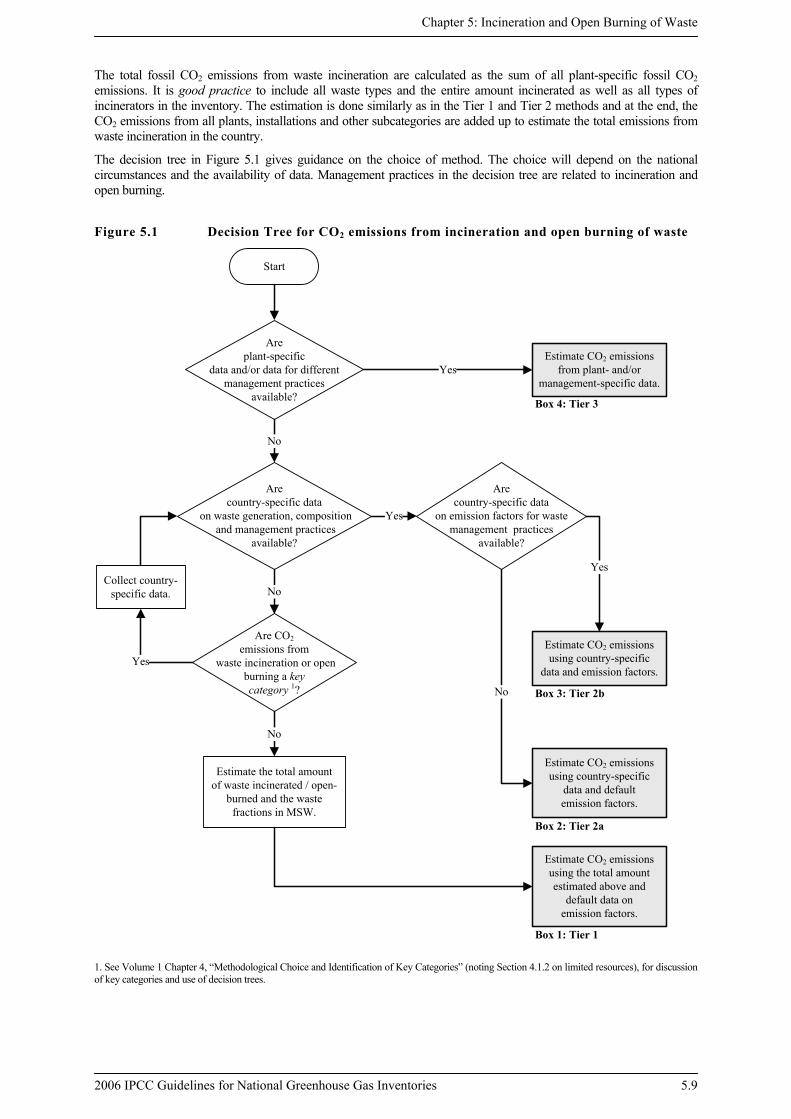
The decision tree in Figure 5.1 gives guidance on the choice of method. The choice will depend on the national circumstances and the availability of data. Management practices in the decision tree are related to incineration and open burning.
Figure 5.1 Decision Tree for CO2 emissions from incineration and open burning of waste
1. See Volume 1 Chapter 4, “Methodological Choice and Identification of Key Categories” (noting Section 4.1.2 on limited resources), for discussion of key categories and use of decision trees.
Start
Areplant-specific
data and/or data for differentmanagement practices
available?
Arecountry-specific data
on waste generation, composition and management practices
available?
Are CO2emissions from
waste incineration or open burning a keycategory 1?
Arecountry-specific data
on emission factors for waste management practices
available?
Estimate the total amountof waste incinerated / open-
burned and the waste fractions in MSW.
Collect country-specific data.
Estimate CO2 emissions from plant- and/or
management-specific data.
Estimate CO2 emissions using country-specific
data and emission factors.
Estimate CO2 emissions using country-specific
data and defaultemission factors.
Estimate CO2 emissions using the total amount estimated above and
default data onemission factors.
Yes
No
Yes
No
No
Yes
Yes
No
Box 4: Tier 3
Box 3: Tier 2b
Box 2: Tier 2a
Box 1: Tier 1
Volume 5: Waste
5.10 2006 IPCC Guidelines for National Greenhouse Gas Inventories
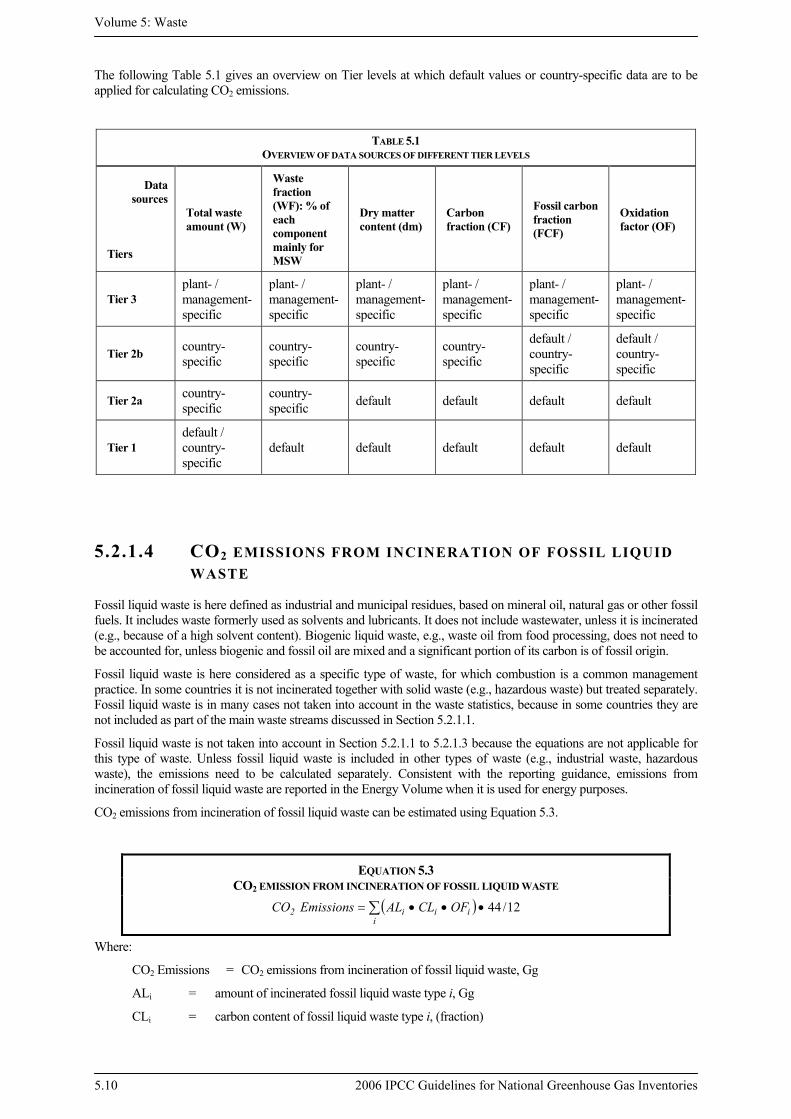
The following Table 5.1 gives an overview on Tier levels at which default values or country-specific data are to be applied for calculating CO2 emissions.
TABLE 5.1 OVERVIEW OF DATA SOURCES OF DIFFERENT TIER LEVELS
Data sources
Tiers
Total waste amount (W)
Waste fraction (WF): % of each component mainly for MSW
Dry matter content (dm)
Carbon fraction (CF)
Fossil carbon fraction (FCF)
Oxidation factor (OF)
Tier 3 plant- / management-specific
plant- / management-specific
plant- / management-specific
plant- / management-specific
plant- / management-specific
plant- / management-specific
Tier 2b country-specific
country-specific
country-specific
country-specific
default / country-specific
default / country-specific
Tier 2a country-specific
country-specific default default default default
Tier 1 default / country-specific
default default default default default
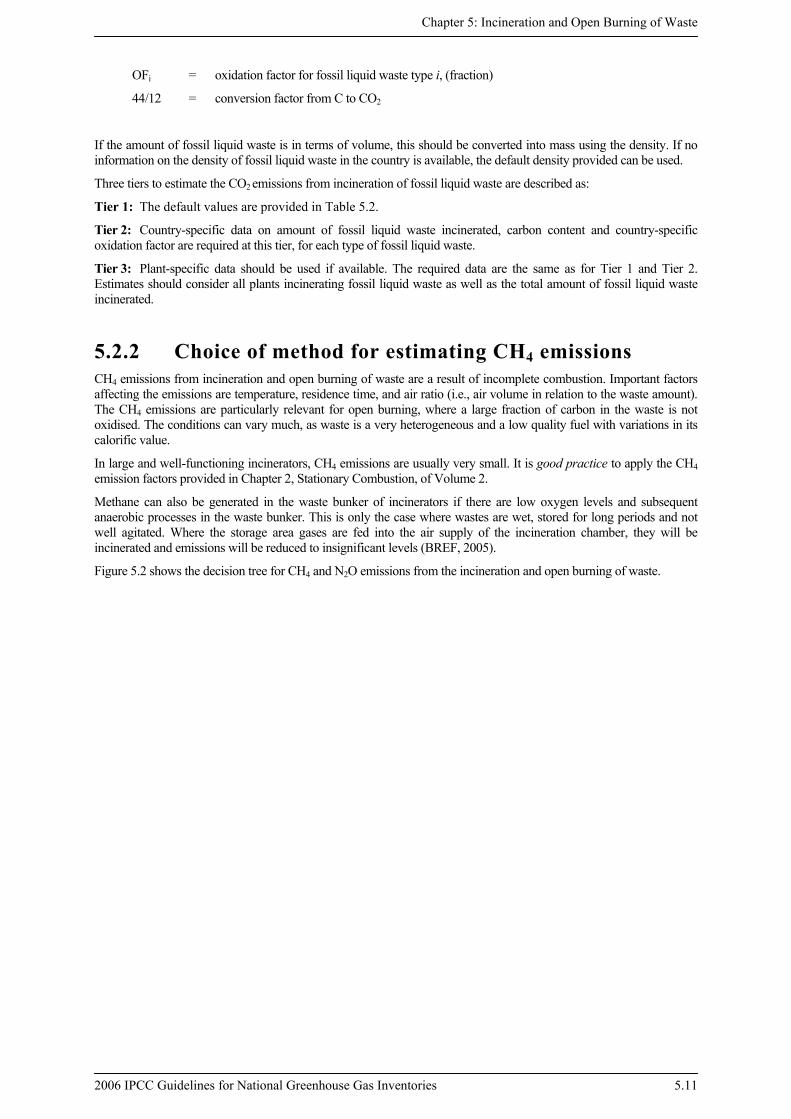
5.2.1.4 CO2 EMISSIONS FROM INCINERATION OF FOSSIL LIQUID WASTE
Fossil liquid waste is here defined as industrial and municipal residues, based on mineral oil, natural gas or other fossil fuels. It includes waste formerly used as solvents and lubricants. It does not include wastewater, unless it is incinerated (e.g., because of a high solvent content). Biogenic liquid waste, e.g., waste oil from food processing, does not need to be accounted for, unless biogenic and fossil oil are mixed and a significant portion of its carbon is of fossil origin.
Fossil liquid waste is here considered as a specific type of waste, for which combustion is a common management practice. In some countries it is not incinerated together with solid waste (e.g., hazardous waste) but treated separately. Fossil liquid waste is in many cases not taken into account in the waste statistics, because in some countries they are not included as part of the main waste streams discussed in Section 5.2.1.1.
Fossil liquid waste is not taken into account in Section 5.2.1.1 to 5.2.1.3 because the equations are not applicable for this type of waste. Unless fossil liquid waste is included in other types of waste (e.g., industrial waste, hazardous waste), the emissions need to be calculated separately. Consistent with the reporting guidance, emissions from incineration of fossil liquid waste are reported in the Energy Volume when it is used for energy purposes.
CO2 emissions from incineration of fossil liquid waste can be estimated using Equation 5.3.
EQUATION 5.3 CO2 EMISSION FROM INCINERATION OF FOSSIL LIQUID WASTE
( ) 12/44•••= ∑i
iii2 OFCLALEmissionsCO
Where:
CO2 Emissions = CO2 emissions from incineration of fossil liquid waste, Gg
ALi = amount of incinerated fossil liquid waste type i, Gg
CLi = carbon content of fossil liquid waste type i, (fraction)
Chapter 5: Incineration and Open Burning of Waste
2006 IPCC Guidelines for National Greenhouse Gas Inventories 5.11
OFi = oxidation factor for fossil liquid waste type i, (fraction)
44/12 = conversion factor from C to CO2
If the amount of fossil liquid waste is in terms of volume, this should be converted into mass using the density. If no information on the density of fossil liquid waste in the country is available, the default density provided can be used.
Three tiers to estimate the CO2 emissions from incineration of fossil liquid waste are described as:
Tier 1: The default values are provided in Table 5.2.
Tier 2: Country-specific data on amount of fossil liquid waste incinerated, carbon content and country-specific oxidation factor are required at this tier, for each type of fossil liquid waste.
Tier 3: Plant-specific data should be used if available. The required data are the same as for Tier 1 and Tier 2. Estimates should consider all plants incinerating fossil liquid waste as well as the total amount of fossil liquid waste incinerated.
5.2.2 Choice of method for estimating CH4 emissions CH4 emissions from incineration and open burning of waste are a result of incomplete combustion. Important factors affecting the emissions are temperature, residence time, and air ratio (i.e., air volume in relation to the waste amount). The CH4 emissions are particularly relevant for open burning, where a large fraction of carbon in the waste is not oxidised. The conditions can vary much, as waste is a very heterogeneous and a low quality fuel with variations in its calorific value.
In large and well-functioning incinerators, CH4 emissions are usually very small. It is good practice to apply the CH4 emission factors provided in Chapter 2, Stationary Combustion, of Volume 2.
Methane can also be generated in the waste bunker of incinerators if there are low oxygen levels and subsequent anaerobic processes in the waste bunker. This is only the case where wastes are wet, stored for long periods and not well agitated. Where the storage area gases are fed into the air supply of the incineration chamber, they will be incinerated and emissions will be reduced to insignificant levels (BREF, 2005).
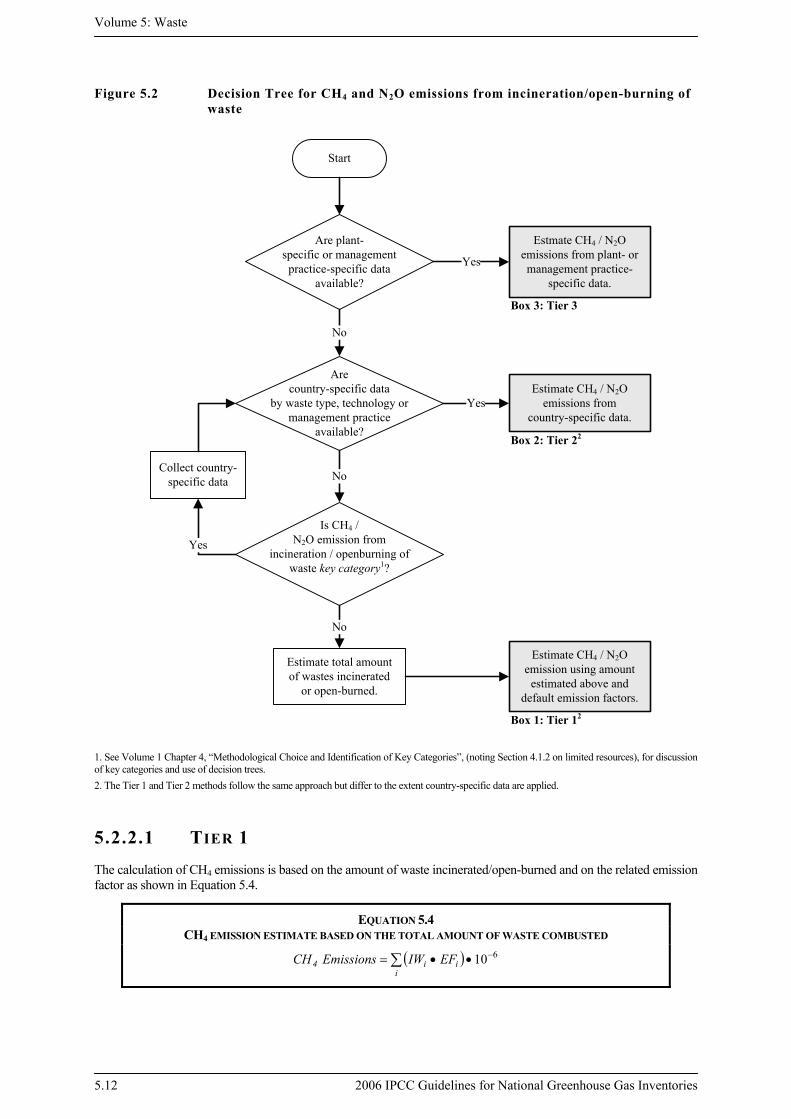
Figure 5.2 shows the decision tree for CH4 and N2O emissions from the incineration and open burning of waste.
Volume 5: Waste
5.12 2006 IPCC Guidelines for National Greenhouse Gas Inventories
Figure 5.2 Decision Tree for CH4 and N2O emissions from incineration/open-burning of waste
1. See Volume 1 Chapter 4, “Methodological Choice and Identification of Key Categories”, (noting Section 4.1.2 on limited resources), for discussion of key categories and use of decision trees. 2. The Tier 1 and Tier 2 methods follow the same approach but differ to the extent country-specific data are applied.
5.2.2.1 TIER 1 The calculation of CH4 emissions is based on the amount of waste incinerated/open-burned and on the related emission factor as shown in Equation 5.4.
EQUATION 5.4 CH4 EMISSION ESTIMATE BASED ON THE TOTAL AMOUNT OF WASTE COMBUSTED
( ) 610−••= ∑i
ii4 EFIWEmissionsCH
Box 1: Tier 12
Box 2: Tier 22
Box 3: Tier 3
Start
Are plant-specific or management
practice-specific data available?
Arecountry-specific data
by waste type, technology or management practice
available?
Is CH4 / N2O emission from
incineration / openburning ofwaste key category1?
Collect country-specific data
Estimate CH4 / N2Oemission using amount
estimated above anddefault emission factors.
Estimate CH4 / N2Oemissions from
country-specific data.
Estmate CH4 / N2O emissions from plant- ormanagement practice-
specific data.
Estimate total amountof wastes incinerated
or open-burned.
No
Yes
No
Yes
No
Yes
Chapter 5: Incineration and Open Burning of Waste
2006 IPCC Guidelines for National Greenhouse Gas Inventories 5.13
Where:
CH4 Emissions = CH4 emissions in inventory year, Gg/yr
IWi = amount of solid waste of type i incinerated or open-burned, Gg/yr
EFi = aggregate CH4 emission factor, kg CH4/Gg of waste
10-6 = conversion factor from kilogram to gigagram
i = category or type of waste incinerated/open-burned, specified as follows:
MSW: municipal solid waste, ISW: industrial solid waste, HW: hazardous waste, CW: clinical waste, SS: sewage sludge, others (that must be specified)
The amount and composition of waste should be consistent with the activity data used for estimating CO2 emissions from incineration/open burning.
Default emission factors are provided under Section 5.4.2, CH4 emission factors, for incineration and open burning of waste.
If the CH4 emissions from incineration or open burning of waste are key categories, it is good practice to use a higher tier.
5.2.2.2 TIER 2 Tier 2 is similar to Tier 1 but takes country-specific data into account. Tier 2 also follows Equation 5.4, as Tier 1. Inventory compilers should use country-specific data including activity data, emission factors by waste, technology or management practice.
Countries with a high proportion of open burning or batch-type/semi-continuous incinerators should consider further investigation of CH4 emission factors.
5.2.2.3 TIER 3 It is good practice to use the Tier 3 method when plant-specific data are available. All incinerators should be considered and their emissions summed.
Figure 5.2 provides a general decision tree for estimating CH4 emissions from incineration and open burning of waste. The best results will be obtained if country-specific or plant-specific CH4 emission factors are available. Information on CH4 from incineration and open burning of waste to satisfy the requirement of Tier 3 method is currently scant.
If detailed monitoring shows that the concentration of a greenhouse gas in the discharge from a combustion process is equal to or less than the concentration of the same gas in the ambient intake air to the combustion process then emissions may be reported as zero. Reporting these emissions as ‘negative emissions’ would require continuous high-quality monitoring of both the air intake and the atmospheric emissions.
5.2.3 Choice of method for estimating N2O emissions Nitrous oxide is emitted in combustion processes at relatively low combustion temperatures between 500 and 950 °C. Other important factors affecting the emissions are the type of air pollution control device, type and nitrogen content of the waste and the fraction of excess air (BREF, 2005; Korhonen et al., 2001; Löffler et al., 2002; Kilpinen, 2002; Tsupari et al., 2005). N2O emissions from the combustion of fossil liquid waste can be considered negligible, unless country-specific data indicate otherwise.
Figure 5.2 provides a general decision tree for the estimation of N2O emissions from incineration and open burning of waste. The most accurate results will be obtained if N2O emissions are determined for each plant based on the plant-specific monitoring data, and then summed.
Volume 5: Waste
5.14 2006 IPCC Guidelines for National Greenhouse Gas Inventories
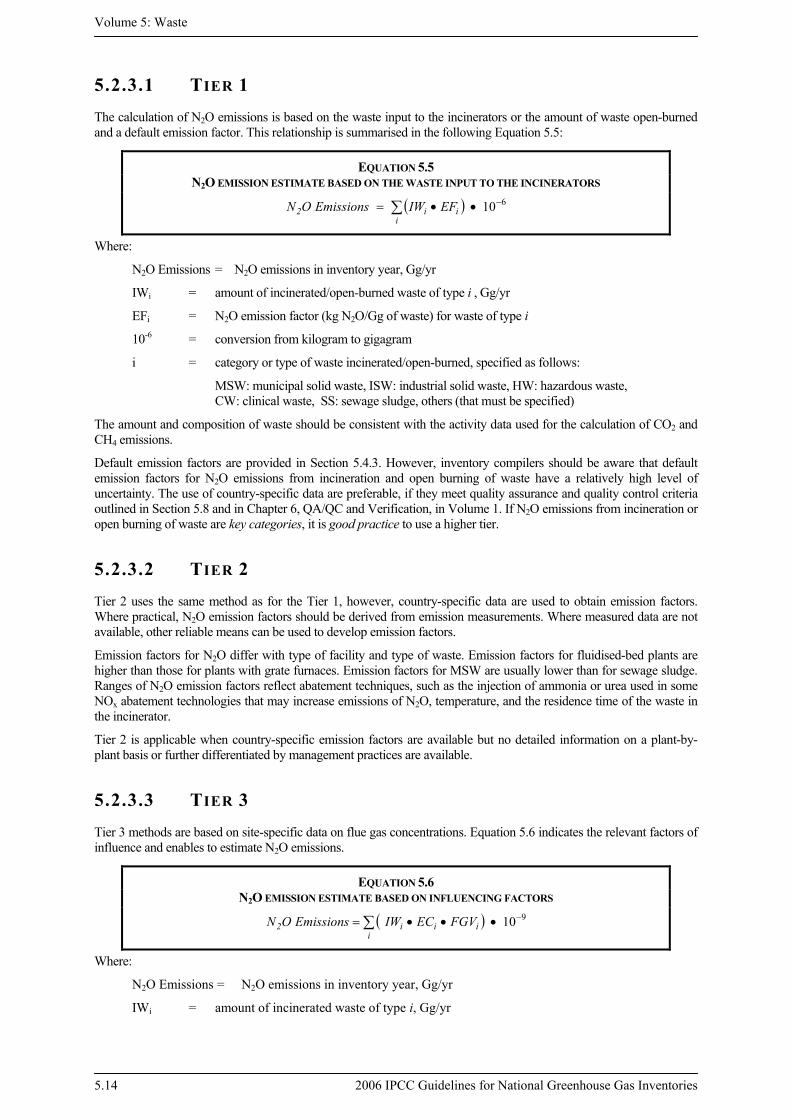
5.2.3.1 TIER 1 The calculation of N2O emissions is based on the waste input to the incinerators or the amount of waste open-burned and a default emission factor. This relationship is summarised in the following Equation 5.5:
EQUATION 5.5 N2O EMISSION ESTIMATE BASED ON THE WASTE INPUT TO THE INCINERATORS
( ) 610−••= ∑i
ii2 EFIWEmissionsON
Where:
N2O Emissions = N2O emissions in inventory year, Gg/yr
IWi = amount of incinerated/open-burned waste of type i , Gg/yr
EFi = N2O emission factor (kg N2O/Gg of waste) for waste of type i
10-6 = conversion from kilogram to gigagram
i = category or type of waste incinerated/open-burned, specified as follows:
MSW: municipal solid waste, ISW: industrial solid waste, HW: hazardous waste, CW: clinical waste, SS: sewage sludge, others (that must be specified)
The amount and composition of waste should be consistent with the activity data used for the calculation of CO2 and CH4 emissions.
Default emission factors are provided in Section 5.4.3. However, inventory compilers should be aware that default emission factors for N2O emissions from incineration and open burning of waste have a relatively high level of uncertainty. The use of country-specific data are preferable, if they meet quality assurance and quality control criteria outlined in Section 5.8 and in Chapter 6, QA/QC and Verification, in Volume 1. If N2O emissions from incineration or open burning of waste are key categories, it is good practice to use a higher tier.
5.2.3.2 TIER 2 Tier 2 uses the same method as for the Tier 1, however, country-specific data are used to obtain emission factors. Where practical, N2O emission factors should be derived from emission measurements. Where measured data are not available, other reliable means can be used to develop emission factors.
Emission factors for N2O differ with type of facility and type of waste. Emission factors for fluidised-bed plants are higher than those for plants with grate furnaces. Emission factors for MSW are usually lower than for sewage sludge. Ranges of N2O emission factors reflect abatement techniques, such as the injection of ammonia or urea used in some NOx abatement technologies that may increase emissions of N2O, temperature, and the residence time of the waste in the incinerator.
Tier 2 is applicable when country-specific emission factors are available but no detailed information on a plant-by-plant basis or further differentiated by management practices are available.
5.2.3.3 TIER 3 Tier 3 methods are based on site-specific data on flue gas concentrations. Equation 5.6 indicates the relevant factors of influence and enables to estimate N2O emissions.
EQUATION 5.6 N2O EMISSION ESTIMATE BASED ON INFLUENCING FACTORS
( ) 910−•••= ∑i
iii2 FGVECIWEmissionsON
Where:
N2O Emissions = N2O emissions in inventory year, Gg/yr
IWi = amount of incinerated waste of type i, Gg/yr
Chapter 5: Incineration and Open Burning of Waste
2006 IPCC Guidelines for National Greenhouse Gas Inventories 5.15
ECi = N2O emission concentration in flue gas from the incineration of waste type i, mg N2O/m3
FGVi = flue gas volume by amount of incinerated waste type i, m3/Mg
10-9 = conversion to gigagram
i = category or type of waste incinerated/open-burned, specified as follows:
MSW: municipal solid waste, ISW: industrial solid waste, HW: hazardous waste, CW: clinical waste, SS: sewage sludge, others (that must be specified)
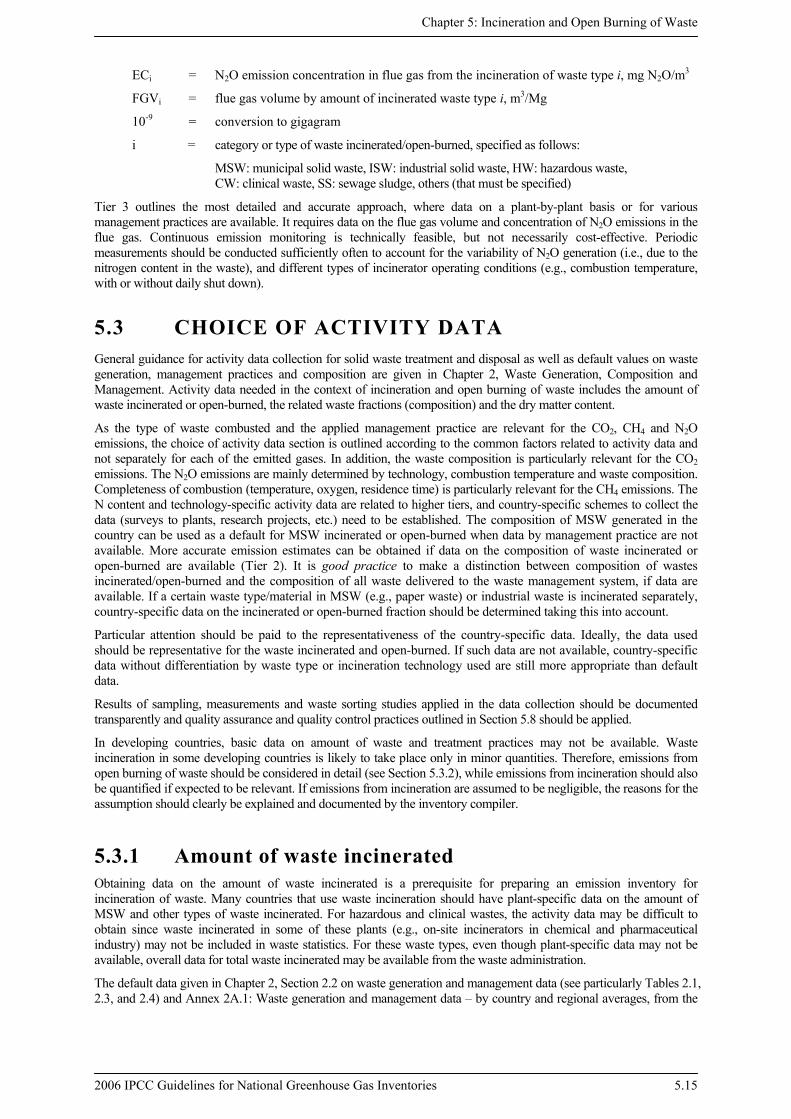
Tier 3 outlines the most detailed and accurate approach, where data on a plant-by-plant basis or for various management practices are available. It requires data on the flue gas volume and concentration of N2O emissions in the flue gas. Continuous emission monitoring is technically feasible, but not necessarily cost-effective. Periodic measurements should be conducted sufficiently often to account for the variability of N2O generation (i.e., due to the nitrogen content in the waste), and different types of incinerator operating conditions (e.g., combustion temperature, with or without daily shut down).
5.3 CHOICE OF ACTIVITY DATA General guidance for activity data collection for solid waste treatment and disposal as well as default values on waste generation, management practices and composition are given in Chapter 2, Waste Generation, Composition and Management. Activity data needed in the context of incineration and open burning of waste includes the amount of waste incinerated or open-burned, the related waste fractions (composition) and the dry matter content.
As the type of waste combusted and the applied management practice are relevant for the CO2, CH4 and N2O emissions, the choice of activity data section is outlined according to the common factors related to activity data and not separately for each of the emitted gases. In addition, the waste composition is particularly relevant for the CO2 emissions. The N2O emissions are mainly determined by technology, combustion temperature and waste composition. Completeness of combustion (temperature, oxygen, residence time) is particularly relevant for the CH4 emissions. The N content and technology-specific activity data are related to higher tiers, and country-specific schemes to collect the data (surveys to plants, research projects, etc.) need to be established. The composition of MSW generated in the country can be used as a default for MSW incinerated or open-burned when data by management practice are not available. More accurate emission estimates can be obtained if data on the composition of waste incinerated or open-burned are available (Tier 2). It is good practice to make a distinction between composition of wastes incinerated/open-burned and the composition of all waste delivered to the waste management system, if data are available. If a certain waste type/material in MSW (e.g., paper waste) or industrial waste is incinerated separately, country-specific data on the incinerated or open-burned fraction should be determined taking this into account.
Particular attention should be paid to the representativeness of the country-specific data. Ideally, the data used should be representative for the waste incinerated and open-burned. If such data are not available, country-specific data without differentiation by waste type or incineration technology used are still more appropriate than default data.
Results of sampling, measurements and waste sorting studies applied in the data collection should be documented transparently and quality assurance and quality control practices outlined in Section 5.8 should be applied.
In developing countries, basic data on amount of waste and treatment practices may not be available. Waste incineration in some developing countries is likely to take place only in minor quantities. Therefore, emissions from open burning of waste should be considered in detail (see Section 5.3.2), while emissions from incineration should also be quantified if expected to be relevant. If emissions from incineration are assumed to be negligible, the reasons for the assumption should clearly be explained and documented by the inventory compiler.
5.3.1 Amount of waste incinerated Obtaining data on the amount of waste incinerated is a prerequisite for preparing an emission inventory for incineration of waste. Many countries that use waste incineration should have plant-specific data on the amount of MSW and other types of waste incinerated. For hazardous and clinical wastes, the activity data may be difficult to obtain since waste incinerated in some of these plants (e.g., on-site incinerators in chemical and pharmaceutical industry) may not be included in waste statistics. For these waste types, even though plant-specific data may not be available, overall data for total waste incinerated may be available from the waste administration.
The default data given in Chapter 2, Section 2.2 on waste generation and management data (see particularly Tables 2.1, 2.3, and 2.4) and Annex 2A.1: Waste generation and management data – by country and regional averages, from the
Volume 5: Waste
5.16 2006 IPCC Guidelines for National Greenhouse Gas Inventories
respective region or neighbouring countries with similar conditions could be used when country-specific data are not available.
It is good practice to apply accurate boundaries system for the distinction to report emissions under the energy, waste or industry sections. Also, agricultural residue burning should be reported in the AFOLU Sector. See Section 5.8.2, Reporting and Documentation.
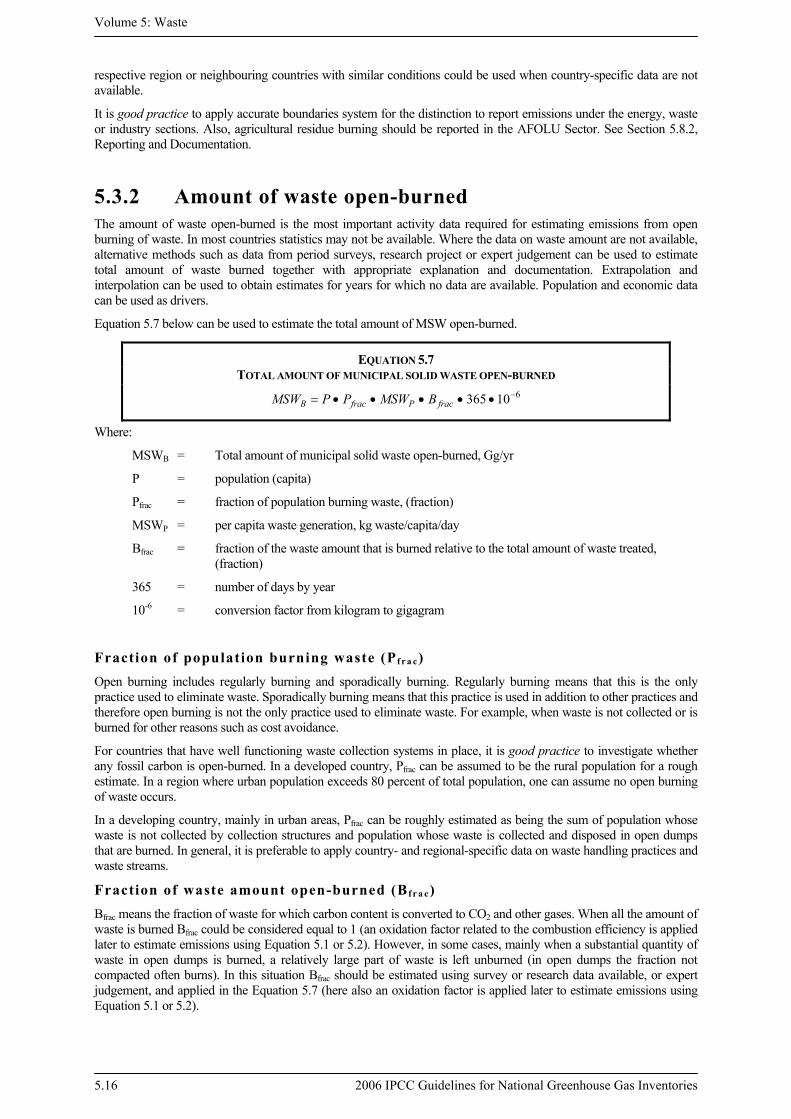
5.3.2 Amount of waste open-burned The amount of waste open-burned is the most important activity data required for estimating emissions from open burning of waste. In most countries statistics may not be available. Where the data on waste amount are not available, alternative methods such as data from period surveys, research project or expert judgement can be used to estimate total amount of waste burned together with appropriate explanation and documentation. Extrapolation and interpolation can be used to obtain estimates for years for which no data are available. Population and economic data can be used as drivers.
Equation 5.7 below can be used to estimate the total amount of MSW open-burned.
EQUATION 5.7 TOTAL AMOUNT OF MUNICIPAL SOLID WASTE OPEN-BURNED
610365 −•••••= fracPfracB BMSWPPMSW
Where:
MSWB = Total amount of municipal solid waste open-burned, Gg/yr
P = population (capita)
Pfrac = fraction of population burning waste, (fraction)
MSWP = per capita waste generation, kg waste/capita/day
Bfrac = fraction of the waste amount that is burned relative to the total amount of waste treated, (fraction)
365 = number of days by year
10-6 = conversion factor from kilogram to gigagram
Fraction of population burning waste (Pf r a c)
Open burning includes regularly burning and sporadically burning. Regularly burning means that this is the only practice used to eliminate waste. Sporadically burning means that this practice is used in addition to other practices and therefore open burning is not the only practice used to eliminate waste. For example, when waste is not collected or is burned for other reasons such as cost avoidance.
For countries that have well functioning waste collection systems in place, it is good practice to investigate whether any fossil carbon is open-burned. In a developed country, Pfrac can be assumed to be the rural population for a rough estimate. In a region where urban population exceeds 80 percent of total population, one can assume no open burning of waste occurs.
In a developing country, mainly in urban areas, Pfrac can be roughly estimated as being the sum of population whose waste is not collected by collection structures and population whose waste is collected and disposed in open dumps that are burned. In general, it is preferable to apply country- and regional-specific data on waste handling practices and waste streams.
Fraction of waste amount open-burned (Bf r a c)
Bfrac means the fraction of waste for which carbon content is converted to CO2 and other gases. When all the amount of waste is burned Bfrac could be considered equal to 1 (an oxidation factor related to the combustion efficiency is applied later to estimate emissions using Equation 5.1 or 5.2). However, in some cases, mainly when a substantial quantity of waste in open dumps is burned, a relatively large part of waste is left unburned (in open dumps the fraction not compacted often burns). In this situation Bfrac should be estimated using survey or research data available, or expert judgement, and applied in the Equation 5.7 (here also an oxidation factor is applied later to estimate emissions using Equation 5.1 or 5.2).
Chapter 5: Incineration and Open Burning of Waste
2006 IPCC Guidelines for National Greenhouse Gas Inventories 5.17
When open burning is practiced, countries are encouraged to undertake surveys in order to estimate Pfrac and Bfrac and then MSWB using the Equation 5.7.
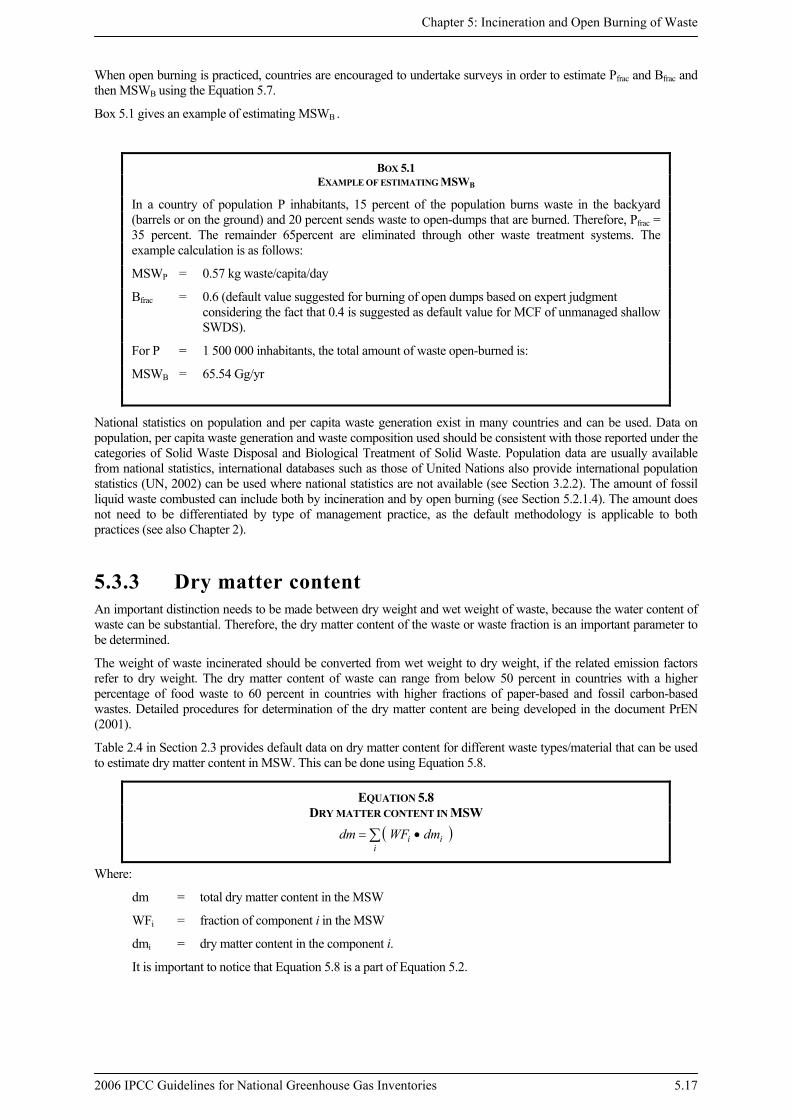
Box 5.1 gives an example of estimating MSWB .
BOX 5.1 EXAMPLE OF ESTIMATING MSWB
In a country of population P inhabitants, 15 percent of the population burns waste in the backyard (barrels or on the ground) and 20 percent sends waste to open-dumps that are burned. Therefore, Pfrac = 35 percent. The remainder 65percent are eliminated through other waste treatment systems. The example calculation is as follows:
MSWP = 0.57 kg waste/capita/day
Bfrac = 0.6 (default value suggested for burning of open dumps based on expert judgment considering the fact that 0.4 is suggested as default value for MCF of unmanaged shallow SWDS).
For P = 1 500 000 inhabitants, the total amount of waste open-burned is:
MSWB = 65.54 Gg/yr
National statistics on population and per capita waste generation exist in many countries and can be used. Data on population, per capita waste generation and waste composition used should be consistent with those reported under the categories of Solid Waste Disposal and Biological Treatment of Solid Waste. Population data are usually available from national statistics, international databases such as those of United Nations also provide international population statistics (UN, 2002) can be used where national statistics are not available (see Section 3.2.2). The amount of fossil liquid waste combusted can include both by incineration and by open burning (see Section 5.2.1.4). The amount does not need to be differentiated by type of management practice, as the default methodology is applicable to both practices (see also Chapter 2).
5.3.3 Dry matter content An important distinction needs to be made between dry weight and wet weight of waste, because the water content of waste can be substantial. Therefore, the dry matter content of the waste or waste fraction is an important parameter to be determined.
The weight of waste incinerated should be converted from wet weight to dry weight, if the related emission factors refer to dry weight. The dry matter content of waste can range from below 50 percent in countries with a higher percentage of food waste to 60 percent in countries with higher fractions of paper-based and fossil carbon-based wastes. Detailed procedures for determination of the dry matter content are being developed in the document PrEN (2001).
Table 2.4 in Section 2.3 provides default data on dry matter content for different waste types/material that can be used to estimate dry matter content in MSW. This can be done using Equation 5.8.
EQUATION 5.8 DRY MATTER CONTENT IN MSW
( )∑ •=i
ii dmWFdm
Where:
dm = total dry matter content in the MSW
WFi = fraction of component i in the MSW
dmi = dry matter content in the component i.
It is important to notice that Equation 5.8 is a part of Equation 5.2.
Volume 5: Waste
5.18 2006 IPCC Guidelines for National Greenhouse Gas Inventories
5.4 CHOICE OF EMISSION FACTORS Emission factors in the context of incineration and open burning of waste relate the amount of greenhouse gas emitted to the weight of waste incinerated or open-burned. In the case of CO2, this applies data on the fractions of carbon and fossil carbon in the waste. For CH4 and N2O, this primarily depends on the treatment practice and the combustion technology. For the estimation of CO2, CH4 and N2O emissions from incineration and open burning of waste, guidance on choice of the emission factors is outlined in the following sections.
5.4.1 CO2 emission factors It is generally more practical to estimate CO2 emissions from incineration and open burning of waste using calculations based on the carbon content in the waste, instead of measuring the CO2 concentration.
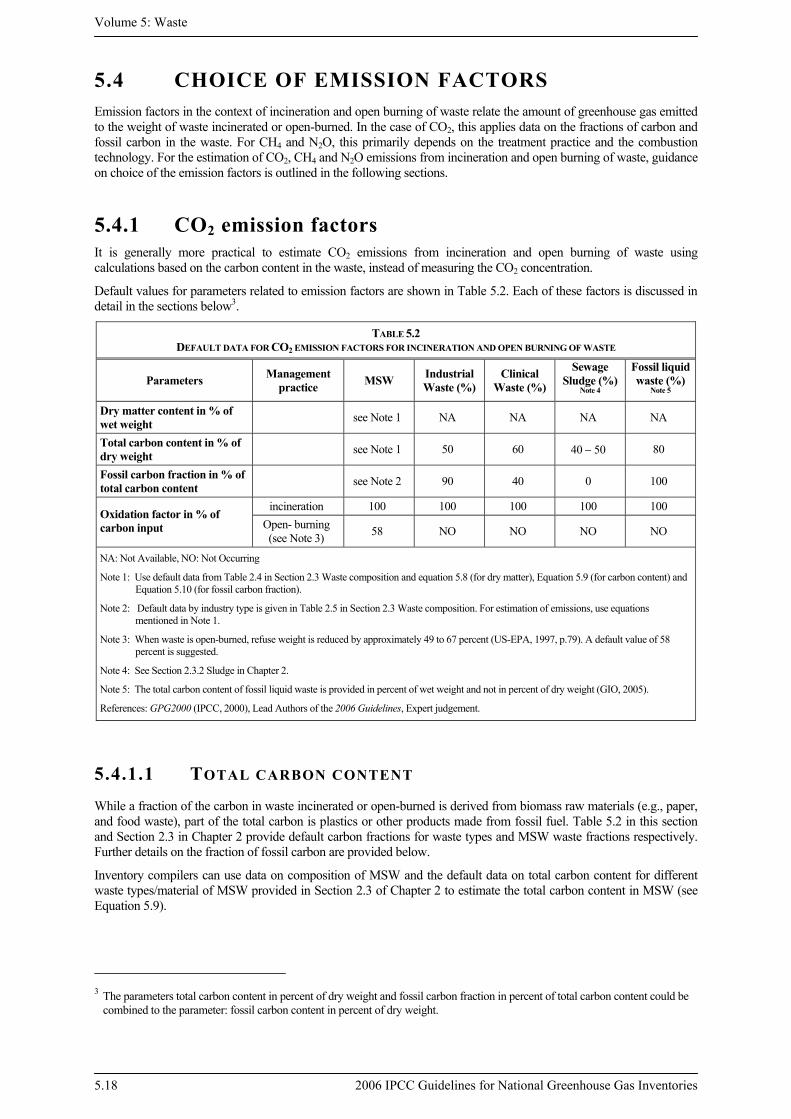
Default values for parameters related to emission factors are shown in Table 5.2. Each of these factors is discussed in detail in the sections below3.
TABLE 5.2 DEFAULT DATA FOR CO2 EMISSION FACTORS FOR INCINERATION AND OPEN BURNING OF WASTE
Parameters Management practice MSW Industrial
Waste (%) Clinical
Waste (%)
Sewage Sludge (%)
Note 4
Fossil liquid waste (%)
Note 5 Dry matter content in % of wet weight see Note 1 NA NA NA NA
Total carbon content in % of dry weight see Note 1 50 60 40 − 50 80
Fossil carbon fraction in % of total carbon content see Note 2 90 40 0 100
incineration 100 100 100 100 100 Oxidation factor in % of carbon input Open- burning
(see Note 3) 58 NO NO NO NO
NA: Not Available, NO: Not Occurring
Note 1: Use default data from Table 2.4 in Section 2.3 Waste composition and equation 5.8 (for dry matter), Equation 5.9 (for carbon content) and Equation 5.10 (for fossil carbon fraction).
Note 2: Default data by industry type is given in Table 2.5 in Section 2.3 Waste composition. For estimation of emissions, use equations mentioned in Note 1.
Note 3: When waste is open-burned, refuse weight is reduced by approximately 49 to 67 percent (US-EPA, 1997, p.79). A default value of 58 percent is suggested.
Note 4: See Section 2.3.2 Sludge in Chapter 2.
Note 5: The total carbon content of fossil liquid waste is provided in percent of wet weight and not in percent of dry weight (GIO, 2005).
References: GPG2000 (IPCC, 2000), Lead Authors of the 2006 Guidelines, Expert judgement.
5.4.1.1 TOTAL CARBON CONTENT While a fraction of the carbon in waste incinerated or open-burned is derived from biomass raw materials (e.g., paper, and food waste), part of the total carbon is plastics or other products made from fossil fuel. Table 5.2 in this section and Section 2.3 in Chapter 2 provide default carbon fractions for waste types and MSW waste fractions respectively. Further details on the fraction of fossil carbon are provided below.
Inventory compilers can use data on composition of MSW and the default data on total carbon content for different waste types/material of MSW provided in Section 2.3 of Chapter 2 to estimate the total carbon content in MSW (see Equation 5.9).
3 The parameters total carbon content in percent of dry weight and fossil carbon fraction in percent of total carbon content could be
combined to the parameter: fossil carbon content in percent of dry weight.

Chapter 5: Incineration and Open Burning of Waste
2006 IPCC Guidelines for National Greenhouse Gas Inventories 5.19
EQUATION 5.9 TOTAL CARBON CONTENT IN MSW
( )∑ •=i
ii CFWFCF
Where:
CF = total carbon content in MSW
WFi = fraction of component i in the MSW
CFi = carbon content in the waste type/material i in MSW
This is also reflected in Equation 5.2.
5.4.1.2 FOSSIL CARBON FRACTION In estimating emissions from incineration and open burning of waste, the desired approach is to separate carbon in the waste into biomass and fossil fuel based fractions. For the purposes of calculating anthropogenic CO2 emissions from incineration and open burning of waste, the amount of fossil carbon in the waste should be determined. The fraction of fossil carbon will differ for different waste categories and types of waste. The carbon in MSW and clinical waste is of both biogenic and fossil origin. In sewage sludge the fossil carbon usually can be neglected while the carbon in hazardous waste is usually of fossil origin. Default data for these waste categories and different waste types/materials included in MSW are provided in Table 5.2 and in Chapter 2, Section 2.3.
Where plant-specific data are available, the exact composition of the waste being incinerated should be collected and used in CO2 emission calculations. If such data are not readily available, country-specific data may be used. This type of data will most likely be in the form of general surveys of the country-specific waste stream. The survey should contain not only the composition, but also the fate of the waste streams (i.e., the percentage of a particular waste type, which is incinerated/open-burned).
Different fossil fuel-based waste products will contain different percentages of fossil carbon. For each waste stream, an analysis should be performed for each waste type. In general, plastics will represent the waste type being incinerated with the highest fossil carbon fraction. In addition, the fossil carbon content of toxics, synthetic fibres and synthetic rubbers is particularly relevant. A certain amount of tire waste is also considered as source of fossil carbon, since tires can be composed of synthetic rubbers or carbon black.
If neither plant-specific waste types nor country-specific waste stream information are available, Section 2.3 in Chapter 2 provides default fossil carbon fractions for the most relevant waste fractions in MSW as well as for specific types of industrial waste and other waste (including hazardous waste and clinical waste).
The fractions of fossil and biogenic carbon are likely to change considerably in the future because of recent waste legislation adopted in some countries. Such programmes will influence the total waste flow incinerated, as well as the fossil carbon content of the waste incinerated/open-burned.
It is good practice, under Tier 2a, that inventory compilers use country-specific data on composition of MSW and default values provided in Chapter 2, Section 2.3, to estimate fossil carbon fraction (FCF) in MSW using Equation 5.10.
EQUATION 5.10 FOSSIL CARBON FRACTION (FCF) IN MSW
( )∑ •=i
ii FCFWFFCF
Where:
FCF = total fossil carbon in the MSW
WFi = fraction of waste type i in the MSW
FCFi = fraction of fossil carbon in the waste type i of the MSW
Volume 5: Waste
5.20 2006 IPCC Guidelines for National Greenhouse Gas Inventories
5.4.1.3 OXIDATION FACTOR When waste streams are incinerated or open-burned most of the carbon in the combustion product oxidises to CO2. A minor fraction may oxidise incompletely due to inefficiencies in the combustion process, which leave some of the carbon unburned or partly oxidised as soot or ash. For waste incinerators it is assumed that the combustion efficiencies are close to 100 percent, while the combustion efficiency of open burning is substantially lower. If oxidation factors of waste incineration below 100 percent are applied, these need to be documented in detail with the data source provided. Table 5.2 presents default oxidation factors by management practices and waste types.
If the CO2 emissions are determined on a technology- or plant-specific basis in the country, it is good practice to use the amount of ash (both bottom ash and fly ash) as well as the carbon content in the ash as a basis for determining the oxidation factor.
5.4.2 CH4 emission factors CH4 emissions from waste incineration are much dependent on the continuity of the incineration process, the incineration technology, and management practices. The most detailed observations have been made in Japan (GIO, 2004), where the following CH4 emission factors based on technology and operation mode are obtained.
Continuous incineration includes incinerators without daily start-up and shutdown. Batch type and semi-continuous incineration mean that the incinerator is usually started-up and shutdown at least once a day. These differences in operation are at the origin of difference in emission factors. It is sometimes observed that the concentrations of CH4 in the exhaust gas of the furnace are below the CH4 concentrations in intake gas of the incinerator (GIO, 2005). Because of the low concentrations and high uncertainties it is here good practice to apply an emission factor of zero (see Section 5.2.2.3).
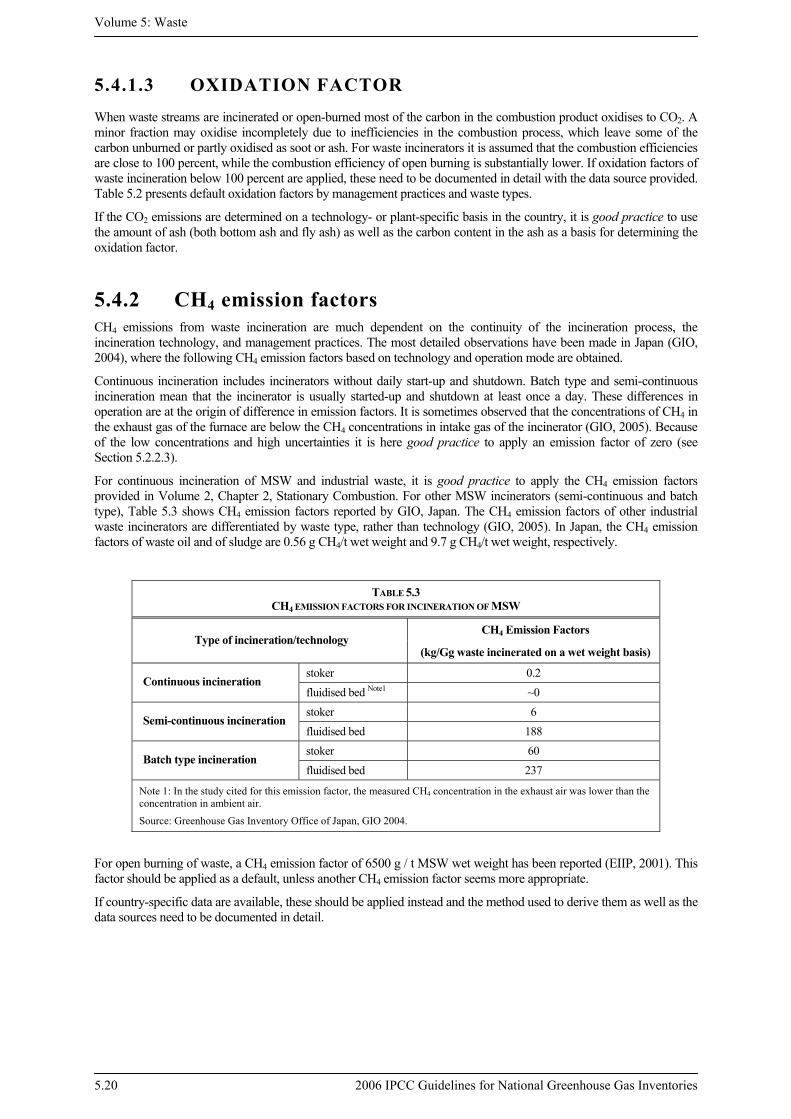
For continuous incineration of MSW and industrial waste, it is good practice to apply the CH4 emission factors provided in Volume 2, Chapter 2, Stationary Combustion. For other MSW incinerators (semi-continuous and batch type), Table 5.3 shows CH4 emission factors reported by GIO, Japan. The CH4 emission factors of other industrial waste incinerators are differentiated by waste type, rather than technology (GIO, 2005). In Japan, the CH4 emission factors of waste oil and of sludge are 0.56 g CH4/t wet weight and 9.7 g CH4/t wet weight, respectively.
TABLE 5.3 CH4 EMISSION FACTORS FOR INCINERATION OF MSW
CH4 Emission Factors Type of incineration/technology
(kg/Gg waste incinerated on a wet weight basis)
stoker 0.2 Continuous incineration
fluidised bed Note1 ~0 stoker 6
Semi-continuous incineration fluidised bed 188 stoker 60
Batch type incineration fluidised bed 237
Note 1: In the study cited for this emission factor, the measured CH4 concentration in the exhaust air was lower than the concentration in ambient air.
Source: Greenhouse Gas Inventory Office of Japan, GIO 2004.
For open burning of waste, a CH4 emission factor of 6500 g / t MSW wet weight has been reported (EIIP, 2001). This factor should be applied as a default, unless another CH4 emission factor seems more appropriate.
If country-specific data are available, these should be applied instead and the method used to derive them as well as the data sources need to be documented in detail.
Chapter 5: Incineration and Open Burning of Waste
2006 IPCC Guidelines for National Greenhouse Gas Inventories 5.21
5.4.3 N2O emission factors Nitrous oxide emissions from waste incineration are determined by a function of the type of technology and combustion conditions, the technology applied for NOx reduction as well as the contents of the waste stream. As a result, emission factors can vary from site to site.
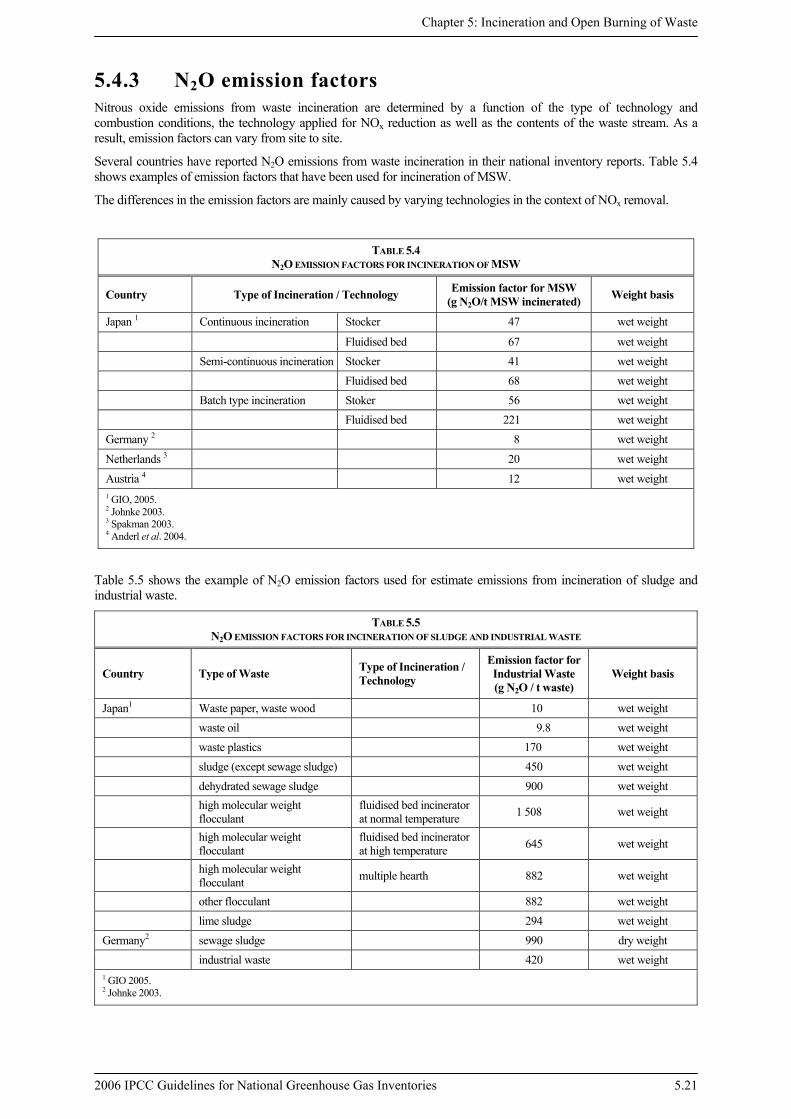
Several countries have reported N2O emissions from waste incineration in their national inventory reports. Table 5.4 shows examples of emission factors that have been used for incineration of MSW.
The differences in the emission factors are mainly caused by varying technologies in the context of NOx removal.
TABLE 5.4 N2O EMISSION FACTORS FOR INCINERATION OF MSW
Country Type of Incineration / Technology Emission factor for MSW (g N2O/t MSW incinerated) Weight basis
Japan 1 Continuous incineration Stocker 47 wet weight
Fluidised bed 67 wet weight Semi-continuous incineration Stocker 41 wet weight Fluidised bed 68 wet weight Batch type incineration Stoker 56 wet weight Fluidised bed 221 wet weight Germany 2 8 wet weight
Netherlands 3 20 wet weight
Austria 4 12 wet weight 1 GIO, 2005. 2 Johnke 2003. 3 Spakman 2003. 4 Anderl et al. 2004.
Table 5.5 shows the example of N2O emission factors used for estimate emissions from incineration of sludge and industrial waste.
TABLE 5.5 N2O EMISSION FACTORS FOR INCINERATION OF SLUDGE AND INDUSTRIAL WASTE
Country Type of Waste Type of Incineration / Technology
Emission factor for Industrial Waste (g N2O / t waste)
Weight basis
Japan1 Waste paper, waste wood 10 wet weight waste oil 9.8 wet weight waste plastics 170 wet weight sludge (except sewage sludge) 450 wet weight dehydrated sewage sludge 900 wet weight
high molecular weight flocculant
fluidised bed incinerator at normal temperature 1 508 wet weight
high molecular weight flocculant
fluidised bed incinerator at high temperature 645 wet weight
high molecular weight flocculant multiple hearth 882 wet weight
other flocculant 882 wet weight lime sludge 294 wet weight Germany2 sewage sludge 990 dry weight industrial waste 420 wet weight 1 GIO 2005. 2 Johnke 2003.
Volume 5: Waste
5.22 2006 IPCC Guidelines for National Greenhouse Gas Inventories
It is good practice to apply these if no country-specific information is available.
For open burning of waste, only information on emissions from burning of agricultural residues is available. The approach for agricultural residues is outlined in Volume 4, Section 2.4 in Chapter 2 Non CO2 emissions, and Section 11.2 (N2O emissions from managed soils) in Chapter 11. Assuming an N/C ratio of 0.01 (Crutzen and Andrea, 1990), an emission factor of up to 0.15 g N2O / kg dry matter is obtained as N2O emission factor for agricultural residues. Because it is expected that the nitrogen content of household waste is towards the higher end of the nitrogen content of agricultural wastes, this emission factor for agricultural wastes is suggested here to be used as default value for N2O emissions from open-burning of waste.
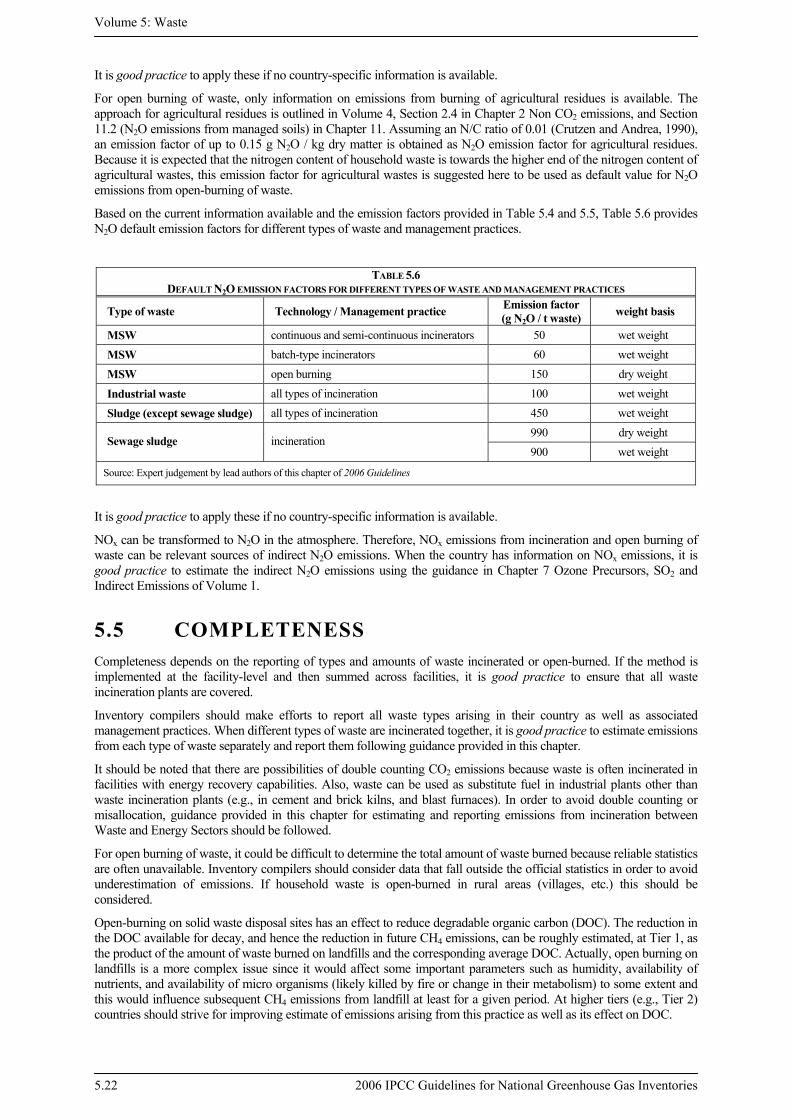
Based on the current information available and the emission factors provided in Table 5.4 and 5.5, Table 5.6 provides N2O default emission factors for different types of waste and management practices.
TABLE 5.6 DEFAULT N2O EMISSION FACTORS FOR DIFFERENT TYPES OF WASTE AND MANAGEMENT PRACTICES
Type of waste Technology / Management practice Emission factor (g N2O / t waste) weight basis
MSW continuous and semi-continuous incinerators 50 wet weight
MSW batch-type incinerators 60 wet weight
MSW open burning 150 dry weight
Industrial waste all types of incineration 100 wet weight
Sludge (except sewage sludge) all types of incineration 450 wet weight 990 dry weight
Sewage sludge incineration 900 wet weight
Source: Expert judgement by lead authors of this chapter of 2006 Guidelines
It is good practice to apply these if no country-specific information is available.
NOx can be transformed to N2O in the atmosphere. Therefore, NOx emissions from incineration and open burning of waste can be relevant sources of indirect N2O emissions. When the country has information on NOx emissions, it is good practice to estimate the indirect N2O emissions using the guidance in Chapter 7 Ozone Precursors, SO2 and Indirect Emissions of Volume 1.
5.5 COMPLETENESS Completeness depends on the reporting of types and amounts of waste incinerated or open-burned. If the method is implemented at the facility-level and then summed across facilities, it is good practice to ensure that all waste incineration plants are covered.
Inventory compilers should make efforts to report all waste types arising in their country as well as associated management practices. When different types of waste are incinerated together, it is good practice to estimate emissions from each type of waste separately and report them following guidance provided in this chapter.
It should be noted that there are possibilities of double counting CO2 emissions because waste is often incinerated in facilities with energy recovery capabilities. Also, waste can be used as substitute fuel in industrial plants other than waste incineration plants (e.g., in cement and brick kilns, and blast furnaces). In order to avoid double counting or misallocation, guidance provided in this chapter for estimating and reporting emissions from incineration between Waste and Energy Sectors should be followed.
For open burning of waste, it could be difficult to determine the total amount of waste burned because reliable statistics are often unavailable. Inventory compilers should consider data that fall outside the official statistics in order to avoid underestimation of emissions. If household waste is open-burned in rural areas (villages, etc.) this should be considered.
Open-burning on solid waste disposal sites has an effect to reduce degradable organic carbon (DOC). The reduction in the DOC available for decay, and hence the reduction in future CH4 emissions, can be roughly estimated, at Tier 1, as the product of the amount of waste burned on landfills and the corresponding average DOC. Actually, open burning on landfills is a more complex issue since it would affect some important parameters such as humidity, availability of nutrients, and availability of micro organisms (likely killed by fire or change in their metabolism) to some extent and this would influence subsequent CH4 emissions from landfill at least for a given period. At higher tiers (e.g., Tier 2) countries should strive for improving estimate of emissions arising from this practice as well as its effect on DOC.
Chapter 5: Incineration and Open Burning of Waste
2006 IPCC Guidelines for National Greenhouse Gas Inventories 5.23
To check whether completeness has been achieved, a diagram showing waste stream and distribution between management practices could be drawn. This could also facilitate the process of QA/QC.
5.6 DEVELOPING A CONSISTENT TIME SERIES Emissions of greenhouse gas from incineration and open-burning of waste should be calculated using the same method and data sets consistently for every year in the time series, at the same level of disaggregation. Where country-specific data are used, it is good practice to use the same coefficients and methods for equivalent calculations at all points in the time series. Where consistent data are not available for the same method for any years in the time series, these gaps should be filled according to the guidance provided in Volume 1, Chapter 5 Time Series Consistency, Section 5.3, Resolving data gaps.
Activity data may only be available every few years. To achieve time series consistency, various methods such as interpolation, extrapolation from longer time series or trends should be used. (See Chapter 5 of Volume 1.)
5.7 UNCERTAINTY ASSESSMENT Section 2.3 in Chapter 2, Table 2.4 provides typical ranges as well as single values for parameters relevant for the calculation of CO2 emissions from incineration and open burning of waste. Examples of CH4 and N2O emission factors of some countries are outlined in Section 5.4.2 and Section 5.4.3 respectively. It is good practice that inventory compilers calculate the uncertainty as 95 percent confidence interval for country-defined parameters. Also uncertainty estimates based on expert judgement or the default uncertainty estimates can be used. More recent information could have a lower uncertainty because it reflects changing practices, technical developments, or changing fractions (biogenic and fossil) of incinerated waste. This should form the basis of the inventory uncertainty assessment.
Volume 1, Chapter 3, Uncertainties, provides advice on quantifying uncertainties in practice. It includes eliciting and using expert judgements, which in combination with empirical data can provide overall uncertainty estimates. Estimates of emissions from open burning can be highly uncertain due to lack of information mainly in developing countries.
The use of country-specific data may introduce additional uncertainty in the following areas:
• If surveys on waste composition are used, the interpretation of definitions of solid waste and surveys may differ, which due to a variety of sources of varying reliability and accuracy.
• Emission factors for N2O and CH4 for solid waste combustion facilities may span an order of magnitude, reflecting considerable variability in the processes from site to site. Control/removal efficiency can also be uncertain, e.g., due to controls in place to reduce NOx.
5.7.1 Emission factor uncertainties There is a high level of uncertainty related to the separation of biogenic and fossil carbon fractions in the waste. This uncertainty is mainly related to the uncertainties in waste composition. The major uncertainty associated with CO2 emissions estimate is related to the estimation of the fossil carbon fraction (see Section 3.7 on uncertainty assessment in Chapter 3 of this Volume).
Uncertainties associated with CO2 emission factors for open burning depend on uncertainties related to fraction of dry matter in waste open-burned, fraction of carbon in the dry matter, fraction of fossil carbon in the total carbon, combustion efficiency, and fraction of carbon oxidised and emitted as CO2. A default value of ± 40 percent is proposed for countries relying on default data on the composition in their calculations.
Direct measurement or monitoring of emissions of N2O and CH4 has less uncertainty. For continuous and periodic emission monitoring, uncertainty depends on the accuracy of measurement instruments and methods used. These are likely to be in order of ± 10 percent. For periodic measurement, uncertainty will also depend on the sampling strategy and frequency, and the uncertainties will be much higher. If default values for N2O and CH4 emission factors are used, uncertainty ranges have been estimated to be ± 100 percent or more.
Volume 5: Waste
5.24 2006 IPCC Guidelines for National Greenhouse Gas Inventories
5.7.2 Activity data uncertainties In many developed countries where the amount of waste incinerated is based on waste statistics or plant specific data, uncertainties on the amount of incinerated waste are estimated around ± 5 percent on a wet weight basis. The uncertainty could be higher for some waste types, such as clinical waste.
The conversion of waste amounts from wet weight to dry weight adds additional uncertainty. Depending on the frequency and the accuracy of the dry weight determination, this uncertainty varies substantially. The uncertainty of the dry matter content may therefore range between ± 10 percent up to ± 50 percent and even more.
When waste statistics are insufficient, population, per capita waste generation, and fraction of waste burned are parameters to be considered for estimating amount of waste open-burned. Uncertainties can be particularly high for the amount of waste generated per capita and the fraction of waste burned. For the countries using the default values for waste generation and management data given in the Section 2.2 in Chapter 2, the uncertainty values for activity data provided in Table 3.5 in Chapter 3 can be used also for incineration. Estimates on the total carbon content and fraction of fossil carbon can be estimated using the ranges given in Table 2.4 in Chapter 2, Section 2.3.
5.8 QA/QC, REPORTING AND DOCUMENTATION
5.8.1 Inventory Quality Assurance/Quality Control (QA/QC)
Quality assurance and quality control checks as outlined in Chapter 6 of Volume 1 should be used when estimating emissions from incineration and open burning of waste. Furthermore, transparency can be improved by the provision of clear documentation and explanations of work undertaken in the following areas.
Review of act iv ity data • Inventories compilers should review data collection methods, check data and compare them with other data
sources. Data should also be checked with previous year to ensure consistency over time. This includes mainly amount of waste incinerated/open-burned and dry matter content.
• Diagram of distribution of waste according to management practices should be developed to ensure that the total amount of waste generated is the same as the sum of waste recycled and treated under different management practices.
Review of emission factors • Inventory compilers should compare country-specific or plant-specific values of the carbon content of waste, the
fossil carbon as fraction of total carbon, and the efficiency of combustion for the incinerator to the default values provided. When there is difference, they should check whether sound explanation is provided.
Review of direct emission measurements • Where direct measurement data are available, inventory compilers should confirm that internationally recognised
standard methods were used for measurements. If the measurement practices fail this criterion, then the use of these emissions data should be carefully evaluated.
• Where emissions are measured directly, inventory compilers should compare plant-level factors among plants, and also with IPCC defaults. They should review any significant differences between factors. This is particularly true for hazardous and clinical waste, because these wastes are often not quantified on a plant basis and can vary significantly from plant to plant.
Consistency of act iv ity data and emissions factors • The activity data, the emission factors and related factors need to be related to the quantity of waste in a consistent
manner: e.g., wet weight or dry weight. Otherwise conversion factors (e.g., dry matter content) need to be applied.
• The applied data and factors should preferably refer to the same or similar system boundaries. For example, if one component in an equation relates to rural waste, another to waste in large cities, these should be used in a consistent manner.
Chapter 5: Incineration and Open Burning of Waste
2006 IPCC Guidelines for National Greenhouse Gas Inventories 5.25
5.8.2 Reporting and Documentation It is good practice to document and archive all information required to produce the national greenhouse gas inventory as outlined in Section 6.11 of Chapter 6 in Volume 1. A few examples of specific documentation and reporting relevant to this category are outlined in the following paragraphs.
While documentation is important, it is not practical or necessary to include all documentation in a greenhouse gas inventory report. However, the inventory should include summaries of methods used and references for data sources such that the reported estimates are transparent and steps included in their calculations may be traced and verified.
Some countries use different categorisations for waste at local or regional levels. In such instances, the inventory compiler should pay special attention to the consistency with the IPCC categorisation and explain how the data were manipulated to fit the IPCC categories.
Inventory compilers should also include information on how they obtained the dry matter content, the carbon content, the fossil carbon fraction and the N2O and CH4 emission factors or any other relevant information.
In some countries, incineration plants are used to produce both heat and electricity. In such cases, emissions from incineration of waste for energy purposes should be reported under Energy Sector (fossil CO2, N2O and CH4 from Stationary Combustion, and biogenic CO2 as an information item). Resulting emissions should not be reported in the Waste Sector in order to avoid double counting.
In cases where gas, oil or other fuels are used as support fuel to start the incineration process or to maintain the required temperature, consumption of this fuel should not be reported under waste incineration but under the Energy Sector (see Chapter 2, Stationary Combustion, in Volume 2, Energy ). Such fuels, normally, account for less than 3 percent of total calorific input of MSW incineration but could be more important with the incineration of hazardous waste.
References Anderl, M., Halper, D., Kurzweil, A., Poupa S., Wappel, D., Weiss, P. and Wieser M. (2004). Austria’s National
Inventory Report 2004: Submission under the United Nations Framework Convention on Climate Change.
BREF (2005). European IPPC Bureau. Reference Document on the Best Available Technology for Waste Incineration. Seville, July 2005.
Chandler, A.J, Eghmy, T.T., Hartlén, J., Jhelmar, O., Kosson, D.S, Sawell, S.E., van der Sloot, H.A. and Vehlow J. (1997). Municipal Solid Waste Incinerator Residues. The International Ash Working Group, Studies in Environmental Science 67, Elsevier Amsterdam.
Crutzen, P.J. and Andreae, M.O. (1990). ‘Biomass burning in the tropics: Impact on atmospheric chemistry and biogeochemical cycles’, Science 250: 1669-1678.
EMEP. (2004). EMEP/CORINAIR Guidebook, Update September 2004. http://reports.eea.eu.int/EMEPCORINAIR4/en/group_09.pdf
GIO (2004). National Greenhouse Gas Inventory Report of JAPAN. Ministry of the Environment/ Japan Greenhouse Gas Inventory Office of Japan (GIO) / Center for Global Environmental Research (CGER) / National Institute for Environmental Studies (NIES). October 2004.
GIO (2005). National Greenhouse Gas Inventory Report of JAPAN. Ministry of the Environment/ Japan Greenhouse Gas Inventory Office of Japan (GIO) / Center for Global Environmental Research (CGER) / National Institute for Environmental Studies (NIES).
Guendehou, G.H.S. and Ahlonsou E.D. (2002). Contribution to non-CO2 greenhouse gases inventory for Cotonou (Republic of Benin): waste sector, In: Proceedings of the Third International Symposium on Non-CO2 Greenhouse Gases: Scientific Understanding, Control Options and Policy Aspects, Maastricht, The Netherlands, Jan 2002, pp. 79-81.
Guendehou, G.H.S. (2004). Personal communication. Cotonou 2004.
Volume 5: Waste
5.26 2006 IPCC Guidelines for National Greenhouse Gas Inventories
IPCC (1997a). Revised 1996 IPCC Guidelines for National Greenhouse Inventories, Volume 3 Reference Manual. Houghton, J.T., Meira Filho, L.G., Lim, B., Tréanton, K., Mamaty, I., Bonduki, Y., Griggs, D.J. and Callander, B.A. (Eds). Intergovernmental Panel on Climate Change (IPCC), IPCC/OECD/IEA, Paris, France.
IPCC (1997b). Revised 1996 IPCC Guidelines for National Greenhouse Inventories, Volume 2 Workbook. Houghton, J.T., Meira Filho, L.G., Lim, B., Tréanton, K., Mamaty, I., Bonduki, Y., Griggs, D.J. and Callander, B.A. (Eds). Intergovernmental Panel on Climate Change (IPCC), IPCC/OECD/IEA, Paris, France.
IPCC (2000). Good Practice Guidance and Uncertainty Management in National Greenhouse Gas Inventories, Penman, J., Kruger, D., Galbally, I., Hiraishi, T., Nyenzi, B., Emmanuel, S., Buendia, L., Hoppaus, R., Martinsen, T., Meijer, J., Miwa, K. and Tanabe, K. (Eds). Intergovernmental Panel on Climate Change (IPCC), IPCC/OECD/IEA/IGES, Hayama, Japan.
IPCC (2003). Good Practice Guidance for Land Use, land-Use Change and Forestry, Penman, J., Gytarsky, M., Hiraishi, T., Kruger, D., Pipatti, R., Buendia, L., Miwa, K., Ngara, T., Tanabe, K., and Wagner, F. (Eds), Intergovernmental Panel on Climate Change (IPCC), IPCC/IGES, Hayama, Japan.
Johnke, B. (2003). Emissionsberichterstattung / Inventarerstellung für das Jahr 2002 [Emission reporting / preparation of the inventory for the year 2002]. Umweltbundesamt, Berlin 2003 [In German].
Kilpinen, P. (2002). Formation and decomposition of nitrogen oxides. In: Raiko, R., Saastamoinen, J., Hupa, M. and Kurki-Suonio, I. 2002. Poltto ja palaminen. International Flame Research Foundation - Suomen kansallinen osasto. Gummerus Oy, Jyväskylä, Finland. [In Finnish].
Korhonen, S., Fabritius, M. and Hoffren, H. (2001). Methane and nitrous oxide emissions in the Finnish energy production. Vantaa: Fortum Power and Heat Oy.36 p. (TECH-4615).
Löffler, G., Vargadalem, V. and Winter, F. (2002). Catalytic effect of biomass ash on CO, CH4 and HCN oxidation under fluidised bed bombustor conditions. Fuel 81, 711-717.
PrEN. (2001). Characterization of waste: Calculation of dry matter by determination of dry residue and water content. PrEN 14346.
Spakman, J., van Loon, M.M.J., van der Auweraert, R.J.K., Gielen, D.J., Olivier, J.G.J. and Zonneveld, E.A. (2004). Method for calculating greenhouse gas emissions. Emission Registration Series/Environmental Monitor No. 37b, MinVROM. The Hague 2003.
Tsupari, E., Monni, S., and Pipatti, R. (2005). Non-CO2 greenhouse gas emissions from boilers and industrial processes - evaluation and update of emission factors for the Finnish National Greenhouse Gas Inventory. VTT Research Notes 2321. Espoo, Finland. 82 p. + app. 24 p.
UN (2002). United Nations Population Division: World Population Prospects – The 2002 Revision Population Database. http://esa.un.org/unpp/index.asp?panel=3
USEPA (1995). US EPA's Compilation of Air Pollutant Emissions Factors, AP-42, Edition 5, United States Environmental Protection Agency (USEPA). http://www.epa.gov/ttn/chief/ap42/
USEPA (1997). Control Technology Center. Evaluation of Emissions from the Open Burning of Household Waste in Barrels. Volume1. Technical Report. United States Environmental Protection Agency (USEPA).
USEPA (1998). Paul M. Lemieux. Evaluation of Emissions from the Open Burning of Household Waste in Barrels : Project Summary. United States Environmental Protection Agency (USEPA).
USEPA (2001). US-EPA Emission Inventory Improvement Program. Volume III Chapter 16 Open Burning. United States Environmental Protection Agency (USEPA). http://www.epa.gov/ttn/chief/eiip/techreport/volume03/iii16_apr2001.pdf