chapter 5 enrolment and gender trends: tertiary education · antigua and barbuda el salvador...
TRANSCRIPT

see below-left
Tonga
Tuvalu
NauruKiribati
Fiji
Samoa
Vanuatu
SolomonIslands
LebanonCyprus
Israel
Maldives
Gambia
Tunisia
Sierra Leone
Liberia
Ireland
Jordan
Bhutan
Rwanda
Lesotho
Guinea-Bissau
Seychelles
Comoros
Djibouti
Armenia
BruneiDarussalam
Timor-Leste
Burundi
Swaziland
Kuwait
Singapore
Trinidad and TobagoGrenadaSt. Vincent & GrenadinesBarbadosSt. LuciaDominica
St. Kitts and NevisAntigua and Barbuda
El Salvador
JamaicaHaiti
Papua New Guinea
Uganda
Georgia
Gabon
CentralAfrican
Republic
Palau
Bangladesh
Iceland
Guatemala Honduras
Panama
Senegal
NicaraguaCosta Rica
Mauritius
Democratic People’sRepublic of Korea
SriLanka
Republicof Korea
Belize
Bahamas
CapeVerde
Dominican Republic
Cuba
Kyrgyzstan
Tajikistan
Cambodia
Greece
13245
67 891011
1213
14
Ecuador
UnitedKingdom
Afghanistan
Thailand
Zimbabwe
Germany
Botswana
Philippines
SouthAfrica
NewZealand
Madagascar
Mexico
Colombia
Côted’Ivoire
Guinea
Uruguay
Myanmar
Finland
Namibia
Venezuela
Mauritania
Nigeria
Bolivia
United Statesof America
SyrianArab Rep.
SpainPortugal
LiechtensteinSwitzerland
SanMarino
MonacoAndorra
Luxembourg
Belgium
EstoniaDenmark
Malta
LatviaLithuania
France
Morocco Iraq
Kenya
PolandUkraine
Egypt
Yemen
EthiopiaSouthSudan
Malaysia
United Republicof Tanzania
Angola
IslamicRepublic of Iran
Saudi Arabia
Chad
DemocraticRepublic of theCongo
India
Zambia
Turkey
KazakhstanMongolia
Libya
Niger
Indonesia
Mali
Brazil
Sudan
Australia
China
Canada
QatarBahrain
Azerbaijan
Algeria
United Arab Emirates
BurkinaFaso
São Tomé and PríncipeEquatorial Guinea
Belarus
MarshallIslands
Fed. States ofMicronesia
LaoP.D.R.
Netherlands
Italy
Russian Federation
Congo
Guyana
Suriname
Peru
Chile
Argentina
Paraguay
NorwaySweden
Turkmenistan
Uzbekistan
Pakistan
Oman
Eritrea
Nepal
Japan
Ghana
BeninTogo
Cameroon Somalia
Malawi
Mozambique
Viet Nam
Niue (NZ)Cook Islands(NZ)
Tokelau (NZ)
British Virgin Islands
Macao SAR, China
Aruba (Neth.)
Cayman Islands
(UK)WesternSahara
Greenland(Denmark)
Jammu and Kashmir*Bermuda (UK)
Anguilla (UK)
Turks andCaicos Is.
(UK)
Gibraltar (UK)
Puerto Rico(USA)
Hong Kong SAR, China
Montserrat (UK)
Faroe Islands(Den.)
* Dotted line represents approximately the Line of Control in Jammu and Kashmir agreed upon by India and Pakistan. The final status of Jammu and Kashmir has not yet been agreed upon by the parties.
1. The FYR of Macedonia2. Albania3. Montenegro4. Serbia5. Bosnia and Herzegovina6. Croatia7. Slovenia
8. Hungary9. Austria10. Czech Republic11. Slovakia12. Republic of Moldova13. Romania14. Bulgaria
Less than 20%
[20% to 50%[
[50% to 80%[
Greater than 80%
No data
Final boundary between the Republic of Sudan and the Republic of South Sudan has not yet been determined.
Source: UNESCO Institute for Statistics
Total enrolment at the tertiary level soared from 32 million students in 1970 to 165 million in 2009 – an increase of around 500 percent. Map 5.1.1 depicts the gross enrolment ratio for tertiary enrolment in 158 countries for which data are available. The GER is below 20 percent in 43 percent of the countries and falls between 20 and 50 percent in a quarter. Another quarter (26 percent) of the countries fall between the 50 to 80 percent range. The GER registers above 80 percent in only nine nations.
Although access to higher education remains problematic in many countries, the last four decades have brought a major expansion of higher education in every region of the world, and women have been the principal beneficiaries in all regions. Female enrolment at the tertiary level has grown almost twice as fast as that of men over the last four decades for reasons that include social mobility, enhanced income potential and international pressure to narrow the gender gap. Nevertheless, enhanced access to higher education by women has not always translated into enhanced career opportunities, including the opportunity to use their doctorates in the field of research.
1. Gross enrolment ratio soaring at the tertiary level
Enrolment and gender trends: tertiary education
CHAPTER 5
Map 5.1.1 Tertiary level gross enrolment ratios vary across regions
Gross enrolment ratio in tertiary education
74 75
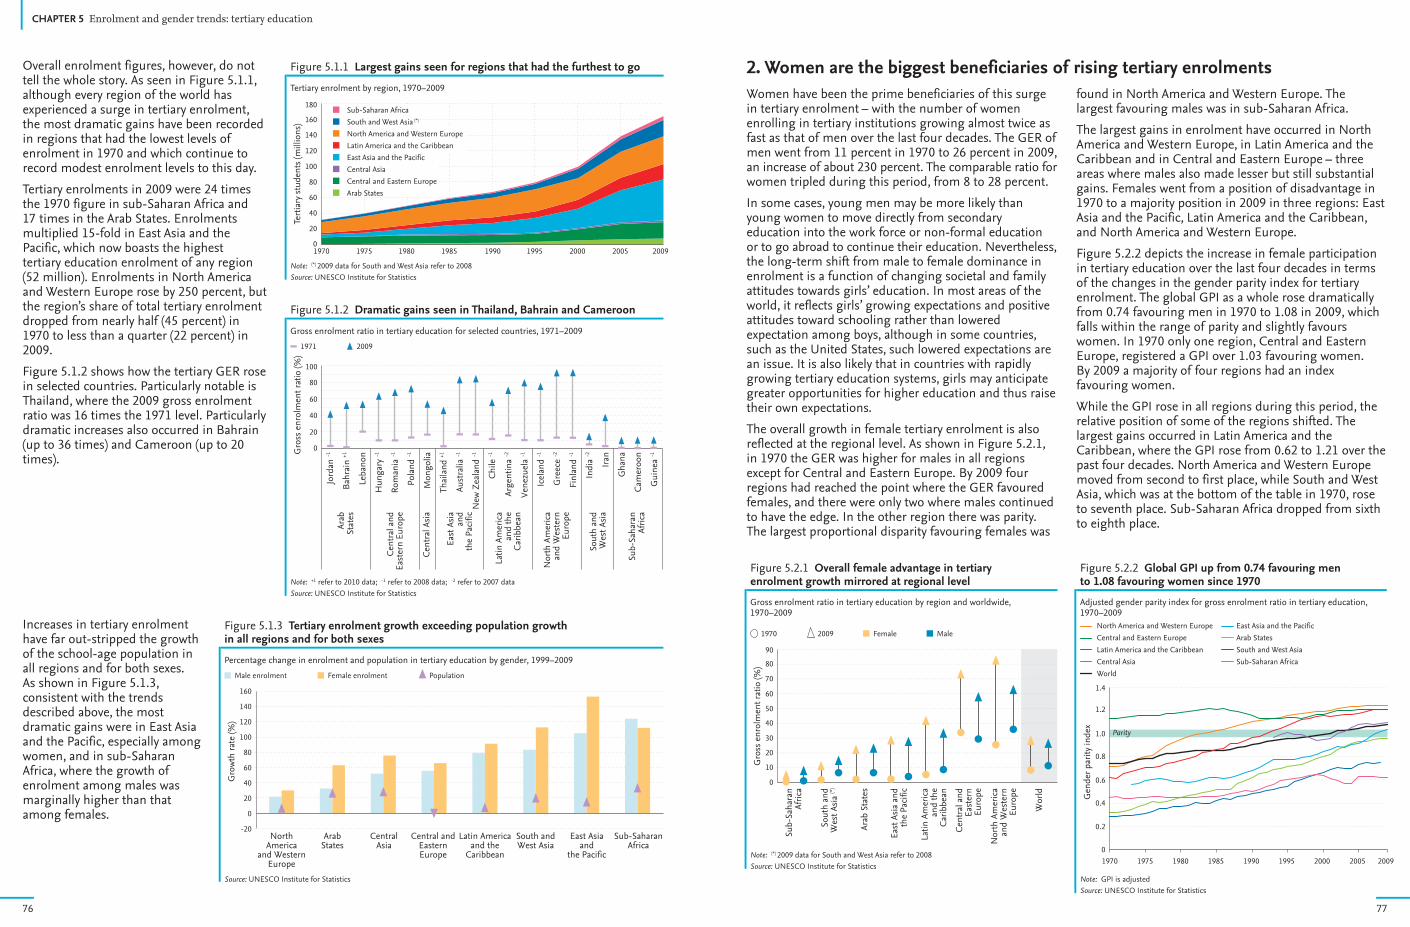
Overall enrolment figures, however, do not tell the whole story. As seen in Figure 5.1.1, although every region of the world has experienced a surge in tertiary enrolment, the most dramatic gains have been recorded in regions that had the lowest levels of enrolment in 1970 and which continue to record modest enrolment levels to this day.
Tertiary enrolments in 2009 were 24 times the 1970 figure in sub-Saharan Africa and 17 times in the Arab States. Enrolments multiplied 15-fold in East Asia and the Pacific, which now boasts the highest tertiary education enrolment of any region (52 million). Enrolments in North America and Western Europe rose by 250 percent, but the region’s share of total tertiary enrolment dropped from nearly half (45 percent) in 1970 to less than a quarter (22 percent) in 2009.
Figure 5.1.2 shows how the tertiary GER rose in selected countries. Particularly notable is Thailand, where the 2009 gross enrolment ratio was 16 times the 1971 level. Particularly dramatic increases also occurred in Bahrain (up to 36 times) and Cameroon (up to 20 times).
Increases in tertiary enrolment have far out-stripped the growth of the school-age population in all regions and for both sexes. As shown in Figure 5.1.3, consistent with the trends described above, the most dramatic gains were in East Asia and the Pacific, especially among women, and in sub-Saharan Africa, where the growth of enrolment among males was marginally higher than that among females.
Women have been the prime beneficiaries of this surge in tertiary enrolment – with the number of women enrolling in tertiary institutions growing almost twice as fast as that of men over the last four decades. The GER of men went from 11 percent in 1970 to 26 percent in 2009, an increase of about 230 percent. The comparable ratio for women tripled during this period, from 8 to 28 percent.
In some cases, young men may be more likely than young women to move directly from secondary education into the work force or non-formal education or to go abroad to continue their education. Nevertheless, the long-term shift from male to female dominance in enrolment is a function of changing societal and family attitudes towards girls’ education. In most areas of the world, it reflects girls’ growing expectations and positive attitudes toward schooling rather than lowered expectation among boys, although in some countries, such as the United States, such lowered expectations are an issue. It is also likely that in countries with rapidly growing tertiary education systems, girls may anticipate greater opportunities for higher education and thus raise their own expectations.
The overall growth in female tertiary enrolment is also reflected at the regional level. As shown in Figure 5.2.1, in 1970 the GER was higher for males in all regions except for Central and Eastern Europe. By 2009 four regions had reached the point where the GER favoured females, and there were only two where males continued to have the edge. In the other region there was parity. The largest proportional disparity favouring females was
found in North America and Western Europe. The largest favouring males was in sub-Saharan Africa.
The largest gains in enrolment have occurred in North America and Western Europe, in Latin America and the Caribbean and in Central and Eastern Europe – three areas where males also made lesser but still substantial gains. Females went from a position of disadvantage in 1970 to a majority position in 2009 in three regions: East Asia and the Pacific, Latin America and the Caribbean, and North America and Western Europe.
Figure 5.2.2 depicts the increase in female participation in tertiary education over the last four decades in terms of the changes in the gender parity index for tertiary enrolment. The global GPI as a whole rose dramatically from 0.74 favouring men in 1970 to 1.08 in 2009, which falls within the range of parity and slightly favours women. In 1970 only one region, Central and Eastern Europe, registered a GPI over 1.03 favouring women. By 2009 a majority of four regions had an index favouring women.
While the GPI rose in all regions during this period, the relative position of some of the regions shifted. The largest gains occurred in Latin America and the Caribbean, where the GPI rose from 0.62 to 1.21 over the past four decades. North America and Western Europe moved from second to first place, while South and West Asia, which was at the bottom of the table in 1970, rose to seventh place. Sub-Saharan Africa dropped from sixth to eighth place.
Source: UNESCO Institute for Statistics
Note: +1 refer to 2010 data; -1 refer to 2008 data; -2 refer to 2007 dataSource: UNESCO Institute for Statistics
Source: UNESCO Institute for Statistics
Source: UNESCO Institute for Statistics
Source: UNESCO Institute for StatisticsNote: GPI is adjusted
180
160
140
120
100
80
60
40
20
0
Tertiary enrolment by region, 1970–2009
1970 1975 1980 1985 1990 1995 2000 2005 2009
Note: (*) 2009 data for South and West Asia refer to 2008
Arab StatesCentral and Eastern EuropeCentral AsiaEast Asia and the PacificLatin America and the CaribbeanNorth America and Western EuropeSouth and West Asia (*)
Sub-Saharan Africa
Tert
iary
stu
dent
s (m
illio
ns)
100
0
20
40
60
80
1971 2009
Gross enrolment ratio in tertiary education for selected countries, 1971–2009Ar
abSt
ates
Cent
ral a
ndEa
ster
n Eu
rope
Cent
ral A
sia
East
Asi
aan
dth
e Pa
cific
Latin
Am
eric
aan
d th
eCa
ribbe
an
Nor
th A
mer
ica
and
Wes
tern
Euro
pe
Sout
h an
dW
est A
sia
Sub-
Saha
ran
Afric
a
New
Zea
land
-1
Chile
-1
Arge
ntin
a -2
Vene
zuel
a -1
Icel
and
-1
Gre
ece
-2
Finl
and
-1
Indi
a -2
Iran
Gha
na
Cam
eroo
n
Gui
nea
-1
Jord
an -1
Bahr
ain
+1
Leba
non
Hun
gary
-1
Rom
ania
-1
Pola
nd -1
Mon
golia
Thai
land
+1
Aust
ralia
-1
100
120
140
160
80
60
40
20
-20
0
Male enrolment Female enrolment Population
Percentage change in enrolment and population in tertiary education by gender, 1999–2009
ArabStates
Central andEasternEurope
CentralAsia
East Asiaand
the Pacific
Latin Americaand the
Caribbean
NorthAmerica
and WesternEurope
South andWest Asia
Sub-SaharanAfrica
Gro
wth
rate
(%)
Gro
ss e
nrol
men
t rat
io (%
)
Arab
Sta
tes
Cent
ral a
ndEa
ster
nEu
rope
Wor
ld
East
Asi
a an
dth
e Pa
cific
Latin
Am
eric
aan
d th
eCa
ribbe
an
Nor
th A
mer
ica
and
Wes
tern
Euro
pe
Sout
h an
dW
est A
sia
(*)
Sub-
Saha
ran
Afric
a
90
80
70
60
50
40
30
20
10
0
1970 2009
Note: (*) 2009 data for South and West Asia refer to 2008
Female Male
Gross enrolment ratio in tertiary education by region and worldwide, 1970–2009
Gro
ss e
nrol
men
t rat
io (%
)
1.4
1.2
1.0
0.8
0.6
0.4
0.2
0
Adjusted gender parity index for gross enrolment ratio in tertiary education, 1970–2009
North America and Western EuropeCentral and Eastern EuropeLatin America and the CaribbeanCentral AsiaWorld
Gen
der p
arity
inde
x
East Asia and the PacificArab StatesSouth and West AsiaSub-Saharan Africa
Parity
1970 1975 1980 1985 1990 1995 2000 2005 2009
Figure 5.1.1 Largest gains seen for regions that had the furthest to go
Figure 5.1.2 Dramatic gains seen in Thailand, Bahrain and Cameroon
Figure 5.1.3 Tertiary enrolment growth exceeding population growth in all regions and for both sexes
Figure 5.2.1 Overall female advantage in tertiary enrolment growth mirrored at regional level
Figure 5.2.2 Global GPI up from 0.74 favouring mento 1.08 favouring women since 1970
2. Women are the biggest beneficiaries of rising tertiary enrolments
CHAPTER 5 Enrolment and gender trends: tertiary education
76 77
see below
LebanonCyprus
Israel
Maldives
Gambia
Tunisia
Sierra Leone
Liberia
Ireland
Jordan
Bhutan
Rwanda
Lesotho
Guinea-Bissau
Seychelles
Comoros
Djibouti
Armenia
BruneiDarussalam
Timor-Leste
Burundi
Swaziland
Kuwait
Singapore
Trinidad and TobagoGrenadaSt. Vincent & GrenadinesBarbadosSt. LuciaDominica
St. Kitts and NevisAntigua and Barbuda
El Salvador
JamaicaHaiti
Papua New Guinea
Uganda
Georgia
Gabon
CentralAfrican
Republic
Palau
Bangladesh
Iceland
Guatemala Honduras
Panama
Senegal
NicaraguaCosta Rica
Mauritius
Democratic People’sRepublic of Korea
SriLanka
Republicof Korea
Belize
Bahamas
CapeVerde
Dominican Republic
Cuba
Kyrgyzstan
Tajikistan
Cambodia
Greece
13245
67 891011
1213
14
Ecuador
UnitedKingdom
Afghanistan
Thailand
Zimbabwe
Germany
Botswana
Philippines
SouthAfrica
NewZealand
Madagascar
Mexico
Colombia
Côted’Ivoire
Guinea
Uruguay
Myanmar
Finland
Namibia
Venezuela
Mauritania
Nigeria
Bolivia
United Statesof America
SyrianArab Rep.
SpainPortugal
LiechtensteinSwitzerland
SanMarino
MonacoAndorra
Luxembourg
Belgium
EstoniaDenmark
Malta
LatviaLithuania
France
Morocco Iraq
Kenya
PolandUkraine
Egypt
Yemen
EthiopiaSouthSudan
Malaysia
United Republicof Tanzania
Angola
IslamicRepublic of Iran
Saudi Arabia
Chad
DemocraticRepublic of theCongo
India
Zambia
Turkey
KazakhstanMongolia
Libya
Niger
Indonesia
Mali
Brazil
Sudan
Australia
China
Canada
QatarBahrain
Azerbaijan
Algeria
United Arab Emirates
BurkinaFaso
São Tomé and PríncipeEquatorial Guinea
Belarus
MarshallIslands
Fed. States ofMicronesia
LaoP.D.R.
Netherlands
Italy
Russian Federation
Congo
Guyana
Suriname
Peru
Chile
Argentina
Paraguay
NorwaySweden
Turkmenistan
Uzbekistan
Pakistan
Oman
Eritrea
Nepal
Japan
Ghana
BeninTogo
Cameroon Somalia
Malawi
Mozambique
Viet Nam
Tonga
Tuvalu
NauruKiribati
Fiji
Samoa
Vanuatu
SolomonIslands
British Virgin Islands
Macao SAR, China
Aruba (Neth.)
Cayman Islands
(UK)WesternSahara
Greenland(Denmark)
Jammu and Kashmir*Bermuda (UK)
Anguilla (UK)
Turks andCaicos Is.
(UK)
Gibraltar (UK)
Puerto Rico(USA)
Hong Kong SAR, China
Montserrat (UK)
Faroe Islands(Den.)
Niue (NZ)Cook Islands(NZ)
Tokelau (NZ)
1. The FYR of Macedonia2. Albania3. Montenegro4. Serbia5. Bosnia and Herzegovina6. Croatia7. Slovenia8. Hungary9. Austria10. Czech Republic11. Slovakia12. Republic of Moldova13. Romania14. Bulgaria
Males favoured
Parity
Females favoured
No data
* Dotted line represents approximately the Line of Control in Jammu and Kashmir agreed upon by India and Pakistan. The final status of Jammu and Kashmir has not yet been agreed upon by the parties.
Final boundary between the Republic of Sudan and the Republic of South Sudan has not yet been determined.
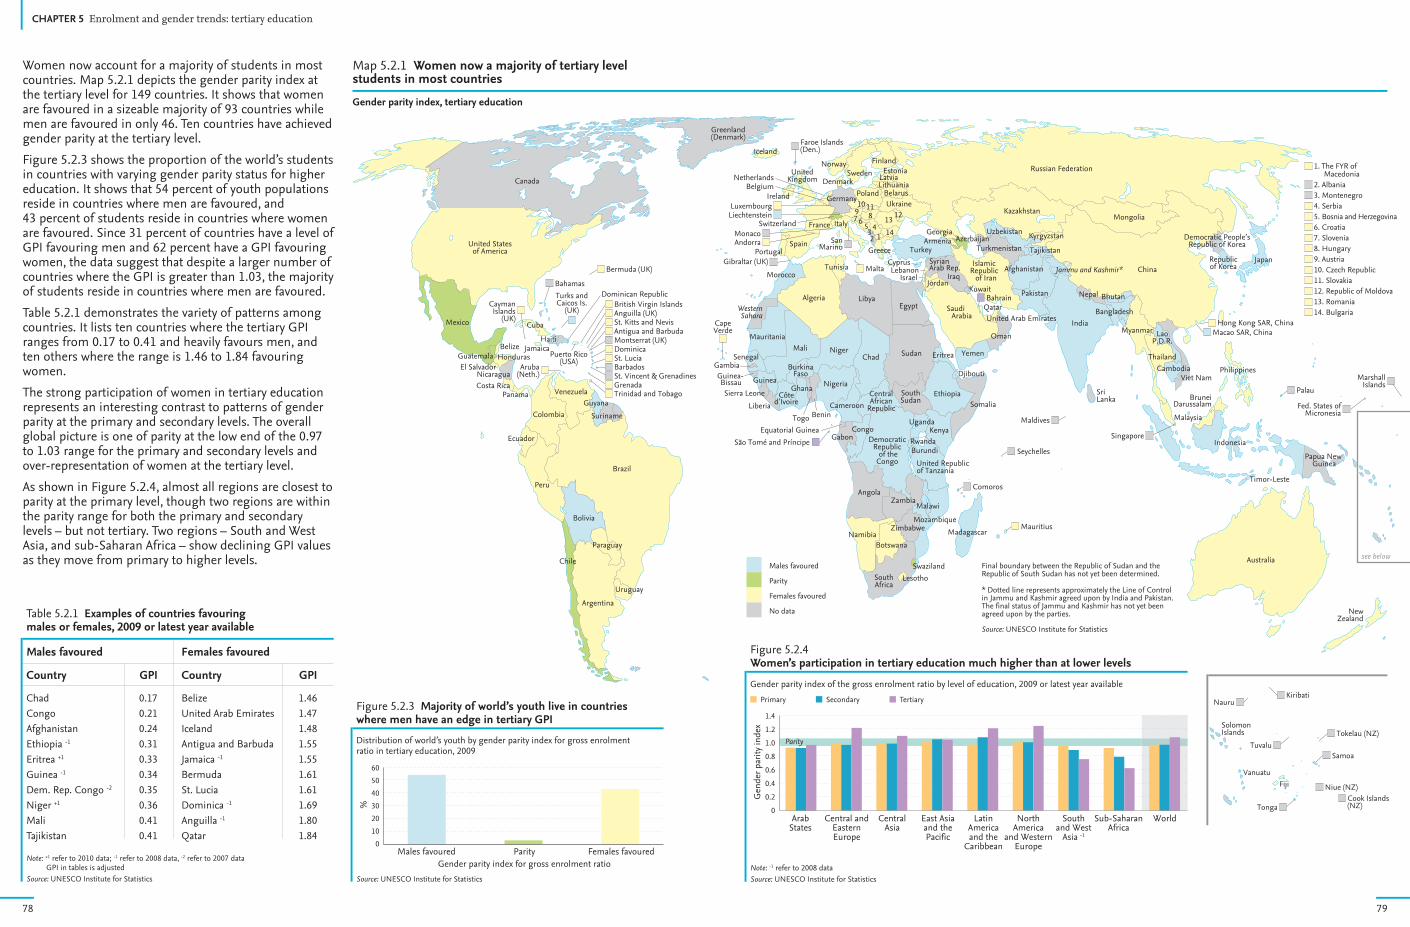
Women now account for a majority of students in most countries. Map 5.2.1 depicts the gender parity index at the tertiary level for 149 countries. It shows that women are favoured in a sizeable majority of 93 countries while men are favoured in only 46. Ten countries have achieved gender parity at the tertiary level.
Figure 5.2.3 shows the proportion of the world’s students in countries with varying gender parity status for higher education. It shows that 54 percent of youth populations reside in countries where men are favoured, and 43 percent of students reside in countries where women are favoured. Since 31 percent of countries have a level of GPI favouring men and 62 percent have a GPI favouring women, the data suggest that despite a larger number of countries where the GPI is greater than 1.03, the majority of students reside in countries where men are favoured.
Table 5.2.1 demonstrates the variety of patterns among countries. It lists ten countries where the tertiary GPI ranges from 0.17 to 0.41 and heavily favours men, and ten others where the range is 1.46 to 1.84 favouring women.
The strong participation of women in tertiary education represents an interesting contrast to patterns of gender parity at the primary and secondary levels. The overall global picture is one of parity at the low end of the 0.97 to 1.03 range for the primary and secondary levels and over-representation of women at the tertiary level.
As shown in Figure 5.2.4, almost all regions are closest to parity at the primary level, though two regions are within the parity range for both the primary and secondary levels – but not tertiary. Two regions – South and West Asia, and sub-Saharan Africa – show declining GPI values as they move from primary to higher levels.
Source: UNESCO Institute for StatisticsSource: UNESCO Institute for Statistics Source: UNESCO Institute for Statistics
Source: UNESCO Institute for Statistics
60
50
40
30
20
10
0
Distribution of world’s youth by gender parity index for gross enrolment ratio in tertiary education, 2009
Males favoured
%
ParityGender parity index for gross enrolment ratio
Females favoured
ChadCongoAfghanistanEthiopia -1
Eritrea +1
Guinea -1
Dem. Rep. Congo -2
Niger +1
MaliTajikistan
0.170.210.240.310.330.340.350.360.410.41
Males favoured
Country GPI
BelizeUnited Arab EmiratesIcelandAntigua and BarbudaJamaica -1
BermudaSt. LuciaDominica -1
Anguilla -1
Qatar
1.461.471.481.551.551.611.611.691.801.84
Females favoured
CountryGPI
Note: +1 refer to 2010 data; -1 refer to 2008 data, -2 refer to 2007 data GPI in tables is adjusted
1.4
1.2
1.0
0.8
0.6
0.4
0.2
0
Primary
Gen
der p
arity
inde
x
Secondary Tertiary
Gender parity index of the gross enrolment ratio by level of education, 2009 or latest year available
ArabStates
Central andEasternEurope
CentralAsia
East Asiaand thePacific
LatinAmericaand the
Caribbean
NorthAmerica
and WesternEurope
WorldSouthand West
Asia -1
Sub-SaharanAfrica
Note: -1 refer to 2008 data
Parity
Figure 5.2.3 Majority of world’s youth live in countries where men have an edge in tertiary GPI
Table 5.2.1 Examples of countries favouring males or females, 2009 or latest year available
Figure 5.2.4 Women’s participation in tertiary education much higher than at lower levels
Map 5.2.1 Women now a majority of tertiary level students in most countries
Gender parity index, tertiary education
CHAPTER 5 Enrolment and gender trends: tertiary education
78 79
Source: UNESCO Institute for Statistics
Source: UNESCO Institute for Statistics
Note: Regional averages for Arab States, South and West Asia and sub-Saharan Africa are not available due to low response rates
Source: UNESCO Institute for StatisticsNote: GPI is adjusted
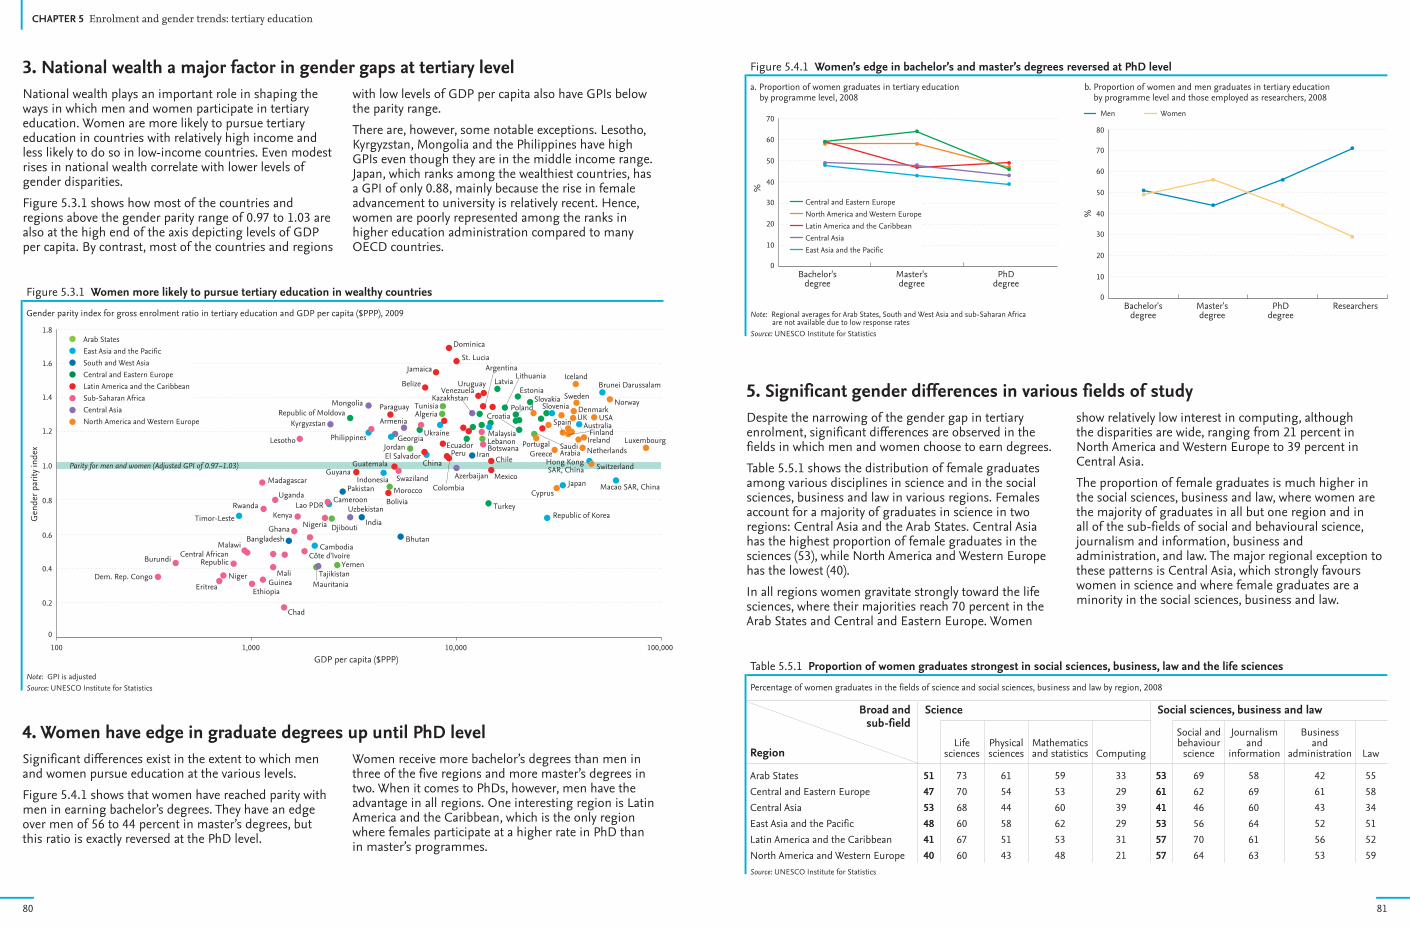
National wealth plays an important role in shaping the ways in which men and women participate in tertiary education. Women are more likely to pursue tertiary education in countries with relatively high income and less likely to do so in low-income countries. Even modest rises in national wealth correlate with lower levels of gender disparities.
Figure 5.3.1 shows how most of the countries and regions above the gender parity range of 0.97 to 1.03 are also at the high end of the axis depicting levels of GDP per capita. By contrast, most of the countries and regions
with low levels of GDP per capita also have GPIs below the parity range.
There are, however, some notable exceptions. Lesotho, Kyrgyzstan, Mongolia and the Philippines have high GPIs even though they are in the middle income range. Japan, which ranks among the wealthiest countries, has a GPI of only 0.88, mainly because the rise in female advancement to university is relatively recent. Hence, women are poorly represented among the ranks in higher education administration compared to many OECD countries.
Significant differences exist in the extent to which men and women pursue education at the various levels.
Figure 5.4.1 shows that women have reached parity with men in earning bachelor’s degrees. They have an edge over men of 56 to 44 percent in master’s degrees, but this ratio is exactly reversed at the PhD level.
Women receive more bachelor’s degrees than men in three of the five regions and more master’s degrees in two. When it comes to PhDs, however, men have the advantage in all regions. One interesting region is Latin America and the Caribbean, which is the only region where females participate at a higher rate in PhD than in master’s programmes.
Despite the narrowing of the gender gap in tertiary enrolment, significant differences are observed in the fields in which men and women choose to earn degrees.
Table 5.5.1 shows the distribution of female graduates among various disciplines in science and in the social sciences, business and law in various regions. Females account for a majority of graduates in science in two regions: Central Asia and the Arab States. Central Asia has the highest proportion of female graduates in the sciences (53), while North America and Western Europe has the lowest (40).
In all regions women gravitate strongly toward the life sciences, where their majorities reach 70 percent in the Arab States and Central and Eastern Europe. Women
show relatively low interest in computing, although the disparities are wide, ranging from 21 percent in North America and Western Europe to 39 percent in Central Asia.
The proportion of female graduates is much higher in the social sciences, business and law, where women are the majority of graduates in all but one region and in all of the sub-fields of social and behavioural science, journalism and information, business and administration, and law. The major regional exception to these patterns is Central Asia, which strongly favours women in science and where female graduates are a minority in the social sciences, business and law.
80
70
Bachelor'sdegree
Master'sdegree
%
PhDdegree
Researchers
60
50
40
30
20
10
0
b. Proportion of women and men graduates in tertiary education by programme level and those employed as researchers, 2008
Men Women
Arab StatesCentral and Eastern EuropeCentral AsiaEast Asia and the PacificLatin America and the CaribbeanNorth America and Western Europe
514753484140
737068606760
Lifesciences
Physicalsciences
Mathematicsand statistics Computing
Social andbehaviour
science
Journalismand
information
Businessand
administration Law
615444585143
595360625348
332939293121
536141535757
696246567064
586960646163
426143525653
555834515259
Region
ScienceBroad andsub-field
Social sciences, business and law
Percentage of women graduates in the fields of science and social sciences, business and law by region, 2008
70
Bachelor'sdegree
%
Master'sdegree
PhDdegree
60
50
40
30
20
10
0
a. Proportion of women graduates in tertiary education by programme level, 2008
Central and Eastern EuropeNorth America and Western EuropeLatin America and the CaribbeanCentral AsiaEast Asia and the Pacific
1.8
1.6
1.4
1.2
1.0
0.8
0.6
0.4
0.2
0
Gender parity index for gross enrolment ratio in tertiary education and GDP per capita ($PPP), 2009
100 10,000 100,000 1,000 GDP per capita ($PPP)
Gen
der p
arity
inde
x
Mauritania
Yemen
Djibouti
Morocco
JordanLebanon
AlgeriaTunisia
Croatia
Lithuania
PolandSlovakia
EstoniaLatvia
Republic of Moldova
Ukraine
Turkey
Kyrgyzstan
Mongolia
Uzbekistan
Armenia
Georgia
Kazakhstan
Azerbaijan
AustraliaMalaysia
Brunei Darussalam
Japan Macao SAR, China
Republic of Korea
Hong KongSAR, China
Cambodia
Philippines
Indonesia
Lao PDR
Timor-Leste
ChileGuyana
Bolivia
Ecuador El Salvador Peru
Argentina
Paraguay
Belize
Dominica
JamaicaSt. Lucia
UruguayVenezuela
Colombia
Guatemala
Mexico
Greece
Ireland Luxembourg Netherlands
Portugal
DenmarkNorway
Sweden
Iceland
Cyprus
Switzerland
Bangladesh
India
Pakistan
Bhutan
IranBotswana
Central AfricanRepublic
Dem. Rep. CongoEritrea Ethiopia
Niger
Burundi
Malawi
Madagascar
RwandaUganda
Chad
Guinea
Côte d'Ivoire
Ghana
Mali
Lesotho
Cameroon
KenyaNigeria
Swaziland
Parity for men and women (Adjusted GPI of 0.97~1.03)
Central Asia
Central and Eastern Europe
Arab States
Latin America and the Caribbean
East Asia and the Pacific
North America and Western Europe
Sub-Saharan Africa
South and West Asia
Tajikistan
SaudiArabia
China
Finland Spain
SloveniaUK USA
Figure 5.3.1 Women more likely to pursue tertiary education in wealthy countries
Table 5.5.1 Proportion of women graduates strongest in social sciences, business, law and the life sciences
Figure 5.4.1 Women’s edge in bachelor’s and master’s degrees reversed at PhD level3. National wealth a major factor in gender gaps at tertiary level
4. Women have edge in graduate degrees up until PhD level
5. Significant gender differences in various fields of study
CHAPTER 5 Enrolment and gender trends: tertiary education
80 81
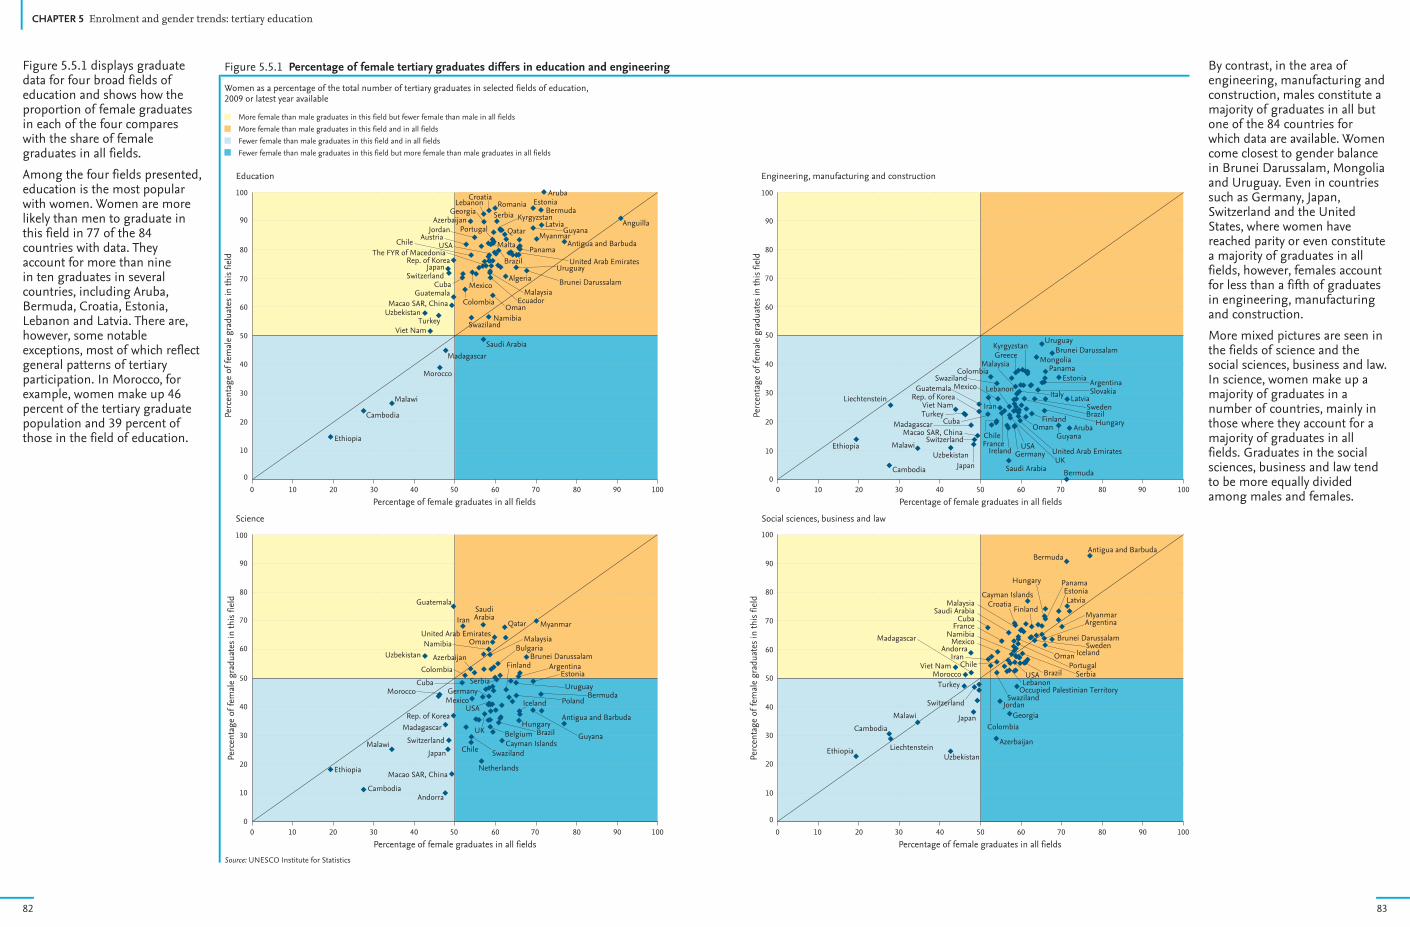
Figure 5.5.1 displays graduate data for four broad fields of education and shows how the proportion of female graduates in each of the four compares with the share of female graduates in all fields.
Among the four fields presented, education is the most popular with women. Women are more likely than men to graduate in this field in 77 of the 84 countries with data. They account for more than nine in ten graduates in several countries, including Aruba, Bermuda, Croatia, Estonia, Lebanon and Latvia. There are, however, some notable exceptions, most of which reflect general patterns of tertiary participation. In Morocco, for example, women make up 46 percent of the tertiary graduate population and 39 percent of those in the field of education.
By contrast, in the area of engineering, manufacturing and construction, males constitute a majority of graduates in all but one of the 84 countries for which data are available. Women come closest to gender balance in Brunei Darussalam, Mongolia and Uruguay. Even in countries such as Germany, Japan, Switzerland and the United States, where women have reached parity or even constitute a majority of graduates in all fields, however, females account for less than a fifth of graduates in engineering, manufacturing and construction.
More mixed pictures are seen in the fields of science and the social sciences, business and law. In science, women make up a majority of graduates in a number of countries, mainly in those where they account for a majority of graduates in all fields. Graduates in the social sciences, business and law tend to be more equally divided among males and females.
Source: UNESCO Institute for Statistics
100
90
80
70
60
50
40
30
20
10
100 20
Perc
enta
ge o
f fem
ale
grad
uate
s in
this
fiel
d
Perc
enta
ge o
f fem
ale
grad
uate
s in
this
fiel
d
Perc
enta
ge o
f fem
ale
grad
uate
s in
this
fiel
d
Perc
enta
ge o
f fem
ale
grad
uate
s in
this
fiel
d
Percentage of female graduates in all fields
Percentage of female graduates in all fields
Percentage of female graduates in all fields
Percentage of female graduates in all fields
30 40 50 60 70 80 90 1000
More female than male graduates in this field but fewer female than male in all fieldsMore female than male graduates in this field and in all fieldsFewer female than male graduates in this field and in all fieldsFewer female than male graduates in this field but more female than male graduates in all fields
Engineering, manufacturing and construction
100
90
80
70
60
50
40
30
20
10
100 20 30 40 50 60 70 80 90 1000
100
90
80
70
60
50
40
30
20
10
100 20 30 40 50 60 70 80 90 1000
Science
100
90
80
70
60
50
40
30
20
10
100 20 30 40 50 60 70 80 90 1000
Social sciences, business and law
Education
Women as a percentage of the total number of tertiary graduates in selected fields of education, 2009 or latest year available
EthiopiaUzbekistan
LiechtensteinAzerbaijan
Cambodia
Malawi GeorgiaJapan
JordanSwitzerland
Occupied Palestinian TerritoryTurkey
Morocco
Swaziland
Madagascar
Lebanon
Viet Nam
Colombia
BrazilUSAChile
Iran
Serbia
AndorraMexico
Namibia
Iceland
Portugal
France
SwedenBrunei Darussalam
Oman
ArgentinaSaudi Arabia
CubaFinland
MyanmarMalaysia Croatia
PanamaHungaryEstoniaLatvia
Cayman Islands
BermudaAntigua and Barbuda
Ethiopia
Uzbekistan
Azerbaijan
Cambodia
Malawi
Georgia
Japan
Jordan
Macao SAR, China
Rep. of Korea
Switzerland
Turkey
Guatemala
Morocco
Swaziland
Madagascar
Lebanon
Viet Nam
Colombia
Brazil United Arab Emirates
Kyrgyzstan
USAChileAustria
MaltaThe FYR of Macedonia
Serbia
Mexico
Namibia
Ecuador
Portugal
Brunei Darussalam
Oman
Qatar
AlgeriaUruguay
Saudi Arabia
Romania
Cuba
Myanmar
Malaysia
Croatia
Guyana
Panama
Aruba Estonia
Latvia
Bermuda
Antigua and Barbuda
Anguilla
EthiopiaUzbekistan
Liechtenstein
Cambodia
Malawi
Japan
Macao SAR, China
Rep. of Korea
Switzerland
Turkey
GuatemalaSwaziland
Madagascar
Germany
Lebanon
Viet Nam
Colombia
Brazil
UKUnited Arab Emirates
Kyrgyzstan
USAChile
Ireland
Iran Italy
Mexico
France
Sweden
Brunei Darussalam
Oman
Argentina
Greece Mongolia
Uruguay
Saudi Arabia
Cuba Finland
Malaysia
Slovakia
Guyana
Panama
HungaryAruba
Estonia
Latvia
Bermuda
Ethiopia
Uzbekistan Azerbaijan
Cambodia
MalawiJapan
Macao SAR, China
Rep. of Korea
Switzerland
Guatemala
Morocco
Swaziland
Madagascar
Netherlands
Germany
Colombia
BrazilUK
United Arab Emirates
USA
Chile
Iran
Belgium
Serbia
Andorra
Mexico
Namibia
Iceland
Brunei Darussalam
Oman
Argentina
Qatar
Uruguay
SaudiArabia
Bulgaria
Cuba
Finland
Myanmar
Poland
Malaysia
GuyanaHungary
Estonia
Cayman Islands
Bermuda
Antigua and Barbuda
Figure 5.5.1 Percentage of female tertiary graduates differs in education and engineering
CHAPTER 5 Enrolment and gender trends: tertiary education
82 83

see below
LebanonCyprus
Israel
Maldives
Gambia
Tunisia
Sierra Leone
Liberia
Ireland
Jordan
Bhutan
Rwanda
Lesotho
Guinea-Bissau
Seychelles
Comoros
Djibouti
Armenia
BruneiDarussalam
Timor-Leste
Burundi
Swaziland
Kuwait
Singapore
Trinidad and TobagoGrenadaSt. Vincent & GrenadinesBarbadosSt. LuciaDominica
St. Kitts and NevisAntigua and Barbuda
El Salvador
JamaicaHaiti
Papua New Guinea
Uganda
Georgia
Gabon
CentralAfrican
Republic
Palau
Bangladesh
Iceland
Guatemala Honduras
Panama
Senegal
NicaraguaCosta Rica
Mauritius
Democratic People’sRepublic of Korea
SriLanka
Republicof Korea
Belize
Bahamas
CapeVerde
Dominican Republic
Cuba
Kyrgyzstan
Tajikistan
Cambodia
Greece
13245
67 891011
1213
14
Ecuador
UnitedKingdom
Afghanistan
Thailand
Zimbabwe
Germany
Botswana
Philippines
SouthAfrica
NewZealand
Madagascar
Mexico
Colombia
Côted’Ivoire
Guinea
Uruguay
Myanmar
Finland
Namibia
Venezuela
Mauritania
Nigeria
Bolivia
United Statesof America
SyrianArab Rep.
SpainPortugal
LiechtensteinSwitzerland
SanMarino
MonacoAndorra
Luxembourg
Belgium
EstoniaDenmark
Malta
LatviaLithuania
France
Morocco Iraq
Kenya
PolandUkraine
Egypt
Yemen
EthiopiaSouthSudan
Malaysia
United Republicof Tanzania
Angola
IslamicRepublic of Iran
Saudi Arabia
Chad
DemocraticRepublic of theCongo
India
Zambia
Turkey
KazakhstanMongolia
Libya
Niger
Indonesia
Mali
Brazil
Sudan
Australia
China
Canada
QatarBahrain
Azerbaijan
Algeria
United Arab Emirates
BurkinaFaso
São Tomé and PríncipeEquatorial Guinea
Belarus
MarshallIslands
Fed. States ofMicronesia
LaoP.D.R.
Netherlands
Italy
Russian Federation
Congo
Guyana
Suriname
Peru
Chile
Argentina
Paraguay
NorwaySweden
Turkmenistan
Uzbekistan
Pakistan
Oman
Eritrea
Nepal
Japan
Ghana
BeninTogo
Cameroon Somalia
Malawi
Mozambique
Viet Nam
Tonga
Tuvalu
NauruKiribati
Fiji
Samoa
Vanuatu
SolomonIslands
British Virgin Islands
Macao SAR, China
Aruba (Neth.)
Cayman Islands
(UK)WesternSahara
Greenland(Denmark)
Jammu and Kashmir*Bermuda (UK)
Anguilla (UK)
Turks andCaicos Is.
(UK)
Gibraltar (UK)
Puerto Rico(USA)
Hong Kong SAR, China
Montserrat (UK)
Faroe Islands(Den.)
Niue (NZ)Cook Islands(NZ)
Tokelau (NZ)
* Dotted line represents approximately the Line of Control in Jammu and Kashmir agreed upon by India and Pakistan. The final status of Jammu and Kashmir has not yet been agreed upon by the parties.
Final boundary between the Republic of Sudan and the Republic of South Sudan has not yet been determined.
1. The FYR of Macedonia2. Albania3. Montenegro4. Serbia5. Bosnia and Herzegovina6. Croatia7. Slovenia
8. Hungary9. Austria10. Czech Republic11. Slovakia12. Republic of Moldova13. Romania14. Bulgaria
Less than 25%
[25% to 35%[
[35% to 45%[
Greater than 45%
No data
iv OECD (2010). Atlas of Gender and Development: How Social Norms Affect Gender Equality in Non-OECD countries. Paris: Organisation for Economic Co-operation and Development.
As already seen in Figure 5.4.1, there is a sharp drop-off in the number of women who move from the master’s level to PhDs, and there is an even sharper drop in those who go on to careers in research. Clearly women face considerable barriers as they move up the educational ladder to research careers.
When it comes to employment as researchers, men have the edge by an enormous ratio of 71 to 29 percent. Map 5.6.1 gives the global picture of the percentage of female researchers. In a majority (54) of the 90 countries for which data are available, women account for 25 to 45 percent of researchers. They represent more than 45 percent of researchers in only 21 nations, or one in five.
Venezuela and Latvia have the highest proportion of female researchers of any country – 55 percent. They are followed by: Azerbaijan, Georgia, Philippines, Thailand, Argentina, Lithuania, the FYR of Macedonia, Paraguay and Uruguay.
Factors that may explain the lower number of female researchers, especially in senior positions, include the work-life balance, gender stereotyping, performance measurement and promotion criteria, governance, and the role of researchers in society. Apart from being under-represented, women in research are also often paid less than equally-qualified men, are less likely to be promoted, and are consistently clustered at the lower ranking of the science system.
Over-representation of women in higher education is not necessarily the result of affirmative action in their favour, for such legislation is rare. Rather, empirical research highlights several reasons for the growing participation of women in post-secondary education, beginning with the fact that higher levels of schooling are now required to attain social mobility and escape poverty. Even though higher education leads to individual returns in the form of higher income, women often need to have more education than men to get the same jobs. Globalization has led to more attention to gender egalitarianism. Finally, once women gain access to higher education they frequently exceed men in grades, evaluations and degree completion.
It must also be noted that over-representation of women in higher education has yet to translate into proportional representation in the labour market, especially in leadership and decision-making positionsiv. Even though
many women have started to benefit from their countries’ improved education systems, they face barriers to the same work opportunities available to men. Women continue to confront discrimination in jobs, disparities in power, voice and political representation and the laws that are prejudicial on the basis of their gender. As a result, well-educated women often end up in jobs where they do not use their full potential and skills.
Source: UNESCO Institute for Statistics
6. Men continue to predominate in research jobs
7. Multiple reasons for over-representationof women in post-secondary education
Map 5.6.1 What is the share of women among researchers?
Women as a share of total researchers
CHAPTER 5 Enrolment and gender trends: tertiary education
84 85