chapter 4 analyzing results
TRANSCRIPT

Page 91
Watershed Planning Guidebook for Kentucky Communities
Chapter 4: Analyzing Results
Chapter 4 Analyzing ResultsIdentifying Sources and Targeting Efforts
Introduction 4.1 Understanding the Goal of the Analysis 4.2 Data Analysis Requirements for 319-Funded Watershed Plans 4.3 Other Analysis Options for Non-319-Funded Watershed PlansActive OptionsWrite It Down
This chapter will help you:• Understand what the data and information collected tell you about the watershed• Determine how to utilize the information for source determination• Target sub-watershed areas for implementation
As in every chapter, this one also provides:• Active Options• Write It Down
IntroductionOnce you have collected all of your data, both the existing data compiled in Chapter 2 and the monitoring data Chapter 3, you must determine what the data tell you about the condition of the watershed. This information is vital for determining sources and targeting efforts to protect the areas currently in good condition and restore the areas with problems.
4.1 Understanding the Goal of the AnalysisThe goal of your watershed analysis is to make a determination of the locations in the watershed in which implementation of BMPs will be most feasible, efficient, and effective. Key factors to consider in the analysis are a detailed examination of monitoring data in relationship to a variety of desired outcomes, how compiled data may be influenced by local conditions, and how readily the goals of your planning team may be accomplished across the watershed. Once you have completed your analysis, you should feel confident that you have selected several sub-watersheds in which you can implement BMPs that will make measureable water quality improvements.
4.2 Data Analysis Requirements for 319-Funded Watershed PlansChapter 3 explained that a phased approach for both monitoring and data analysis must be used for 319-funded watershed plan projects. It also described the Phase 1 and Phase 2 monitoring requirements. The information below describes the minimum 319 analysis requirements. Subsection 4.2.1 describes the Phase 1 analysis process and subsection 4.2.3 describes the Phase 2 analysis process. The Phase 1 analysis
Find related and additional information about this stage of watershed planning in Chapters 7, 8 and 9 of EPA’s Handbook

Page 92
Watershed Planning Guidebook for Kentucky Communities
Chapter 4: Analyzing Results
should be performed on the monitoring data collected as part of the Phase 1 monitoring and on the watershed inventory data compiled in Chapter 2. This analysis will result in the selection of the smaller sub-watersheds (e.g. HUC 14) that will be further monitored during the Phase 2 monitoring. The Phase 2 analysis should be performed on the monitoring data collected as part of the Phase 2 monitoring, while again considering the watershed inventory data compiled in Chapter 2. This analysis will allow you to determine sources in the sub-watersheds and target implementation.
4.2.1 Phase 1 - AnalysisThe purpose of this phase is to analyze the monitoring data collected in the Phase 1 monitoring for prioritization of up to three smaller sub-watersheds for additional assessment and implementation. At a minimum, this analysis should be based on comparisons of parameter concentrations, pollutant loads/yields, and the watershed inventory from Chapter 2 of the watershed plan. Further analysis can be conducted based upon need and local concern.
Comparisons of Parameter Concentrations After you complete the Phase 1 monitoring, you will have results from all of the samples collected. Many of these results will be expressed in concentrations (e.g. 10 mg/L of nitrogen). To determine if these results indicate either good or poor water quality, you need to have a desirable concentration to which you can compare them. The first step in the analysis process is to establish this comparison concentration, which is called a benchmark. A benchmark is defined as an acceptable water quality concentration for a healthy stream.
As you make these concentration comparisons for each parameter, keep in mind how precipitation in your watershed and the changes in flow over the watershed that are created by rainfall affect water quality. For example, a wet weather sample can tell you a lot about the types of pollutants that have accumulated across the watershed in the days preceding the sampling event. Conversely, a dry weather sample can tell you a lot about your watershed when pollutants are not being actively collected in runoff from the surface of the land and draining into the stream system. Make sure to consider these precipitation-driven changes in your watershed as you compare pollutant concentrations in your analysis. Additionally, examine how concentrations may vary throughout your sampling period. Consider what duration and frequency of high or low concentrations at different times of the year may suggest about changing conditions or management practices on the landscape.
Some parameter benchmarks have been established through existing Kentucky regulations (refer to Watershed Basics section). These benchmarks are called Water Quality Standards. You will have to establish a benchmark for parameters that do not have Water Quality Standard. This can be determined by using a watershed or regional average for the parameter based on Reference Reach averages in the watershed or ecoregion. The following is the preferred order of benchmark water quality conditions:
Page 93
Watershed Planning Guidebook for Kentucky Communities
Chapter 4: Analyzing Results
Once you have established benchmarks, describe the relationship between the actual water quality and the benchmark water quality conditions for the concentrations of all parameters collected for each sampling location. You may find that the monitoring data are equal to or less than the established benchmarks and, therefore, meet the desired water quality for that location. Or you may find that they exceed the benchmark and indicate that there is a potential problem with the water quality at that location.
Comparisons of Pollutant Loads The next step in the analysis is to calculate pollutant loads for the parameters. A pollutant load is the amount of a specific pollutant moving through a stream. The pollutant load is based upon both the concentration of the pollutant and the stream flow. Loads are generally expressed in terms of a weight (of pollutant) and a period of time, resulting in pounds per day, for example. Pollutant loads are important in watershed planning because they allow a more balanced comparison of sub-watersheds. A watershed with a low concentration of a pollutant but with a lot of flow may have a higher load than a watershed that has a high pollutant concentration but only a trickle of flow. Large loads may have significant impacts on the larger watershed as a whole.
For the water quality parameters you collect, you will likely determine that some concentrations are above your benchmarks and others are below. Because of the level of involvement required to calculate and evaluate loads, you may decide not to calculate loads for those parameters that are below the benchmarks you have established. But in some cases, and for
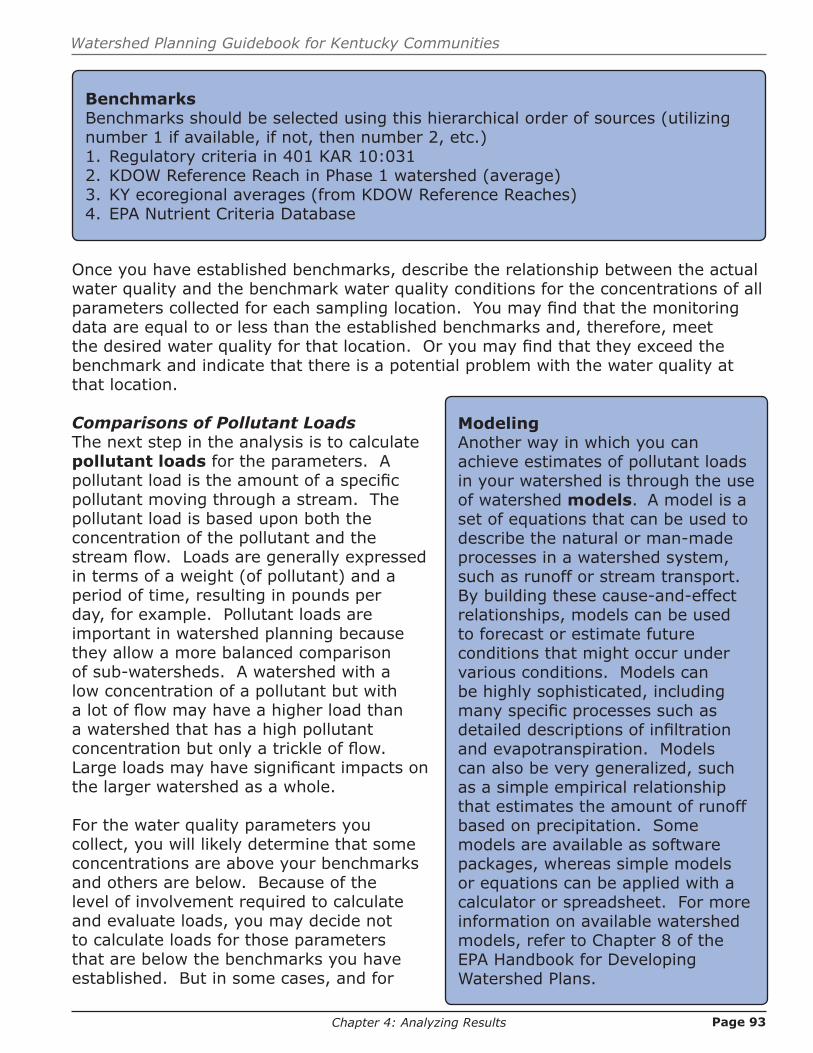
BenchmarksBenchmarks should be selected using this hierarchical order of sources (utilizing number 1 if available, if not, then number 2, etc.)1. Regulatory criteria in 401 KAR 10:0312. KDOW Reference Reach in Phase 1 watershed (average)3. KY ecoregional averages (from KDOW Reference Reaches) 4. EPA Nutrient Criteria Database
ModelingAnother way in which you can achieve estimates of pollutant loads in your watershed is through the use of watershed models. A model is a set of equations that can be used to describe the natural or man-made processes in a watershed system, such as runoff or stream transport. By building these cause-and-effect relationships, models can be used to forecast or estimate future conditions that might occur under various conditions. Models can be highly sophisticated, including many specific processes such as detailed descriptions of infiltration and evapotranspiration. Models can also be very generalized, such as a simple empirical relationship that estimates the amount of runoff based on precipitation. Some models are available as software packages, whereas simple models or equations can be applied with a calculator or spreadsheet. For more information on available watershed models, refer to Chapter 8 of the EPA Handbook for Developing Watershed Plans.
Page 94
Watershed Planning Guidebook for Kentucky Communities
Chapter 4: Analyzing Results
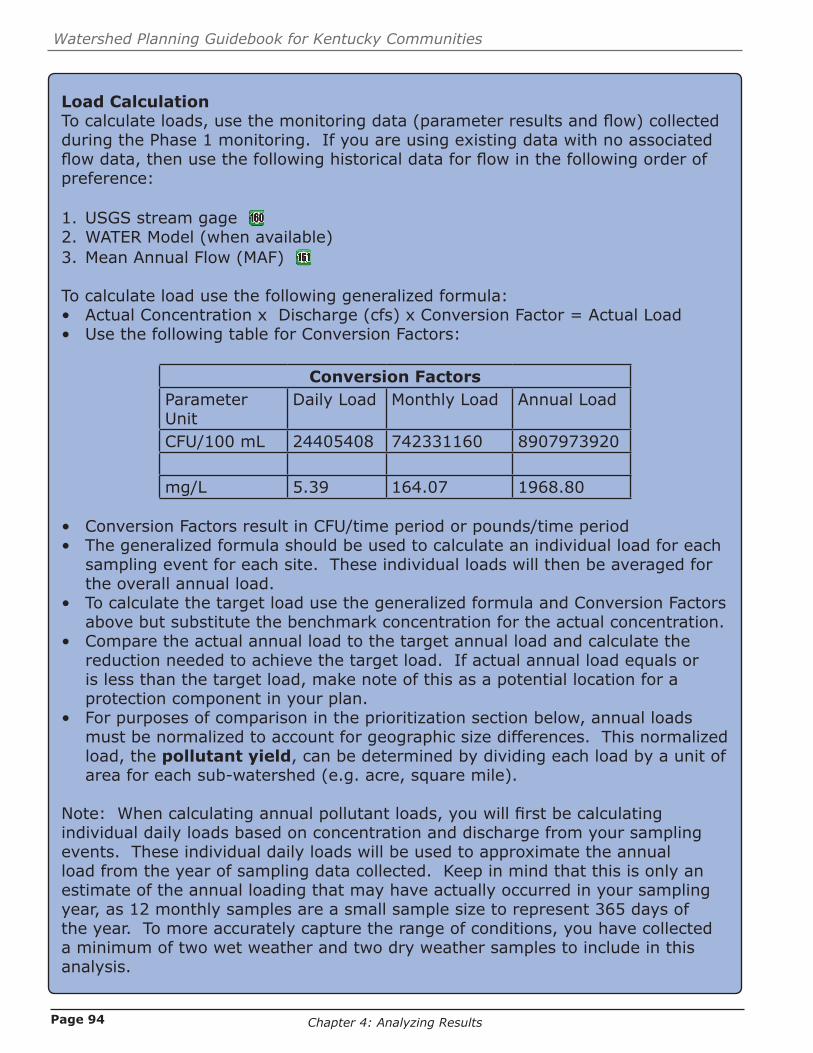
Load CalculationTo calculate loads, use the monitoring data (parameter results and flow) collected during the Phase 1 monitoring. If you are using existing data with no associated flow data, then use the following historical data for flow in the following order of preference:
1. USGS stream gage 2. WATER Model (when available)3. Mean Annual Flow (MAF)
To calculate load use the following generalized formula:• Actual Concentration x Discharge (cfs) x Conversion Factor = Actual Load• Use the following table for Conversion Factors:
Conversion FactorsParameter Unit
Daily Load Monthly Load Annual Load
CFU/100 mL 24405408 742331160 8907973920 mg/L 5.39 164.07 1968.80
• Conversion Factors result in CFU/time period or pounds/time period• The generalized formula should be used to calculate an individual load for each
sampling event for each site. These individual loads will then be averaged for the overall annual load.
• To calculate the target load use the generalized formula and Conversion Factors above but substitute the benchmark concentration for the actual concentration.
• Compare the actual annual load to the target annual load and calculate the reduction needed to achieve the target load. If actual annual load equals or is less than the target load, make note of this as a potential location for a protection component in your plan.
• For purposes of comparison in the prioritization section below, annual loads must be normalized to account for geographic size differences. This normalized load, the pollutant yield, can be determined by dividing each load by a unit of area for each sub-watershed (e.g. acre, square mile).
Note: When calculating annual pollutant loads, you will first be calculating individual daily loads based on concentration and discharge from your sampling events. These individual daily loads will be used to approximate the annual load from the year of sampling data collected. Keep in mind that this is only an estimate of the annual loading that may have actually occurred in your sampling year, as 12 monthly samples are a small sample size to represent 365 days of the year. To more accurately capture the range of conditions, you have collected a minimum of two wet weather and two dry weather samples to include in this analysis.

Page 95
Watershed Planning Guidebook for Kentucky Communities
Chapter 4: Analyzing Results
some parameters, calculated loads may be very useful in helping you compare two or more sub-watersheds.
Because of the importance of several specific water quality parameters to all watershed plans, you will need to calculate loads for these parameters. At a minimum, you must calculate loads for each sampling location for the following parameters: Total Nitrogen, Total Phosphorus, Total Suspended Solids, and E. coli. Additional loads must be calculated for parameters where concentrations were found to exceed benchmark water quality conditions and may be calculated for parameters of local concern. In addition, models can be used to supplement these load calculations. Your decision whether to use a model for this part of your analysis will depend on the scope of your watershed plan, the type of water body being studied, the conditions in the drainage area, and the pollutant mix under review.
Comparison of Watershed Inventory Data to Pollutant Concentrations and Loads/YieldsThe final step in this phase of the analysis is to correlate the pollutant concentrations and loads/yields calculated in the prior step to the watershed inventory information gathered in Chapter 2. This inventory includes information regarding hydrology, karst features, geology, soils, riparian ecosystem, flora, fauna and human impacts, which can have varying levels of influence on water quality based on the watershed location. You will need to examine any potential relationships between this inventory and the effects these may have, either positive or negative, on water quality. This needs to be done for each sub-watershed in which you have monitoring data.
For example, what influence might a karst area have on the water quality you have observed in a particular sub-watershed? You should ask yourself this type of question about each of the categories included in your inventory and consider the wide-ranging and synergistic effects they may have on the specific situation in your watershed. What are the relationships between all of these factors, and what do they mean for your watershed?
4.2.2 Phase 1 – Prioritization Now that you have analyzed all the data collected to this point from your watershed, you can begin to use this new information to help prioritize your sub-watersheds. The goal of prioritization is to select sub-watersheds for additional monitoring to better determine pollutant sources. This will help to target future implementation efforts in your watershed. When utilizing analytical data for prioritization, it is important to consider both protection as well as restoration. Keep in mind that the costs are generally lower for protection activities, and that protection can be more effective than restoration for overall watershed health.
Page 96
Watershed Planning Guidebook for Kentucky Communities
Chapter 4: Analyzing Results
You should be working to prioritize up to three sub-watersheds from your larger watershed for further monitoring and analysis in Phase 2 of your project. There are a number of factors that must be considered in the prioritization process. These factors, summarized below, are detailed in the remainder of section 4.2.2. They include, but are not limited to:• Organizing Analytical Data
• Comparisons of parameter concentrations• Comparisons of pollutant loads and yields
• Regulatory Status of Waterway• Impairment status• TMDL status• Special Use Waters
• Feasibility Factors• Comparison of watershed inventory data to pollutant loads• Regulatory matters• Stakeholder cooperation• Political will• Available funding• Areas of local concern• Existing priority status• Watershed management activities• Monitoring considerations
Organizing Analytical DataComparisons of parameter concentrationsIn the Analysis section above, you compared parameter concentrations to established benchmarks. Now it is time to use this information to help determine which sub-watersheds need the most change to bring concentrations within an acceptable range. To accomplish this, you will need to categorize the sub-watersheds based on their relationship to the benchmark water quality concentrations. This must include, at a minimum, ranking the sub-watersheds from greatest exceedance to the lowest concentrations for Total Nitrogen, Total Phosphorus, Total Suspended Solids and E. coli. These should be considered both in terms of number of exceedances (or non-exceedances) as well as highest maximum (or lowest) concentration.
Once you have compiled your ranked list of sub-watersheds, you should be able to determine which areas are in greatest need of restoration efforts based on exceedances of benchmarks. If the lowest concentrations in your lists fall below your benchmark values, make note of these sub-watersheds as locations that may merit protection efforts.
Comparisons of pollutant loads and yieldsIn the Analysis section above, you calculated pollutant loads for each sub-watershed. Now it is time to use this information to help determine which sub-watersheds are contributing the most pollution (by weight) within your watershed. You can do this by categorizing the sub-watersheds based on the relationship of their actual annual loads to target annual loads. This must include, at a minimum, ranking the sub-watersheds from the greatest to lowest loading for Total Nitrogen, Total Phosphorus, Total Suspended Solids and E. coli. Additionally, utilize your pollutant yields (for geographic size differences) as another comparison.

Page 97
Watershed Planning Guidebook for Kentucky Communities
Chapter 4: Analyzing Results
Prioritized Sub-watershed 2Key Factors:- Highest pollutant load - Highly motivated stakeholders- Local city grant will assist with implementation- Includes a Source Water Protection Area
Prioritized Sub-watershed 3Key Factors:- Lowest pollutant load (protection)- Highly motivated stakeholders- Majority of watershed contains protected forest lands
Prioritized Sub-watershed 1Key Factors:- Second highest pollutant load- Extremely high E.coli concentrations- Multiple areas of local concern due to improperly installed septic systems
LegendWatershed Boundary
Sub-watershed Boundary
Phase 2 Prioritized Sub-watersheds
Streams
0 1 20.5 Miles
FIGURE 4.1 - Phase 1 Prioritization of Sub-watersheds

Page 98
Watershed Planning Guidebook for Kentucky Communities
Chapter 4: Analyzing Results
Once you have compiled your ranked list of sub-watersheds, you should be able to determine which areas are in greatest need of restoration efforts based on the highest pollutant loadings and/or yields. If the lowest loads in your lists fall below your target loads, make note of these sub-watersheds as locations that may merit protection efforts.
Regulatory Status of WaterwayThe main goal of watershed planning is to improve waterways to a point that will result in the stream meeting its designated uses, or to protect them so that they continue to meet designated uses. If a stream within your watershed is listed as impaired in the state Integrated Report to Congress on Water Quality [or your monitoring efforts may result in a 303(d) listing or delisting], has an approved TMDL, or contains a Special Use water (401 KAR 10:026 or 401 KAR 10:030), it must receive consideration in your prioritization process.
Feasibility Factors After looking at the analytical data and regulatory status of your waterway, examine your list and see if your initial priorities for implementation can actually be accomplished. This involves looking at a variety of feasibility factors. The following factors should be considered.
Comparison of the watershed information you collected to pollutant loads Now that you have calculated pollutants loads for all of the sub-watersheds and compared them to each other, consider the potential influence or effects of the watershed information on the pollutant loads. For example, what is the effect from a wastewater treatment plant point source contribution on the overall loading from a sub-watershed? Even if it seems like an easy fix, it won’t do much good if the fix doesn’t have an impact on the overall pollutant load reduction. Another example would be a karst-influenced watershed. What impacts could water migration into or out of your watershed have on overall loading from a sub-watershed? These types of questions are important considerations to make when prioritizing sub-watersheds.
Regulatory matters Some watershed issues may be beyond the scope of what your BMPs can address. Does your planning team have the capacity to address the issue? Is it a regulatory enforcement issue? For example, if data shows that a wastewater treatment plant is the major pollutant contributor, you may choose to eliminate this sub-watershed as potential priority for the focus of your planning team. This could be a regulatory issue, in which case, you should refer to the information on regulatory programs that is discussed in Chapter 5.
Stakeholder cooperation Successful implementation requires support from local stakeholders. It is important to look at the watershed, along with the watershed information you gathered and pollutant loads, and consider stakeholder support for your goals for protection or restoration. For example, if an implementation goal involved stream restoration, would the local landowners be more supportive in one particular sub-watershed? Sometimes, it is also important to consider local demographics. Will a rain garden be successful over the long run in an area populated mostly by people who rent their homes?
Political will Successful implementation requires support from local officials. It is important to look at the sub-watershed, along with the watershed information and pollutant loads, and consider the political will for accomplishing your goals for protection or restoration. For example, if an implementation goal involved changing or creating a local ordinance,

Page 99
Watershed Planning Guidebook for Kentucky Communities
Chapter 4: Analyzing Results
would your local officials be more supportive if the impetus came from one particular sub-watershed?
Available funding Financial resources are critical to success in your watershed and must be considered when prioritizing sub-watersheds. For example, are there particular sub-watersheds in which you may be able to garner more funds than the others for continued monitoring and implementation efforts? Areas of local concern There may be issues or locations throughout your watershed that are important to local stakeholders. For example, are there areas in the watershed that are special to the community and merit protection, like a swimming hole or a historical location? Is there an area of particular concern for the community even though it may not be an area of significant pollution?
Existing priority status Past work may have led to additional resources being spent or allocated in your watershed. For example, are there particular sub-watersheds in which partners are already working or have federal, state, or local priority status?
Watershed management activities The information regarding Source Water Protection Plans, Groundwater Protection Plans, Wellhead Protection Areas, past and current watershed plans, wastewater authorities, Agriculture Water Quality Plans, and special land use planning discussed in Chapter 5 should also be utilized in the prioritization. For example, if there is a particular sub-watershed that is in a Wellhead Protection Area, it may be more likely to secure local support in that watershed.
Monitoring considerationsDuring Phase 1 you monitored at the mouth of all sub-watersheds. If lack of flow was an issue with the Phase 1 site, it is likely it will be more of an issue for sampling sites located on smaller tributaries within the sub-watershed. It is important that you are able to collect enough samples to determine source and target implementation efforts. If you think obtaining the amount of samples required will be problematic in your Phase 2 sub-watershed, you should factor this in to your decision-making when determining your planning team’s priorities for Phase 2.
4.2.3 Phase 2 – AnalysisThe Phase 2 analysis will allow you to focus on the sub-watersheds from your Phase 2 monitoring in which you collected samples for an additional year. Results from this analysis
Source – There are many different definitions for source. It can be defined as a particular type of land use (e.g. mining), a discharge point (e.g. an outfall from a wastewater treatment plant that is not meeting permit requirements), or in some cases a specific landowner (e.g. Gudmilk Dairy). The KY 319(h) program defines source for the 319-funded watershed plans as the area that contributes a pollutant. Refer to Figure 3.1. In that figure, the source is the small catchment upstream from the Phase 2 monitoring sampling point. This source contains multiple pollutant contributors that are resulting in high levels of E.coli.

Page 100
Watershed Planning Guidebook for Kentucky Communities
Chapter 4: Analyzing Results
should give you the information you need to make determinations of pollutant sources within your prioritized sub-watersheds. You should then begin to determine all of the management practices needed in each of the prioritized sub-watersheds (Chapters 5 and 6).
Comparisons of Parameter Concentrations and Comparisons of Pollutant LoadsThis Phase 2 analysis will rely on many of the same methods that were utilized in your Phase 1 analysis. You will again need to report and make comparisons of all your parameter concentrations to the benchmarks you have set. Also, calculate pollutant loads for all of your sampling locations and determine the target load reductions needed to achieve your target loads. Use the same format and structure to do this that you used in your Phase 1 analysis.
Depending on the sampling strategy within your sub-watersheds, you may need to consider the cumulative impacts of pollutant loading from upstream sampling locations.
This sampling point only represents the load contributed by the catchment (shaded in green) that drains to this location.
This sampling point is located at the mouth of the sub-watershed. It represents the load contributed by the entire sub-watershed (outlined in gray) that drains to this location.
FIGURE 4.2 - Cummulative Load Contributions
Page 101
Watershed Planning Guidebook for Kentucky Communities
Chapter 4: Analyzing Results
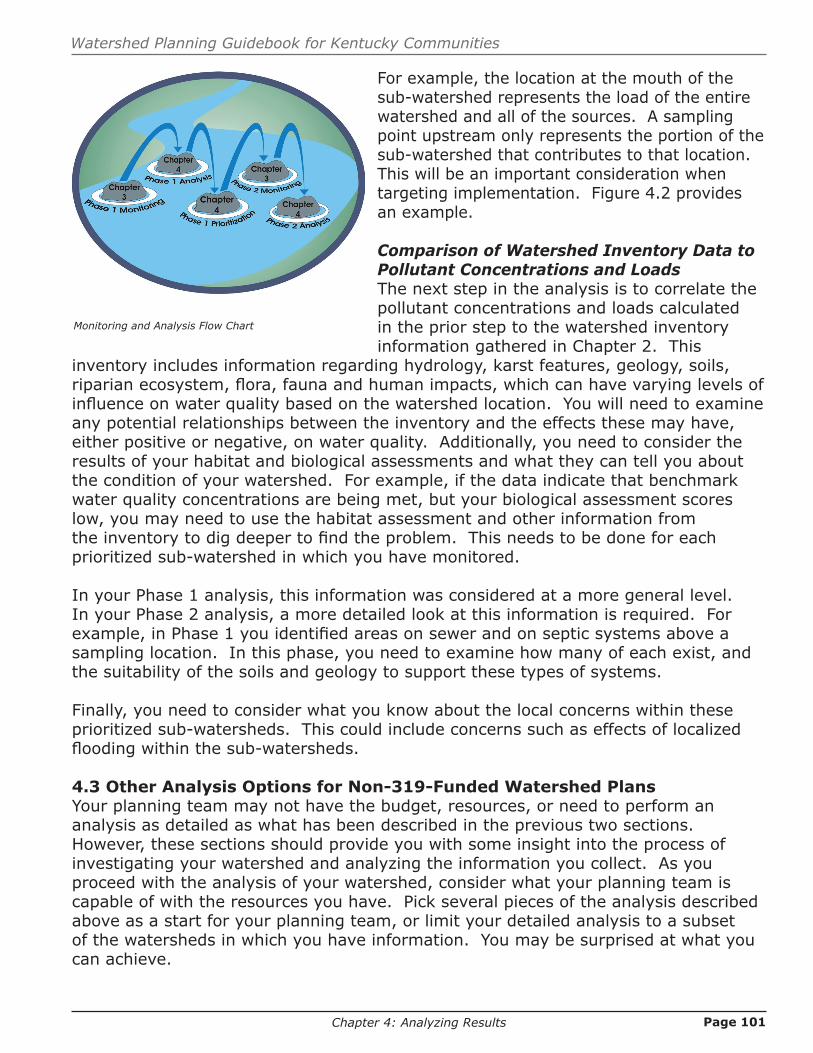
For example, the location at the mouth of the sub-watershed represents the load of the entire watershed and all of the sources. A sampling point upstream only represents the portion of the sub-watershed that contributes to that location. This will be an important consideration when targeting implementation. Figure 4.2 provides an example.
Comparison of Watershed Inventory Data to Pollutant Concentrations and LoadsThe next step in the analysis is to correlate the pollutant concentrations and loads calculated in the prior step to the watershed inventory information gathered in Chapter 2. This
inventory includes information regarding hydrology, karst features, geology, soils, riparian ecosystem, flora, fauna and human impacts, which can have varying levels of influence on water quality based on the watershed location. You will need to examine any potential relationships between the inventory and the effects these may have, either positive or negative, on water quality. Additionally, you need to consider the results of your habitat and biological assessments and what they can tell you about the condition of your watershed. For example, if the data indicate that benchmark water quality concentrations are being met, but your biological assessment scores low, you may need to use the habitat assessment and other information from the inventory to dig deeper to find the problem. This needs to be done for each prioritized sub-watershed in which you have monitored.
In your Phase 1 analysis, this information was considered at a more general level. In your Phase 2 analysis, a more detailed look at this information is required. For example, in Phase 1 you identified areas on sewer and on septic systems above a sampling location. In this phase, you need to examine how many of each exist, and the suitability of the soils and geology to support these types of systems.
Finally, you need to consider what you know about the local concerns within these prioritized sub-watersheds. This could include concerns such as effects of localized flooding within the sub-watersheds.
4.3 Other Analysis Options for Non-319-Funded Watershed PlansYour planning team may not have the budget, resources, or need to perform an analysis as detailed as what has been described in the previous two sections. However, these sections should provide you with some insight into the process of investigating your watershed and analyzing the information you collect. As you proceed with the analysis of your watershed, consider what your planning team is capable of with the resources you have. Pick several pieces of the analysis described above as a start for your planning team, or limit your detailed analysis to a subset of the watersheds in which you have information. You may be surprised at what you can achieve.
Monitoring and Analysis Flow Chart

Page 102
Watershed Planning Guidebook for Kentucky Communities
Chapter 4: Analyzing Results
Active Options • Stream assessments are great ways to involve members of your planning team in the analytical stage of your planning. Members who have limited experience in stream science can be teamed with partners or consultants
who have the technical background to take the on-site lead.• The watershed problems revealed by the analyses will also reveal stakeholders
who should participate in the planning process, but have yet to be invited or fail to show up. For example, your planning team may not include farmers, even though agricultural land uses seem to be at the root of some of the stream’s problems. Be sure to involve these stakeholders in a positive way that is not misconstrued as finger-pointing or placing blame.
• As the analysis reveals more of the nonpoint source problems of the watershed, it also reveals the potential audience for your education and outreach efforts. You not only need your community’s support, but it is also your civic responsibility to let your community know what you are learning.
• Present the results of your analyses to the planning team in a work session where the results of each can be compared with one another. At this point, partners and advisors should be gaining a solid idea of the cleanup and planning issues that you are facing. You might convene another Watershed Roundtable, which is mentioned in Chapter 1.
• This is also a good point in the planning process to consider posting your work on the website of either a sponsor or a partner, and/or to create a Facebook page for the project. These efforts make your work more accessible to members of the planning team and other interested members of the public. You will recruit friends, partners, and influential local support with a policy of sharing and openness.
• A formal presentation to the community may also be appropriate. Depending on what you think may be most beneficial to your project’s success, you may choose to present at the end of Phase 1, at the end of Phase 2, or to present both when you are finished. By presenting your findings at a community meeting or in a local newspaper article, what is perhaps unpleasant news can be presented in positive terms and won’t take people by surprise. Be accurate but creative; make the most important information the easiest for people to grasp.
Write It Down
Phase 1 – Analysis Analyze the monitoring data collected in the Phase 1 monitoring for
prioritization of up to three smaller sub-watersheds for additional assessment and implementation• Compare parameter concentrations
• Establish benchmark concentrations and make comparisons for each parameter• Describe the relationship between the actual water quality and the benchmark
water quality conditions for the concentrations of all parameters collected for each sampling location
• Compare pollutant loads/yields• Calculate pollutant loads/yields
writeit down
writeit down
stepit upstepit up
backgroundbriefing
backgroundbriefingactive
optionsactive
options
writeit down
writeit down
stepit upstepit up
backgroundbriefing
backgroundbriefingactive
optionsactive
options

Page 103
Watershed Planning Guidebook for Kentucky Communities
Chapter 4: Analyzing Results
• Calculate target loads• Compare the actual annual load to the target annual load and calculate the
reduction needed to achieve the target load• Compare watershed inventory data to pollutant concentrations and loads/yields
• Examine any potential relationships between this inventory and the effects these may have, either positive or negative, on water quality for each sub-watershed
Phase 1 – PrioritizationPrioritize up to three sub-watersheds from your larger watershed for further monitoring and analysis in Phase 2 of your project
Examine these factors:• Organizing analytical data
• Comparisons of parameter concentrations• Comparisons of pollutant loads/yields
• Regulatory status of waterway• Impairment status• TMDL status• Special Use Waters
• Feasibility factors• Comparison of watershed inventory data to pollutant loads• Regulatory matters• Stakeholder cooperation• Political will• Available funding• Areas of local concern• Existing priority status• Watershed management activities• Monitoring considerations
Phase 2 – AnalysisAnalyze the monitoring data collected in the Phase 2 monitoring to make determinations of pollutant sources within your prioritized sub-watersheds• Compare parameter concentrations and compare pollutant loads
• Use same methods utilized in your Phase 1 analysis• Make comparisons of all your parameter concentrations to benchmarks• Calculate pollutant loads for all of your sampling locations• Determine load reductions needed to achieve your target loads
• Compare watershed inventory data to pollutant concentrations and loads• Examine any potential relationships between this inventory and the effects
these may have, either positive or negative, on water quality for each sub-watershed
• Examine results of habitat and biological assessment• Examine local concerns

This page intentionally left blank