chapter 2chapter 2 - inflibnetshodhganga.inflibnet.ac.in/bitstream/10603/2219/13/13_chapter...
TRANSCRIPT
Chapter 2
Sachin Shah University of Pune
Ph.D. Thesis
43
Chapter 2Chapter 2Chapter 2Chapter 2
Fermentation parameters and
characterization techniques
This chapter describes the effect of different fermentation parameters for the production
of sophorolipids and experimental techniques used during the course of the present work.
Chapter 2
Sachin Shah University of Pune
Ph.D. Thesis
44
2.1. Introduction
The yeasts, Candida bombicola (ATCC 22214) and Candida apicola (ATCC
96134) can synthesize a mixture of sophorolipids. During stationary phase Candida sp.
secretes sophorolipids when grown on glucose and supplemented with long chain fatty
acid.1 The sophorolipids consisted of sophorose, a diglucoside, linked glycosidically to
the terminal (ω) and sub terminal (ω -1) hydroxy group of a hydroxy-fatty acid.2 19-
hydroxyeicosatetraenoic acid (19-HETE) and 20- hydroxyeicosatetraenoic acid (20-
HETE) were obtained from the yeast Candida bombicola and Candida apicola in
glycosilated form when grown on glucose and arachidonic acid. Free hydroxylated fatty
acids, 19-HETE and 20-HETE were liberated by hydrolysis of diglucoside linked
glycosidically to the terminal (ω) and sub terminal (ω -1) of the fatty acid. Interest in this
work was stimulated by the important biomedical role of hydroxy fatty acids (oxylipins),
19-HETE and 20-HETE. These oxylipins play an important role in modulating variety of
cardiovascular events. As mentioned in the Chapter 1, there are evidences that 19-HETE
and 20-HETE play important role in regulation of renal, cerebral and pulmonary blood
flow via signal transduction pathways. For example, inhibition of 20-HETE formations in
the kidneys and brain abolishes autoregulation of blood flow and arterial blood pressure.
Though these oxylipins play such important role in human physiology there are no
reports on production of these compounds other than chemical synthesis. Most of the
reports were on chemical synthesis and some reports on mammalian cell lines were used
for the production of these oxylipins.3 Both methods are tedious and cost incurring
(Sigma Chemicals USA and Cyman Chemicals Co. Ann. Arbor, MI, price of 20-HETE
for 10 mg is $250).
Chapter 2
Sachin Shah University of Pune
Ph.D. Thesis
45
In this chapter we are reporting for the first time, production of these vasoactive
biomolecules by microbial transformation. 20-HETE and 19-HETE are produced as
derivatives of arachidonic acid in the form of sophorolipids. As stated in the general
introduction, standardization of fermentation parameters is prerequisite for any cost
effective development of the process. In light of the above significances, variable
parameters affecting fermentative production of sophorolipids by Candida bombicola and
Candida apicola were optimized to obtain maximum yield. Conditions were optimized
for maximum production of arachidonic acid derived sophorolipids. This part of the
thesis describes the growth conditions for high arachidonic acid derived sophorolipids
production by Candida bombicola and Candida apicola.
2.2. Materials and Methods
2.2.1. Chemicals
Arachidonic acid was obtained from Martek Corporation, MD 21045,USA, as a
free acid of 80 % purity and the other fatty acids were gamma linolenic acid, linoleic acid
and oleic acid. 1 g/ml working stock was freshly prepared by diluting with absolute
ethanol. Glucose was obtained from Qualigens, India; yeast extract, malt extract, and
peptone were from Hi-media, India. All other chemicals were of high purity or analytical
grade and procured from commercial sources. Arachidonic acid of 100 % purity obtained
from Cyman Chemicals Co. Ann. Arbor, MI, used as standard for all experiments.
2.2.2. Microorganism and maintenance
The yeast Candida bombicola ATCC 22214 and Candida apicola ATCC 96134
were procured from American Type Culture Collection, USA. Both the cultures were
Chapter 2
Sachin Shah University of Pune
Ph.D. Thesis
46
maintained by periodic transfer onto medium containing 2 % agar with 5 % glucose MYP
medium in petri plates or slants. The cultures were incubated at 30 °C for 48 h.
2.2.3. Effect of medium composition on production of arachidonic acid derived
sophorolipids by Candida bombicola and Candida apicola
Media A, B, C, D and E, varying in composition were screened for maximal
production of arachidonic acid derived sophorolipid.
Yeast cultures were optimized using the following media:
(A) Medium A: (g l-1
of distilled water) Glucose, 50; Yeast extract, 3.0; Malt extract,
3.0; Peptone, 5.0; pH adjusted to 5.5.
(B) Medium B: reported by Prabhune et al. in 2002 for sophorolipids and sophorolipids
derived products by Candida sp. having the following composition: (g l-1
of distilled
water) Glucose, 50; Yeast extract, 1.0; MgSO4, 0.3; Na2HPO4, 0.2; NaH2PO4, 7;
(NH4)2SO4, 1; pH adjusted to 5.5.4
(C) Medium C: (g l-1
of distilled water) Glucose, 150; Yeast extract, 4.0; MgSO4, 0.3;
KH2PO4, 6; Na2HPO4, 2; pH adjusted to 5.5.
(D) Medium D: (g l-1
of distilled water) Glucose, 150; Yeast extract, 4.0; MgSO4, 0.3;
KH2PO4, 6; Na2HPO4, 2; Urea, 2; pH adjusted to 5.5.
(E) Medium E: (g l-1
of distilled water) Glucose, 0.5 g/l; MgSO4, 10 mg/l; KH2PO4, 125
mg/l; Na2HPO4, 60 mg/l; CaCl2, 10 mg/l; MnSO4, 0.5 mg/l
Fermentative procedure for production of arachidonic acid derived sophorolipids:
10 ml inoculum was developed by growing the yeast cells in respective medium
for 24 h at 30 °C and 160 rpm orbital shaking. Starter culture was prepared by
Chapter 2
Sachin Shah University of Pune
Ph.D. Thesis
47
transferring the inoculum in 50 ml medium followed by incubation at 30 °C for 24 h with
160 rpm orbital shaking.
The fermentative production was initiated by transferring the starter culture into
250 ml of the respective medium in 1000 ml conical flask followed by incubation at
30 °C with 160 rpm orbital shaking. The medium was supplemented with 1 g of 80 %
arachidonic acid dissolved in 1 ml of ethanol to allow formation of arachidonic acid
derived sophorolipid. The fermented broths were examined for the production of
arachidonic acid derived sophorolipids at regular intervals of 24, 48, 72, 96 & 120 h.
(Highest activities were obtained on medium B on the basis of production of
sophorolipids and respective oxylipins, hence was used further for variation in glucose
concentration, pH, temperature and metal ion effect.
2.2.4. Effect of glucose concentration on production of arachidonic acid derived
sophorolipids by Candida bombicola and Candida apicola.
The effect of glucose concentration on production of sophorolipids was tested by
varying the concentration in the range 5 % to 10 % in medium B. Fermentative
procedure employed for the experiment was same as described previously (2.2.3.)
2.2.5. Effect of pH on production of arachidonic acid derived sophorolipids by
Candida bombicola
The effect of pH on production of sophorolipids was tested by adjusting pH of
medium B in the range pH 4.0 to 7.0. Fermentative procedure employed for the
experiment was same as described previously (2.2.3.). As glucose concentration showed
marked effect on sophorolipid yield, pH variation was also studied in presence of 5 %
and 10 % glucose in medium B.
Chapter 2
Sachin Shah University of Pune
Ph.D. Thesis
48
2.2.5.1. Effect of pH on production of arachidonic acid derived sophorolipids by
Candida apicola
The effect of pH on production of sophorolipids was tested by adjusting pH of
medium B in the range pH 4.0 to 7.0. Fermentative procedure employed for the
experiment was same as described previously (2.2.3.).
2.2.6. Effect of temperature on production of arachidonic acid derived sophorolipids
by Candida bombicola and Candida apicola
The effect of temperature on production of sophorolipids and biomass was tested
by incubating the cultures at different temperatures in the range 25 °C to 36 °C.
Fermentative procedure employed for the experiment was same as described previously
(2.2.3). As glucose concentration showed marked effect on sophorolipid yield,
temperature variation was studied in presence of 5 % and 10 % glucose in medium B.
2.2.7. Effect of ferric ions on the production of arachidonic acid derived
sophorolipids by Candida bombicola
Experiments were carried out to see the effect of Fe+3
(in FeCl3) and Fe+2
(in
FeSO4) on sophorolipid production in both cultures. In medium B, 10-30 mM
concentration of Fe+3
and Fe+2
were added respectively and the fermentative procedure
employed for the experiments was same as describe previously (2.2.3.)
Chapter 2
Sachin Shah University of Pune
Ph.D. Thesis
49
2.3. Results and discussion
2.3.1. Effect of media composition on production of arachidonic acid derived
sophorolipids by Candida bombicola and Candida apicola
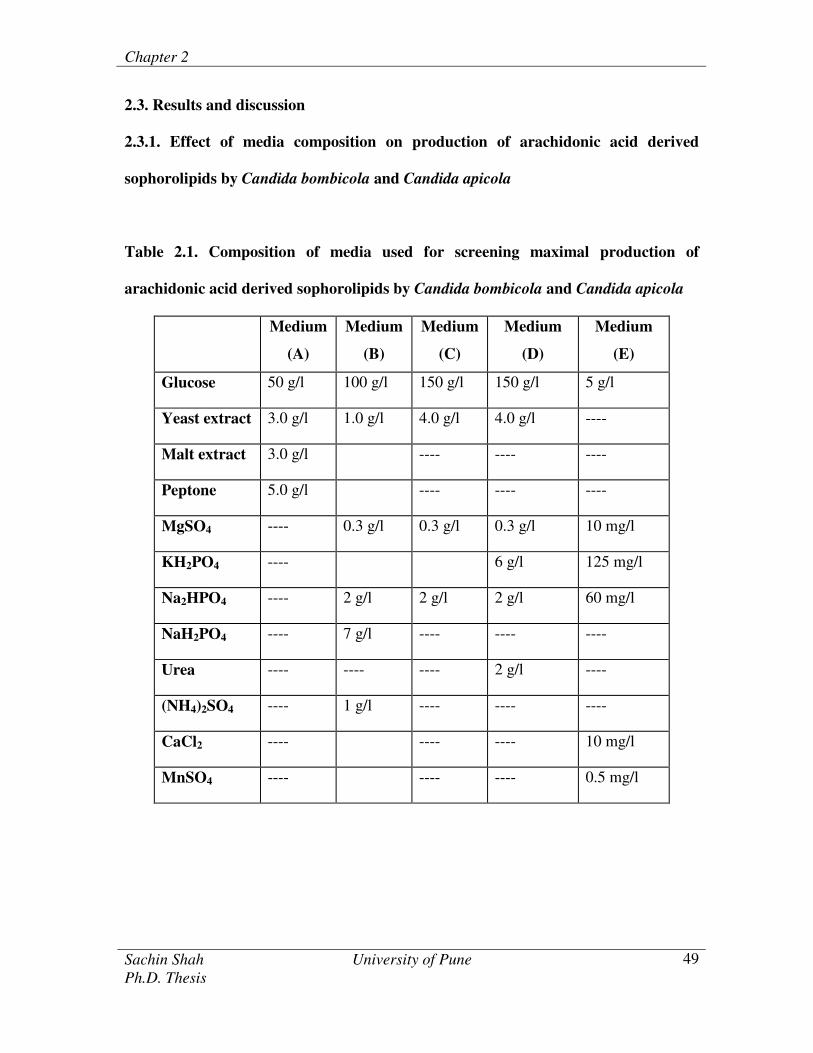
Table 2.1. Composition of media used for screening maximal production of
arachidonic acid derived sophorolipids by Candida bombicola and Candida apicola
Medium
(A)
Medium
(B)
Medium
(C)
Medium
(D)
Medium
(E)
Glucose 50 g/l 100 g/l 150 g/l 150 g/l 5 g/l
Yeast extract 3.0 g/l 1.0 g/l 4.0 g/l 4.0 g/l ----
Malt extract 3.0 g/l ---- ---- ----
Peptone 5.0 g/l ---- ---- ----
MgSO4 ---- 0.3 g/l 0.3 g/l 0.3 g/l 10 mg/l
KH2PO4 ---- 6 g/l 125 mg/l
Na2HPO4 ---- 2 g/l 2 g/l 2 g/l 60 mg/l
NaH2PO4 ---- 7 g/l ---- ---- ----
Urea ---- ---- ---- 2 g/l ----
(NH4)2SO4 ---- 1 g/l ---- ---- ----
CaCl2 ---- ---- ---- 10 mg/l
MnSO4 ---- ---- ---- 0.5 mg/l
Chapter 2
Sachin Shah University of Pune
Ph.D. Thesis
50
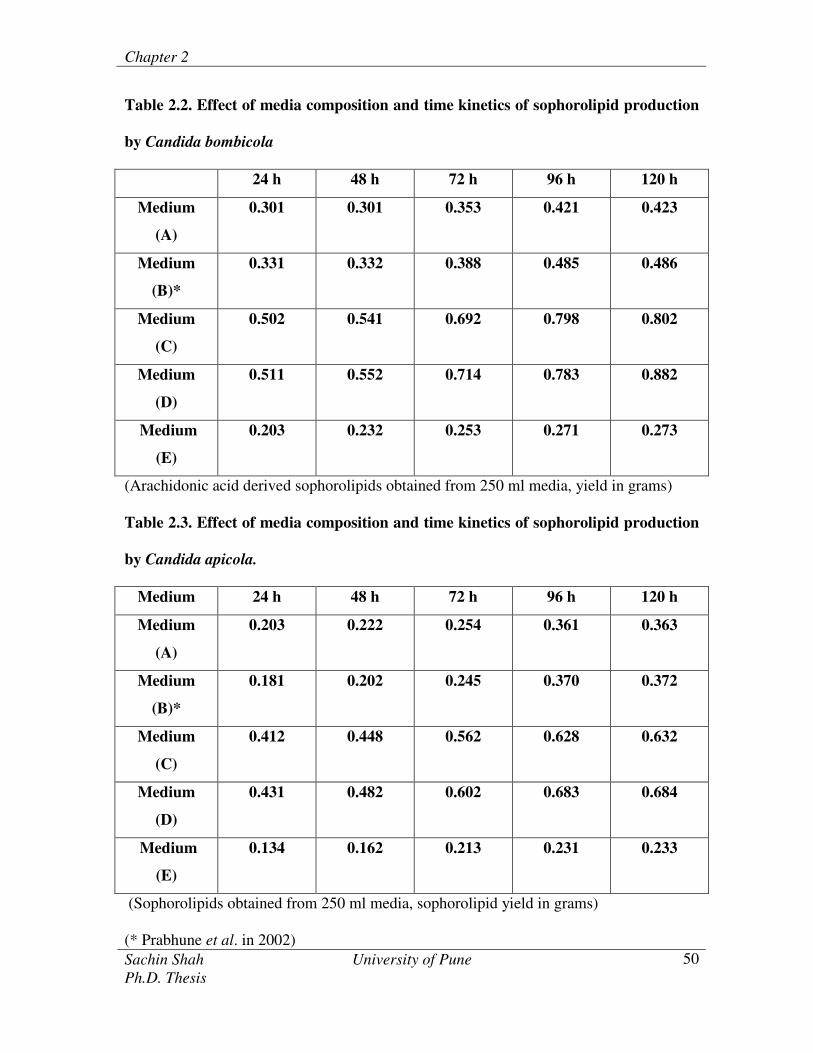
Table 2.2. Effect of media composition and time kinetics of sophorolipid production
by Candida bombicola
24 h 48 h 72 h 96 h 120 h
Medium
(A)
0.301 0.301 0.353 0.421 0.423
Medium
(B)*
0.331 0.332 0.388 0.485 0.486
Medium
(C)
0.502 0.541 0.692 0.798 0.802
Medium
(D)
0.511 0.552 0.714 0.783 0.882
Medium
(E)
0.203 0.232 0.253 0.271 0.273
(Arachidonic acid derived sophorolipids obtained from 250 ml media, yield in grams)
Table 2.3. Effect of media composition and time kinetics of sophorolipid production
by Candida apicola.
Medium 24 h 48 h 72 h 96 h 120 h
Medium
(A)
0.203 0.222 0.254 0.361 0.363
Medium
(B)*
0.181 0.202 0.245 0.370 0.372
Medium
(C)
0.412 0.448 0.562 0.628 0.632
Medium
(D)
0.431 0.482 0.602 0.683 0.684
Medium
(E)
0.134 0.162 0.213 0.231 0.233
(Sophorolipids obtained from 250 ml media, sophorolipid yield in grams)
(* Prabhune et al. in 2002)
Chapter 2
Sachin Shah University of Pune
Ph.D. Thesis
51
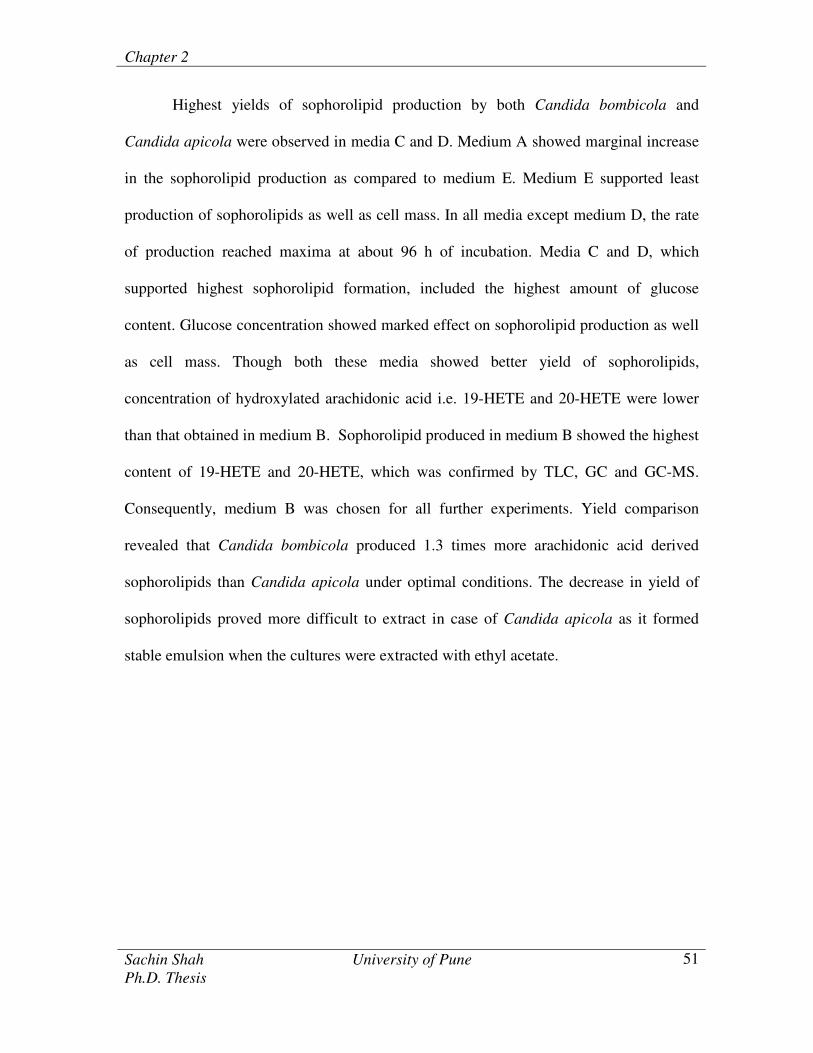
Highest yields of sophorolipid production by both Candida bombicola and
Candida apicola were observed in media C and D. Medium A showed marginal increase
in the sophorolipid production as compared to medium E. Medium E supported least
production of sophorolipids as well as cell mass. In all media except medium D, the rate
of production reached maxima at about 96 h of incubation. Media C and D, which
supported highest sophorolipid formation, included the highest amount of glucose
content. Glucose concentration showed marked effect on sophorolipid production as well
as cell mass. Though both these media showed better yield of sophorolipids,
concentration of hydroxylated arachidonic acid i.e. 19-HETE and 20-HETE were lower
than that obtained in medium B. Sophorolipid produced in medium B showed the highest
content of 19-HETE and 20-HETE, which was confirmed by TLC, GC and GC-MS.
Consequently, medium B was chosen for all further experiments. Yield comparison
revealed that Candida bombicola produced 1.3 times more arachidonic acid derived
sophorolipids than Candida apicola under optimal conditions. The decrease in yield of
sophorolipids proved more difficult to extract in case of Candida apicola as it formed
stable emulsion when the cultures were extracted with ethyl acetate.
Chapter 2
Sachin Shah University of Pune
Ph.D. Thesis
52
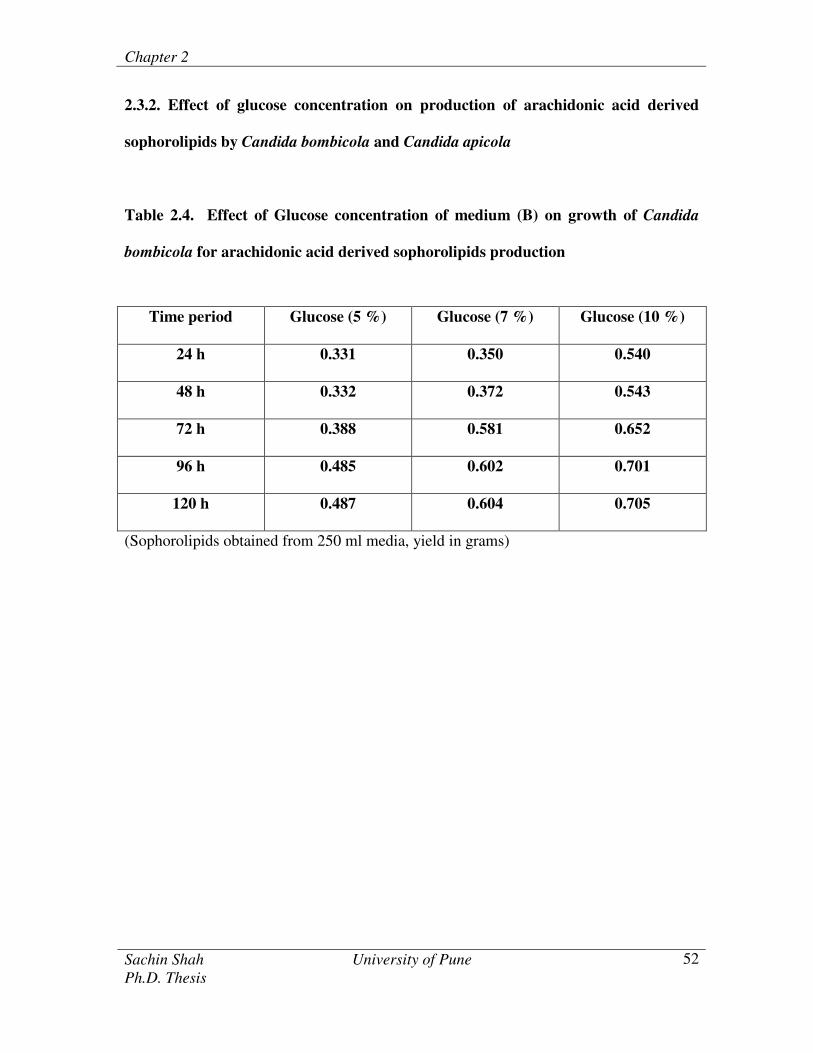
2.3.2. Effect of glucose concentration on production of arachidonic acid derived
sophorolipids by Candida bombicola and Candida apicola
Table 2.4. Effect of Glucose concentration of medium (B) on growth of Candida
bombicola for arachidonic acid derived sophorolipids production
Time period Glucose (5 %) Glucose (7 %) Glucose (10 %)
24 h 0.331 0.350 0.540
48 h 0.332 0.372 0.543
72 h 0.388 0.581 0.652
96 h 0.485 0.602 0.701
120 h 0.487 0.604 0.705
(Sophorolipids obtained from 250 ml media, yield in grams)
Chapter 2
Sachin Shah University of Pune
Ph.D. Thesis
53
0.3
0.4
0.5
0.6
0.7
0.8
0 24 48 72 96 120 144
Time (h)
SL
(g
m)
5% G 7% G 10% G
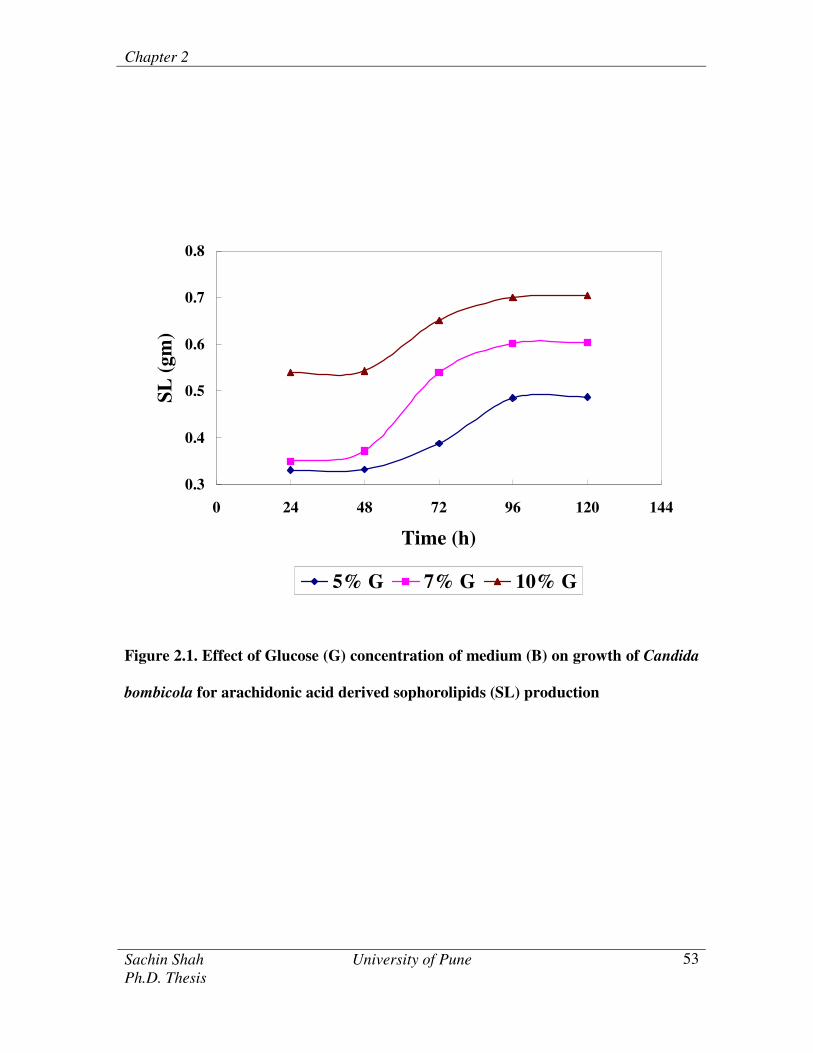
Figure 2.1. Effect of Glucose (G) concentration of medium (B) on growth of Candida
bombicola for arachidonic acid derived sophorolipids (SL) production
Chapter 2
Sachin Shah University of Pune
Ph.D. Thesis
54
0
0.1
0.2
0.3
0.4
0.5
0.6
0.7
0 24 48 72 96 120 144
Time (h)
SL
(g
m)
5% G 7% G 10% G
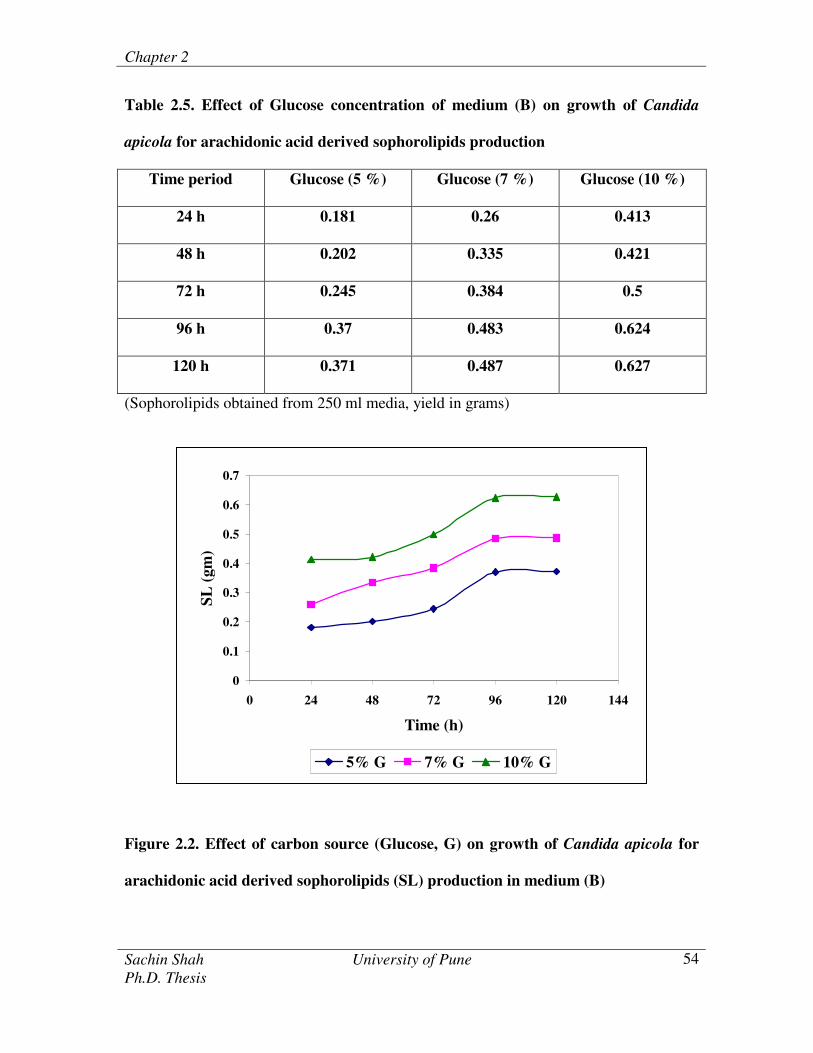
Table 2.5. Effect of Glucose concentration of medium (B) on growth of Candida
apicola for arachidonic acid derived sophorolipids production
Time period Glucose (5 %) Glucose (7 %) Glucose (10 %)
24 h 0.181 0.26 0.413
48 h 0.202 0.335 0.421
72 h 0.245 0.384 0.5
96 h 0.37 0.483 0.624
120 h 0.371 0.487 0.627
(Sophorolipids obtained from 250 ml media, yield in grams)
Figure 2.2. Effect of carbon source (Glucose, G) on growth of Candida apicola for
arachidonic acid derived sophorolipids (SL) production in medium (B)
Chapter 2
Sachin Shah University of Pune
Ph.D. Thesis
55
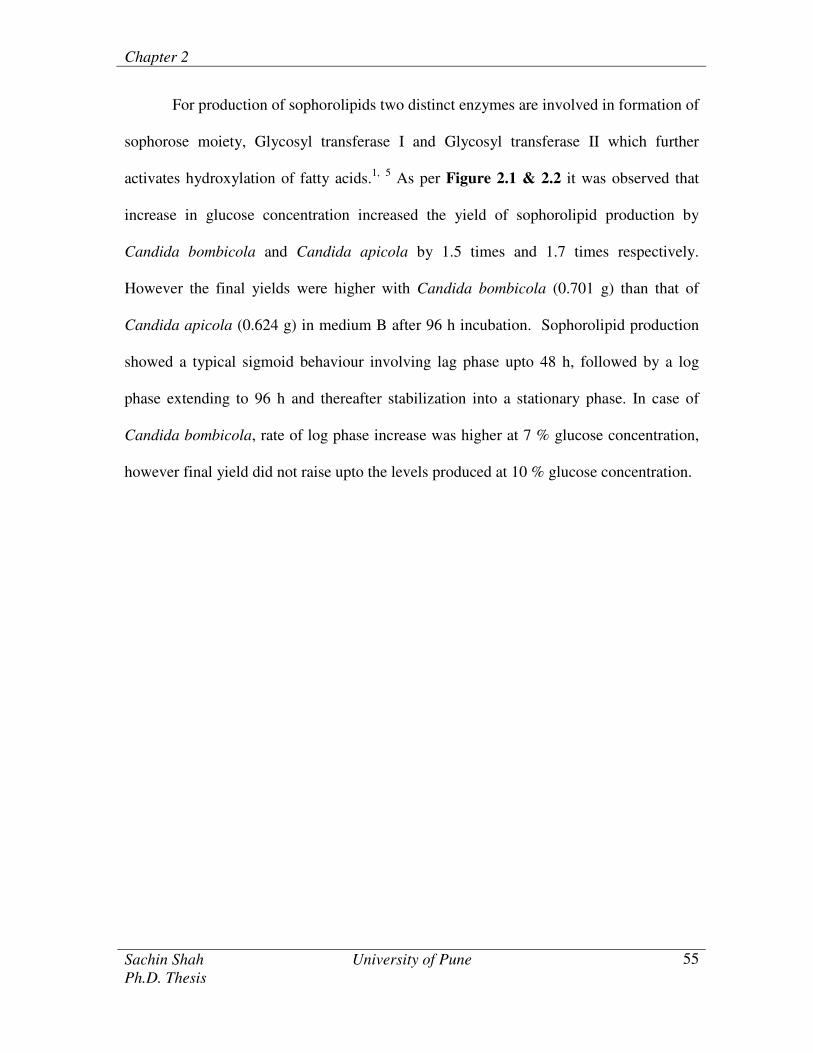
For production of sophorolipids two distinct enzymes are involved in formation of
sophorose moiety, Glycosyl transferase I and Glycosyl transferase II which further
activates hydroxylation of fatty acids.1,
5 As per Figure 2.1 & 2.2 it was observed that
increase in glucose concentration increased the yield of sophorolipid production by
Candida bombicola and Candida apicola by 1.5 times and 1.7 times respectively.
However the final yields were higher with Candida bombicola (0.701 g) than that of
Candida apicola (0.624 g) in medium B after 96 h incubation. Sophorolipid production
showed a typical sigmoid behaviour involving lag phase upto 48 h, followed by a log
phase extending to 96 h and thereafter stabilization into a stationary phase. In case of
Candida bombicola, rate of log phase increase was higher at 7 % glucose concentration,
however final yield did not raise upto the levels produced at 10 % glucose concentration.
Chapter 2
Sachin Shah University of Pune
Ph.D. Thesis
56
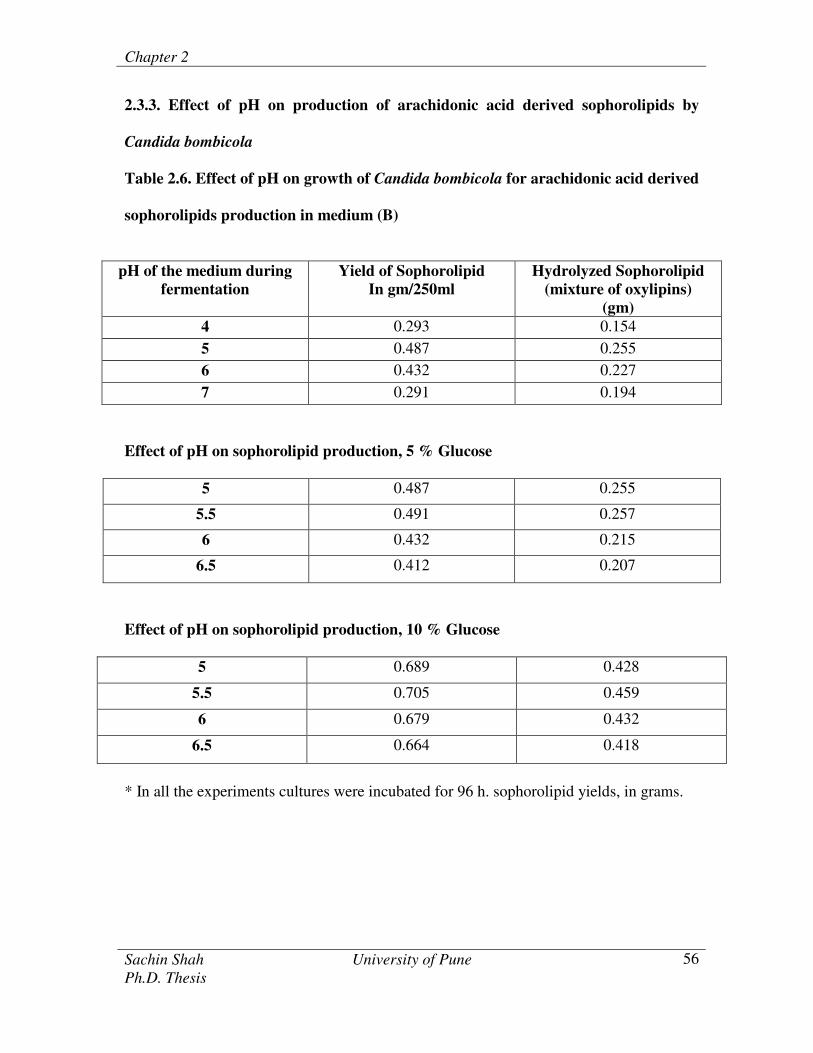
2.3.3. Effect of pH on production of arachidonic acid derived sophorolipids by
Candida bombicola
Table 2.6. Effect of pH on growth of Candida bombicola for arachidonic acid derived
sophorolipids production in medium (B)
pH of the medium during
fermentation
Yield of Sophorolipid
In gm/250ml
Hydrolyzed Sophorolipid
(mixture of oxylipins)
(gm)
4 0.293 0.154
5 0.487 0.255
6 0.432 0.227
7 0.291 0.194
Effect of pH on sophorolipid production, 5 % Glucose
5 0.487 0.255
5.5 0.491 0.257
6 0.432 0.215
6.5 0.412 0.207
Effect of pH on sophorolipid production, 10 % Glucose
5 0.689 0.428
5.5 0.705 0.459
6 0.679 0.432
6.5 0.664 0.418
* In all the experiments cultures were incubated for 96 h. sophorolipid yields, in grams.
Chapter 2
Sachin Shah University of Pune
Ph.D. Thesis
57
0.4
0.45
0.5
0.55
0.6
0.65
0.7
0.75
4.5 5 5.5 6 6.5 7
pH
SL
(gm
)
0.2
0.25
0.3
0.35
0.4
0.45
0.5
Hyd
roly
sed
SL
(gm
)
SL (5% G) SL (10% G) HySL (5% G) HySL (10% G)
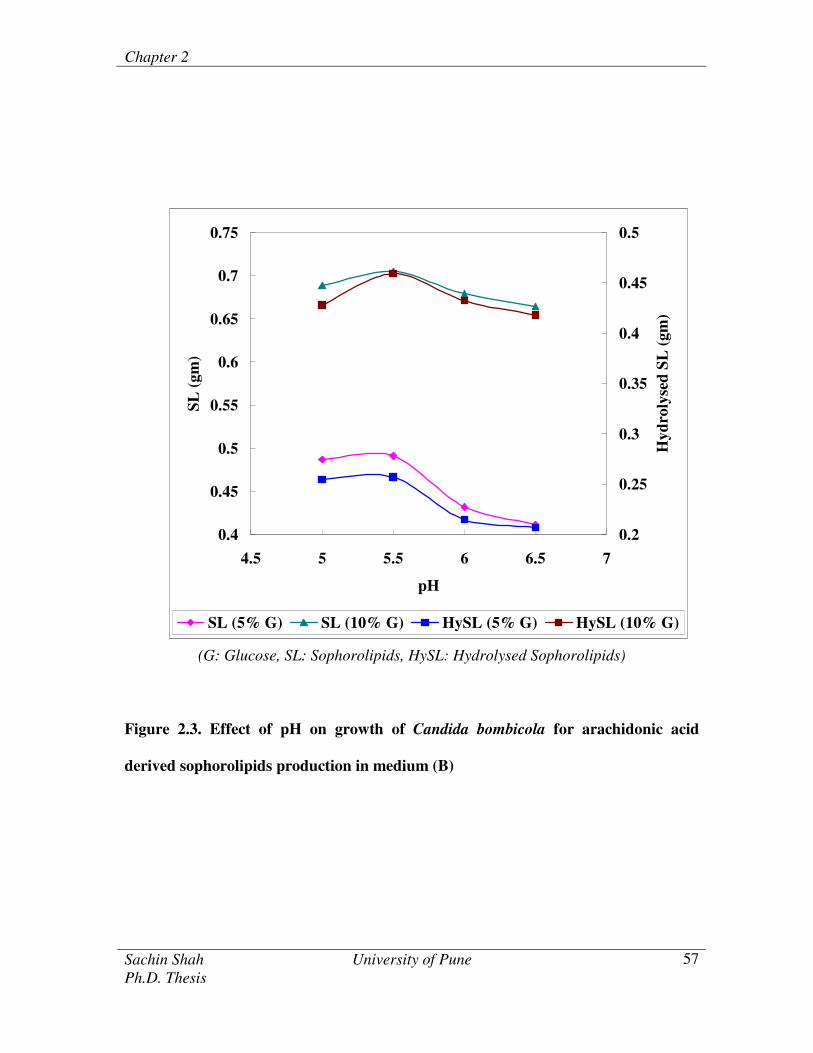
(G: Glucose, SL: Sophorolipids, HySL: Hydrolysed Sophorolipids)
Figure 2.3. Effect of pH on growth of Candida bombicola for arachidonic acid
derived sophorolipids production in medium (B)

Chapter 2
Sachin Shah University of Pune
Ph.D. Thesis
58
2.3.3.1. Effect of pH on growth of Candida apicola for arachidonic acid derived
sophorolipid production
Table 2.7. Effect of pH on growth of Candida apicola for arachidonic acid derived
sophorolipids production in medium B
pH of the medium during
fermentation
Yield of Sophorolipid
In mg /250 ml
Hydrolyzed Sophorolipid
(mixture of oxylipins)
gm
4 0.273 0.149
5 0.402 0.170
6 0.455 0.205
7 0.275 0.140
Effect of pH on sophorolipid production, 5% Glucose
5 0.402 0.170
5.5 0.468 0.247
6 0.455 0.205
6.5 0.415 0.198
Effect of pH on sophorolipid production, 10 % Glucose
5 0.583 0.348
5.5 0.626 0.396
6 0.568 0.345
6.5 0.538 0.332
* In all the experiments cultures were incubated for 96 h. sophorolipid yield in grams.
Chapter 2
Sachin Shah University of Pune
Ph.D. Thesis
59
0.35
0.37
0.39
0.41
0.43
0.45
0.47
0.49
4.5 5 5.5 6 6.5 7
pH
SL
(gm
)
0.16
0.18
0.2
0.22
0.24
0.26
0.28
Hyd
roly
sed
SL
(gm
)
SL (5% G) SL (10% G) HySL (5% G) HySL (10% G)
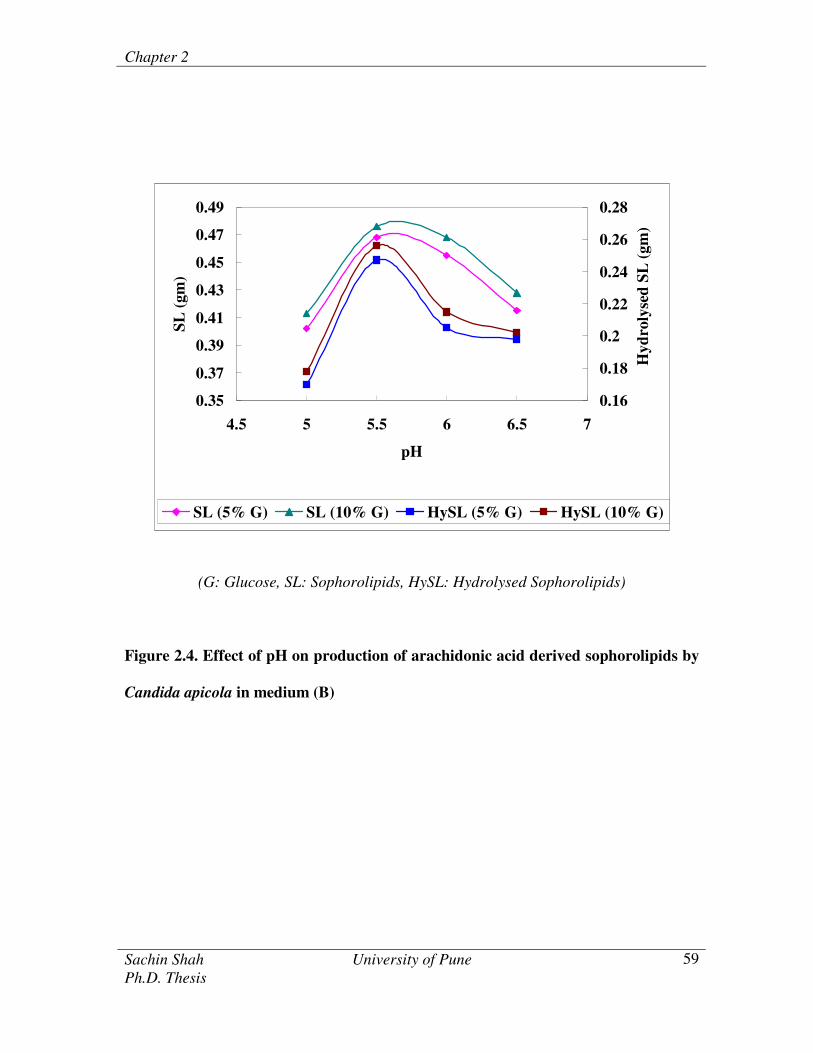
(G: Glucose, SL: Sophorolipids, HySL: Hydrolysed Sophorolipids)
Figure 2.4. Effect of pH on production of arachidonic acid derived sophorolipids by
Candida apicola in medium (B)
Chapter 2
Sachin Shah University of Pune
Ph.D. Thesis
60
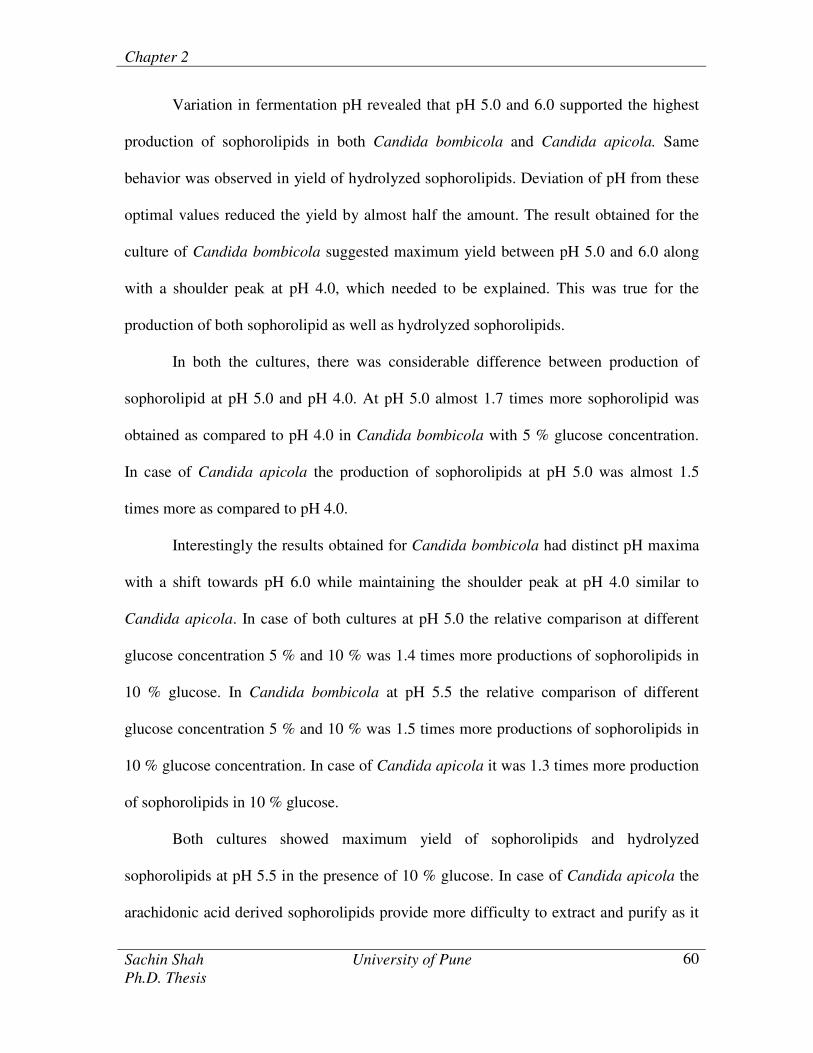
Variation in fermentation pH revealed that pH 5.0 and 6.0 supported the highest
production of sophorolipids in both Candida bombicola and Candida apicola. Same
behavior was observed in yield of hydrolyzed sophorolipids. Deviation of pH from these
optimal values reduced the yield by almost half the amount. The result obtained for the
culture of Candida bombicola suggested maximum yield between pH 5.0 and 6.0 along
with a shoulder peak at pH 4.0, which needed to be explained. This was true for the
production of both sophorolipid as well as hydrolyzed sophorolipids.
In both the cultures, there was considerable difference between production of
sophorolipid at pH 5.0 and pH 4.0. At pH 5.0 almost 1.7 times more sophorolipid was
obtained as compared to pH 4.0 in Candida bombicola with 5 % glucose concentration.
In case of Candida apicola the production of sophorolipids at pH 5.0 was almost 1.5
times more as compared to pH 4.0.
Interestingly the results obtained for Candida bombicola had distinct pH maxima
with a shift towards pH 6.0 while maintaining the shoulder peak at pH 4.0 similar to
Candida apicola. In case of both cultures at pH 5.0 the relative comparison at different
glucose concentration 5 % and 10 % was 1.4 times more productions of sophorolipids in
10 % glucose. In Candida bombicola at pH 5.5 the relative comparison of different
glucose concentration 5 % and 10 % was 1.5 times more productions of sophorolipids in
10 % glucose concentration. In case of Candida apicola it was 1.3 times more production
of sophorolipids in 10 % glucose.
Both cultures showed maximum yield of sophorolipids and hydrolyzed
sophorolipids at pH 5.5 in the presence of 10 % glucose. In case of Candida apicola the
arachidonic acid derived sophorolipids provide more difficulty to extract and purify as it

Chapter 2
Sachin Shah University of Pune
Ph.D. Thesis
61
formed stable emulsion when the cultures were extracted with ethyl acetate. Further work
was therefore conducted with only Candida bombicola.
2.3.4. Effect of temperature on production of arachidonic acid derived sophorolipids
by Candida bombicola and Candida apicola
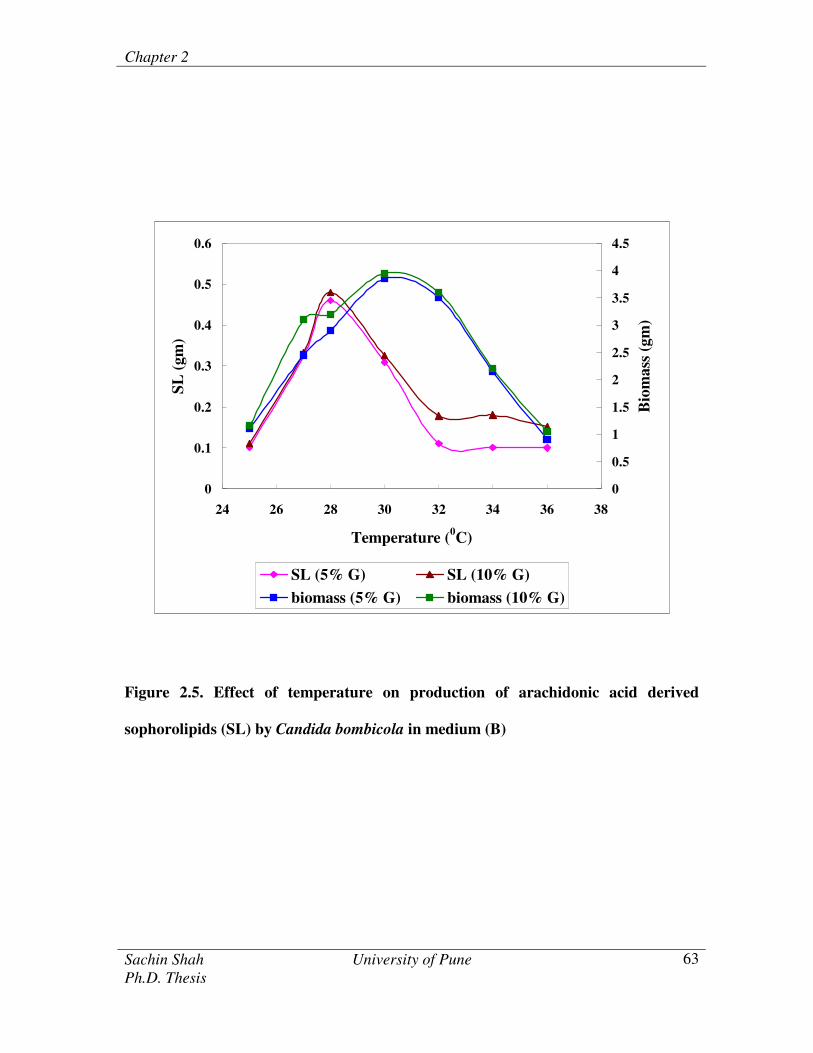
Here we have examined the biomass and sophorolipid production at distinct
temperatures ranging from 25 ºC to 36 ºC. This experiment was done in parallel in two
conditions with 5 % and 10 % of glucose concentrations. Investigations with Candida
bombicola have shown maximum biomass at temperature 30 ºC whereas the maximum
yield of sophorolipid was obtained at 28 ºC. This point should be noted that almost
similar biomass at temp 28 ºC was observed when 10 % of glucose was used in media.
Although the biomass kept on increasing even after temp 28 ºC till 30 ºC, the
sophorolipid production declined significantly. The double concentration of glucose
helped in higher production of sophorolipids at all the levels.
Chapter 2
Sachin Shah University of Pune
Ph.D. Thesis
62
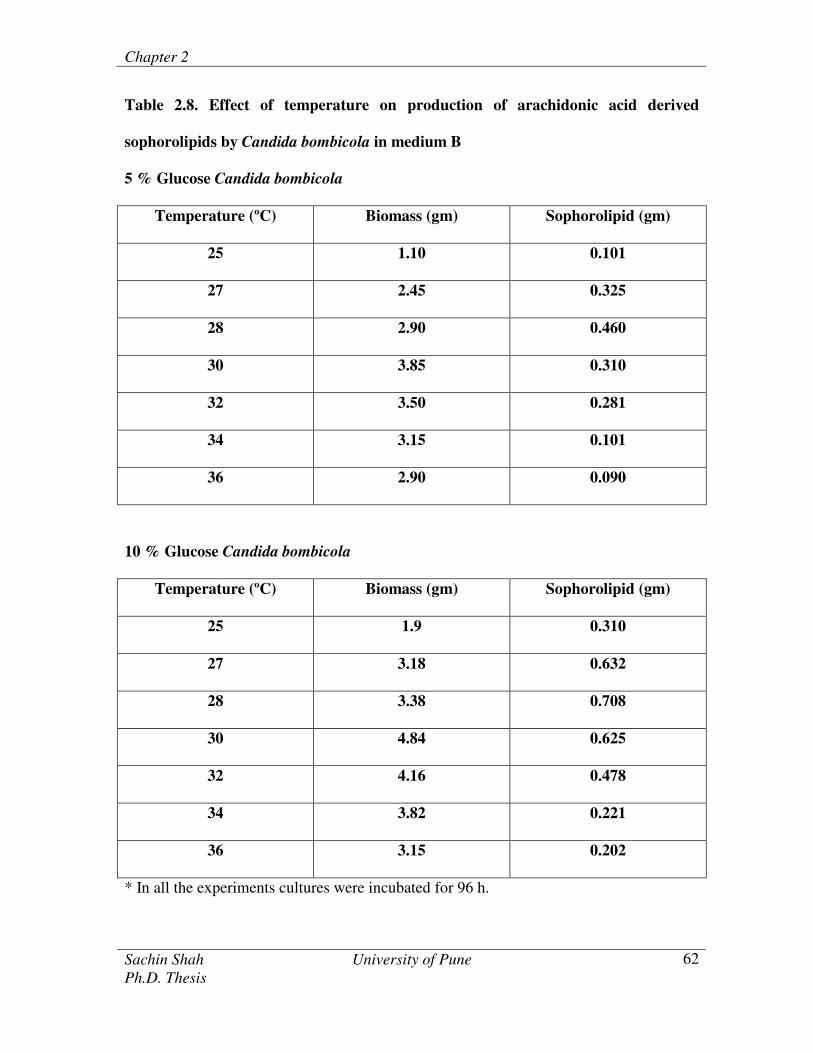
Table 2.8. Effect of temperature on production of arachidonic acid derived
sophorolipids by Candida bombicola in medium B
5 % Glucose Candida bombicola
Temperature (ºC) Biomass (gm) Sophorolipid (gm)
25 1.10 0.101
27 2.45 0.325
28 2.90 0.460
30 3.85 0.310
32 3.50 0.281
34 3.15 0.101
36 2.90 0.090
10 % Glucose Candida bombicola
Temperature (ºC) Biomass (gm) Sophorolipid (gm)
25 1.9 0.310
27 3.18 0.632
28 3.38 0.708
30 4.84 0.625
32 4.16 0.478
34 3.82 0.221
36 3.15 0.202
* In all the experiments cultures were incubated for 96 h.
Chapter 2
Sachin Shah University of Pune
Ph.D. Thesis
63
0
0.1
0.2
0.3
0.4
0.5
0.6
24 26 28 30 32 34 36 38
Temperature (0C)
SL
(gm
)
0
0.5
1
1.5
2
2.5
3
3.5
4
4.5
Bio
mass
(gm
)
SL (5% G) SL (10% G)
biomass (5% G) biomass (10% G)
Figure 2.5. Effect of temperature on production of arachidonic acid derived
sophorolipids (SL) by Candida bombicola in medium (B)
Chapter 2
Sachin Shah University of Pune
Ph.D. Thesis
64
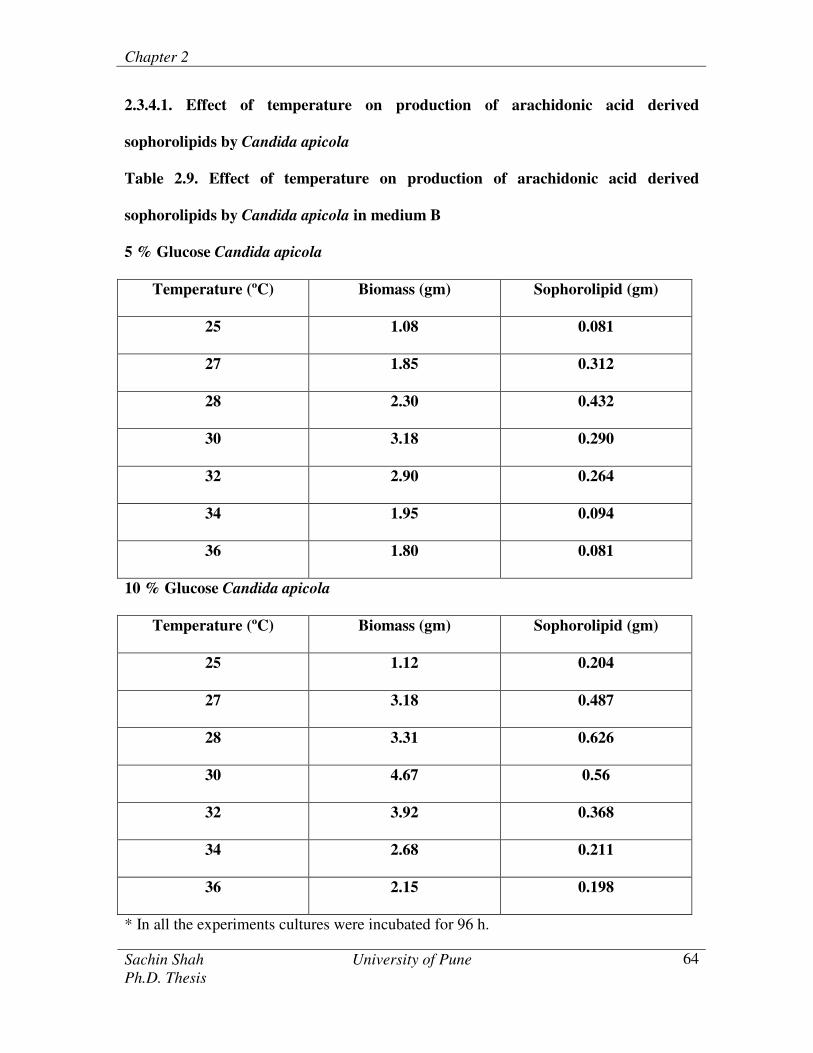
2.3.4.1. Effect of temperature on production of arachidonic acid derived
sophorolipids by Candida apicola
Table 2.9. Effect of temperature on production of arachidonic acid derived
sophorolipids by Candida apicola in medium B
5 % Glucose Candida apicola
Temperature (ºC) Biomass (gm) Sophorolipid (gm)
25 1.08 0.081
27 1.85 0.312
28 2.30 0.432
30 3.18 0.290
32 2.90 0.264
34 1.95 0.094
36 1.80 0.081
10 % Glucose Candida apicola
Temperature (ºC) Biomass (gm) Sophorolipid (gm)
25 1.12 0.204
27 3.18 0.487
28 3.31 0.626
30 4.67 0.56
32 3.92 0.368
34 2.68 0.211
36 2.15 0.198
* In all the experiments cultures were incubated for 96 h.
Chapter 2
Sachin Shah University of Pune
Ph.D. Thesis
65
0
0.05
0.1
0.15
0.2
0.25
0.3
0.35
0.4
0.45
0.5
24 26 28 30 32 34 36 38
Temperature (0C)
SL
(gm
)
0
0.5
1
1.5
2
2.5
3
3.5
4
Bio
mass
(gm
)
SL (5% G) SL (10% G)
biomass (5% G) biomass (10% G)
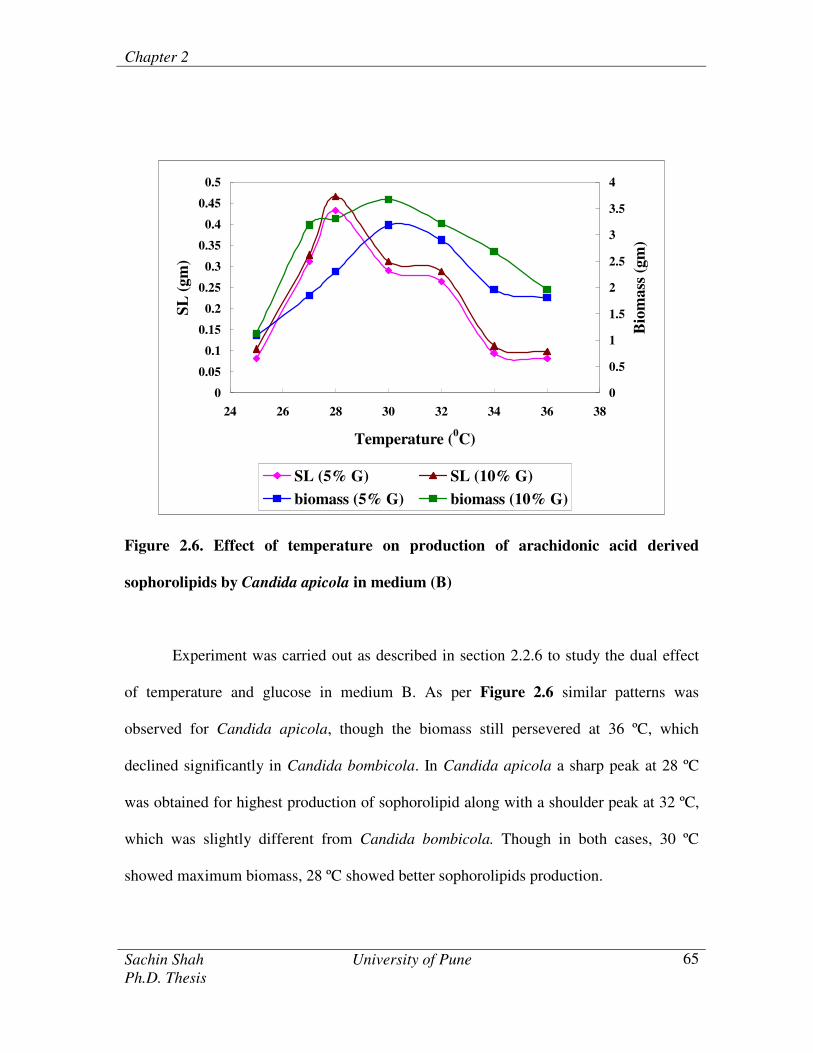
Figure 2.6. Effect of temperature on production of arachidonic acid derived
sophorolipids by Candida apicola in medium (B)
Experiment was carried out as described in section 2.2.6 to study the dual effect
of temperature and glucose in medium B. As per Figure 2.6 similar patterns was
observed for Candida apicola, though the biomass still persevered at 36 ºC, which
declined significantly in Candida bombicola. In Candida apicola a sharp peak at 28 ºC
was obtained for highest production of sophorolipid along with a shoulder peak at 32 ºC,
which was slightly different from Candida bombicola. Though in both cases, 30 ºC
showed maximum biomass, 28 ºC showed better sophorolipids production.
Chapter 2
Sachin Shah University of Pune
Ph.D. Thesis
66
0.46
0.464
0.468
0.472
0.476
0 5 10 15 20 25 30 35
Fe+3
Conc (mM)
SL
(gm
)
0
1
2
3
4
5
6
Bio
mass
(gm
)
SL Biomass
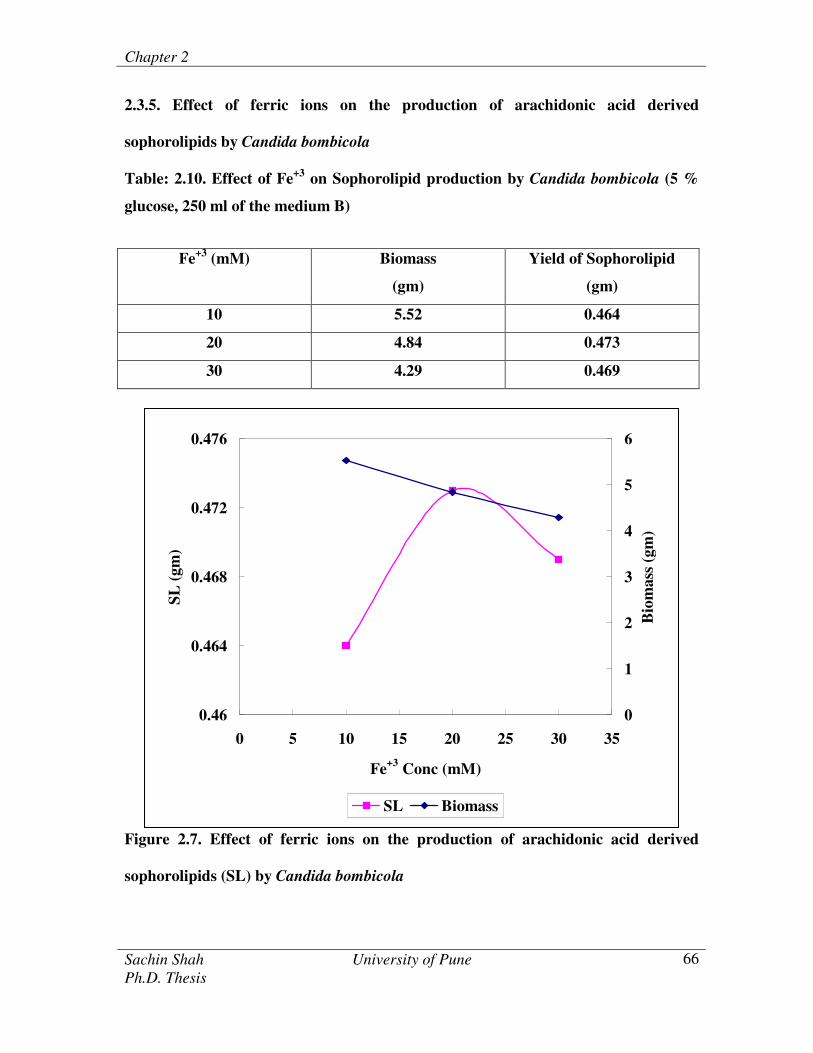
2.3.5. Effect of ferric ions on the production of arachidonic acid derived
sophorolipids by Candida bombicola
Table: 2.10. Effect of Fe+3
on Sophorolipid production by Candida bombicola (5 %
glucose, 250 ml of the medium B)
Figure 2.7. Effect of ferric ions on the production of arachidonic acid derived
sophorolipids (SL) by Candida bombicola
Fe+3
(mM) Biomass
(gm)
Yield of Sophorolipid
(gm)
10 5.52 0.464
20 4.84 0.473
30 4.29 0.469
Chapter 2
Sachin Shah University of Pune
Ph.D. Thesis
67
0.436
0.44
0.444
0.448
0.452
0.456
0.46
0.464
0 10 20 30 40
Fe +3
Conc. (mM)
SL
(gm
)
0
1
2
3
4
5
6
Bio
mass
(gm
)
SL Biomass
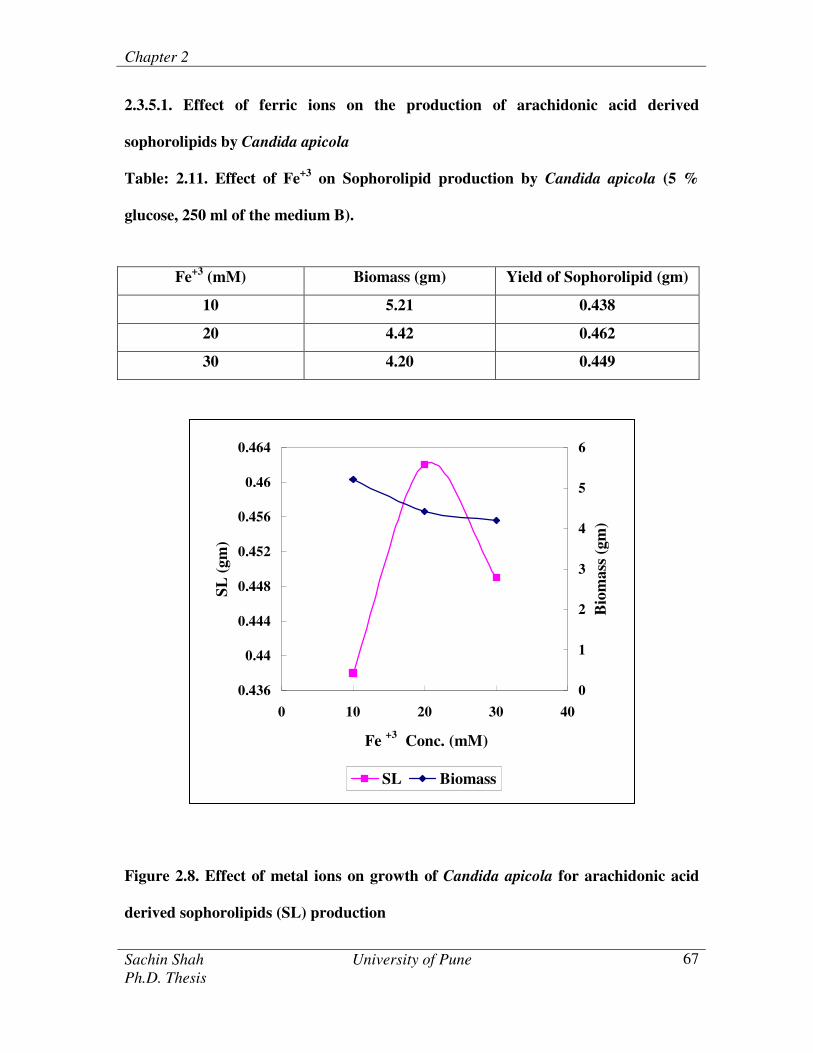
2.3.5.1. Effect of ferric ions on the production of arachidonic acid derived
sophorolipids by Candida apicola
Table: 2.11. Effect of Fe+3
on Sophorolipid production by Candida apicola (5 %
glucose, 250 ml of the medium B).
Figure 2.8. Effect of metal ions on growth of Candida apicola for arachidonic acid
derived sophorolipids (SL) production
Fe+3
(mM) Biomass (gm) Yield of Sophorolipid (gm)
10 5.21 0.438
20 4.42 0.462
30 4.20 0.449
Chapter 2
Sachin Shah University of Pune
Ph.D. Thesis
68
As described in Chapter 1, arachidonic acid derivatives are implicated in a
number of physiological processes. Arachidonic acid is converted into its oxygenated
form especially oxylipins, through cytochrome P450 pathway. Since cytochrome P450
are heme containing enzymes, effect of Fe was checked on efficiency of the reaction and
overall conversion.
In case of Candida bombicola, 20 mM concentration of Fe+3
in the form of ferric
chloride (FeCl3) showed maximum yield of sophorolipids with increased biomass as
compared to the cells where Fe was not supplemented. Candida bombicola showed better
yield in sophorolipid production than Candida apicola. It was observed that in both the
cultures, on addition of Fe+2
in the form of Ferrous sulphate (Fe2SO4), no significant
increase was observed in sophorolipid as well as biomass. Though Fe increased the
sophorolipid levels in both the cultures, hydrolyzed product showed no significant
increase in oxylipins hence was not used for further work. Additionally, Fe (FeCl3)
showed formation of emulsions in Candida bombicola, which was not observed when
grown without Fe.
2.4. Conclusion
The media used in the present studies included complex organic sources of carbon
and nitrogen, such as yeast extract, beef extract in various combinations and levels in
addition to glucose and arachidonic acid. Sophorolipid production on the five test media
has been shown in Table 2.1. In five test media, medium B showed significant biomass
and highest activity of oxylipins were almost similar in Candida bombicola and Candida
apicola. Concentration of glucose affected the biomass as well as sophorolipid
production in both yeast species. Highest activity was obtained in medium B with 10 %
Chapter 2
Sachin Shah University of Pune
Ph.D. Thesis
69
glucose concentration at pH 5.5 for 96 h incubation at 28 ºC, on the basis of arachidonic
acid derived sophorolipid, biomass and liberated 19-HETE and 20-HETE, which was in
the ratio of 3: 1. In case of Candida apicola the arachidonic acid derived sophorolipids
provided more difficulty to extract and purify as it formed stable emulsion when the
culture broth was extracted with ethyl acetate. Further work was therefore conducted with
only Candida bombicola.
Chapter 2
Sachin Shah University of Pune
Ph.D. Thesis
70
Characterization techniques
The different experimental techniques used during the course of the present work are
discussed in this chapter.
Chapter 2
Sachin Shah University of Pune
Ph.D. Thesis
71
2.5. Characterization techniques
This part of the chapter presents the different techniques that have been used to
characterize the biotransformation reaction of arachidonic acid to 19-HETE and 20-
HETE. A number of characterizations have been done for different biocompatible
materials and Candida bombicola cell immobilization on thermally evaporated fatty
acid/amine lipid films and on the surface modified gold nanoparticle polymeric
membrane.
Various characterization techniques such as Thin layer chromatography, Gas
Chromatography (GC) and Gas Chromatography / Mass Spectrometry (GC-MS), UV-
visible spectroscopy, Fourier Transform Infrared Spectroscopy (FTIR), Quartz crystal
microgravimetry (QCM), Scanning Electron Microscopy (SEM), Atomic Force
microscopy (AFM), Transmission Electron Microscopy (TEM), X-ray diffraction,
Contact angle measurements and Biocatalytic activity measurements have been used to
characterize these biocompatible material and biotransformation of arachidonic acid to
19-HETE and 20-HETE.
2.5.1. Thin layer chromatography (TLC)
This is probably the only separative analytical technique that has been most
extensively used. It is also the quickest, simplest and cheapest of the various analytical
techniques. However, the resolution is not as good in the case of HPLC and GC. Silica
gel is the preferred adsorbent for the thin-layer chromatography for arachidonic acid,
arachidonic acid derived product, sophorolipids and monohydroxy arachidonic acid
compounds, 19-hydroxyeicosatetraenoic acid and 20-hydroxyeicosatetraenoic acid.
Commercially available standard silica gel coated on aluminum plates (Merck,
Chapter 2
Sachin Shah University of Pune
Ph.D. Thesis
72
Darmstadt, Germany; silica layer thickness 2 mm) is used for TLC. Glass micro-capillary
is used for spot-application of samples. Rf values are frequently cited to confirm the
presence of sophorolipids and their derived products, eicosanoids. The solvent mixture
used to develop thin-layer chromatography plates requires constituents of different polar
and nonpolar solvents for analysis of arachidonic acid derived products. Many solvent
systems have been developed for the separation of the sophorolipids and HETE’s on
silica. Less polar system, such as diethyl ether / petroleum ether / acetic acid (50: 50: 1,
by vol.), diethyl ether / hexane / formic acid (60: 40: 1, by vol.) and methanol /
chloroform (10: 90, by vol.) are used for the compounds like arachidonic acid and the
monohydroxy fatty acids compounds. Different methods are used for the detection of
arachidonic acid and their derived products sophorolipids with various eicosanoids
(HETE’s) on TLC. Ultra visible absorbing compounds can be visualized under detection
at 254 nm and 365 nm UV light. The plates are coated with silica impregnated with the
fluorescent indicator F254 nm. Chemical spray reagent with the different charring
solution like anisaldehyde solution, sulfuric acid / methanol (50: 50 by vol.) can be used.
The simplest of these is staining with iodine vapors. This only works for the compounds
with double bonds and less sensitive for compounds with only one double bond.
2.5.2 Gas Chromatography (GC) and Gas Chromatography / Mass Spectrometry
(GC-MS)
Gas Chromatography (GC) with mass spectrometry (MS) detection is the most
powerful technique for the analysis of eicosanoids. It has the advantages of very high
sensitivity, excellent resolution and that it provides two parameters for characteristic
fragment ions by mass spectrometry. Fragmentation of molecules into characteristic ions
Chapter 2
Sachin Shah University of Pune
Ph.D. Thesis
73
can be used for the identification of compounds. This technique has been widely used for
both, structure elucidation and quantification of very low concentrations of eicosanoids
derived from transformation of arachidonic acid using Candida sp.
In 1919, Aston invented the first mass spectrometer although his apparatus is
known as a mass spectrograph. Mass spectrometers are used to measure the masses of
atoms and molecules with great accuracy.6 They are also capable of detecting remarkably
small amounts of an element or compound in the range 10-6
– 10-12
g. Mass spectrometry
is based on the formation of ions and their separation in a magnetic or electrostatic field.
Charge is prerequisite for analysis. There are two principal types of mass spectrometers
commercially available – magnetic sector and quadrupole (electrostatic) instruments. The
main difference between these mass spectrometers lies in the principles governing the
separation of ions. In quadrupole mass spectrometer, ions are generated in the source
with low energy, which is ejected into the mass analyzer consisting of four symmetrically
positioned rods. Since only ions are mass analyzed, the neutral molecule must be ionized.
Electron impact, chemical, electron capture negative ion chemical and soft ionization are
the techniques of ionization employed. Electron impact ionization is the most commonly
used technique.
In this thesis, the biotransformation of the arachidonic acid to sophorolipids by
using cytochrome P450 enzyme present in the yeast Candida bombicola and Candida
apicola is described. Thereafter, the acid hydrolysis of these sophorolipids yields 19-
hydroxyeicosatetraenoic acid (19-HETE) and 20-hydroxyeicosatetraenoic acid (20-
HETE). The hydroxyl group present at the 19th
and 20th
carbon position are confirmed by
derivatives of 19-HETE and 20-HETE to their respective methyl ester silyl ether of 19-
Chapter 2
Sachin Shah University of Pune
Ph.D. Thesis
74
hydroxy-5Z, 8Z, 11Z, 14Z eicosatetraenoic acid and 20-hydroxy-5Z, 8Z, 11Z, 14Z
eicosatetraenoic acid and thereafter analyzed by mass spectrometer.7, 8
These
measurements were done on Shimadzu GCMS QP 5050 automated quadrupole mass
spectrometer operating in the electron impact mode. GC parameters: column used, BP-5
fused silica column (30 m x 0.25 mm, 0.25 mm, 0.25 mm coatings); He carrier at 14 kPa
head pressure; injector at 250 °C; column initially at 150 °C for 1 min (rate 35 °C/min)
and then increased to 220 °C for 5 min (rate 5 °C/min) and then at 280 °C and then held
at these conditions for 10 min; injection volume, 1 µL. MS parameters: interface
temperature 250 °C, ionization mode electron impact, scan range 70-800 amu (arbitrary
mass units) s-1.
2.5.3. Thermal evaporation of amine lipids
Thermally evaporated amine lipid films have been used for whole cells
immobilization for the transformation of arachidonic to 19-HETE and 20-HETE. In this
thesis, thermally evaporated amine lipid films have been deposited using Edwards E306
coating unit. The coating unit consists of a rotary pump used for backing and roughing
the chamber where deposition is done and can produce a vacuum upto 10-3
Torr. Below
this pressure, oil diffusion pump is employed to produce high vacuum of 10-7
Torr 9 and
the deposition rate was 10 Å /min. Both these pumps are used in conjunction for backing
and roughing of the deposition chamber. A liquid nitrogen trap was also used. Deposition
of organic thin films is done under vacuum. The quality of deposition is better due to the
increased mean free path of a molecule under vacuum as compared to atmosphere,
resulting in a linear trajectory of the thermally evaporated molecule. The melting point of
amine lipids is reduced under vacuum, enabling low current requirements for thermal
Chapter 2
Sachin Shah University of Pune
Ph.D. Thesis
75
evaporation. The amine lipids (amphiphilic molecules) used for deposition, were taken in
a molybdenum boat and subjected to low tension DC of about 20 amps under 10-7
Torr
vacuum and heated. The substrates such as Si (111), glass and quartz were kept at a
suitable distance above the molybdenum boat. The molecules when heated evaporated
and condensed onto these substrates giving nearly same thickness of the uniform films on
each substrate. The rate of deposition and the thickness of the lipid films was monitored
in-situ using Edwards FTM5 quartz crystal microbalance. The films were tested for
stability by using infrared spectroscopy, and it was found that the films did not
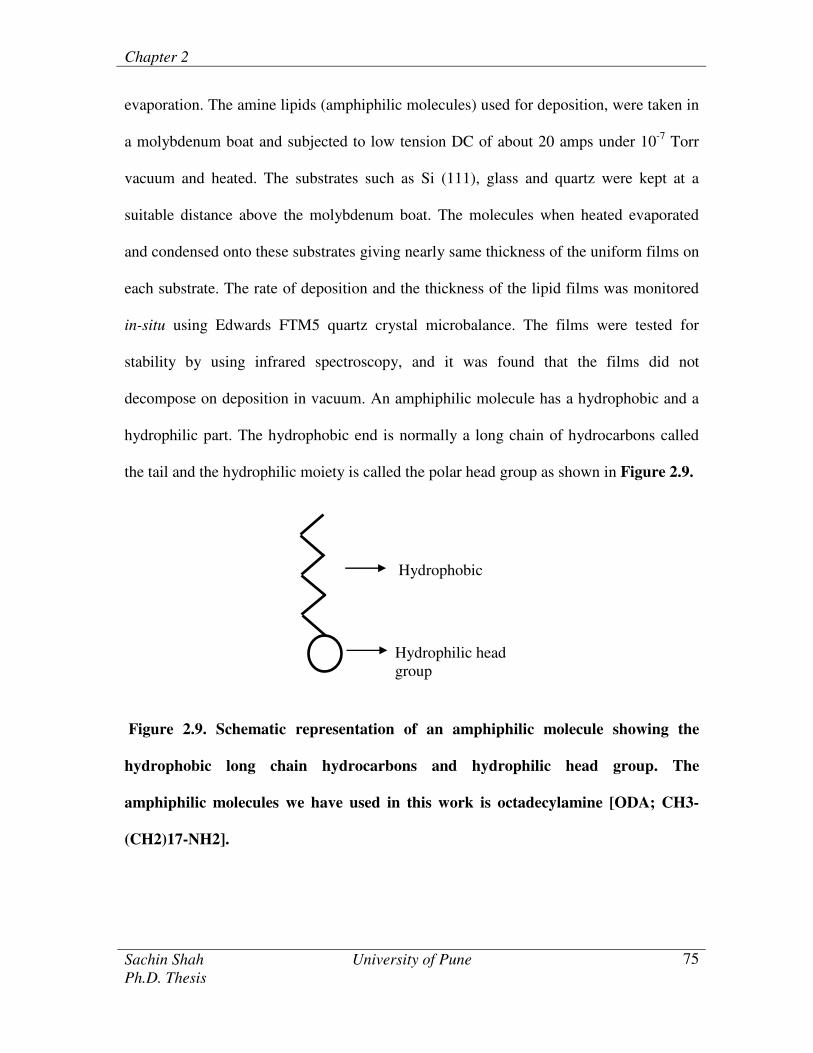
decompose on deposition in vacuum. An amphiphilic molecule has a hydrophobic and a
hydrophilic part. The hydrophobic end is normally a long chain of hydrocarbons called
the tail and the hydrophilic moiety is called the polar head group as shown in Figure 2.9.
Figure 2.9. Schematic representation of an amphiphilic molecule showing the
hydrophobic long chain hydrocarbons and hydrophilic head group. The
amphiphilic molecules we have used in this work is octadecylamine [ODA; CH3-
(CH2)17-NH2].
Hydrophobic
Hydrophilic head
group
Chapter 2
Sachin Shah University of Pune
Ph.D. Thesis
76
2.5.4. Quartz crystal microgravimetry (QCM)
In this thesis, QCM have been used for calculating the amount of entrapped whole
cells within the stacks of lipid bilayers. The knowledge of amount of the immobilized
biocatalyst is important to compare the activity of the immobilized whole cells with the
similar amount of the free cells in solution. In 1880, Jacques and Pieree Curie discovered
that mechanical stress applied to the surfaces of various crystals such as quartz, rochelle
and tourmaline afforded a corresponding electrical potential across the crystal whose
magnitude was proportional to the applied stress.10
This behavior is referred to as the
piezoelectric effect. This property exists only in materials that are acentric that is those
crystallize in noncentrosymmetric space groups. A single crystal of an acentric material
will possess a polar axis due to dipoles associated with the orientation of atoms in the
crystalline lattice. When stress is applied across an appropriate direction, there is a shift
of dipoles resulting from the displacement of atoms. This atomic displacement leads to a
corresponding change in the net dipole moment producing a net change in electrical
charge on the faces of the crystal. The validity of the converse of this effect was also
established wherein application of a voltage across these crystals afforded a
corresponding mechanical strain. This inverse piezoelectric effect is the basis of the
quartz crystal microgravimetry (QCM) technique. AT-cut quartz resonator, in which thin
quartz wafer is prepared by slicing a quartz rod at an angle of 35 degree with respect to
the X-axis of the crystal, resonates in the thickness shear mode.
The work described in this thesis, we have used gold-coated AT-cut 6 MHz quartz
crystal. The frequency counter used was an Edwards FTM5 instrument operating at a
frequency stability and resolution of ± 1 Hz. At this resolution and with the type of quartz
Chapter 2
Sachin Shah University of Pune
Ph.D. Thesis
77
crystal used, the mass resolution would be 12 ng/cm2. The different thicknesses of lipid
films were thermally evaporated on the QCM crystals. These crystals were immersed into
C. bombicola cells suspension for different time intervals and the frequency changes
were measured ex-situ after thorough washing with deionized water and drying in
flowing nitrogen. The frequency changes were converted to a mass uptake by using the
standard Saurbrey formula.11
The "leaching out" of the cells were also studied by QCM
by immersing the enzyme incorporated lipid films in appropriate buffer solution and
measuring the frequency change at different time intervals The work discussed in this
thesis, QCM plays an important role in determining the amount of Candida bombicola
cells entrapped within the stacks of lipid bilayers. The thick ODA films of thickness 250
Å on gold-coated AT-cut quartz crystals were used in this study.
2.5.6. UV-visible spectroscopy (UV-vis)
It deals with the study of electronic transitions between orbital or bands of atoms,
ions or molecules in gaseous, liquid and solid state.12
The work described in this thesis,
UV-Vis spectroscopy was used to monitor the binding of gold nanoparticles embedded in
the polymeric membrane. UV-vis spectra of gold nanoparticle polymeric membrane
transferred on quartz substrate were recorded in transmission mode. These measurements
were done on a JASCO V570 UV/VIS/NIR operated at a resolution of 1 nm.
2.5.7. X-ray diffraction measurements (XRD)
We have used XRD for the determination of gold nanoparticles embedded in the
polymeric membrane was recorded. XRD measurements of as synthesized nanoparticles
and before and after functionalized with octadecylamine were done. These measurements
Chapter 2
Sachin Shah University of Pune
Ph.D. Thesis
78
were done on a Philips PW 1830 instrument operating at 40 kV and a current of 30 mA
with Cu Ká.
2.5.8. Fourier transforms infrared spectroscopy (FT-IR)
Infrared (IR) spectroscopy is a chemical analytical technique, which measures the
infrared intensity versus wavelength (wavenumber) of light. Based upon the
wavenumber, infrared light can be categorized as far infrared (4 ~ 400cm-1
), mid infrared
(400 ~ 4,000cm-1
) and near infrared (4,000 ~ 14,000cm-1
). Infrared spectroscopy detects
the vibration characteristics of chemical functional groups in a sample. When an infrared
light interacts with the matter, chemical bonds will stretch, contract and bend. As a result,
a chemical functional group tends to adsorb infrared radiation in a specific wave number
range regardless of the structure of the rest of the molecule. A Fourier Transform
Infrared (FTIR) spectrometer obtains infrared spectra by first collecting an interferogram
of a sample signal with an interferometer, which measures all of infrared frequencies
simultaneously. An FTIR spectrometer acquires and digitizes the interferogram, performs
the FT function, and outputs the spectrum. The energy required exciting the bonds in a
compound and making them to vibrate more energetically occurs in the infrared region of
the spectrum (ca. 400-4000 cm-1). If we pass a beam of infrared radiations of varying
frequency through a sample then the energy of the beam is absorbed. This happens when
the energy matches the difference between vibrational energy levels belonging to the
bonds.
Peak assignments for fatty lipids used in this thesis are octadecylamine (ODA).
The two bands at 2920 and 2850 cm-1 have been assigned to the unsymmetric and
symmetric methylene (CH2) stretching vibrations respectively and two weak bands at
Chapter 2
Sachin Shah University of Pune
Ph.D. Thesis
79
about 2960 and 2875 cm-1
to the asymmetric/degenerate and symmetric methyl (CH3)
stretching vibrations respectively. The position of the peaks and the increase in intensity
of the methylene stretching vibrations relative to methyl stretching vibration with chain
length indicates structural integrity of the molecule. More interestingly, actual peak
values of the symmetric and unsymmetric CH2 stretching vibrations can be used as a
sensitive indicator of the ordering of the alkyl chains. Typical peaks for the free amine
are seen at 3333 cm-1 of octadecylamine.13
The work described in this thesis, 250 Å thick thermally evaporated amine lipid
films were deposited on a Si (111) wafer. The silicon substrates were used in this study
since they are chemically stable and generally are not reactive. It is excellent for optical
studies of deposited films in the visible region using reflection techniques. It does not
have strong lattice absorption bands in the useful regions of the infrared and thus can be
used for transmission studies in this region. To correct for the lattice absorption bands in
silicon, a reference silicon sample is used as a reference. FTIR measurements of 250 Å
thick amine biocomposite lipid films on Si (111) substrates were carried out ex-situ after
immersion of the films in the aqueous suspension of Candida bombicola cells dispersed
in deionized water. Through washing and drying of the films was done prior to FTIR
measurements. For comparison FTIR measurements of as-deposited amine lipids films
were also recorded. FTIR measurements of gold nanoparticle polymeric membrane
before and after binding with octadecylamine were also recorded by transferring the
membranes on Si (111) substrate. These measurements were done in the diffuse
reflectance mode on a Perkin-Elmer Spectrum One FTIR spectrometer operated at the
resolution of 4 cm-1
.
Chapter 2
Sachin Shah University of Pune
Ph.D. Thesis
80
2.5.9. Scanning electron microscopy (SEM)
Scanning Electron Microscopy is extremely useful for the direct observations of
surfaces because they offer better resolution and depth of field than optical microscope.
The study of SEM in our case is important in order to rule out any surface attachment of
whole cells Candida bombicola on the lipid surface. SEM and EDAX measurements
were also used to confirm the attachment of Candida bombicola on biomaterial surfaces.
Samples for SEM and EDAX measurements were prepared by drop-coating a film on a Si
(111) substrate. SEM and EDAX measurements were also used to confirm the binding of
whole cells to the patterned thermally evaporated fatty lipid films and octadecylamine
bound to gold nanoparticle polymeric membrane. SEM images of whole cells bound to
as-prepared gold nanoparticle polymeric membrane. The Binding of Fe nanoparticles to
Candida bombicola cells and similarly, the attachment of C. bombicola on nanoporous
alumina membrane were also recorded. These measurements were performed on a Leica
Stereoscan-440 scanning electron microscopy (SEM) equipped with a Phoenix EDAX
attachment.
2.5.10. Transmission electron microscopy (TEM)
The work described in this thesis, TEM is used to determine the particle size of
gold nanoparticles embedded in polymeric membrane. Samples for TEM analysis were
prepared by transferring the gold nanoparticle polymeric membrane from the liquid-
liquid interface onto carbon-coated copper TEM grids. TEM micrographs of the gold
nanoparticles leached from the polymeric membrane and only the polymeric membrane
were also recorded. These measurements were performed on a JEOL Model 1200EX
instrument operated at an accelerating voltage of 120 kV. TEM is a method of producing
Chapter 2
Sachin Shah University of Pune
Ph.D. Thesis
81
images of a sample by illuminating the sample with electronic radiation (under vacuum)
and detecting the electrons that are transmitted through the sample.
Chapter 2
Sachin Shah University of Pune
Ph.D. Thesis
82
2.6. References
1. H. J. Asmer, S. Lang, F. Wagner, V. Wray, 1988, Microbial production, structure
elucidation and bioconversion of sophorose lipids. J. Am. Oil Chem. Soc. 65, 1460–
1466.
2. A. P. Tulloch, A. Hill, J. F. T. Spencer, 1968, Structure and reaction of lactonic and
acidic sophorosides of 17-hydroxyoctadecanoic acid. Can. J. Chem. 46, 3337-3351.
3. C. D. Funk, 2001, Prostaglandins and Leukotrienes: Advances in Eicosanoid Biology.
Science 294, 5548, 1871-1875. b. R. J. Roman, 2002, P-450 Metabolites of
Arachidonic Acid in the Control of Cardiovascular Function. Physiol. Rev. 82, 131-
171.
4. A. Prabhune, S. R. Fox, C. Ratledge, 2002, Transformation of arachidonic acid to 19-
hydroxy and 20-hydroxy-eicosatetraenoic acid using Candida bombicola.
Biotechnol. Lett. 24, 1041-1044
5. A. P. J. Gorin, J. F. T. Spenser, A. P. Tulloch, 1961, Hydroxy Fatty acid glycosides of
sophorose from Torulopsis magnoliae. Can. J. Chem. 39, 846-855.
6. J. Roboz, 1968, Introduction to mass spectrometry: Instrumentation and technique,
New York: John Wiley and Sons Inc.
7. A. Prabhune, S. R. Fox, C. Ratledge, 2002, Transformation of arachidonic acid to 19-
hydroxy and 20-hydroxy-eicosatetraenoic acid using Candida bombicola.
Biotechnol. Lett. 24, 1041-1044
8. S. Phadtare, P. Parekh, S. Shah, A. Tambe, R. Joshi, S. R. Sainkar, A. Prabhune, M.
Sastry 2003, Candida bombicola Cells Immobilized on Patterned Lipid Films as
Chapter 2
Sachin Shah University of Pune
Ph.D. Thesis
83
Enzyme Sources for the Transformation of Arachidonic Acid to 20-HETE.
Biotechnol. Prog. 19, 1659-1663.
9. L. I. Maissel, R. Glang, 1970, Handbook of thin film technology, McGraw Hill Book
Company, NewYork.
10. P. Curie, J. C. R. Curie, 1880, Acad. Sci. 91, 294.
11. G. Z Sauerbrey, 1959, Phys. (Munich), 155, 206-222.
12. C. K. Jorgensen, Absorption Spectra and Chemical Bonding in Complexes, 1962,
Pergamon, New York.
13. M. Bardosova, R. H. Tredgold, Z. Ali-Adib, 1995, Langmuir, 11, 1273-1276.