chapter 24
DESCRIPTION
Chapter 24. Two-Way Tables and the Chi-square Test. Thought Question 1. - PowerPoint PPT PresentationTRANSCRIPT

Chapter 24 1
Chapter 24
Two-Way Tables and the
Chi-square Test
Chapter 24 2
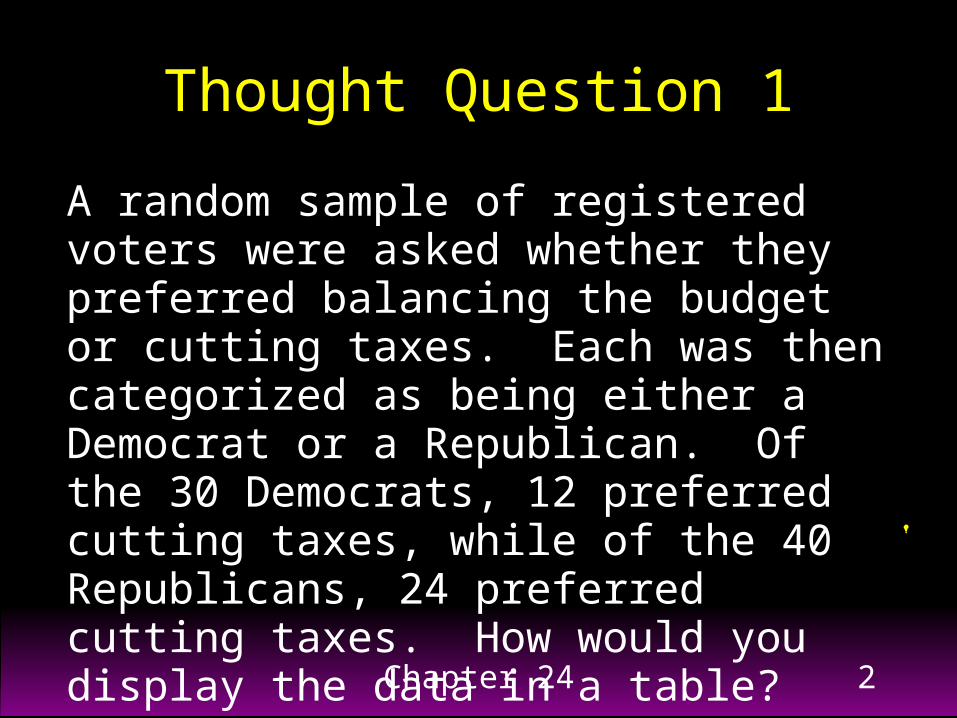
Thought Question 1
A random sample of registered voters were asked whether they preferred balancing the budget or cutting taxes. Each was then categorized as being either a Democrat or a Republican. Of the 30 Democrats, 12 preferred cutting taxes, while of the 40 Republicans, 24 preferred cutting taxes. How would you display the data in a table?

Chapter 24 3
In this chapter we will study the relationship between two categorical variables (variables whose values fall in groups or categories).
To analyze categorical data, use the counts or percents of individuals that fall into various categories.
Categorical Variables

Chapter 24 4
When there are two categorical variables, the data are summarized in a two-way table– each row represents a value of the row variable– each column represents a value of the column variable
The number of observations falling into each combination of categories is entered into each cell of the table– Relationships between categorical variables are
described by calculating appropriate percents from the counts given in the table
prevents misleading comparisons due to unequal sample sizes for different groups
Two-Way Table

Chapter 24 5
Case Study
Statistical Methods for Psychology, 3rd edition, D. C. Howell, 1992, Belmont, CA: Duxbury Press, p. 154.
Helped Pick Up Pencils?Which is More Likely:Females or Males?

Chapter 24 6
Case StudyDrop the Pencils
A handful of pencils were accidentally dropped, so it appeared, by the researcher in an elevator in the presence of either a female subject or a male subject. The subject’s response was observed: did the subject help pick up the pencils or not?

Chapter 24 7
Case StudyThe Question
The question was whether the males or females who observed this mishap would be more likely to help pick up the pencils.
Explanatory variable: gender Response variable: “pick up” action (Y/N)
Categorical Data

Chapter 24 8
Case StudyDisplay the Results: Contingency (Two-Way) Table

Chapter 24 9
Case StudyDisplay the Results: Percentages

Chapter 24 10
Case StudyStatistical Significance
Is the difference between the percentages for males vs. females
statistically significant?One of the following must be true:
Percentages are really the same in population; observed difference is due to chance.
- or -Percentages are really different in population;
observed difference reflects this.

Chapter 24 11
Assessing Statistical Significancefor a Two-Way Table
Strength of the relationship– measured by the difference in the
sample percentages
Much easier to rule out chance with large samples
Chapter 24 12
Measuring the Difference with the Chi-Square Statistic
The Chi-Square statistic measures the magnitude of the difference in the sample percentages, incorporating sample size in its calculation If percentages in the population are the same,
then the Chi-square tends to be small (near 0) If percentages in the population are different,
then the Chi-square tends to be large

Chapter 24 13
Make the Decision:Is the relationship statistically significant? “Critical value” for 22 tables = 3.84 If the chi-square value (for 22 tables) is
larger than 3.84, then the relationship is considered to be statistically significant.
Note: Z = square root of the chi-square.(for 22 tables)
Critical value 3.84 is (1.96)2 [ (~2)2 ]*Note that the procedure given here is specifically for 22 tables (2 rows and 2 columns); the general procedure for any two-way table (with any number of rows and columns) is given later in this chapter (see slide 32)

Chapter 24 14
Case StudyStatistical Significance
Is the difference between the percentages for males vs. females
statistically significant?• Chi-square statistic = 8.65
• Since our chi-square is 8.65 > 3.84, we conclude there is a statistically significant relationship between gender and helping to pick up the pencils.

Chapter 24 15
Agenda Party Taxes Budget Total Democrat %
12 40%
18 60%
30 100%
Republican %
24 60%
16 40%
40 100%
Total %
36 51%
34 49%
70 100%
Case Study Thought Question 1
Agenda versus Political Party
Chi-square = 2.75 (significant?)

Chapter 24 16
Case Study
Quitting Smoking with Nicotine Patches(JAMA, Feb. 23, 1994, pp. 595-600)
Two Categorical Variables:– Explanatory: Treatment assignment
Nicotine patch Control patch
– Response: Still smoking after 8 weeks? Yes No

Chapter 24 17
Smoking after 8 weeks? Patch Yes No Total Nicotine 64
53.3% 56
46.7% 120
100%
Placebo 96 80%
24 20%
120 100%
Total 160 66.7%
80 33.3%
240 100%
Case StudyDisplay the Results: Contingency (Two-Way) Table

Chapter 24 18
Case StudyStatistically Significant Relationship?
Chi-square = 19.2 There is a statistically significant
relationship between the type of patch used and the cessation of smoking for at least 8 weeks.

Chapter 24 19
Case StudyPopular Ad: Seldane-D Allergy Tablets
Double-blind study of side effects– Seldane-D: 374 subjects
27 (7.2%) reporteddrowsiness
347 did not
– Placebo: 193 subjects 22 (11.4%) reported
drowsiness 171 did not
Time, 27 March 1995, p. 18

Chapter 24 20
Case StudySummaries
Chi-square = 2.58 Baseline risk of drowsiness using placebo =
11.4% Risk of drowsiness using Seldane-D= 7.2% Relative risk of drowsiness using Seldane-D
versus placebo = 0.63

Chapter 24 21
Case StudyConclusion
Randomized, controlled experiment Statistically insignificant relationship
between use of Seldane-D allergy tablets and presence of drowsiness.
Evidence does not support that Seldane-D causes drowsiness in some people.

Chapter 24 22
A Caution About Sample Size, Statistical Significance, and
Chi-Square The effect of sample size on the chi-
square statistic when the table percentages stay the same:
For example, if n=850 (instead of 567) and all percentages remain the same, then the chi-square would be 3.87 (instead of 2.58); would the conclusion change?
demo
Chapter 24 23
Inference for Relative Risk
Confidence Intervals– if two risks are the same, the relative risk is 1– see if confidence interval contains 1
Hypothesis Tests– to test if two individual risks are equal, test to
see if the relative risk is 1– use the chi-square value to find the P-value

Chapter 24 24
Relationship between breast cancer and induced abortion
Case Study
Daling, et. al., (1994) “Risk of breast cancer among young women: relationship to induced abortion.” Journal of the
National Cancer Institute, Vol. 86, No. 21, pp. 1584-1592.
Is the risk of breast cancer among women who have had an induced
abortion different from the risk among those who have not?
Chapter 24 25
Relationship between breast cancer and induced abortion
Case Study: Sample
845 breast cancer cases were identified in Washington State from 1983 to 1990.
910 control women were identified using random-digit dialing in the same area.
Women born prior to 1944 were excluded.

Chapter 24 26
Relationship between breast cancer and induced abortion
Case Study: C.I. Results
The relative risk for breast cancer was 1.5, with the higher risk for women who had an induced abortion.
A 95% confidence interval for the relative risk was 1.2 to 1.9. (given)
Note the confidence interval does not contain the value one ( risks are different)

Chapter 24 27
Relationship between breast cancer and induced abortion
Case Study: C.I. Results
No increased risk was found for women who had spontaneous abortions; the relative risk was 0.9.
A 95% confidence interval for the relative risk was 0.7 to 1.2. (given)
Note the confidence interval does contain the value one ( risks are not different)

Chapter 24 28
Relationship between breast cancer and induced abortion
Case Study (continued)
Daling, et. al., (1994) “Risk of breast cancer among young women: relationship to induced abortion.” Journal of the
National Cancer Institute, Vol. 86, No. 21, pp. 1584-1592.
Is the risk of breast cancer among women who have had an induced
abortion different from the risk among those who have not?
Chapter 24 29
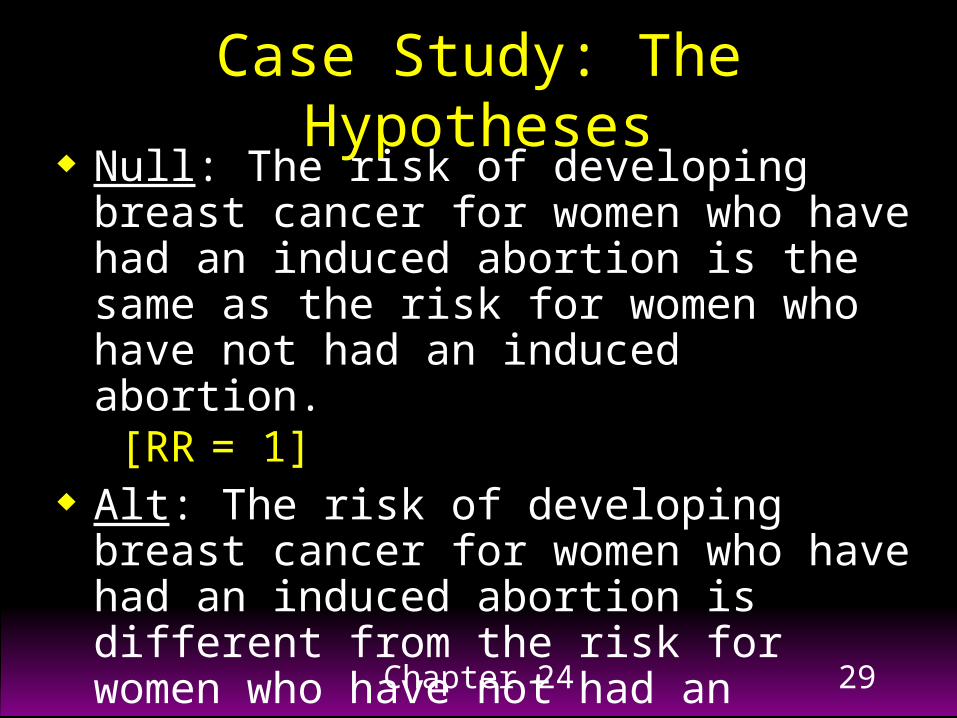
Case Study: The Hypotheses Null: The risk of developing breast cancer
for women who have had an induced abortion is the same as the risk for women who have not had an induced abortion. [RR = 1]
Alt: The risk of developing breast cancer for women who have had an induced abortion is different from the risk for women who have not had an induced abortion. [RR 1]

Chapter 24 30
Case Study: Test Statistic and P-value
Relative Risk = 1.5 Could also display data in a 22 table
and compute the chi-square value (9.75). The P-value (we will not compute this
one, just take it from the study) is 0.002. Recall: Z = square root of the chi-square.
(for 22 tables)

Chapter 24 31
Case Study: Decision
Since the P-value is small, we reject chance as the reason for the relative risk (1.5) being different from 1.0.
We find the result to be statistically significant.
We reject the null hypothesis. The data provide evidence that the two population risks (of developing breast cancer) are not the same.

Chapter 24 32
The remainder of this chapter presents the general procedure for determining if a significant relationship exists between two categorical variables with any number of levels– how to analyze two-way tables with any
number of rows and columns– results apply to special case of 22 tables
Two-Way Table: General Procedure
Chapter 24 33
Case Study
Data from patients’ own assessment of their quality of life relative to what it had been before their heart attack (data from
patients who survived at least a year)
Health Care: Canada and U.S.
Mark, D. B. et al., “Use of medical resources and quality of life after acute myocardial infarction in Canada and the United States,” New England Journal of Medicine, 331
(1994), pp. 1130-1135.
Chapter 24 34
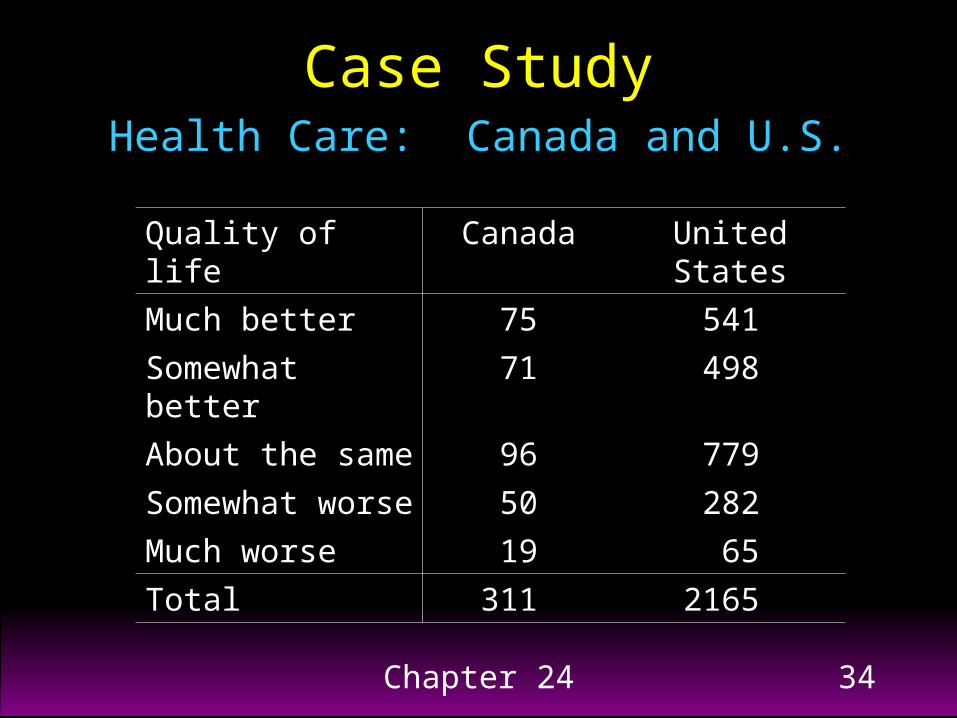
Quality of life Canada United States
Much better 75 541
Somewhat better 71 498
About the same 96 779
Somewhat worse 50 282
Much worse 19 65
Total 311 2165
Case StudyHealth Care: Canada and U.S.

Chapter 24 35
Quality of life Canada United StatesMuch better 75 541
Somewhat better 71 498About the same 96 779
Somewhat worse 50 282Much worse 19 65
Total 311 2165
Case StudyHealth Care: Canada and U.S.
Compare the Canadian group to the U.S. group in terms of feeling much better:
We have that 75 Canadians reported feeling much better, compared to 541 Americans.
The groups appear greatly different, but look at the group totals.

Chapter 24 36
Quality of life Canada United StatesMuch better 75 541
Somewhat better 71 498About the same 96 779
Somewhat worse 50 282Much worse 19 65
Total 311 2165
Health Care: Canada and U.S.
Compare the Canadian group to the U.S. group in terms of feeling much better:
Change the counts to percents
Now, with a fairer comparison using percents, the groups appear very similar in terms of feeling much better.
Quality of life Canada United StatesMuch better 24% 25%
Somewhat better 23% 23%About the same 31% 36%
Somewhat worse 16% 13%Much worse 6% 3%
Total 100% 100%
Case Study
Chapter 24 37
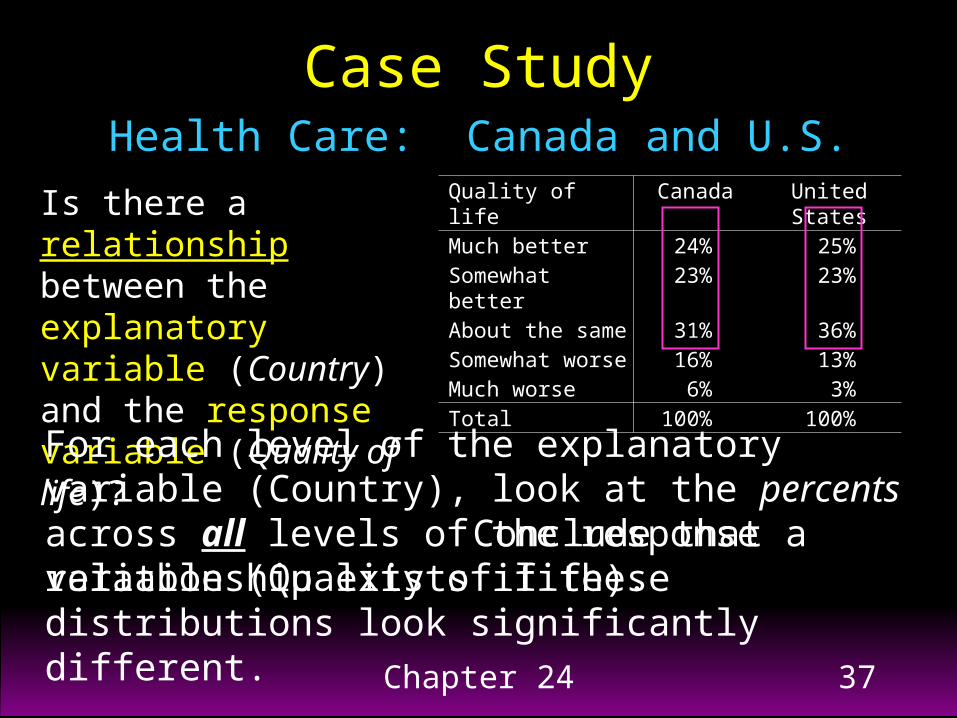
Health Care: Canada and U.S.
Is there a relationship between the explanatory variable (Country) and the response variable (Quality of life)?
Quality of life Canada United StatesMuch better 24% 25%
Somewhat better 23% 23%About the same 31% 36%
Somewhat worse 16% 13%Much worse 6% 3%
Total 100% 100%
For each level of the explanatory variable (Country), look at the percents across all levels of the response variable (Quality of life).
Case Study
Conclude that a relationship exists if these distributions look significantly different.

Chapter 24 38
In tests for two categorical variables, we are interested in whether a relationship observed in a single sample reflects a real relationship in the population.
Hypotheses:– Null: the percentages for one variable are the
same for every level of the other variable(No real relationship).
– Alt: the percentages for one variable vary over levels of the other variable. (Is a real relationship).
Hypothesis Test

Chapter 24 39
Health Care: Canada and U.S.Null hypothesis: The percentages for one variable are the same for every level of the other variable.(No real relationship).
Quality of life Canada United StatesMuch better 24% 25%
Somewhat better 23% 23%About the same 31% 36%
Somewhat worse 16% 13%Much worse 6% 3%
Total 100% 100%
For example, could look at differences in percentages between Canada and U.S. for each level of “Quality of life”:
24% vs. 25% for those who felt ‘Much better’,23% vs. 23% for ‘Somewhat better’, etc.
* Want to do all of these comparisons as one overall test…
Case Study

Chapter 24 40
H0: no real relationship between the two categorical variables that make up the rows and columns of a two-way table
To test H0, compare the observed counts in the table (the original data) with the expected counts (the counts we would expect if H0 were true)– if the observed counts are far from the expected
counts, that is evidence against H0 in favor of a real relationship between the two variables
Hypothesis Test

Chapter 24 41
The expected count in any cell of a two-way table (when H0 is true) is
Expected Counts
total tabletotal) (column total)(row count expected

Chapter 24 42
Quality of life Canada United States TotalMuch better 75 541 616
Somewhat better 71 498 569About the same 96 779 875
Somewhat worse 50 282 332Much worse 19 65 84
Total 311 2165 2476
Case StudyHealth Care: Canada and U.S.
For the expected count of Canadians who feel ‘Much better’ (expected count for Row 1, Column 1):
For the observed data to the right, find the expected value for each cell:
77.372476
311616
total table
total) (column1 total) (row1 count expected

Chapter 24 43
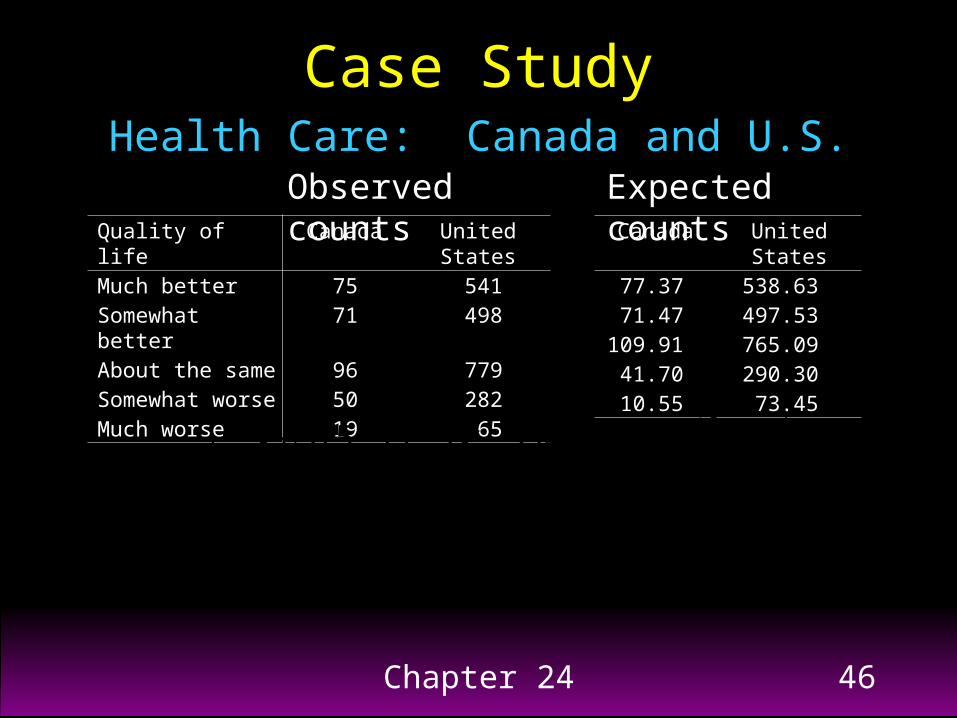
Quality of life Canada United StatesMuch better 75 541
Somewhat better 71 498About the same 96 779
Somewhat worse 50 282Much worse 19 65
Case StudyHealth Care: Canada and U.S.
Observed counts:
Quality of life Canada United StatesMuch better 77.37 538.63
Somewhat better 71.47 497.53About the same 109.91 765.09
Somewhat worse 41.70 290.30Much worse 10.55 73.45
Expected counts:
Compare to see if the data support the null hypothesis

Chapter 24 44
To determine if the differences between the observed counts and expected counts are statistically significant (to show a real relationship between the two categorical variables), we use the chi-square statistic:
Chi-Square Statistic
count expected
count expectedcount observed 22X
where the sum is over all cells in the table.

Chapter 24 45
The chi-square statistic is a measure of the distance of the observed counts from the expected counts– is always zero or positive– is only zero when the observed counts are exactly
equal to the expected counts
– large values of X2 are evidence against H0 because these would show that the observed counts are far from what would be expected if H0 were true
– the chi-square test is one-sided (any violation of H0 produces a large value of X2)
Chi-Square Statistic
Chapter 24 46
Quality of life Canada United States
Much better 75 541Somewhat better 71 498
About the same 96 779Somewhat worse 50 282
Much worse 19 65
Case StudyHealth Care: Canada and U.S.
Observed countsCanada United States
77.37 538.6371.47 497.53
109.91 765.0941.70 290.30
10.55 73.45
Expected counts
11.725
0.0100.073
538.63
538.63541
77.37
77.3775 22
2X

Chapter 24 47
Calculate value of chi-square statistic– by hand (cumbersome)– using technology (computer software, etc.)
Find P-value in order to reject or fail to reject H0
– use chi-square table for chi-square distribution (next few slides)
– from computer output If significant relationship exists (small P-value):
– compare appropriate percents in data table– compare individual observed and expected cell counts– look at individual terms in the chi-square statistic
Chi-Square Test

Chapter 24 48
Case StudyHealth Care: Canada and U.S.
Using Technology:

Chapter 24 49
Family of distributions that take only positive values and are skewed to the right
Specific chi-square distribution is specified by giving its degrees of freedom (formula on next slide)
Chi-Square Distributions

Chapter 24 50
Chi-square test for a two-way table withr rows and c columns uses critical values from a chi-square distribution with(r 1)(c 1) degrees of freedom
P-value is the area to the right of X2 under the density curve of the chi-square distribution– use chi-square table
Chi-Square Distributions

Chapter 24 51
Chi-Square Table See Chapter 24 in text for Table 24.1

Chapter 24 52
Finding the P-value for a chi-square test:– use the row for the appropriate degrees of
freedom (df) in the left margin of the table– locate the X2 value in the body of the table– the corresponding probability of lying to the
right of this value is found in the top margin of the table (this is the P-value)
– usually, the observed X2 value will be between two values in the table, and the P-value is reported as being between two values
Chi-Square P-value

Chapter 24 53
Quality of life Canada United StatesMuch better 75 541
Somewhat better 71 498About the same 96 779
Somewhat worse 50 282Much worse 19 65
Case StudyHealth Care: Canada and U.S.
X2 = 11.725
df = (r1)(c1)= (51)(21)= 4
Look in the df=4 row of Table 24.1; the value X2 = 11.725 falls between the 0.05 and 0.01 critical values.
Thus, the P-value for this chi-square test is between 0.01 and 0.05 (is actually 0.019482 ~ 0.02).
** P-value < .05, so we conclude a significant relationship **
Table 24.1

Chapter 24 54
To be significant at level (the cut-off value), the chi-square statistic must be larger than the table entry for – Example: for = .05 (typical cut-off), and
df = 4, the test is significant if X2 > 9.48 previous Case Study had X2 = 11.725 > 9.48
– Note: for 22 tables, df = (21)(21) = 1, and the test is significant if X2 > 3.84
Chi-Square Critical Values

Chapter 24 55
Tests the null hypothesis H0: no relationship between two categorical variables
when you have a two-way table from either of these situations:– Independent SRSs from each of several populations, with each
individual classified according to one categorical variable[Example: Health Care case study: two samples (Canadians & Americans); each individual classified according to “Quality of life”]
– A single SRS with each individual classified according to both of two categorical variables[Example: Sample of 8235 subjects, with each classified according to their “Job Grade” (1, 2, 3, or 4) and their “Marital Status” (Single, Married, Divorced, or Widowed)]
Uses of the Chi-Square Test

Chapter 24 56
The chi-square test is an approximate method, and becomes more accurate as the counts in the cells of the table get larger
The following must be satisfied for the approximation to be accurate:– No more than 20% of the expected counts are less
than 5– All individual expected counts are 1 or greater
If these requirements fail, then two or more groups must be combined to form a new (‘smaller’) two-way table
Chi-Square Test: Requirements

Chapter 24 57
When studying the relationship between two variables, there may exist a lurking variable that creates a reversal in the direction of the relationship when the lurking variable is ignored as opposed to the direction of the relationship when the lurking variable is considered.
The lurking variable creates subgroups, and failure to take these subgroups into consideration can lead to misleading conclusions regarding the association between the two variables.
Simpson’s Paradox
Chapter 24 58
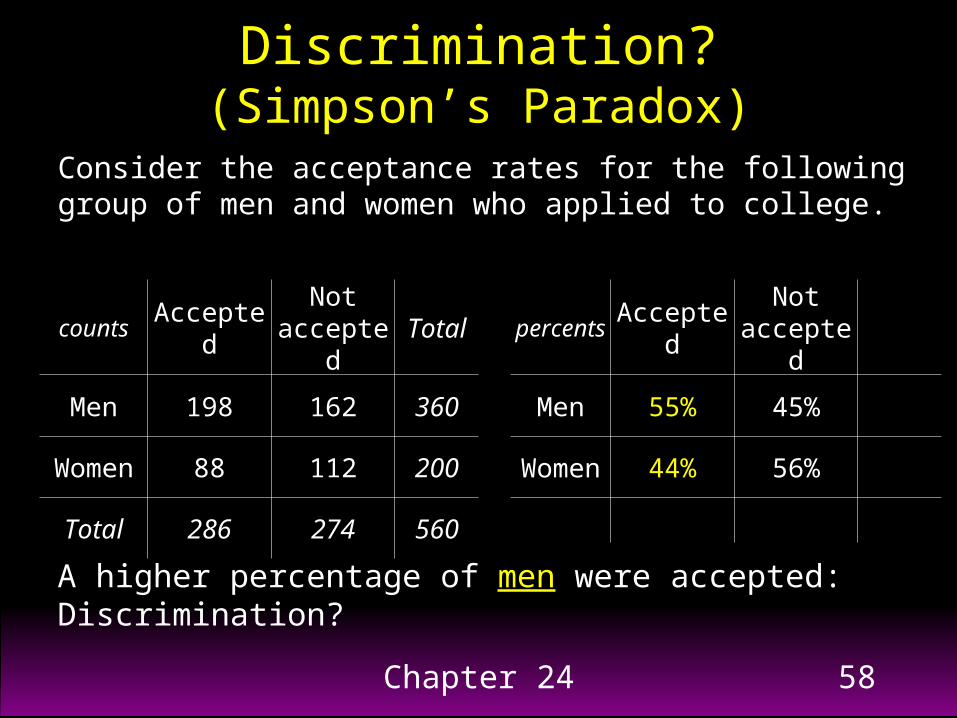
Consider the acceptance rates for the following group of men and women who applied to college.
Discrimination?(Simpson’s Paradox)
counts AcceptedNot
acceptedTotal
Men 198 162 360
Women 88 112 200
Total 286 274 560
percents AcceptedNot
accepted
Men 55% 45%
Women 44% 56%
A higher percentage of men were accepted: Discrimination?

Chapter 24 59
Discrimination?(Simpson’s Paradox)
counts AcceptedNot
acceptedTotal
Men 18 102 120
Women 24 96 120
Total 42 198 240
percents AcceptedNot
accepted
Men 15% 85%
Women 20% 80%
A higher percentage of women were accepted in Business
Lurking variable: Applications were split between the Business School (240) and the Art School (320).
BUSINESS SCHOOL
Chapter 24 60
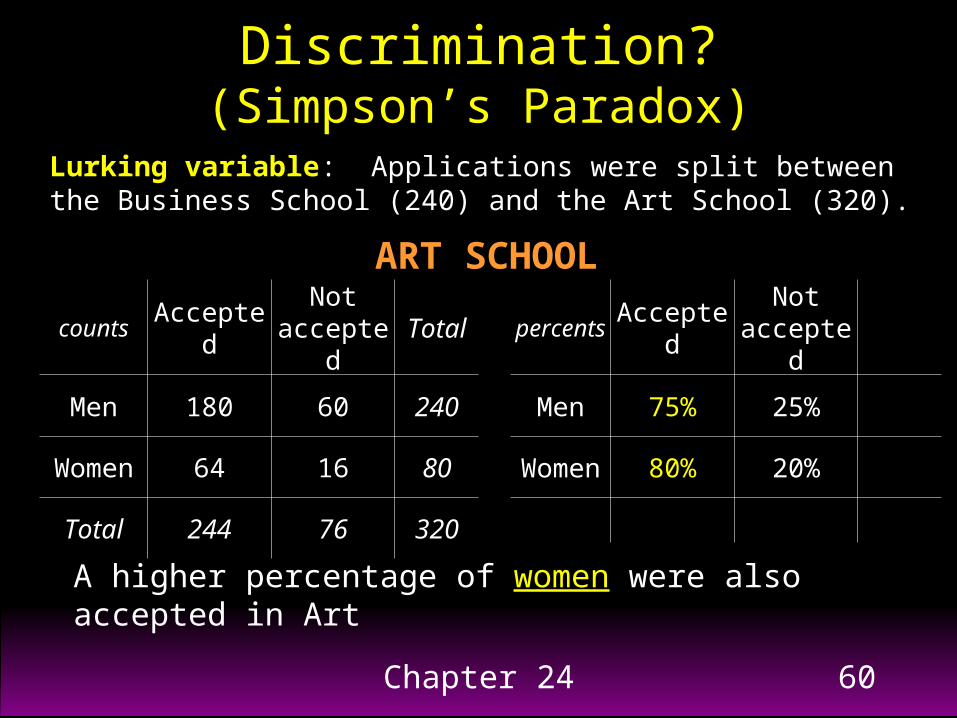
Discrimination?(Simpson’s Paradox)
counts AcceptedNot
acceptedTotal
Men 180 60 240
Women 64 16 80
Total 244 76 320
percents AcceptedNot
accepted
Men 75% 25%
Women 80% 20%
ART SCHOOL
A higher percentage of women were also accepted in Art
Lurking variable: Applications were split between the Business School (240) and the Art School (320).

Chapter 24 61
So within each school a higher percentage of women were accepted than men.There is not any discrimination against women!!!
This is an example of Simpson’s Paradox. When the lurking variable (School applied to: Business or Art) is ignored, the data seem to suggest discrimination against women. However, when the School is considered, the association is reversed and suggests discrimination against men.
Discrimination?(Simpson’s Paradox)

Chapter 24 62
Key Concepts
Displaying data in a contingency (two-way) table Concept of statistical significance with respect to
a 22 table (chi-square critical value) Interpreting confidence intervals for relative risk Interpreting hypothesis tests for relative risk Chi-square statistic and a statistically significant
relationship for any two-way table Simpson’s Paradox