chapter 2 financial statement and cash flow...
TRANSCRIPT
© 2014 Cengage Learning. All Rights Reserved. May not be copied, scanned, or duplicated or posted to a publicly accessible website, in whole or in part.
Chapter 2 Financial Statement and Cash Flow Analysis
Chapter Overview The Commonwealth Bank of Australia provides a useful reminder of key numbers that can provide a rapid overview of the economic health of an organisation. Chapter 2 explains what the major financial statements are for an organisation, of which the CBA data are a select subset.
What Companies Do Discussion Questions: 1. Do the numbers focus on upside business success, or do they describe a safety net for an
organisation? 2. What other ratios might be a good indicator of an improving or declining economy? This chapter reviews: 2-1. Financial Statements 2-2. Cash Flow Analysis 2-3. Assessing Financial Performance Using Ratio Analysis 2-4. Corporate Taxes
Technology
1. Smart Solutions. See the problem and solution explained step by step on the Course Mate website. 2. Smart Video. Jon Olson, CFO Xilnix Corporation, ‘it is really important that you know the basics of
accounting’. 3. Smart Video. This video quotes Frank Popoff, retired chairman of the board of Dow Chemical, that
‘Overstating or understating the performance of the enterprise is anathema…it’s just not on.’ This video talks about the difficulty in communicating information to investors. The company wants to accurately represent its performance, neither overly optimistic nor pessimistic. However, this balance is hard to achieve in an uncertain business environment. Discussion question: What is the delicate balance that a company must achieve when communicating its financial results in the market?
4. Smart Video. John Graham, Duke University. ‘It’s very easy for analysts to have conflict-of-interest problems.’
5. Smart Concepts. This video illustrates a DuPont analysis of Microsoft, Walmart, Kroger and Robert Mondavi. Discussion questions: How does the DuPont formula illustrate why investors might put pressure on Microsoft to distribute some of its cash? In 2002, Microsoft and Walmart reported similar ROE ratios, but they achieved their results in very different ways. Explain.
6. Smart Solutions. Step-by-step solution to Problems 2-2 and 2-10, calculating cash flow from operations, operating cash flow, and free cash flow.
After studying this chapter you will be able to: ■ understand the key financial statements that companies are required to provide to their
shareholders ■ evaluate the company’s cash flows using its financial statements, including the statement of
cash flows ■ calculate and interpret liquidity, activity and debt ratios ■ review the popular profitability ratios and the role of the DuPont system in analysing the
company’s returns ■ compute and interpret the price/earnings and market/book ratios ■ discuss the basics of corporate taxation of both ordinary income and capital gains.
Full file at http://testbankonline.eu/Solution-Manual-for-Introduction-to-Corporate-Finance--Australia-and-New-Zealand-1st-Edition-by-Chris-Adam
Instructor’s Manual
© 2014 Cengage Learning. All Rights Reserved. May not be copied, scanned, or duplicated or posted to a publicly accessible website, in whole or in part.
Lecture Guide Accounting is the language of business. This means there are many terms in this chapter, and the more familiar students are with the language, the easier this chapter will be. Accounting looks at historical numbers and paints a picture of a company’s financial situation at a given point in time. Finance is more dynamic and forward-looking, trying to determine what impact decisions have on wealth. The financial accounting process is about recording transactions, summarising what effect these have on a company’s financial position and finally transforming those effects into accounting statements. Transactions are any purchases, sales, or other exchanges that impact a company’s financial position. A current hot accounting topic is whether or not to expense share option grants to executives. Although not required to do so, many large companies, such as Coca-Cola and IBM have done so voluntarily. Another area of interest is the rapid acceptance of International Financial and Reporting Standards (IFRS, formerly called International Accounting Standards). IFRS have been adopted by most of the world (outside the US), although with local variations, such as the Australian IFRS. The European Union has mandated that all companies headquartered in Europe adopt IFRS, and China just announced it will do so as well. 2-1 Financial Statements Regular financial statements: • Make it easier to predict the future and make decisions • Show a company’s liquidity • Monitor the company’s current condition • Show the progress a company has made over time • Provide information to outsiders
Many interested parties, including shareholders, the government, and creditors, want to know if the company is doing better or worse than it has in the past, how fast the business is growing and whether the company will survive.
While accounting is primarily concerned with historical statements, in finance it may be useful to create pro forma statements, predictions about how the company’s statements will look in the future. These are used in valuation – to project the numbers used in multiples and cash flow valuations and in financing to determine the creditworthiness of the company and how much financing a company needs. These are also used to perform sensitivity analyses – how likely is a company to meet its goals? Pro forma statements are also used to help the company make strategic decisions; for example, will introducing a new product really increase shareholder value? The accuracy of the pro forma statements depends on the accuracy of the inputs. Four Key Financial Statements The three basic financial statements, the balance sheet, income statement and statement of retained earnings are used in the creation of the derivative statements, the statement of cash flows. The following sections go over each of the main statements used in financial analysis, presenting financial statements for Global Petroleum Corp. 2-1a Balance Sheet Note that a company’s assets are everything that it owns. Current assets are those that are easy to sell and turn into cash, while fixed assets are physical assets like buildings and equipment. A company may also have intangible assets that may not appear on the balance sheet, like patents, copyrights or franchises. Assets include everything that can be used to benefit the business or give the company the right to receive benefits.
Full file at http://testbankonline.eu/Solution-Manual-for-Introduction-to-Corporate-Finance--Australia-and-New-Zealand-1st-Edition-by-Chris-Adam
Chapter 2 Financial Statement and Cash Flow Analysis
© 2014 Cengage Learning. All Rights Reserved. May not be copied, scanned, or duplicated or posted to a publicly accessible website, in whole or in part.
Liabilities are what the company owes to others. Current liabilities are those that must be paid within a year, while long-term liabilities are due in more than a year, like mortgages or long-term loans. Shareholders’ equity is the owners’ residual share of the business, including their original investment plus any money the company has made since its inception. Typically shareholders’ equity is divided into two accounts, capital stock, the amount of investment in the business that the owners made plus retained earnings, all of the past, accumulated net income minus dividends since the company began.
Emphasise the basic balance sheet equation: Assets = Liabilities + Shareholders’ Equity
Table 2.1 Balance Sheet for Global Petroleum Corporation 2-1b Income Statement The income statement, or profit and loss statement shows what money a company has taken and spent during a specified time period. It is getting harder to accurately account for financial numbers with some new economy companies. For example, Priceline.com acts as a broker for customers wanting airline tickets and hotel rooms. Yet it claims as revenue the full price of the ticket or room. Priceline’s justification for this is that it does own the tickets, even if only for a nanosecond. This practice means the company could be seen as overstating its revenues. On the other hand, other companies routinely do something similar without being questioned. A department store sells clothing that is shipped to it by clothing manufacturers without changing the final product just as priceline.com does. Are these just two different versions of a store that adds value by providing a place for customers to find the product they are looking for? When to report revenue is also an issue. For example, the Australian insurance company HIH, before it declared itself insolvent, claimed all policy premium payments at the start of its insurance policies, even though they had yet to be paid. In the analysis of HIH’s collapse, it was concluded that this sort of claim was not acceptable to regular Australian accounting practice. A company’s expenses are decreases in assets or increases in liabilities resulting from revenue–producing activities. They include costs of goods sold, how much inventory was used during the period, along with the labour needed to produce the product. Operating expenses include salaries of executives, marketing expenses, mortgage payments, utility costs, etc. Depreciation expense is how much value an asset loses as it ages. Point out that they can see the effects of depreciation in the ads of any newspaper – a new car sells for a lot more than the same type of used car. Note that not everything is necessarily reported on the company’s financial statements. For example, a company could have a lawsuit pending that has not yet impacted the financial statements. Typically, a company is required to disclose such potential effects in the notes to its financial statements which often contain a great deal of valuable information. Table 2.2 Income Statement for Global Petroleum Corporation 2-1c Statement of Retained Earnings This statement is primarily used to see how the company has made its investment/consumption decision. Is the company reinvesting its earnings? If so, how much? Is the company paying out its earnings as dividends? These decisions are recorded in the statement of retained earnings. 2-1d Statement of Cash Flows Note that a statement of cash flows is an easy way to see the cash flow – the lifeblood of a business – from each of the main areas, operations, investment and financing. What did the company invest in? How did it finance its investment? Did its operations provide cash for future expansion, or did the company need to seek external financing? Table 2.3 Statement of Retained Earnings for Global Petroleum Corporation
Full file at http://testbankonline.eu/Solution-Manual-for-Introduction-to-Corporate-Finance--Australia-and-New-Zealand-1st-Edition-by-Chris-Adam
Instructor’s Manual
© 2014 Cengage Learning. All Rights Reserved. May not be copied, scanned, or duplicated or posted to a publicly accessible website, in whole or in part.
2-2 Cash Flow Analysis Cash is the lifeblood of a company, and the company’s statement of cash flows records what money has gone into and out of a company because of its operations, investments and financing activities. A past statement of cash flows shows where the company’s money came from and how it was used. Were these good sources and uses? In other words, did sources include substantial net profits, or did the company need to borrow heavily because its profits were low? Are there any sources or uses that stand out? For example, did the company greatly increase its cash? If so why? Does it not have any more productive use for its profits other than adding to its cash account? Did inventories increase? Why? Was there a production bottleneck that caused a buildup of inventories, or is this a reasonable increase given the company’s sales increases? In general, finance is more concerned with cash flows than with accounting earnings. While earnings and cash flows are highly correlated, they are not necessarily the same. Cash flows are used to provide the information for wealth-increasing decisions. Profits must be converted into cash flows in order to make company investment decisions. Cash flow is how much cash actually moves through a business. How this cash flow is managed can mean the success or failure of the company. An important concept to stress here is that increasing an asset or decreasing a liability is a use of cash, while decreasing an asset or increasing a liability is a source of cash. Sources of cash include new loans, collecting accounts receivable or choosing to pay your creditors over a longer period of time. Uses of cash include buying new equipment, paying expenses, and allowing your creditors to take longer to pay you. Explain to students why depreciation is not a cash flow, and that the company would be double counting its capital expenditures if it did not add back in depreciation to the cash flow equation. Point out the differences between cash flow from operations and free cash flow. Cash flow from operations refers to revenues minus operating costs, depreciation and taxes, with depreciation added back in. Free cash flow takes cash flow from operations and subtracts (adds) incremental working capital or capital expenditure needs. A statement of cash flows can be historical or forward looking. In other words, it can show how the company has spent money and where it has received money in the past, or it can be used to predict what funds will be needed in the future. A past sources and uses of funds statement will balance – the amount of sources will match the amount of uses of funds in the past. Unlike in accounting classes, a future statement of cash flows can be unbalanced; in other words, the company may have more sources than uses, and the difference shows how much new debt or equity financing the company will need in the future. Note that a student can simply move down the balance sheet to create this statement, by looking at how each account on the balance sheet has changed over the time period being studied, and whether this account has been a source of funds (increased liabilities or decreased assets) or a use of funds (decreased liability or increased assets). Figure 2.1 The Pattern of Cash Flows Through a Company 2-3 Assessing Financial Performance Using Ratio Analysis The instructor should note the main types of ratio and which groups are interested in which ratios. For example, creditors are primarily interested in liquidity ratios to assess a company’s current ability to pay, and in a company’s debt ratios to see if their overall debt load is manageable. Shareholders are interested in all ratios – they want to know how profitable the company is, whether it is using its assets efficiently and what is its market value. Ratios are used by many other interested parties. For example, the company’s unions might use the results of ratio analysis to help them negotiate a new contract. Regulators use ratios to set an allowed rate of return for regulated companies like utilities. Table 2.4 Statement of Cash Flows for Global Petroleum Corporation 2-3a Using Financial Ratios Financial ratio analysis is the use of ratios to analyse financial statements. They can be used to determine the company’s strengths and weaknesses, its historical performance and its present financial
Full file at http://testbankonline.eu/Solution-Manual-for-Introduction-to-Corporate-Finance--Australia-and-New-Zealand-1st-Edition-by-Chris-Adam
Chapter 2 Financial Statement and Cash Flow Analysis
© 2014 Cengage Learning. All Rights Reserved. May not be copied, scanned, or duplicated or posted to a publicly accessible website, in whole or in part.
condition. Ratios are used to make it easier to make comparisons – between the company’s past and its present and between the company and its competitors. Managers use ratios to improve the company’s performance. Creditors use ratios to see whether the company will be able to repay its debts, while shareholders want to predict what future dividends and earnings will be. 2-3b Liquidity Ratios Point out to students that it is difficult to tell if a ratio is bad or good without additional information. For example, a lender would prefer high current and quick ratios, but when are these ratios ‘too high’? (Answer: when a company has too much cash that it is not using productively.) 2-3c Activity Ratios In general, a higher inventory turnover is an indication of greater efficiency, which is good for a company. When can a high inventory turnover ratio be negative for a company? (Answer: when the company is experiencing frequent stockouts because it can’t keep enough inventory to meet customer needs.) 2-3d Debt Ratios When discussing debt ratios, relate debt to risk. More debt makes a company riskier. Why? What difference does variability in cash flows make? (Answer: if a company has very stable cash flows, it is more able to take on more debt.) If its cash flows are very variable, then it runs the risk of not being able to meet its debt obligations if it is experiencing a bad year. Note that a company usually can’t choose the riskiness of its assets – that is usually determined by the nature of the business, but it can choose the amount of financing risk that it takes on. Too much debt and too little cash flow can force a company into insolvency. 2-3e Profitability Ratios The term ‘profits’ is very vague. ‘Profits’ may mean: • Gross profits, sales minus cost of goods sold • Operating profits, sales minus cost of goods sold minus operating expenses • Pre-tax profit, operating profit plus non-operating income and minus non-operating expenses like
interest • Net profit, pretax profit minus taxes, also called net income or earnings.
Analysts need to look closely at how a company classifies its expenses. For example, Amazon.com
has what it classifies as fulfilments costs, the expense associated with each order such as inspecting and warehousing inventories, packaging orders and responding to customer queries. These might seem like traditional cost of goods sold, yet Amazon.com lists them as marketing expenses on its income statement. This means that the company’s gross profits are considerably higher than they would be without this accounting choice. The company’s bottom line is the same – the costs are ultimately all expensed, but it could give a misleading view of the company’s profits from operations. In another example, the author of Indecent Proposal, Jack Engelhard, signed a contract giving him royalties from the hit movie starring Robert Redford and Demi Moore. In spite of the fact that the movie’s world-wide gross was $250 million, the studio is showing losses on the movie and refusing to pay the author more than the $120,000 he received upfront. Robert Redford reportedly earned $20 million for his role in the movie. Note the relationship between return on assets and return on equity. ROA decreases if a company takes on a lot of debt, because interest will increase and net income or earnings available for common shareholders, the numerator of the ratio, will also decrease. But using debt financing reduces the amount of equity needed, and may raise return on equity, which is earnings available for common shareholders divided by common equity. Usually the use of debt financing increases value to shareholders, unless a company is taking on more debt than it can reasonably handle. You can illustrate this by using a housing example. Suppose you purchase a house for $100,000. You pay cash for the house. The house
Full file at http://testbankonline.eu/Solution-Manual-for-Introduction-to-Corporate-Finance--Australia-and-New-Zealand-1st-Edition-by-Chris-Adam
Instructor’s Manual
© 2014 Cengage Learning. All Rights Reserved. May not be copied, scanned, or duplicated or posted to a publicly accessible website, in whole or in part.
subsequently increases in value to $150,000, a profit of $50,000 and a return on assets of $50,000/$100,000 or 50%. Suppose instead you put down $10,000 in cash to purchase the house and borrowed $90,000 of the purchase price. The house increases in value to $150,000 providing you with the same $50,000 profit. Now, however, your return on equity is 50,000/10,000 or 500%. Using leverage has greatly increased your profits. This is a very simplified example, ignoring transactions costs and taxes. To improve ROA a company needs to improve its cost control, for example, reducing labour costs, purchases and overhead. Or, the company needs to increase its revenue, say through higher pricing, changing its product mix or volumes. The company might also be able to improve its capacity utilisation, making more use of the same equipment. Or, it could improve its working capital management, collecting accounts receivable faster or paying its accounts payable more slowly. 2-3f Market Ratios When discussing market ratios, note that price/earnings ratio is one of the most talked about ratios. It would be difficult to pick up an Australian Financial Review without seeing price-earnings ratio mentioned. Ask students what they think high or low P/E ratios would mean. Is a high (or low) P/E ratio good or bad? Note that in general low P/E ratio companies are considered to be lower growth companies while high P/E companies are considered to be high growth. Some investors think low P/E ratio companies are underpriced and therefore good value. High P/E ratios in general mean the market thinks the company will have high growth and high future earnings. Ask students what can make a P/E ratio high. It can be a high price or low earnings. Some extraordinarily high P/E ratios are the result of the company’s having extremely low earnings per share. Give an example of how quickly and simply P/E ratio can be used. Suppose you go to your company’s annual shareholders’ meeting, enjoy the wine and cheese and wait for the CEO to give his speech about the prospects of the company. The CEO tells you that next year the company will earn $6.00 per share. The company’s historical P/E ratio has been 10 times. This says the shares should trade for $6 x 10 or $60 next year. 2-4 Corporate Taxes Point out that average tax rate may not be representative of a company’s overall tax rate; it could reflect temporary tax credits and may not be representative of the future. Marginal tax rate is generally more important to the financial analyst. One of the major decision made by managers is the capital budgeting decision – what projects should be accepted. Any profits resulting from these projects are incremental dollars, and will be taxed at the company’s marginal tax rate, not the company’s historical, average tax rate. Note that capital gains for individuals on their share sales are treated differently than for corporations. Under the recently passed tax law, individuals’ capital gains and dividends are taxed at the maximum rate of 15%, not at the individual’s marginal personal income tax rate. Ratios seldom can stand alone. It is generally more useful to compare a company’s ratios to an industry average or an industry leader to see if the company is underperforming or outperforming its peers. This is called an intercompany ratio analysis. An intracompany, or internal, trend analysis may also be helpful – has the company been improving or declining over time? Summary Point out that market values and not accounting numbers are what count, even though the two can be related. As recent headlines have shown, accounting numbers can be manipulated. Accounting numbers, however, can provide information used in making wealth-increasing decisions. Accounting numbers serve as a proxy for cash flow, for example, net income. An accounting number is an important part of the cash flow equation. Point out the limitations of ratio analysis. Most companies do not operate in a single industry, so it may be difficult to make industry comparisons. Average performance may not really be good, particularly if the entire industry is in a slump. Management can (legally and illegally) manipulate its financial statements, potentially distorting ratios. Typically ratio analysis is a starting point, not an answer to your questions about a company’s financial health. Ratio analysis tells you what questions to ask and is the
Full file at http://testbankonline.eu/Solution-Manual-for-Introduction-to-Corporate-Finance--Australia-and-New-Zealand-1st-Edition-by-Chris-Adam
Chapter 2 Financial Statement and Cash Flow Analysis
© 2014 Cengage Learning. All Rights Reserved. May not be copied, scanned, or duplicated or posted to a publicly accessible website, in whole or in part.
starting point of an analysis, not the ending point. It is usually part of a company analysis, but not the entire analysis. Ratios need to be put into perspective. Ratios need to be compared to some standard, to a trend over time or compared to an industry average or industry leader.
Chapter 2 Resource Articles: ‘Cash Flow Hocus Pocus’, Business Week, 15 July 2002. Finance says that the focus should be on a company’s cash flows, not necessarily its accounting statements. This article points out ways that a company can manipulate its cash flows, for example, through selling accounts receivable, classifying outstanding checks as accounts payable, trading securities and capitalising certain expenses. ‘Amazon is All Grown Up, Except for its Accounting,’ Business Week, 5 August 2002. This article talks about the disfavour pro forma statements have fallen into because of recent accounting scandals. It looks at Amazon’s failure to use GAAP in its projections and skip pro forma projections. ‘Brainpower on the Balance Sheet,’ Business Week, 26 August 2002. This article looks at the increase in intangible assets like brand names and research and development and the difficulties in having accounting statements reflect a company’s intangible value. ‘Battle of the Accountants: Europe Tries to Win Over US,’ Wall Street Journal, 16 July 2002. This article looks at differences between GAAP and International Accounting Standards and mentions pressure on US companies to adopt international standards.
Enrichment Exercises 1. Chapter 2 raises questions about accounting standards – GAAP standards vs IAS standards. Ask
students to find an article in their local newspapers, on the internet or in the Wall Street Journal or its web site, and ask them to:
a. Write up their opinion about the value of accounting standards – what needs to be reformed (if anything) and why? OR
b. Have a roundtable discussion with each student contributing information from his or her article, and reaching a group consensus.
2. Have students, either individually or in a group choose a company for which to perform a financial
statement analysis. It’s best to choose a company that is primarily operating in one industry. Bank and financial service company accounting also can be very different and sometimes harder to interpret than traditional company accounting. The financial statement analysis should involve calculating the ratios listed in the textbook for two years and comparing them to industry average ratios. Students could then see if the company’s ratios are trending up or down and how they compare to industry averages.
Some guidelines for the project could: • Include a copy of your company’s most recent income statement and balance sheet. I
recommend that you also transfer the values in these statements into an Excel spreadsheet. It will make the subsequent calculations easier.
• Include a page with calculations of ratios for your company for one year. You should go through Chapter 2 of the textbook, list the ratios from the textbook on your spreadsheet, enter the formulas on your spreadsheet, and then have the spreadsheet calculate the values for your company. You may not be able to calculate all of the Chapter 2 ratios. For example, if your company is an all-equity company, you will not be able to compute a debt ratio. If ratio information is not available, just write N/A or not available by that ratio.
Full file at http://testbankonline.eu/Solution-Manual-for-Introduction-to-Corporate-Finance--Australia-and-New-Zealand-1st-Edition-by-Chris-Adam
Instructor’s Manual
© 2014 Cengage Learning. All Rights Reserved. May not be copied, scanned, or duplicated or posted to a publicly accessible website, in whole or in part.
• Explain any trends you see in your company. Are its ratios becoming better or worse over time? How does your company compare to the industry average?
3. Have students each download financial statements from different companies. In a round table
discussion, they could go through the statements, noting how companies use different terminology for the same parts of the statements. Ratios give very little information without something to compare it to – what would the students use to compare and why? Discuss the merit of using same company past ratios versus industry comparisons.
4. Have students perform a two-minute ratio analysis. The article ‘Financial Statement Analysis – A
Two-Minute Drill’ by William L. Stone, Journal of Commercial Bank Lending, November 1983: 11–19, provides a framework for very quickly computing (without a calculator) current ratio, debt ratio, net profit margin, accounts receivable turnover, inventory turnover, and accounts payable turnover and making a decision about whether to extend a loan to the company. Students could take a company’s financial statements and perform the two-minute drill and then discuss their conclusions.
Answers to Concept Review Questions 1. In Australia, the Australian Accounting Standards Board (AASB) has been set up by the Australian
Government as an independent body to establish a single set of high quality, understandable accounting standards that require transparent and comparable information in general purpose financial statements. The AASB examines accounting topics and issues rulings that guide accounting practice. Four primary financial statements are the balance sheet, the income statement, the statement of retained earnings, and the statement of cash flows.
2. Companies prepare both balance sheets and income statements for the purpose of providing
financial information about a company at a point in time, but they are used for slightly different purposes. A balance sheet provides a picture of the company’s assets and liabilities (or net worth) at a point in time and sums all of the company’s past earnings in the shareholder equity account. An income statement, on the other hand, provides a picture of the company’s revenues and expenses for a specified period of time. Both statements are very useful in analysing the company’s past and future prospects.
3. Creditors would most likely be interested in the balance sheet, which states how much the company
holds in liabilities, but they also would want to see an income statement, which indicates the company’s ability to meet its payment commitments. Shareholders will certainly be interested in the balance sheet and income statement, which will allow them to compute ratios for the company; in the statement of retained earnings, which states how much their share of the company has increased or decreased; and in the statement of cash flows, which describes where cash is coming in and going out of the company.
4. Depreciation and other non-cash charges are sources of cash to the company. These charges are
subtracted from the company’s revenues, decreasing cash flow in order to get a correct estimate of taxes owed. They need to be added back to compute an accurate cash flow. These charges are not real cash flows – no dollars exchange hands when a company takes a depreciation expense – and are only subtracted because they reduce the company’s tax bill, and taxes are a real dollar cash flow. The tax code does not allow a company to expense its capital equipment in the year it was purchased. It requires companies to charge this expense over the lifetime of the equipment, taking a percentage of the total cost each year. For a profitable company, it is better to depreciate assets as quickly as possible. The larger the depreciation expense, the lower the taxable income and the lower the taxes owed.
5. Operating cash flow (OCF) is earnings before interest and taxes (EBIT) less actual taxes plus
depreciation. OCF is related to NOPAT because OCF can also be calculated as NOPAT plus
Full file at http://testbankonline.eu/Solution-Manual-for-Introduction-to-Corporate-Finance--Australia-and-New-Zealand-1st-Edition-by-Chris-Adam
Chapter 2 Financial Statement and Cash Flow Analysis
© 2014 Cengage Learning. All Rights Reserved. May not be copied, scanned, or duplicated or posted to a publicly accessible website, in whole or in part.
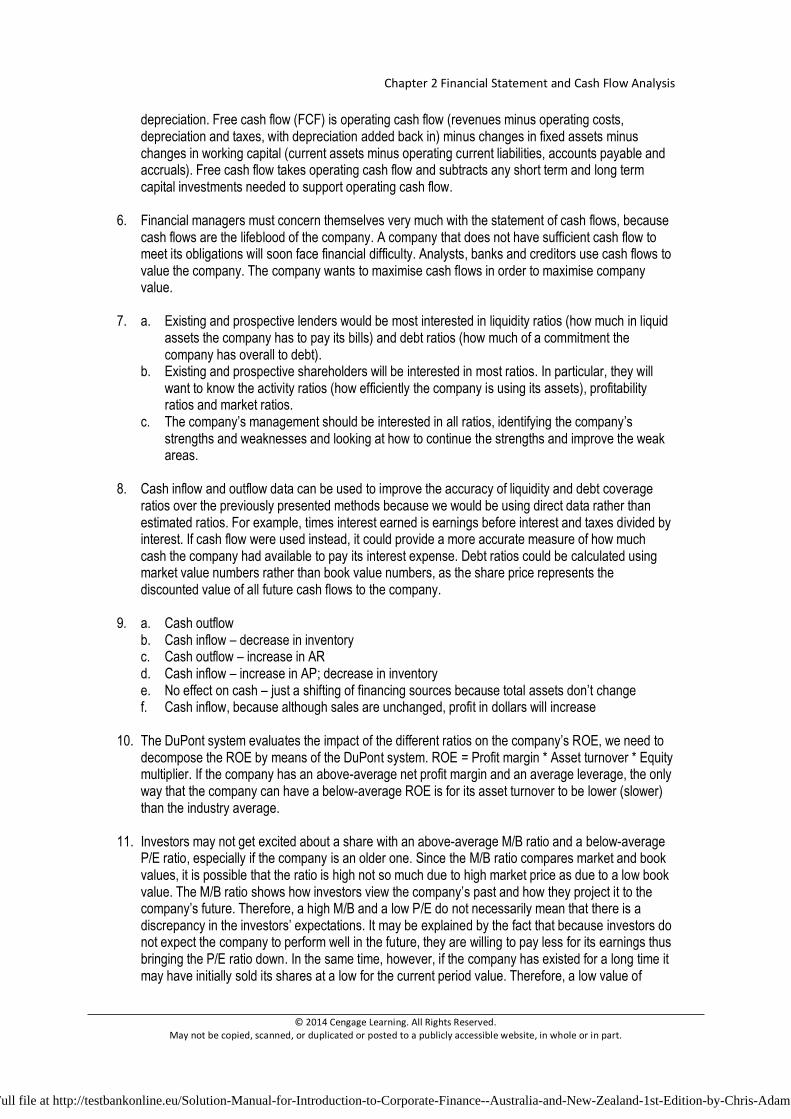
depreciation. Free cash flow (FCF) is operating cash flow (revenues minus operating costs, depreciation and taxes, with depreciation added back in) minus changes in fixed assets minus changes in working capital (current assets minus operating current liabilities, accounts payable and accruals). Free cash flow takes operating cash flow and subtracts any short term and long term capital investments needed to support operating cash flow.
6. Financial managers must concern themselves very much with the statement of cash flows, because
cash flows are the lifeblood of the company. A company that does not have sufficient cash flow to meet its obligations will soon face financial difficulty. Analysts, banks and creditors use cash flows to value the company. The company wants to maximise cash flows in order to maximise company value.
7. a. Existing and prospective lenders would be most interested in liquidity ratios (how much in liquid
assets the company has to pay its bills) and debt ratios (how much of a commitment the company has overall to debt).
b. Existing and prospective shareholders will be interested in most ratios. In particular, they will want to know the activity ratios (how efficiently the company is using its assets), profitability ratios and market ratios.
c. The company’s management should be interested in all ratios, identifying the company’s strengths and weaknesses and looking at how to continue the strengths and improve the weak areas.
8. Cash inflow and outflow data can be used to improve the accuracy of liquidity and debt coverage
ratios over the previously presented methods because we would be using direct data rather than estimated ratios. For example, times interest earned is earnings before interest and taxes divided by interest. If cash flow were used instead, it could provide a more accurate measure of how much cash the company had available to pay its interest expense. Debt ratios could be calculated using market value numbers rather than book value numbers, as the share price represents the discounted value of all future cash flows to the company.
9. a. Cash outflow
b. Cash inflow – decrease in inventory c. Cash outflow – increase in AR d. Cash inflow – increase in AP; decrease in inventory e. No effect on cash – just a shifting of financing sources because total assets don’t change f. Cash inflow, because although sales are unchanged, profit in dollars will increase
10. The DuPont system evaluates the impact of the different ratios on the company’s ROE, we need to decompose the ROE by means of the DuPont system. ROE = Profit margin * Asset turnover * Equity multiplier. If the company has an above-average net profit margin and an average leverage, the only way that the company can have a below-average ROE is for its asset turnover to be lower (slower) than the industry average.
11. Investors may not get excited about a share with an above-average M/B ratio and a below-average
P/E ratio, especially if the company is an older one. Since the M/B ratio compares market and book values, it is possible that the ratio is high not so much due to high market price as due to a low book value. The M/B ratio shows how investors view the company’s past and how they project it to the company’s future. Therefore, a high M/B and a low P/E do not necessarily mean that there is a discrepancy in the investors’ expectations. It may be explained by the fact that because investors do not expect the company to perform well in the future, they are willing to pay less for its earnings thus bringing the P/E ratio down. In the same time, however, if the company has existed for a long time it may have initially sold its shares at a low for the current period value. Therefore, a low value of
Full file at http://testbankonline.eu/Solution-Manual-for-Introduction-to-Corporate-Finance--Australia-and-New-Zealand-1st-Edition-by-Chris-Adam
Instructor’s Manual
© 2014 Cengage Learning. All Rights Reserved. May not be copied, scanned, or duplicated or posted to a publicly accessible website, in whole or in part.
ordinary shares on the company’s books combined with decreasing retained earnings, leads to a high M/B ratio due to the small denominator of the ratio.
12. Ordinary corporate income is income resulting from the sale of the company’s goods and services.
Under current tax laws, the applicable tax rate is 30%. Corporate average tax rates are calculated by dividing the company’s tax liability by its pre-tax income. The company’s marginal tax rate is the tax rate applicable to the company’s next dollar of earnings.
13. Capital gains occur when companies sell capital assets, such as equipment or stock held as an
investment, for more than the asset’s original purchase price. The amount of the capital gain would be equal to the difference between the sale price and initial purchase price. If the sale price is less than the initial purchase price, the difference is called capital loss. Under current tax law, corporate capital gains are merely added to operating income and taxed at the ordinary corporate tax rates. The tax treatment of capital losses on depreciable business assets involves a deduction from pre-tax ordinary income, whereas any other capital losses must be used to offset capital gains.
Answers to Self-Test Problems ST2-1. Use the financial statements below to answer the questions concerning M&M Manufacturing’s
financial position at the end of the calendar year 2012. a. How much cash and near cash does M&M have at year-end 2012? b. What was the original cost of all of the company’s real property that is currently owned? c. How much in total liabilities did the companies have at year-end 2012? d. How much did M&M owe for credit purchases at year-end 2012? e. How much did the company sell during 2012? f. How much equity did the ordinary shareholders have in the company at year-end 2012? g. What is the cumulative total of earnings reinvested in the company from its inception
through the end of 2012? h. How much operating profit did the company earn during 2012? i. What is the total amount of dividends paid out by the company during the year 2012? j. How many ordinary shares did M&M have outstanding at year-end 2012?
Full file at http://testbankonline.eu/Solution-Manual-for-Introduction-to-Corporate-Finance--Australia-and-New-Zealand-1st-Edition-by-Chris-Adam
Chapter 2 Financial Statement and Cash Flow Analysis
© 2014 Cengage Learning. All Rights Reserved. May not be copied, scanned, or duplicated or posted to a publicly accessible website, in whole or in part.
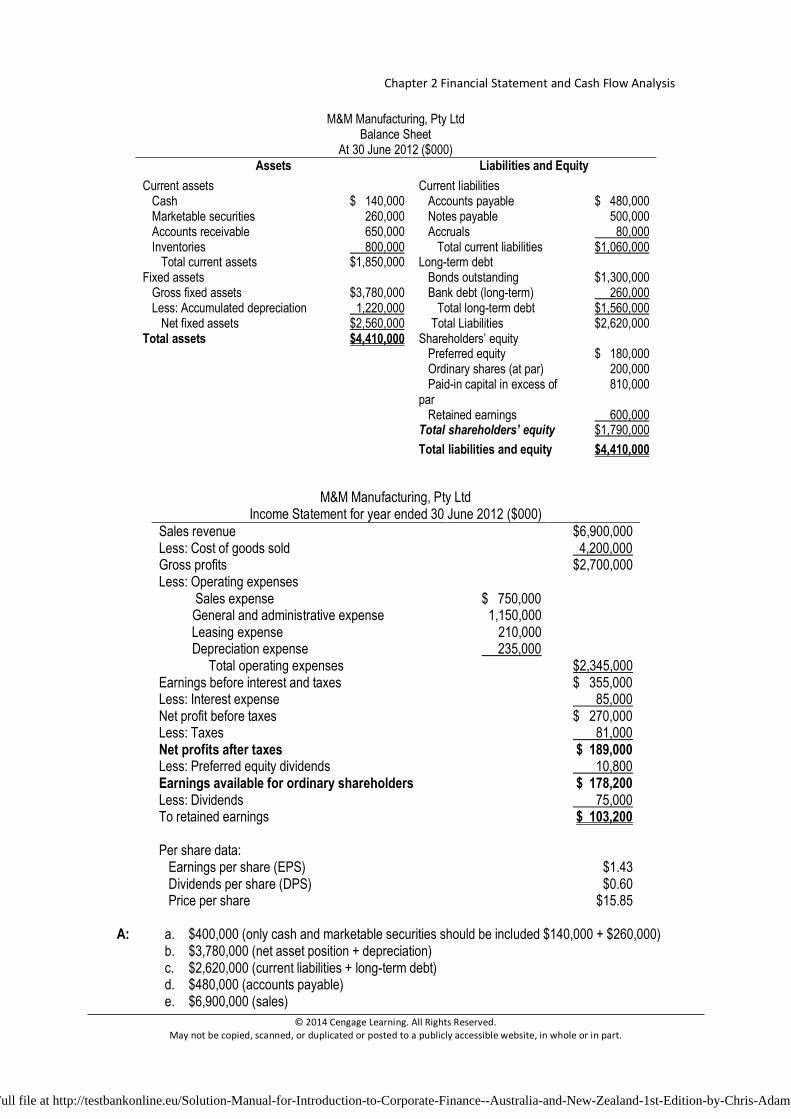
M&M Manufacturing, Pty Ltd Balance Sheet
At 30 June 2012 ($000) Assets Liabilities and Equity
Current assets Current liabilities Cash $ 140,000 Accounts payable $ 480,000 Marketable securities 260,000 Notes payable 500,000 Accounts receivable 650,000 Accruals 80,000 Inventories 800,000 Total current liabilities $1,060,000 Total current assets $1,850,000 Long-term debt Fixed assets Bonds outstanding $1,300,000 Gross fixed assets $3,780,000 Bank debt (long-term) 260,000 Less: Accumulated depreciation 1,220,000 Total long-term debt $1,560,000 Net fixed assets $2,560,000 Total Liabilities $2,620,000 Total assets $4,410,000 Shareholders’ equity Preferred equity $ 180,000 Ordinary shares (at par) 200,000 Paid-in capital in excess of
par 810,000
Retained earnings 600,000 Total shareholders’ equity $1,790,000 Total liabilities and equity $4,410,000
M&M Manufacturing, Pty Ltd Income Statement for year ended 30 June 2012 ($000)
Sales revenue $6,900,000 Less: Cost of goods sold 4,200,000 Gross profits $2,700,000 Less: Operating expenses Sales expense $ 750,000 General and administrative expense 1,150,000 Leasing expense 210,000 Depreciation expense 235,000 Total operating expenses $2,345,000 Earnings before interest and taxes $ 355,000 Less: Interest expense 85,000 Net profit before taxes $ 270,000 Less: Taxes 81,000 Net profits after taxes $ 189,000 Less: Preferred equity dividends 10,800 Earnings available for ordinary shareholders $ 178,200 Less: Dividends 75,000 To retained earnings $ 103,200 Per share data: Earnings per share (EPS) $1.43 Dividends per share (DPS) $0.60 Price per share $15.85
A: a. $400,000 (only cash and marketable securities should be included $140,000 + $260,000)
b. $3,780,000 (net asset position + depreciation) c. $2,620,000 (current liabilities + long-term debt) d. $480,000 (accounts payable) e. $6,900,000 (sales)
Full file at http://testbankonline.eu/Solution-Manual-for-Introduction-to-Corporate-Finance--Australia-and-New-Zealand-1st-Edition-by-Chris-Adam
Instructor’s Manual
© 2014 Cengage Learning. All Rights Reserved. May not be copied, scanned, or duplicated or posted to a publicly accessible website, in whole or in part.
f. $1,610,000 (ordinary shares at par + paid-in capital + retained earnings) g. $600,000 (retained earnings) h. $355,000 (EBIT) i. $85,800 (preferred + ordinary share dividends) j. 124,615 shares outstanding ($178,200/$1.43)
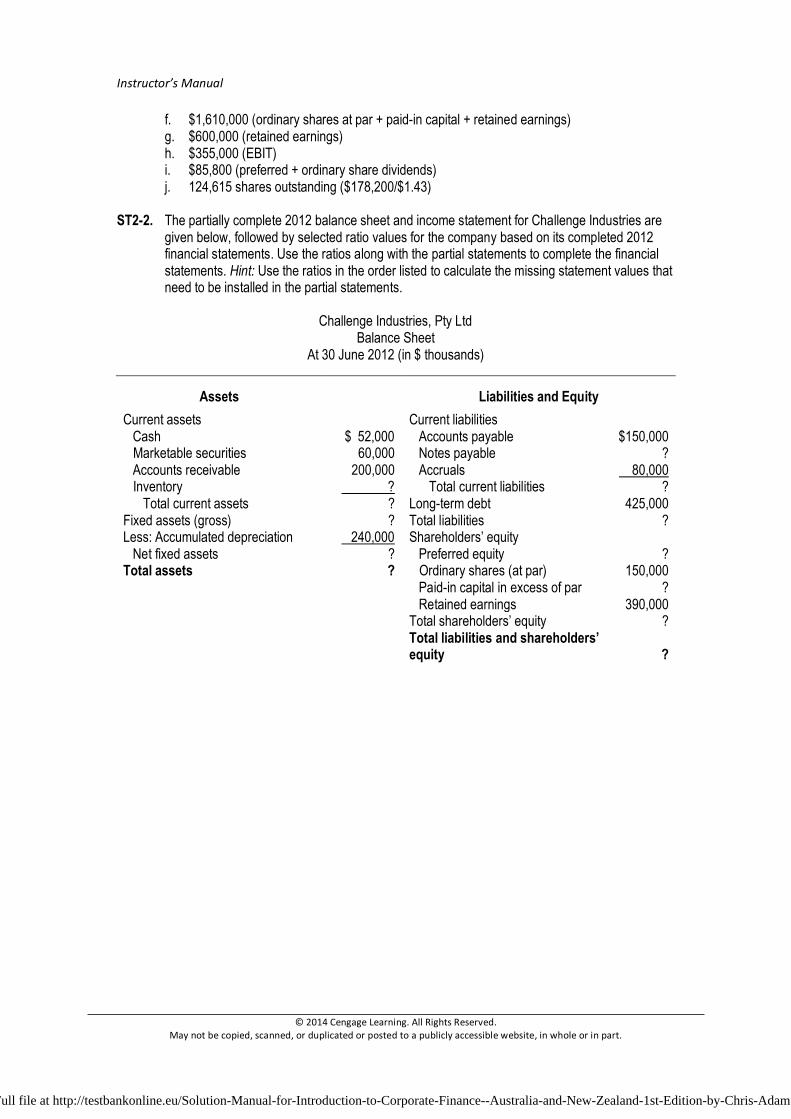
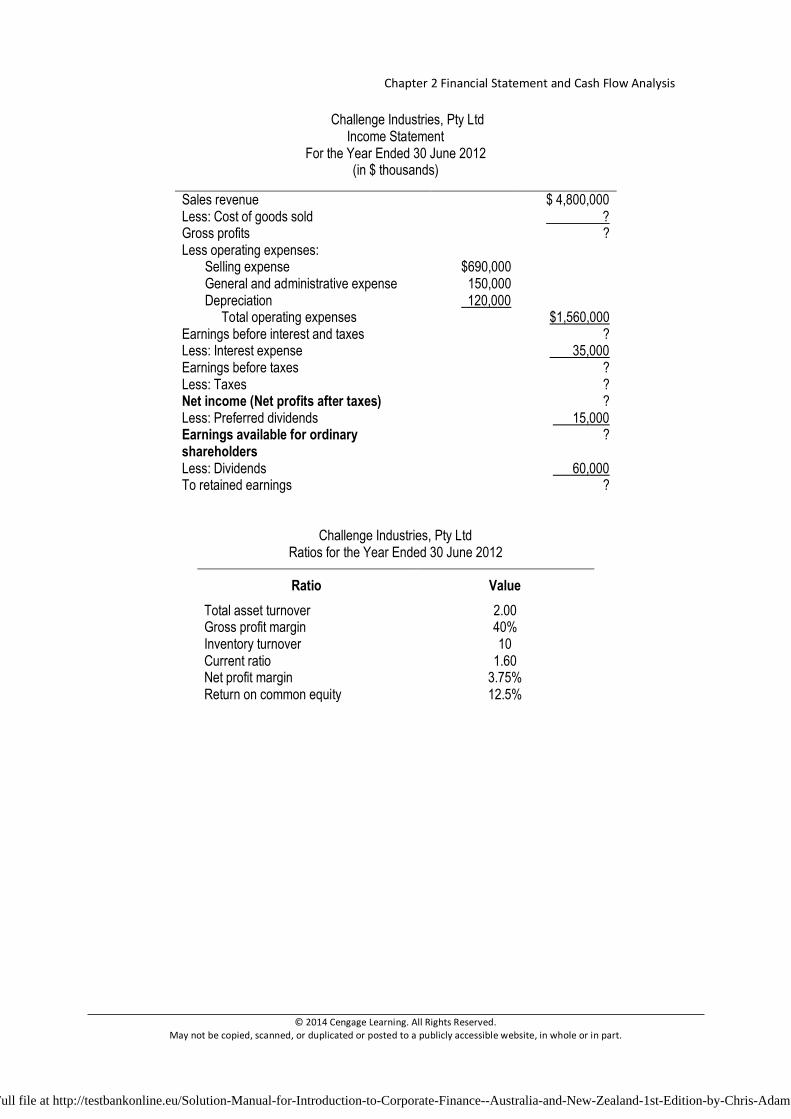
ST2-2. The partially complete 2012 balance sheet and income statement for Challenge Industries are
given below, followed by selected ratio values for the company based on its completed 2012 financial statements. Use the ratios along with the partial statements to complete the financial statements. Hint: Use the ratios in the order listed to calculate the missing statement values that need to be installed in the partial statements.
Challenge Industries, Pty Ltd
Balance Sheet At 30 June 2012 (in $ thousands)
Assets
Liabilities and Equity
Current assets Current liabilities Cash $ 52,000 Accounts payable $150,000 Marketable securities 60,000 Notes payable ? Accounts receivable 200,000 Accruals 80,000 Inventory ? Total current liabilities ? Total current assets ? Long-term debt 425,000 Fixed assets (gross) ? Total liabilities ? Less: Accumulated depreciation 240,000 Shareholders’ equity Net fixed assets ? Preferred equity ? Total assets ? Ordinary shares (at par) 150,000 Paid-in capital in excess of par ? Retained earnings 390,000 Total shareholders’ equity ? Total liabilities and shareholders’
equity
?
Full file at http://testbankonline.eu/Solution-Manual-for-Introduction-to-Corporate-Finance--Australia-and-New-Zealand-1st-Edition-by-Chris-Adam
Chapter 2 Financial Statement and Cash Flow Analysis
© 2014 Cengage Learning. All Rights Reserved. May not be copied, scanned, or duplicated or posted to a publicly accessible website, in whole or in part.
Challenge Industries, Pty Ltd Income Statement
For the Year Ended 30 June 2012 (in $ thousands)
Sales revenue $ 4,800,000 Less: Cost of goods sold ? Gross profits ? Less operating expenses: Selling expense $690,000 General and administrative expense 150,000 Depreciation 120,000 Total operating expenses $1,560,000 Earnings before interest and taxes ? Less: Interest expense 35,000 Earnings before taxes ? Less: Taxes ? Net income (Net profits after taxes) ? Less: Preferred dividends 15,000 Earnings available for ordinary shareholders
?
Less: Dividends 60,000 To retained earnings ?
Challenge Industries, Pty Ltd Ratios for the Year Ended 30 June 2012
Ratio Value Total asset turnover 2.00 Gross profit margin 40% Inventory turnover 10 Current ratio 1.60 Net profit margin 3.75% Return on common equity 12.5%
Full file at http://testbankonline.eu/Solution-Manual-for-Introduction-to-Corporate-Finance--Australia-and-New-Zealand-1st-Edition-by-Chris-Adam
Instructor’s Manual
© 2014 Cengage Learning. All Rights Reserved. May not be copied, scanned, or duplicated or posted to a publicly accessible website, in whole or in part.
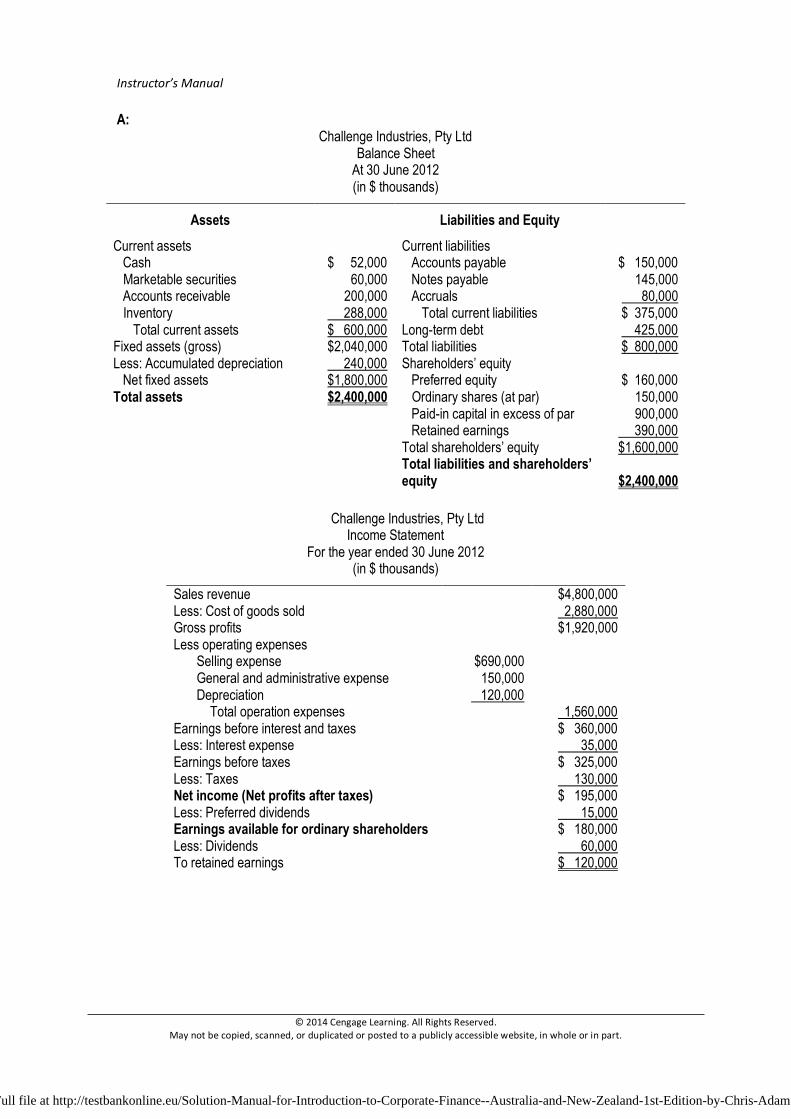
A: Challenge Industries, Pty Ltd
Balance Sheet At 30 June 2012 (in $ thousands)
Assets Liabilities and Equity
Current assets Current liabilities Cash $ 52,000 Accounts payable $ 150,000 Marketable securities 60,000 Notes payable 145,000 Accounts receivable 200,000 Accruals 80,000 Inventory 288,000 Total current liabilities $ 375,000 Total current assets $ 600,000 Long-term debt 425,000 Fixed assets (gross) $2,040,000 Total liabilities $ 800,000 Less: Accumulated depreciation 240,000 Shareholders’ equity Net fixed assets $1,800,000 Preferred equity $ 160,000 Total assets $2,400,000 Ordinary shares (at par) 150,000 Paid-in capital in excess of par 900,000 Retained earnings 390,000 Total shareholders’ equity $1,600,000 Total liabilities and shareholders’
equity
$2,400,000
Challenge Industries, Pty Ltd Income Statement
For the year ended 30 June 2012 (in $ thousands)
Sales revenue $4,800,000 Less: Cost of goods sold 2,880,000 Gross profits $1,920,000 Less operating expenses Selling expense $690,000 General and administrative expense 150,000 Depreciation 120,000 Total operation expenses 1,560,000 Earnings before interest and taxes $ 360,000 Less: Interest expense 35,000 Earnings before taxes $ 325,000 Less: Taxes 130,000 Net income (Net profits after taxes) $ 195,000 Less: Preferred dividends 15,000 Earnings available for ordinary shareholders $ 180,000 Less: Dividends 60,000 To retained earnings $ 120,000
Full file at http://testbankonline.eu/Solution-Manual-for-Introduction-to-Corporate-Finance--Australia-and-New-Zealand-1st-Edition-by-Chris-Adam
Chapter 2 Financial Statement and Cash Flow Analysis
© 2014 Cengage Learning. All Rights Reserved. May not be copied, scanned, or duplicated or posted to a publicly accessible website, in whole or in part.
Answers to End-of-Chapter Questions Q2-1. What information (explicit and implicit) can be derived from financial statement analysis? Does
the standardisation required by GAAP add greater validity to comparisons of financial data between companies and industries? Are there possible shortcomings to relying solely on financial statement analysis to value companies?
A2-1. Financial statement analysis provides information about the company’s financial health, and its
strengths and weaknesses. Using standardised GAAP rules does add validity by making comparisons between companies easier. Possible shortcomings include: • If a company is in multiple lines of business it may be difficult to make comparisons • The accounting data may not be accurate • Average performance may not be a good measure, especially if the industry is in a slump • It is possible to manipulate accounting numbers.
Q2-2. Distinguish between the types of financial information contained in the various financial
statements. Which statements provide information on a company’s performance over a reporting period, and which present data on a company’s current position? What sorts of valuable information may be found in the notes to financial statements? Describe a situation in which the information contained in the notes would be essential to making an informed decision about the value of a corporation.
A2-2. Data on a company’s performance over a reporting period: income statement, statement of
cash flows, statement of retained earnings (how much additional retained earnings will be added to existing retained earnings). Data on a company’s performance about the company’s current position: balance sheet.
Notes to the financial statements contain details about the composition and cost of the company’s debt, any liabilities such as lawsuits that are still pending, revenue recognition, taxes, significant clients, detailed breakdowns of fixed asset accounts, executive compensation, and descriptions of employee benefit plans. An example of a situation in which the notes would be essential to valuation would be a company that relied on a few clients, rather than a wide base of clients. The notes would detail current and expected revenue from those clients and how that revenue would be recognised. An analyst would need this information to develop a set of cash flows for the company which would provide the basis of a company valuation.
Q2-3. If you were a commercial credit analyst charged with the responsibility of making an accept/reject decision on a company’s loan request, which financial statement would you be most concerned with? Which financial statement is most likely to provide pertinent information about a company’s ability to repay its debt?
A2-3. An analyst looking at granting a loan request would be most interested in the company’s balance sheet, which she could use to compute liquidity ratios (current and quick ratios) and debt ratios. A credit analyst would also want an income statement with EBIT and interest with which to compute times interest earned. Times interest earned is a measure of how well a company can pay its interest obligations, while liquidity and debt ratios show what assets are available to repay debt.
Q2-4. What is operating cash flow (OCF)? How is it calculated? What is free cash flow (FCF)? How is
it calculated from operating cash flow (OCF)? Why do financial managers focus attention on the value of FCF?
A2-4. Operating cash flow is earnings before interest and taxes minus taxes plus depreciation.
Financial analysts like this measure because it uses only operating flows, with no financing cash
Full file at http://testbankonline.eu/Solution-Manual-for-Introduction-to-Corporate-Finance--Australia-and-New-Zealand-1st-Edition-by-Chris-Adam
Instructor’s Manual
© 2014 Cengage Learning. All Rights Reserved. May not be copied, scanned, or duplicated or posted to a publicly accessible website, in whole or in part.
flows like interest. This makes it easier to separate the effects of operating decisions from those from financing decisions. Free Cash Flow (FCF) is the Operating Cash Flow (OCF) minus the amount of the company’s net investments in fixed and current assets. The larger the company’s FCF, the better positioned the company is for growth, debt repayment, and dividend payouts.
Q2-5. Describe the common definitions of ‘inflows of cash’ and ‘outflows of cash’ used by analysts to
classify certain balance sheet changes and income statement values. What three categories of cash flow are used in the statement of cash flows? To what value should the net value in the statement of cash flows reconcile?
A2-5. A cash inflow is an increase in liabilities or a decrease in assets. A cash outflow occurs when
there is a decrease in liabilities or an increase in assets. A statement of cash flows is divided into operating cash flows, financing cash flows and investment cash flows. For a historical statement of cash flows, the cash outflows for the period must equal the cash inflows for the period.
Q2-6. What precautions must one take when using ratio analysis to make financial decisions? Which
ratios would be most useful for a financial manager’s internal financial analysis? For an analyst trying to decide on which shares are most attractive within an industry?
A2-6. With ratio analysis it is important to know the reliability of the data and the methods of
accounting used to provide data for the analysis. A manager interested in internal control will focus on activity ratios, which measure the company’s efficiency in its use of its assets, and profitability ratios, which show a company’s returns. A financial analyst may be more interested in market ratios such as price to earnings, price to sales, or price to book value, which show how the market is evaluating the company.
Q2-7. How do analysts use ratios to analyse a company’s financial leverage? Which ratios convey
more important information to a credit analyst – those revolving around the levels of indebtedness or those measuring the ability to meet the contractual payments associated with debt? What is the relationship between a company’s levels of indebtedness and risk? What must happen in order for an increase in financial leverage to be successful?
A2-7. Analysts use debt ratios to determine the company’s financial leverage – its use of debt financing. A credit analyst is going to be concerned with a company’s ability to repay its obligations. She will care about times interest earned which demonstrates the company’s ability to pay its interest, and current and quick ratio, which show how much in short term assets the company has compared to its short term liabilities. Financial leverage adds risk to a company – the more debt, the more risk, but also the more potential reward to shareholders. For an increase in financial leverage to be successful, the company must be profitable and earn enough to justify the additional interest expense.
Q2-8. How is the DuPont system useful in analysing a company’s ROA and ROE? What information
can be inferred from the decomposition of ROE into contributing ratios? What is the mathematical relationship between each of the individual components (net profit margin, total asset turnover, and assets-to-equity ratio) and ROE? Can ROE be raised without affecting ROA? How?
A2-8. The DuPont system is useful in breaking down ROE and ROA into its component parts. If ROE
is increasing (decreasing), a manager can see if the cause is a higher (lower) profit margin, a higher (lower) asset turnover or a higher (lower) equity multiplier. If one of the components is improving (declining) the company can take steps to pay attention to that area of the business.
Full file at http://testbankonline.eu/Solution-Manual-for-Introduction-to-Corporate-Finance--Australia-and-New-Zealand-1st-Edition-by-Chris-Adam
Chapter 2 Financial Statement and Cash Flow Analysis
© 2014 Cengage Learning. All Rights Reserved. May not be copied, scanned, or duplicated or posted to a publicly accessible website, in whole or in part.
ROE is equal to ROA times the equity multiplier. It would be possible to raise ROE by choosing to finance the company more aggressively, even if ROA remained the same.
Q2-9. Provide a general description of the tax rates applicable to Australian companies. What is the
difference between the average tax rate and the marginal tax rate? Which rate is relevant to financial decision making? Why? How do capital gains differ from ordinary corporate income?
A2-9. Under current tax laws the applicable tax rate for Australian companies is fixed at 30%. The average tax rate is calculated by dividing the company’s tax liability by its pretax income. The marginal tax rate is the amount of tax paid on an additional dollar of income generated. The marginal tax rate is relevant to financial decisions because it shows the tax the company will have to pay in case it generates any new cash flows. For Australian tax-paying companies, the marginal tax rate is also 30% because it applied to each dollar of company income. Ordinary corporate income is income resulting from the sale of the company’s goods and services, which is the corporation’s core business. Capital gains arise when companies sell capital assets, such as equipment or stock held as an investment, for more than their original purchase price. The amount of the capital gain would be equal to the difference between the sale price and initial purchase price. Basically, capital gains play the role of additional, extraordinary income.
Solutions to End-of-Chapter Problems Financial Statements P2-1. Obtain financial statements for Cochlear for the last five years from its web site
http://www.cochlear.com. First, look at the statements without reading the notes. Then, read the notes carefully, concentrating on those regarding executive share options. Do you have a different perspective after analysing these notes?
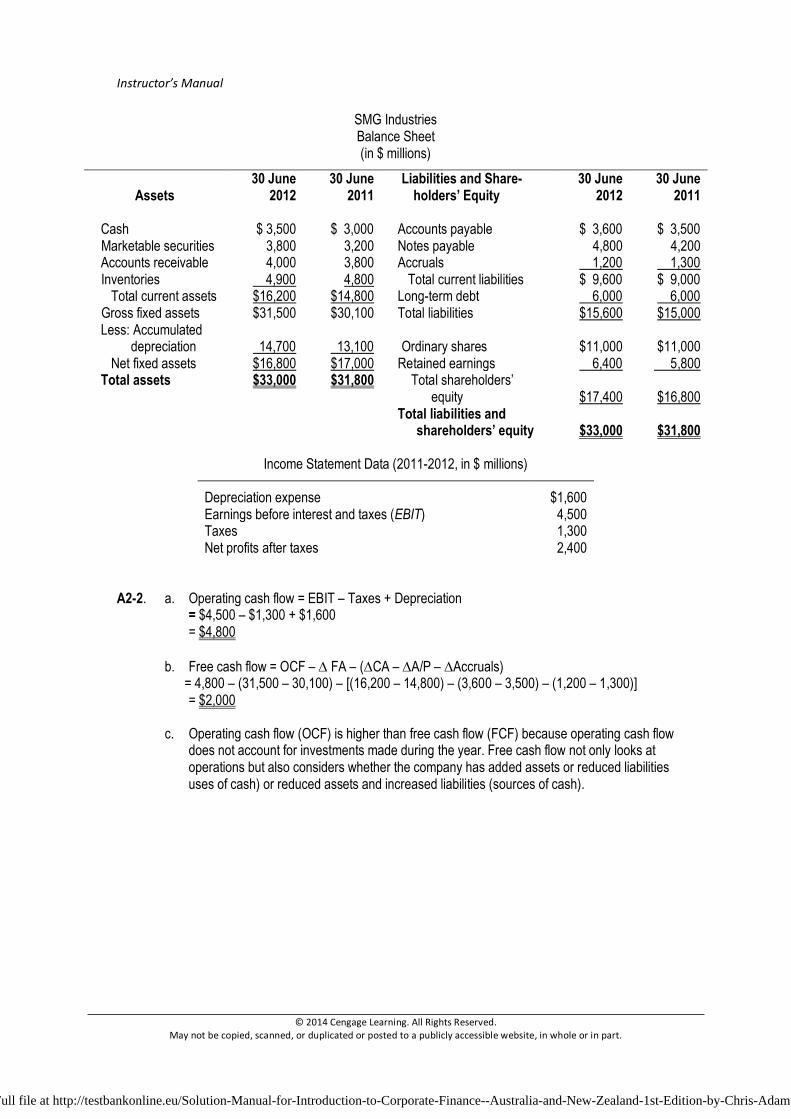
A2-1. Internet exercise – answers will vary. Cash Flow Analysis P2-2. Given the balance sheets and selected data from the income statement of SMG Industries that
follow, answer parts (a)–(c). a. Calculate the company’s operating cash flow (OCF) for the year ended 30 June 2012,
using Equation 2.2. b. Calculate the company’s free cash flow (FCF) for the year ended 30 June 2012, using
Equation 2.4. c. Interpret, compare, and contrast your cash flow estimates in parts (a) and (b).
Full file at http://testbankonline.eu/Solution-Manual-for-Introduction-to-Corporate-Finance--Australia-and-New-Zealand-1st-Edition-by-Chris-Adam
Instructor’s Manual
© 2014 Cengage Learning. All Rights Reserved. May not be copied, scanned, or duplicated or posted to a publicly accessible website, in whole or in part.
SMG Industries Balance Sheet (in $ millions)
Assets
30 June 2012
30 June 2011
Liabilities and Share-holders’ Equity
30 June 2012
30 June 2011
Cash $ 3,500 $ 3,000 Accounts payable $ 3,600 $ 3,500 Marketable securities 3,800 3,200 Notes payable 4,800 4,200 Accounts receivable 4,000 3,800 Accruals 1,200 1,300 Inventories 4,900 4,800 Total current liabilities $ 9,600 $ 9,000 Total current assets $16,200 $14,800 Long-term debt 6,000 6,000 Gross fixed assets $31,500 $30,100 Total liabilities $15,600 $15,000 Less: Accumulated depreciation
14,700
13,100 Ordinary shares $11,000 $11,000
Net fixed assets $16,800 $17,000 Retained earnings 6,400 5,800 Total assets $33,000 $31,800 Total shareholders’
equity
$17,400
$16,800 Total liabilities and
shareholders’ equity
$33,000
$31,800
Income Statement Data (2011-2012, in $ millions)
Depreciation expense $1,600 Earnings before interest and taxes (EBIT) 4,500 Taxes 1,300 Net profits after taxes 2,400
A2-2. a. Operating cash flow = EBIT – Taxes + Depreciation = $4,500 – $1,300 + $1,600 = $4,800
b. Free cash flow = OCF – ∆ FA – (∆CA – ∆A/P – ∆Accruals) = 4,800 – (31,500 – 30,100) – [(16,200 – 14,800) – (3,600 – 3,500) – (1,200 – 1,300)] = $2,000
c. Operating cash flow (OCF) is higher than free cash flow (FCF) because operating cash flow
does not account for investments made during the year. Free cash flow not only looks at operations but also considers whether the company has added assets or reduced liabilities uses of cash) or reduced assets and increased liabilities (sources of cash).
Full file at http://testbankonline.eu/Solution-Manual-for-Introduction-to-Corporate-Finance--Australia-and-New-Zealand-1st-Edition-by-Chris-Adam
Chapter 2 Financial Statement and Cash Flow Analysis
© 2014 Cengage Learning. All Rights Reserved. May not be copied, scanned, or duplicated or posted to a publicly accessible website, in whole or in part.
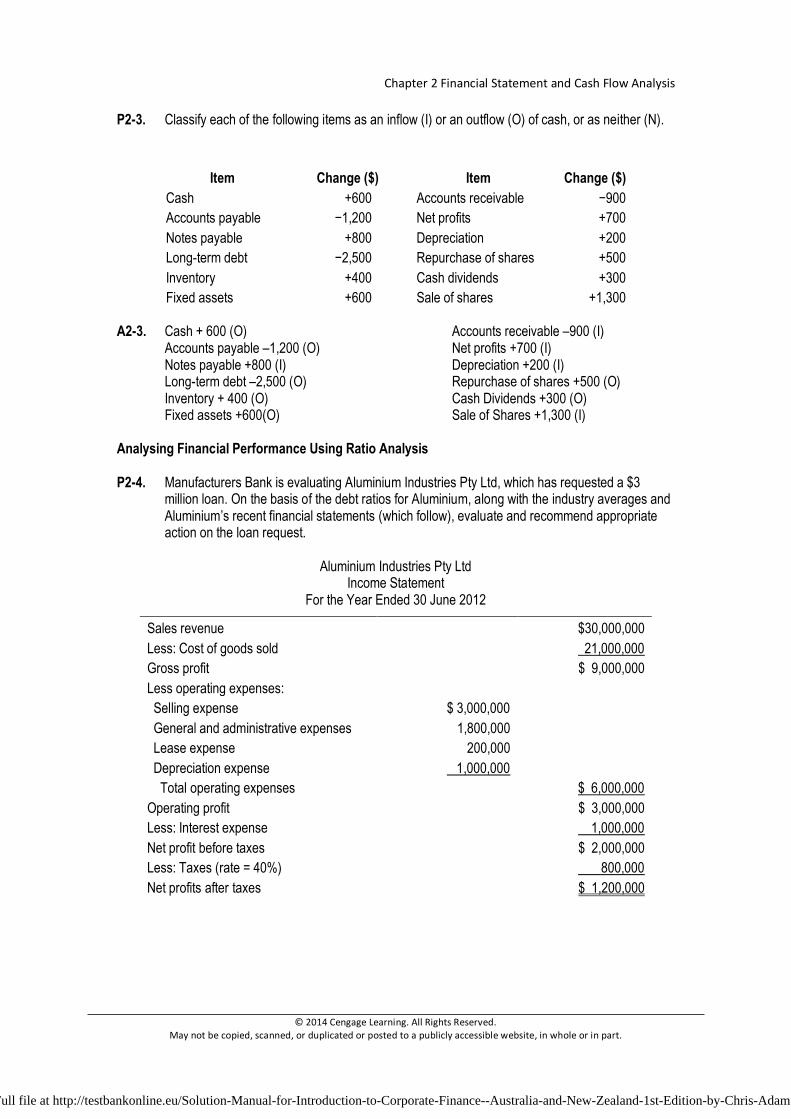
P2-3. Classify each of the following items as an inflow (I) or an outflow (O) of cash, or as neither (N).
Item Change ($) Item Change ($) Cash +600 Accounts receivable −900 Accounts payable −1,200 Net profits +700 Notes payable +800 Depreciation +200 Long-term debt −2,500 Repurchase of shares +500 Inventory +400 Cash dividends +300 Fixed assets +600 Sale of shares +1,300
A2-3. Cash + 600 (O) Accounts receivable –900 (I)
Accounts payable –1,200 (O) Net profits +700 (I) Notes payable +800 (I) Depreciation +200 (I) Long-term debt –2,500 (O) Repurchase of shares +500 (O) Inventory + 400 (O) Cash Dividends +300 (O) Fixed assets +600(O) Sale of Shares +1,300 (I)
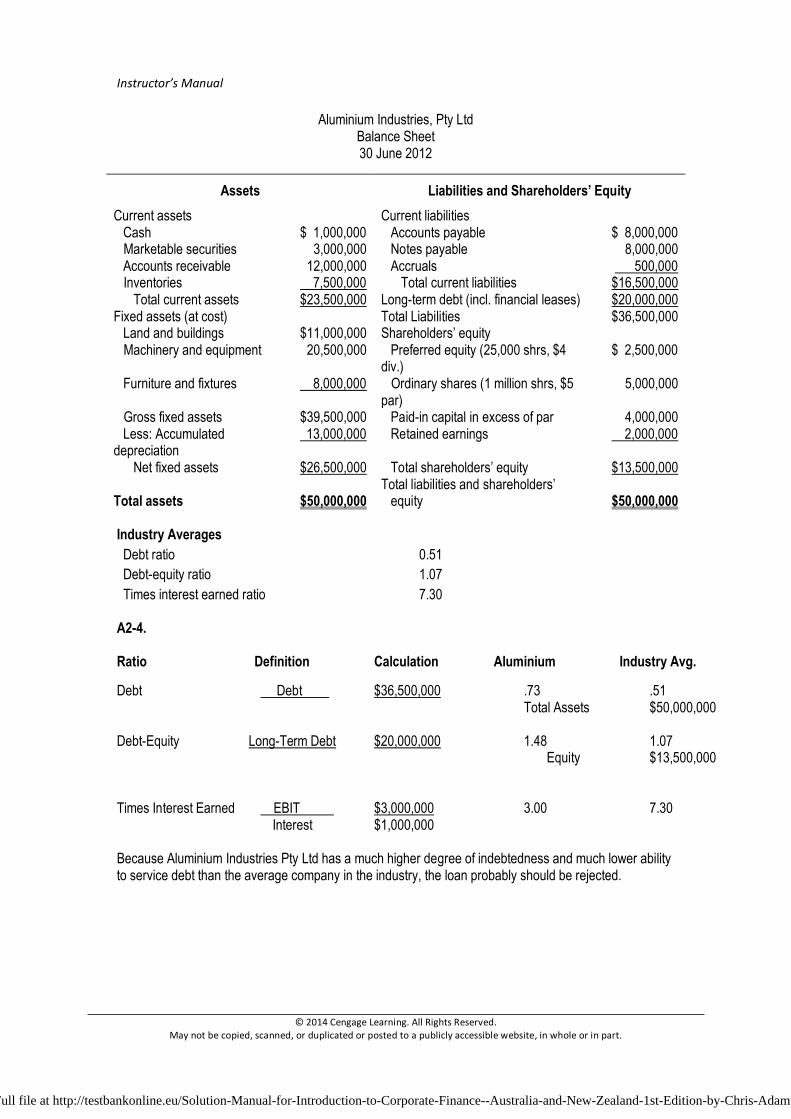
Analysing Financial Performance Using Ratio Analysis P2-4. Manufacturers Bank is evaluating Aluminium Industries Pty Ltd, which has requested a $3
million loan. On the basis of the debt ratios for Aluminium, along with the industry averages and Aluminium’s recent financial statements (which follow), evaluate and recommend appropriate action on the loan request.
Aluminium Industries Pty Ltd
Income Statement For the Year Ended 30 June 2012
Sales revenue $30,000,000 Less: Cost of goods sold 21,000,000 Gross profit $ 9,000,000 Less operating expenses: Selling expense $ 3,000,000 General and administrative expenses 1,800,000 Lease expense 200,000 Depreciation expense 1,000,000 Total operating expenses $ 6,000,000 Operating profit $ 3,000,000 Less: Interest expense 1,000,000 Net profit before taxes $ 2,000,000 Less: Taxes (rate = 40%) 800,000 Net profits after taxes $ 1,200,000
Full file at http://testbankonline.eu/Solution-Manual-for-Introduction-to-Corporate-Finance--Australia-and-New-Zealand-1st-Edition-by-Chris-Adam
Instructor’s Manual
© 2014 Cengage Learning. All Rights Reserved. May not be copied, scanned, or duplicated or posted to a publicly accessible website, in whole or in part.
Aluminium Industries, Pty Ltd Balance Sheet 30 June 2012
Assets Liabilities and Shareholders’ Equity Current assets Current liabilities Cash $ 1,000,000 Accounts payable $ 8,000,000 Marketable securities 3,000,000 Notes payable 8,000,000 Accounts receivable 12,000,000 Accruals 500,000 Inventories 7,500,000 Total current liabilities $16,500,000 Total current assets $23,500,000 Long-term debt (incl. financial leases) $20,000,000 Fixed assets (at cost) Total Liabilities $36,500,000 Land and buildings $11,000,000 Shareholders’ equity Machinery and equipment 20,500,000 Preferred equity (25,000 shrs, $4
div.) $ 2,500,000
Furniture and fixtures 8,000,000 Ordinary shares (1 million shrs, $5 par)
5,000,000
Gross fixed assets $39,500,000 Paid-in capital in excess of par 4,000,000 Less: Accumulated depreciation
13,000,000 Retained earnings 2,000,000
Net fixed assets $26,500,000 Total shareholders’ equity $13,500,000 Total liabilities and shareholders’ Total assets $50,000,000 equity $50,000,000 Industry Averages Debt ratio 0.51 Debt-equity ratio 1.07 Times interest earned ratio 7.30
A2-4. Ratio Definition Calculation Aluminium Industry Avg. Debt Debt $36,500,000 .73 .51 Total Assets $50,000,000 Debt-Equity Long-Term Debt $20,000,000 1.48 1.07 Equity $13,500,000 Times Interest Earned EBIT $3,000,000 3.00 7.30 Interest $1,000,000 Because Aluminium Industries Pty Ltd has a much higher degree of indebtedness and much lower ability to service debt than the average company in the industry, the loan probably should be rejected.
Full file at http://testbankonline.eu/Solution-Manual-for-Introduction-to-Corporate-Finance--Australia-and-New-Zealand-1st-Edition-by-Chris-Adam
Chapter 2 Financial Statement and Cash Flow Analysis
© 2014 Cengage Learning. All Rights Reserved. May not be copied, scanned, or duplicated or posted to a publicly accessible website, in whole or in part.
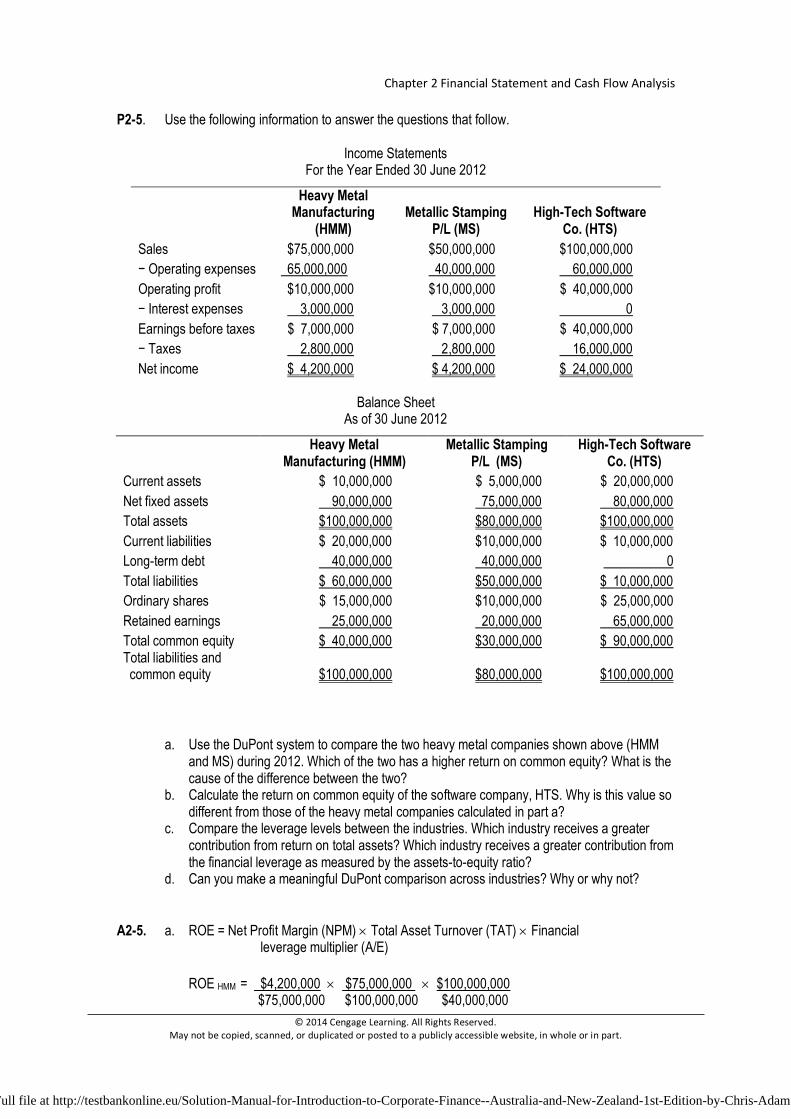
P2-5. Use the following information to answer the questions that follow.
Income Statements For the Year Ended 30 June 2012
Heavy Metal Manufacturing
(HMM) Metallic Stamping
P/L (MS) High-Tech Software
Co. (HTS) Sales $75,000,000 $50,000,000 $100,000,000 − Operating expenses 65,000,000 40,000,000 60,000,000 Operating profit $10,000,000 $10,000,000 $ 40,000,000 − Interest expenses 3,000,000 3,000,000 0 Earnings before taxes $ 7,000,000 $ 7,000,000 $ 40,000,000 − Taxes 2,800,000 2,800,000 16,000,000 Net income $ 4,200,000 $ 4,200,000 $ 24,000,000
Balance Sheet
As of 30 June 2012
Heavy Metal
Manufacturing (HMM) Metallic Stamping
P/L (MS) High-Tech Software
Co. (HTS) Current assets $ 10,000,000 $ 5,000,000 $ 20,000,000 Net fixed assets 90,000,000 75,000,000 80,000,000 Total assets $100,000,000 $80,000,000 $100,000,000 Current liabilities $ 20,000,000 $10,000,000 $ 10,000,000 Long-term debt 40,000,000 40,000,000 0 Total liabilities $ 60,000,000 $50,000,000 $ 10,000,000 Ordinary shares $ 15,000,000 $10,000,000 $ 25,000,000 Retained earnings 25,000,000 20,000,000 65,000,000 Total common equity $ 40,000,000 $30,000,000 $ 90,000,000 Total liabilities and common equity $100,000,000 $80,000,000 $100,000,000
a. Use the DuPont system to compare the two heavy metal companies shown above (HMM and MS) during 2012. Which of the two has a higher return on common equity? What is the cause of the difference between the two?
b. Calculate the return on common equity of the software company, HTS. Why is this value so different from those of the heavy metal companies calculated in part a?
c. Compare the leverage levels between the industries. Which industry receives a greater contribution from return on total assets? Which industry receives a greater contribution from the financial leverage as measured by the assets-to-equity ratio?
d. Can you make a meaningful DuPont comparison across industries? Why or why not?
A2-5. a. ROE = Net Profit Margin (NPM) × Total Asset Turnover (TAT) × Financial leverage multiplier (A/E)
ROE HMM = $4,200,000 × $75,000,000 × $100,000,000 $75,000,000 $100,000,000 $40,000,000
Full file at http://testbankonline.eu/Solution-Manual-for-Introduction-to-Corporate-Finance--Australia-and-New-Zealand-1st-Edition-by-Chris-Adam
Instructor’s Manual
© 2014 Cengage Learning. All Rights Reserved. May not be copied, scanned, or duplicated or posted to a publicly accessible website, in whole or in part.
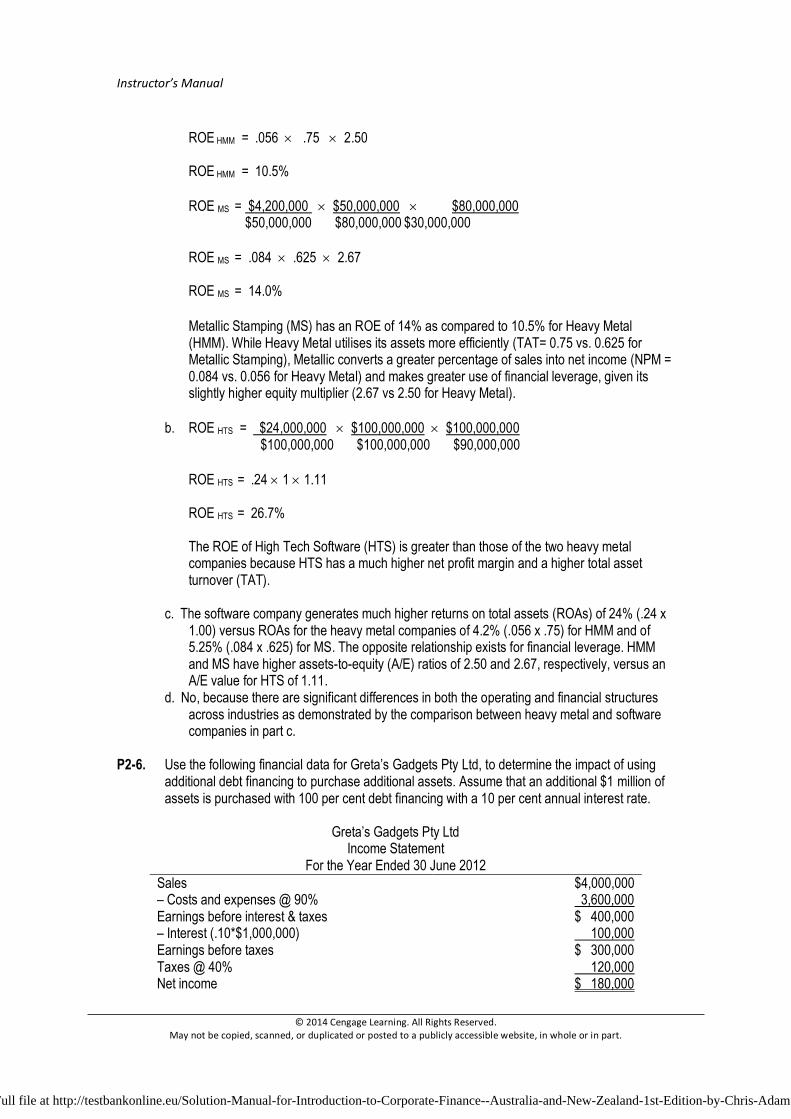
ROE HMM = .056 × .75 × 2.50 ROE HMM = 10.5% ROE MS = $4,200,000 × $50,000,000 × $80,000,000 $50,000,000 $80,000,000 $30,000,000 ROE MS = .084 × .625 × 2.67 ROE MS = 14.0% Metallic Stamping (MS) has an ROE of 14% as compared to 10.5% for Heavy Metal (HMM). While Heavy Metal utilises its assets more efficiently (TAT= 0.75 vs. 0.625 for Metallic Stamping), Metallic converts a greater percentage of sales into net income (NPM = 0.084 vs. 0.056 for Heavy Metal) and makes greater use of financial leverage, given its slightly higher equity multiplier (2.67 vs 2.50 for Heavy Metal).
b. ROE HTS = $24,000,000 × $100,000,000 × $100,000,000 $100,000,000 $100,000,000 $90,000,000 ROE HTS = .24 × 1 × 1.11 ROE HTS = 26.7%
The ROE of High Tech Software (HTS) is greater than those of the two heavy metal companies because HTS has a much higher net profit margin and a higher total asset turnover (TAT).
c. The software company generates much higher returns on total assets (ROAs) of 24% (.24 x 1.00) versus ROAs for the heavy metal companies of 4.2% (.056 x .75) for HMM and of 5.25% (.084 x .625) for MS. The opposite relationship exists for financial leverage. HMM and MS have higher assets-to-equity (A/E) ratios of 2.50 and 2.67, respectively, versus an A/E value for HTS of 1.11.
d. No, because there are significant differences in both the operating and financial structures across industries as demonstrated by the comparison between heavy metal and software companies in part c.
P2-6. Use the following financial data for Greta’s Gadgets Pty Ltd, to determine the impact of using
additional debt financing to purchase additional assets. Assume that an additional $1 million of assets is purchased with 100 per cent debt financing with a 10 per cent annual interest rate.
Greta’s Gadgets Pty Ltd
Income Statement For the Year Ended 30 June 2012
Sales $4,000,000 – Costs and expenses @ 90% 3,600,000 Earnings before interest & taxes $ 400,000 – Interest (.10*$1,000,000) 100,000 Earnings before taxes $ 300,000 Taxes @ 40% 120,000 Net income $ 180,000
Full file at http://testbankonline.eu/Solution-Manual-for-Introduction-to-Corporate-Finance--Australia-and-New-Zealand-1st-Edition-by-Chris-Adam
Chapter 2 Financial Statement and Cash Flow Analysis
© 2014 Cengage Learning. All Rights Reserved. May not be copied, scanned, or duplicated or posted to a publicly accessible website, in whole or in part.
Greta’s Gadgets Pty Ltd Balance Sheet
As of 30 June 2012
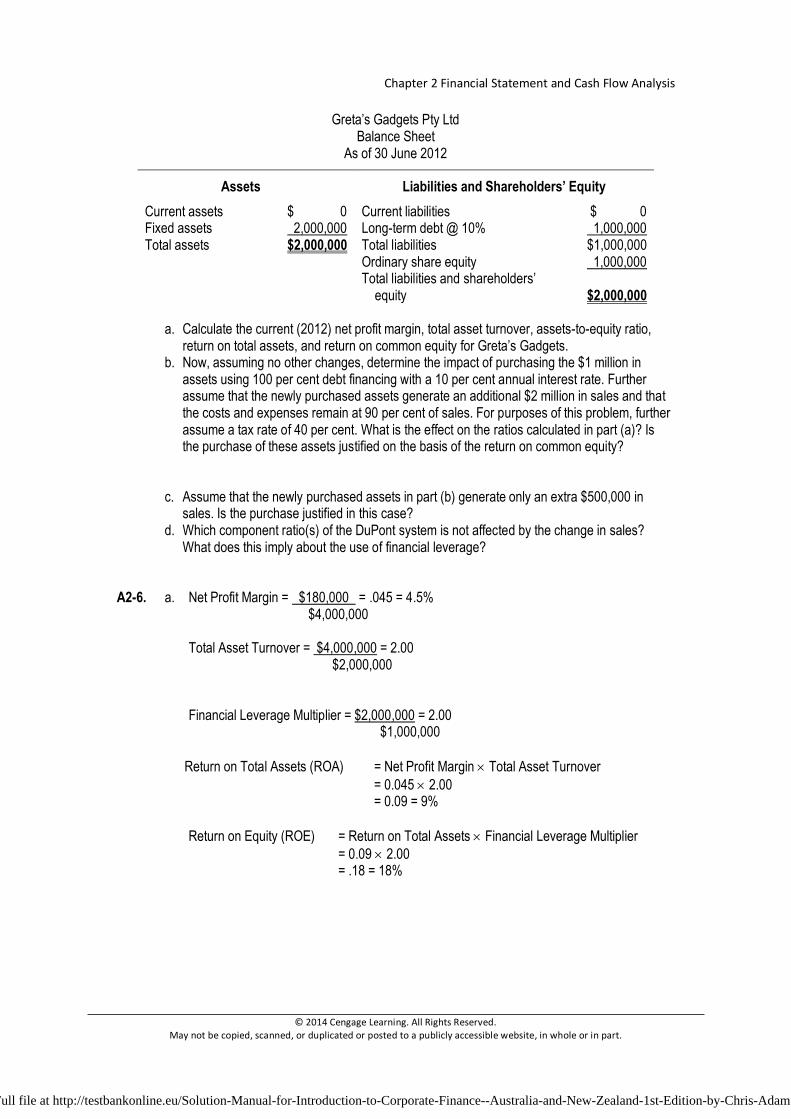
Assets Liabilities and Shareholders’ Equity Current assets $ 0 Current liabilities $ 0 Fixed assets 2,000,000 Long-term debt @ 10% 1,000,000 Total assets $2,000,000 Total liabilities $1,000,000 Ordinary share equity 1,000,000 Total liabilities and shareholders’
equity
$2,000,000
a. Calculate the current (2012) net profit margin, total asset turnover, assets-to-equity ratio, return on total assets, and return on common equity for Greta’s Gadgets.
b. Now, assuming no other changes, determine the impact of purchasing the $1 million in assets using 100 per cent debt financing with a 10 per cent annual interest rate. Further assume that the newly purchased assets generate an additional $2 million in sales and that the costs and expenses remain at 90 per cent of sales. For purposes of this problem, further assume a tax rate of 40 per cent. What is the effect on the ratios calculated in part (a)? Is the purchase of these assets justified on the basis of the return on common equity?
c. Assume that the newly purchased assets in part (b) generate only an extra $500,000 in
sales. Is the purchase justified in this case? d. Which component ratio(s) of the DuPont system is not affected by the change in sales?
What does this imply about the use of financial leverage?
A2-6. a. Net Profit Margin = $180,000 = .045 = 4.5% $4,000,000
Total Asset Turnover = $4,000,000 = 2.00 $2,000,000 Financial Leverage Multiplier = $2,000,000 = 2.00 $1,000,000 Return on Total Assets (ROA) = Net Profit Margin × Total Asset Turnover = 0.045 × 2.00 = 0.09 = 9% Return on Equity (ROE) = Return on Total Assets × Financial Leverage Multiplier = 0.09 × 2.00 = .18 = 18%
Full file at http://testbankonline.eu/Solution-Manual-for-Introduction-to-Corporate-Finance--Australia-and-New-Zealand-1st-Edition-by-Chris-Adam
Instructor’s Manual
© 2014 Cengage Learning. All Rights Reserved. May not be copied, scanned, or duplicated or posted to a publicly accessible website, in whole or in part.
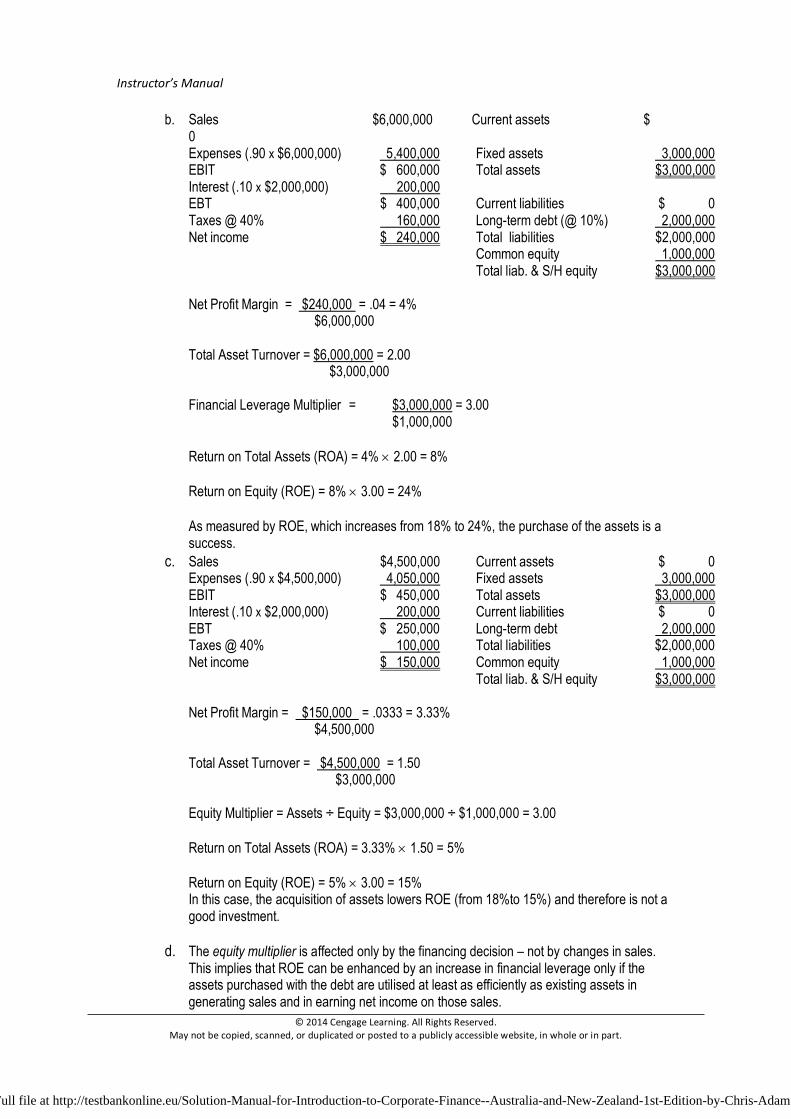
b. Sales $6,000,000 Current assets $ 0
Expenses (.90 x $6,000,000) 5,400,000 Fixed assets 3,000,000 EBIT $ 600,000 Total assets $3,000,000 Interest (.10 x $2,000,000) 200,000 EBT $ 400,000 Current liabilities $ 0 Taxes @ 40% 160,000 Long-term debt (@ 10%) 2,000,000 Net income $ 240,000 Total liabilities $2,000,000 Common equity 1,000,000 Total liab. & S/H equity $3,000,000 Net Profit Margin = $240,000 = .04 = 4% $6,000,000 Total Asset Turnover = $6,000,000 = 2.00 $3,000,000 Financial Leverage Multiplier = $3,000,000 = 3.00 $1,000,000 Return on Total Assets (ROA) = 4% × 2.00 = 8% Return on Equity (ROE) = 8% × 3.00 = 24% As measured by ROE, which increases from 18% to 24%, the purchase of the assets is a
success. c. Sales $4,500,000 Current assets $ 0 Expenses (.90 x $4,500,000) 4,050,000 Fixed assets 3,000,000 EBIT $ 450,000 Total assets $3,000,000 Interest (.10 x $2,000,000) 200,000 Current liabilities $ 0 EBT $ 250,000 Long-term debt 2,000,000 Taxes @ 40% 100,000 Total liabilities $2,000,000 Net income $ 150,000 Common equity 1,000,000 Total liab. & S/H equity $3,000,000
Net Profit Margin = $150,000 = .0333 = 3.33% $4,500,000 Total Asset Turnover = $4,500,000 = 1.50 $3,000,000 Equity Multiplier = Assets ÷ Equity = $3,000,000 ÷ $1,000,000 = 3.00 Return on Total Assets (ROA) = 3.33% × 1.50 = 5% Return on Equity (ROE) = 5% × 3.00 = 15% In this case, the acquisition of assets lowers ROE (from 18%to 15%) and therefore is not a
good investment. d. The equity multiplier is affected only by the financing decision – not by changes in sales.
This implies that ROE can be enhanced by an increase in financial leverage only if the assets purchased with the debt are utilised at least as efficiently as existing assets in generating sales and in earning net income on those sales.
Full file at http://testbankonline.eu/Solution-Manual-for-Introduction-to-Corporate-Finance--Australia-and-New-Zealand-1st-Edition-by-Chris-Adam
Chapter 2 Financial Statement and Cash Flow Analysis
© 2014 Cengage Learning. All Rights Reserved. May not be copied, scanned, or duplicated or posted to a publicly accessible website, in whole or in part.
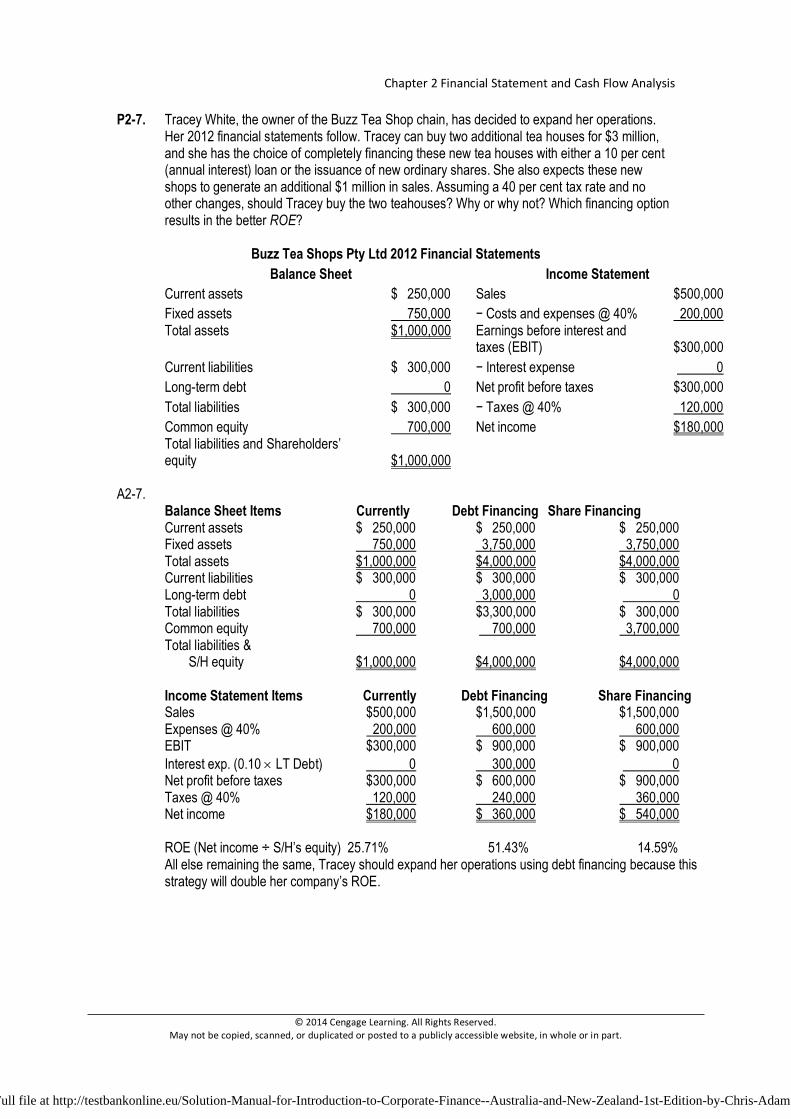
P2-7. Tracey White, the owner of the Buzz Tea Shop chain, has decided to expand her operations. Her 2012 financial statements follow. Tracey can buy two additional tea houses for $3 million, and she has the choice of completely financing these new tea houses with either a 10 per cent (annual interest) loan or the issuance of new ordinary shares. She also expects these new shops to generate an additional $1 million in sales. Assuming a 40 per cent tax rate and no other changes, should Tracey buy the two teahouses? Why or why not? Which financing option results in the better ROE?
Buzz Tea Shops Pty Ltd 2012 Financial Statements
Balance Sheet Income Statement Current assets $ 250,000 Sales $500,000 Fixed assets 750,000 − Costs and expenses @ 40% 200,000 Total assets $1,000,000 Earnings before interest and
taxes (EBIT) $300,000 Current liabilities $ 300,000 − Interest expense 0 Long-term debt 0 Net profit before taxes $300,000 Total liabilities $ 300,000 − Taxes @ 40% 120,000 Common equity 700,000 Net income $180,000 Total liabilities and Shareholders’ equity $1,000,000
A2-7.
Balance Sheet Items Currently Debt Financing Share Financing Current assets $ 250,000 $ 250,000 $ 250,000 Fixed assets 750,000 3,750,000 3,750,000 Total assets $1,000,000 $4,000,000 $4,000,000 Current liabilities $ 300,000 $ 300,000 $ 300,000 Long-term debt 0 3,000,000 0 Total liabilities $ 300,000 $3,300,000 $ 300,000 Common equity 700,000 700,000 3,700,000 Total liabilities &
S/H equity $1,000,000 $4,000,000 $4,000,000 Income Statement Items Currently Debt Financing Share Financing
Sales $500,000 $1,500,000 $1,500,000 Expenses @ 40% 200,000 600,000 600,000 EBIT $300,000 $ 900,000 $ 900,000 Interest exp. (0.10 × LT Debt) 0 300,000 0 Net profit before taxes $300,000 $ 600,000 $ 900,000 Taxes @ 40% 120,000 240,000 360,000 Net income $180,000 $ 360,000 $ 540,000 ROE (Net income ÷ S/H’s equity) 25.71% 51.43% 14.59% All else remaining the same, Tracey should expand her operations using debt financing because this strategy will double her company’s ROE.
Full file at http://testbankonline.eu/Solution-Manual-for-Introduction-to-Corporate-Finance--Australia-and-New-Zealand-1st-Edition-by-Chris-Adam
Instructor’s Manual
© 2014 Cengage Learning. All Rights Reserved. May not be copied, scanned, or duplicated or posted to a publicly accessible website, in whole or in part.
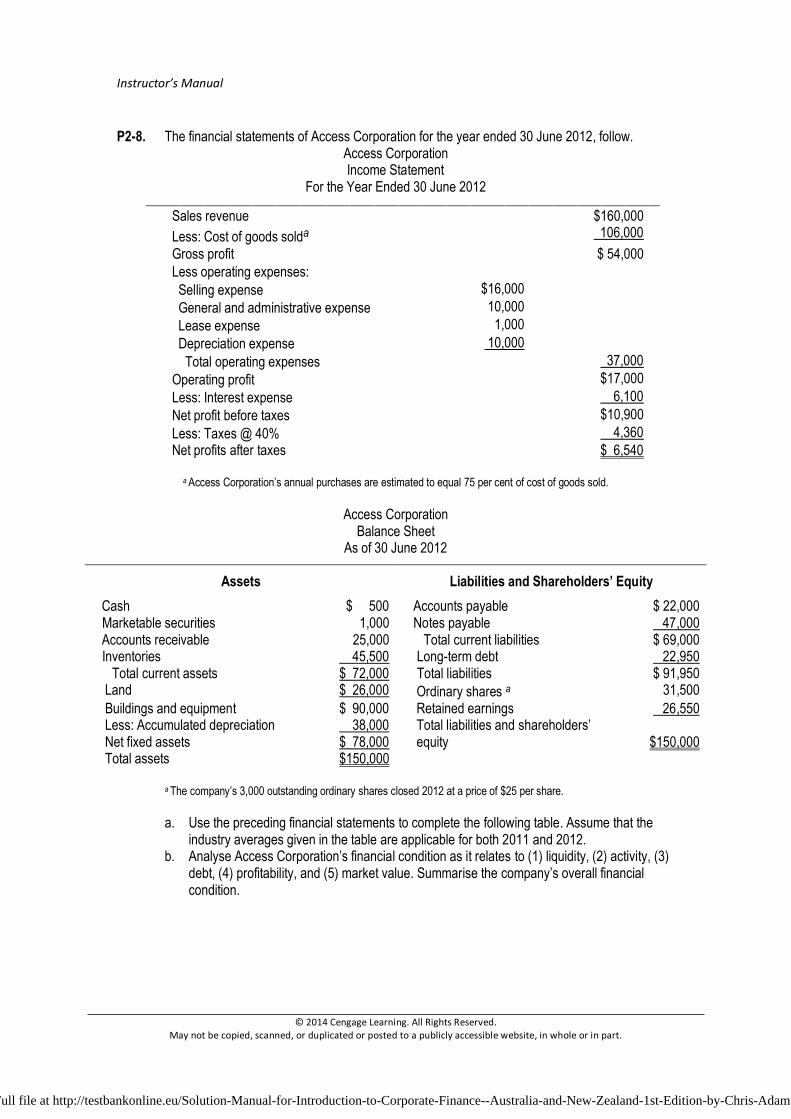
P2-8. The financial statements of Access Corporation for the year ended 30 June 2012, follow.
Access Corporation Income Statement
For the Year Ended 30 June 2012 __________________________________________________________________________________________________________ .
Sales revenue $160,000 Less: Cost of goods solda 106,000 Gross profit $ 54,000 Less operating expenses: Selling expense $16,000 General and administrative expense 10,000 Lease expense 1,000 Depreciation expense 10,000 Total operating expenses 37,000 Operating profit $17,000 Less: Interest expense 6,100 Net profit before taxes $10,900 Less: Taxes @ 40% 4,360 Net profits after taxes $ 6,540
a Access Corporation’s annual purchases are estimated to equal 75 per cent of cost of goods sold.
Access Corporation
Balance Sheet As of 30 June 2012
Assets Liabilities and Shareholders’ Equity Cash $ 500 Accounts payable $ 22,000 Marketable securities 1,000 Notes payable 47,000 Accounts receivable 25,000 Total current liabilities $ 69,000 Inventories 45,500 Long-term debt 22,950 Total current assets $ 72,000 Total liabilities $ 91,950
Land $ 26,000 Ordinary shares a 31,500 Buildings and equipment $ 90,000 Retained earnings 26,550 Less: Accumulated depreciation 38,000 Total liabilities and shareholders’ Net fixed assets $ 78,000 equity $150,000 Total assets $150,000
a The company’s 3,000 outstanding ordinary shares closed 2012 at a price of $25 per share.
a. Use the preceding financial statements to complete the following table. Assume that the industry averages given in the table are applicable for both 2011 and 2012.
b. Analyse Access Corporation’s financial condition as it relates to (1) liquidity, (2) activity, (3) debt, (4) profitability, and (5) market value. Summarise the company’s overall financial condition.
Full file at http://testbankonline.eu/Solution-Manual-for-Introduction-to-Corporate-Finance--Australia-and-New-Zealand-1st-Edition-by-Chris-Adam
Chapter 2 Financial Statement and Cash Flow Analysis
© 2014 Cengage Learning. All Rights Reserved. May not be copied, scanned, or duplicated or posted to a publicly accessible website, in whole or in part.
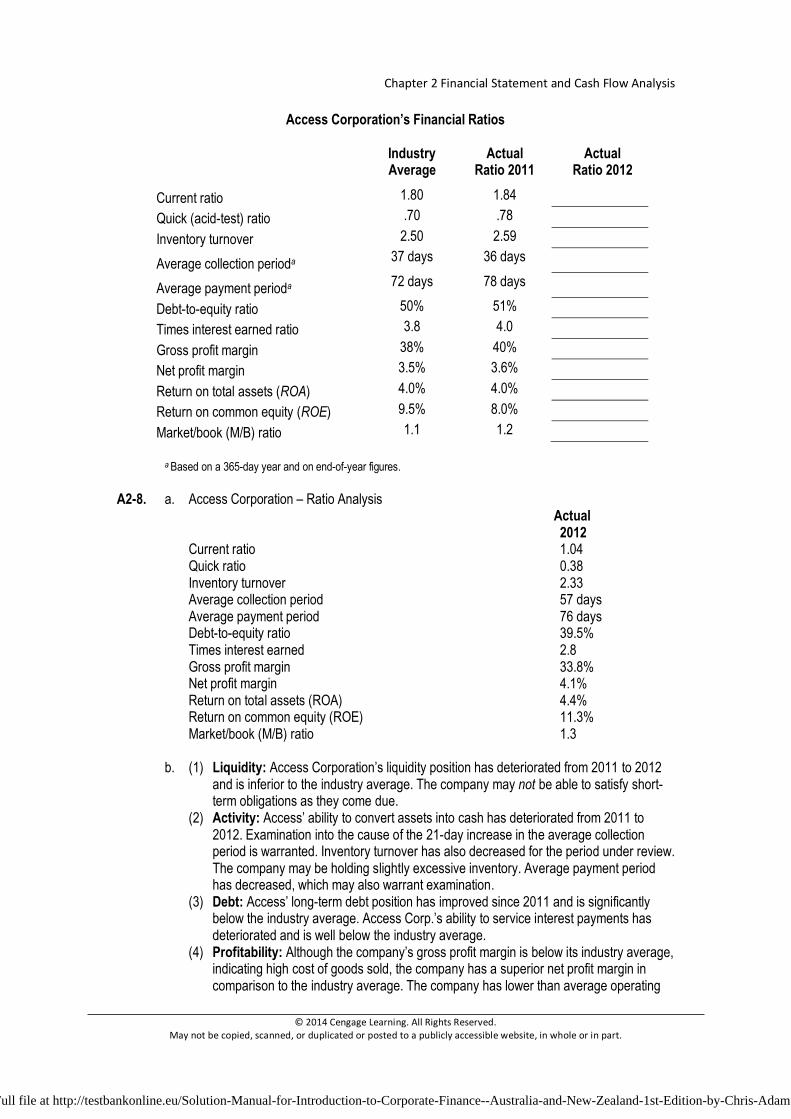
Access Corporation’s Financial Ratios
Industry Average
Actual Ratio 2011
Actual Ratio 2012
Current ratio 1.80 1.84 Quick (acid-test) ratio .70 .78 Inventory turnover 2.50 2.59
Average collection perioda 37 days 36 days
Average payment perioda 72 days 78 days
Debt-to-equity ratio 50% 51% Times interest earned ratio 3.8 4.0 Gross profit margin 38% 40% Net profit margin 3.5% 3.6% Return on total assets (ROA) 4.0% 4.0% Return on common equity (ROE) 9.5% 8.0% Market/book (M/B) ratio 1.1 1.2
a Based on a 365-day year and on end-of-year figures. A2-8. a. Access Corporation – Ratio Analysis Actual 2012
Current ratio 1.04 Quick ratio 0.38 Inventory turnover 2.33 Average collection period 57 days Average payment period 76 days Debt-to-equity ratio 39.5% Times interest earned 2.8 Gross profit margin 33.8% Net profit margin 4.1% Return on total assets (ROA) 4.4% Return on common equity (ROE) 11.3% Market/book (M/B) ratio 1.3
b. (1) Liquidity: Access Corporation’s liquidity position has deteriorated from 2011 to 2012
and is inferior to the industry average. The company may not be able to satisfy short-term obligations as they come due.
(2) Activity: Access’ ability to convert assets into cash has deteriorated from 2011 to 2012. Examination into the cause of the 21-day increase in the average collection period is warranted. Inventory turnover has also decreased for the period under review. The company may be holding slightly excessive inventory. Average payment period has decreased, which may also warrant examination.
(3) Debt: Access’ long-term debt position has improved since 2011 and is significantly below the industry average. Access Corp.’s ability to service interest payments has deteriorated and is well below the industry average.
(4) Profitability: Although the company’s gross profit margin is below its industry average, indicating high cost of goods sold, the company has a superior net profit margin in comparison to the industry average. The company has lower than average operating
Full file at http://testbankonline.eu/Solution-Manual-for-Introduction-to-Corporate-Finance--Australia-and-New-Zealand-1st-Edition-by-Chris-Adam
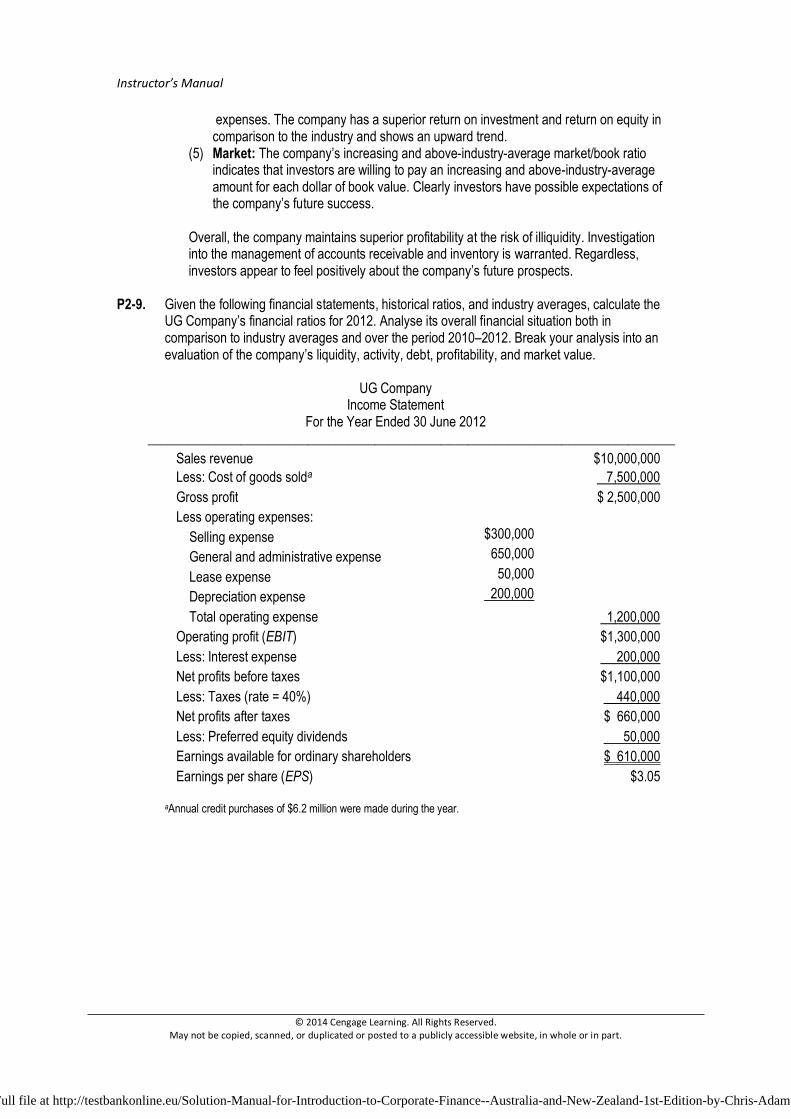
Instructor’s Manual
© 2014 Cengage Learning. All Rights Reserved. May not be copied, scanned, or duplicated or posted to a publicly accessible website, in whole or in part.
expenses. The company has a superior return on investment and return on equity in comparison to the industry and shows an upward trend.
(5) Market: The company’s increasing and above-industry-average market/book ratio indicates that investors are willing to pay an increasing and above-industry-average amount for each dollar of book value. Clearly investors have possible expectations of the company’s future success.
Overall, the company maintains superior profitability at the risk of illiquidity. Investigation into the management of accounts receivable and inventory is warranted. Regardless, investors appear to feel positively about the company’s future prospects.
P2-9. Given the following financial statements, historical ratios, and industry averages, calculate the
UG Company’s financial ratios for 2012. Analyse its overall financial situation both in comparison to industry averages and over the period 2010–2012. Break your analysis into an evaluation of the company’s liquidity, activity, debt, profitability, and market value.
UG Company
Income Statement For the Year Ended 30 June 2012
_______________________________________________________________________________ Sales revenue $10,000,000 Less: Cost of goods solda 7,500,000 Gross profit $ 2,500,000 Less operating expenses: Selling expense $300,000 General and administrative expense 650,000 Lease expense 50,000 Depreciation expense 200,000 Total operating expense 1,200,000 Operating profit (EBIT) $1,300,000 Less: Interest expense 200,000 Net profits before taxes $1,100,000 Less: Taxes (rate = 40%) 440,000 Net profits after taxes $ 660,000 Less: Preferred equity dividends 50,000 Earnings available for ordinary shareholders $ 610,000 Earnings per share (EPS) $3.05
aAnnual credit purchases of $6.2 million were made during the year.
Full file at http://testbankonline.eu/Solution-Manual-for-Introduction-to-Corporate-Finance--Australia-and-New-Zealand-1st-Edition-by-Chris-Adam
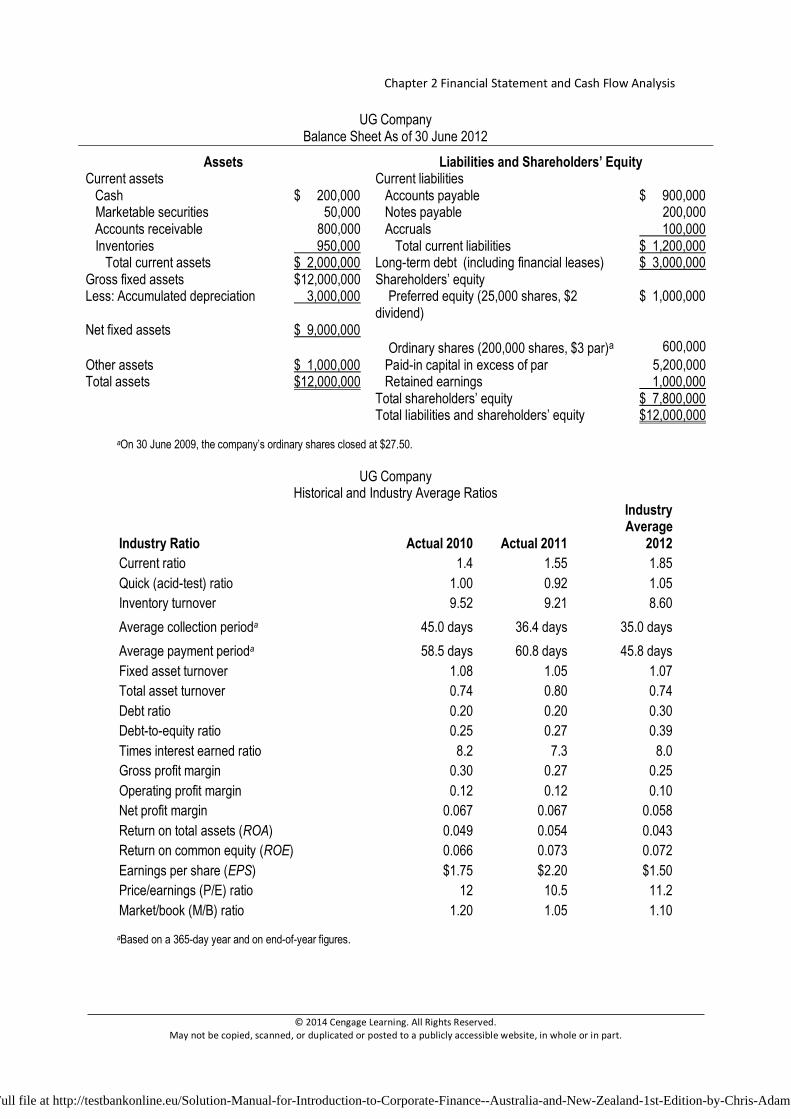
Chapter 2 Financial Statement and Cash Flow Analysis
© 2014 Cengage Learning. All Rights Reserved. May not be copied, scanned, or duplicated or posted to a publicly accessible website, in whole or in part.
UG Company Balance Sheet As of 30 June 2012
Assets Liabilities and Shareholders’ Equity Current assets Current liabilities Cash $ 200,000 Accounts payable $ 900,000 Marketable securities 50,000 Notes payable 200,000 Accounts receivable 800,000 Accruals 100,000 Inventories 950,000 Total current liabilities $ 1,200,000 Total current assets $ 2,000,000 Long-term debt (including financial leases) $ 3,000,000 Gross fixed assets $12,000,000 Shareholders’ equity Less: Accumulated depreciation 3,000,000 Preferred equity (25,000 shares, $2
dividend) $ 1,000,000
Net fixed assets $ 9,000,000 Ordinary shares (200,000 shares, $3 par)a 600,000 Other assets $ 1,000,000 Paid-in capital in excess of par 5,200,000 Total assets $12,000,000 Retained earnings 1,000,000 Total shareholders’ equity $ 7,800,000 Total liabilities and shareholders’ equity $12,000,000
aOn 30 June 2009, the company’s ordinary shares closed at $27.50.
UG Company Historical and Industry Average Ratios
Industry Ratio Actual 2010 Actual 2011
Industry Average
2012 Current ratio 1.4 1.55 1.85 Quick (acid-test) ratio 1.00 0.92 1.05 Inventory turnover 9.52 9.21 8.60 Average collection perioda 45.0 days 36.4 days 35.0 days Average payment perioda 58.5 days 60.8 days 45.8 days Fixed asset turnover 1.08 1.05 1.07 Total asset turnover 0.74 0.80 0.74 Debt ratio 0.20 0.20 0.30 Debt-to-equity ratio 0.25 0.27 0.39 Times interest earned ratio 8.2 7.3 8.0 Gross profit margin 0.30 0.27 0.25 Operating profit margin 0.12 0.12 0.10 Net profit margin 0.067 0.067 0.058 Return on total assets (ROA) 0.049 0.054 0.043 Return on common equity (ROE) 0.066 0.073 0.072 Earnings per share (EPS) $1.75 $2.20 $1.50 Price/earnings (P/E) ratio 12 10.5 11.2 Market/book (M/B) ratio 1.20 1.05 1.10
aBased on a 365-day year and on end-of-year figures.
Full file at http://testbankonline.eu/Solution-Manual-for-Introduction-to-Corporate-Finance--Australia-and-New-Zealand-1st-Edition-by-Chris-Adam
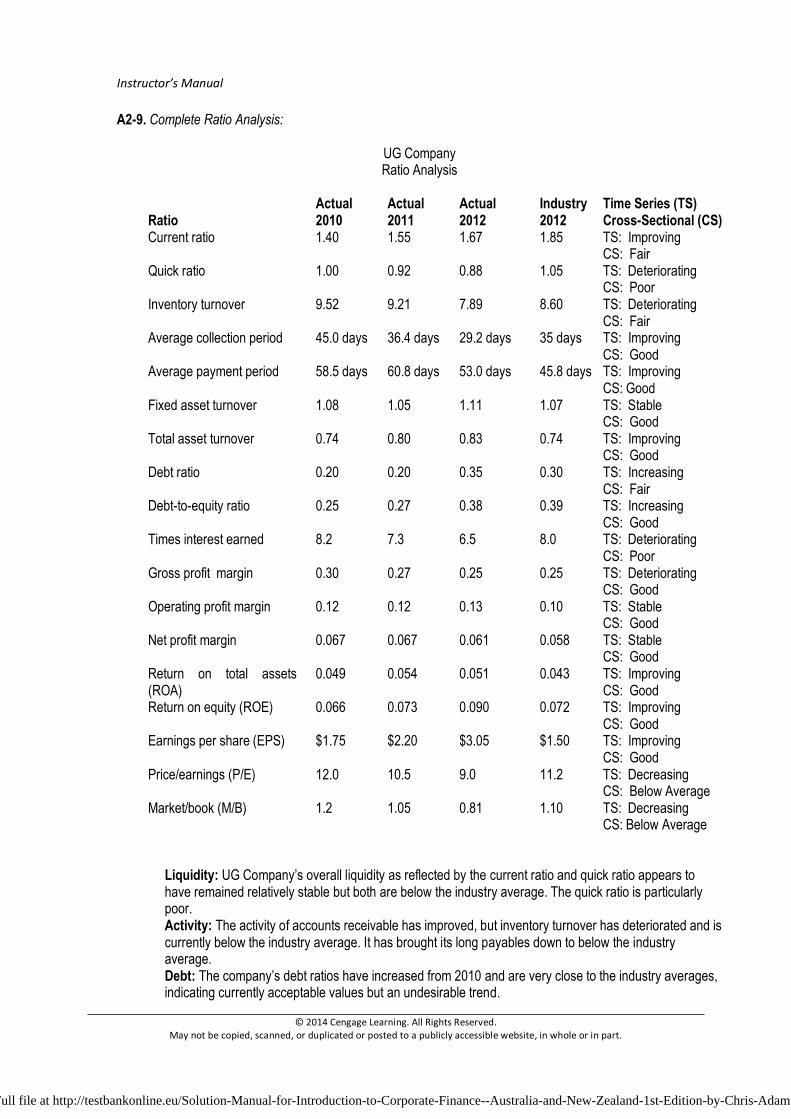
Instructor’s Manual
© 2014 Cengage Learning. All Rights Reserved. May not be copied, scanned, or duplicated or posted to a publicly accessible website, in whole or in part.
A2-9. Complete Ratio Analysis:
UG Company Ratio Analysis
Liquidity: UG Company’s overall liquidity as reflected by the current ratio and quick ratio appears to have remained relatively stable but both are below the industry average. The quick ratio is particularly poor. Activity: The activity of accounts receivable has improved, but inventory turnover has deteriorated and is currently below the industry average. It has brought its long payables down to below the industry average. Debt: The company’s debt ratios have increased from 2010 and are very close to the industry averages, indicating currently acceptable values but an undesirable trend.
Actual Actual Actual Industry Time Series (TS) Ratio 2010 2011 2012 2012 Cross-Sectional (CS) Current ratio 1.40 1.55 1.67 1.85 TS: Improving
CS: Fair Quick ratio 1.00 0.92 0.88 1.05 TS: Deteriorating
CS: Poor Inventory turnover 9.52 9.21 7.89 8.60 TS: Deteriorating
CS: Fair Average collection period 45.0 days 36.4 days 29.2 days 35 days TS: Improving
CS: Good Average payment period 58.5 days 60.8 days 53.0 days 45.8 days TS: Improving
CS: Good Fixed asset turnover 1.08 1.05 1.11 1.07 TS: Stable
CS: Good Total asset turnover 0.74 0.80 0.83 0.74 TS: Improving
CS: Good Debt ratio 0.20 0.20 0.35 0.30 TS: Increasing
CS: Fair Debt-to-equity ratio 0.25 0.27 0.38 0.39 TS: Increasing
CS: Good Times interest earned 8.2 7.3 6.5 8.0 TS: Deteriorating
CS: Poor Gross profit margin 0.30 0.27 0.25 0.25 TS: Deteriorating
CS: Good Operating profit margin 0.12 0.12 0.13 0.10 TS: Stable
CS: Good Net profit margin 0.067 0.067 0.061 0.058 TS: Stable
CS: Good Return on total assets (ROA)
0.049 0.054 0.051 0.043 TS: Improving CS: Good
Return on equity (ROE) 0.066 0.073 0.090 0.072 TS: Improving CS: Good
Earnings per share (EPS) $1.75 $2.20 $3.05 $1.50 TS: Improving CS: Good
Price/earnings (P/E) 12.0 10.5 9.0 11.2 TS: Decreasing CS: Below Average
Market/book (M/B) 1.2 1.05 0.81 1.10 TS: Decreasing CS: Below Average
Full file at http://testbankonline.eu/Solution-Manual-for-Introduction-to-Corporate-Finance--Australia-and-New-Zealand-1st-Edition-by-Chris-Adam
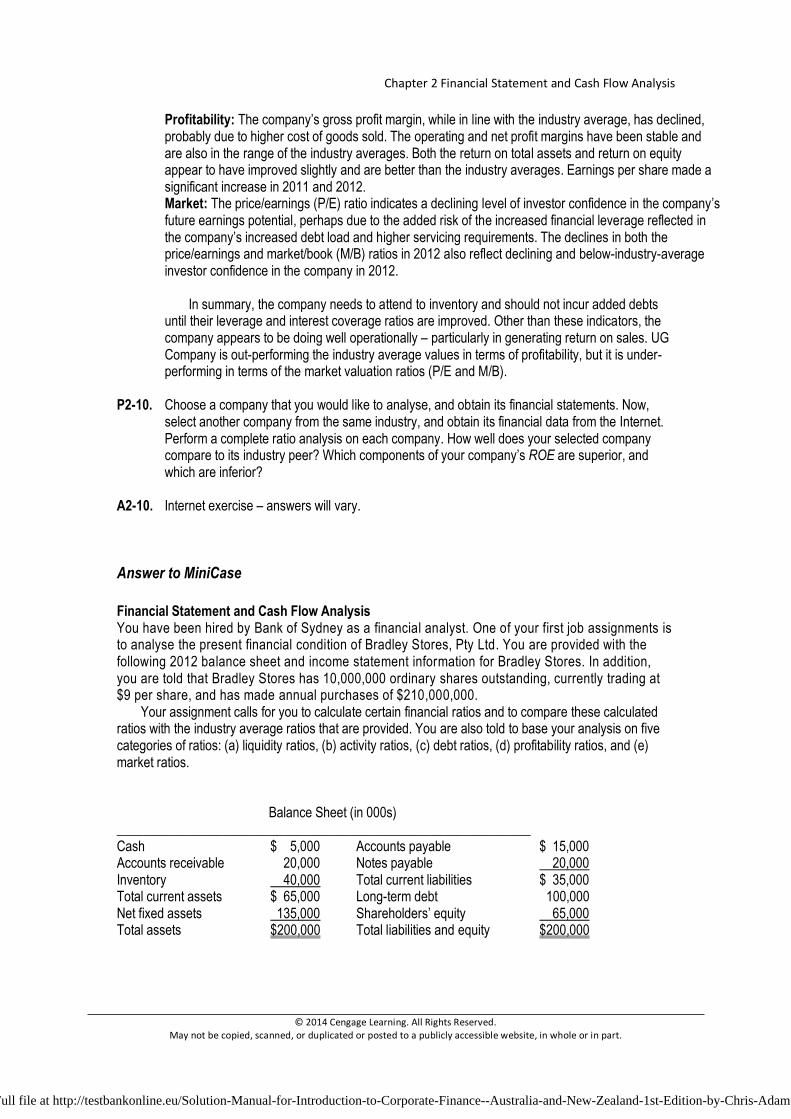
Chapter 2 Financial Statement and Cash Flow Analysis
© 2014 Cengage Learning. All Rights Reserved. May not be copied, scanned, or duplicated or posted to a publicly accessible website, in whole or in part.
Profitability: The company’s gross profit margin, while in line with the industry average, has declined, probably due to higher cost of goods sold. The operating and net profit margins have been stable and are also in the range of the industry averages. Both the return on total assets and return on equity appear to have improved slightly and are better than the industry averages. Earnings per share made a significant increase in 2011 and 2012. Market: The price/earnings (P/E) ratio indicates a declining level of investor confidence in the company’s future earnings potential, perhaps due to the added risk of the increased financial leverage reflected in the company’s increased debt load and higher servicing requirements. The declines in both the price/earnings and market/book (M/B) ratios in 2012 also reflect declining and below-industry-average investor confidence in the company in 2012.
In summary, the company needs to attend to inventory and should not incur added debts until their leverage and interest coverage ratios are improved. Other than these indicators, the company appears to be doing well operationally – particularly in generating return on sales. UG Company is out-performing the industry average values in terms of profitability, but it is under-performing in terms of the market valuation ratios (P/E and M/B).
P2-10. Choose a company that you would like to analyse, and obtain its financial statements. Now, select another company from the same industry, and obtain its financial data from the Internet. Perform a complete ratio analysis on each company. How well does your selected company compare to its industry peer? Which components of your company’s ROE are superior, and which are inferior?
A2-10. Internet exercise – answers will vary.
Answer to MiniCase Financial Statement and Cash Flow Analysis You have been hired by Bank of Sydney as a financial analyst. One of your first job assignments is to analyse the present financial condition of Bradley Stores, Pty Ltd. You are provided with the following 2012 balance sheet and income statement information for Bradley Stores. In addition, you are told that Bradley Stores has 10,000,000 ordinary shares outstanding, currently trading at $9 per share, and has made annual purchases of $210,000,000. Your assignment calls for you to calculate certain financial ratios and to compare these calculated ratios with the industry average ratios that are provided. You are also told to base your analysis on five categories of ratios: (a) liquidity ratios, (b) activity ratios, (c) debt ratios, (d) profitability ratios, and (e) market ratios.
Balance Sheet (in 000s) ______________________________________________________________ Cash $ 5,000 Accounts payable $ 15,000 Accounts receivable 20,000 Notes payable 20,000 Inventory 40,000 Total current liabilities $ 35,000 Total current assets $ 65,000 Long-term debt 100,000 Net fixed assets 135,000 Shareholders’ equity 65,000 Total assets $200,000 Total liabilities and equity $200,000
Full file at http://testbankonline.eu/Solution-Manual-for-Introduction-to-Corporate-Finance--Australia-and-New-Zealand-1st-Edition-by-Chris-Adam
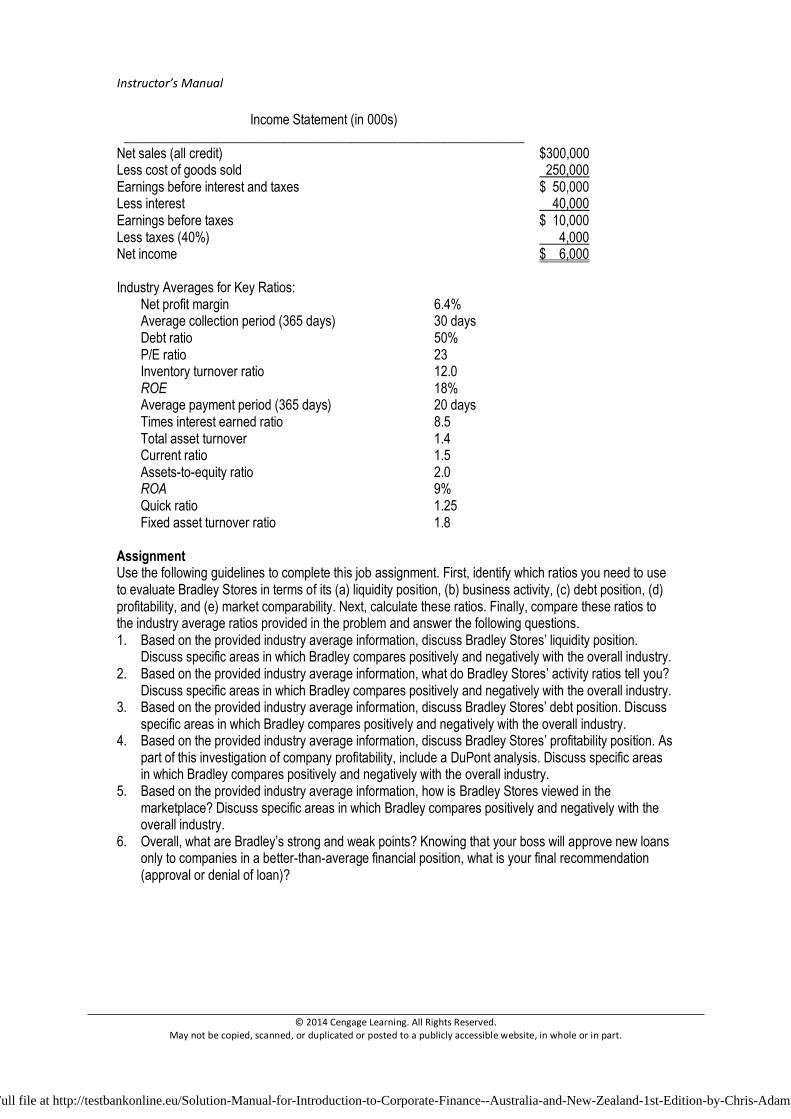
Instructor’s Manual
© 2014 Cengage Learning. All Rights Reserved. May not be copied, scanned, or duplicated or posted to a publicly accessible website, in whole or in part.
Income Statement (in 000s) ____________________________________________________________
Net sales (all credit) $300,000 Less cost of goods sold 250,000 Earnings before interest and taxes $ 50,000 Less interest 40,000 Earnings before taxes $ 10,000 Less taxes (40%) 4,000 Net income $ 6,000 Industry Averages for Key Ratios: Net profit margin 6.4% Average collection period (365 days) 30 days Debt ratio 50% P/E ratio 23 Inventory turnover ratio 12.0 ROE 18% Average payment period (365 days) 20 days Times interest earned ratio 8.5 Total asset turnover 1.4 Current ratio 1.5 Assets-to-equity ratio 2.0 ROA 9% Quick ratio 1.25 Fixed asset turnover ratio 1.8 Assignment Use the following guidelines to complete this job assignment. First, identify which ratios you need to use to evaluate Bradley Stores in terms of its (a) liquidity position, (b) business activity, (c) debt position, (d) profitability, and (e) market comparability. Next, calculate these ratios. Finally, compare these ratios to the industry average ratios provided in the problem and answer the following questions. 1. Based on the provided industry average information, discuss Bradley Stores’ liquidity position.
Discuss specific areas in which Bradley compares positively and negatively with the overall industry. 2. Based on the provided industry average information, what do Bradley Stores’ activity ratios tell you?
Discuss specific areas in which Bradley compares positively and negatively with the overall industry. 3. Based on the provided industry average information, discuss Bradley Stores’ debt position. Discuss
specific areas in which Bradley compares positively and negatively with the overall industry. 4. Based on the provided industry average information, discuss Bradley Stores’ profitability position. As
part of this investigation of company profitability, include a DuPont analysis. Discuss specific areas in which Bradley compares positively and negatively with the overall industry.
5. Based on the provided industry average information, how is Bradley Stores viewed in the marketplace? Discuss specific areas in which Bradley compares positively and negatively with the overall industry.
6. Overall, what are Bradley’s strong and weak points? Knowing that your boss will approve new loans only to companies in a better-than-average financial position, what is your final recommendation (approval or denial of loan)?
Full file at http://testbankonline.eu/Solution-Manual-for-Introduction-to-Corporate-Finance--Australia-and-New-Zealand-1st-Edition-by-Chris-Adam
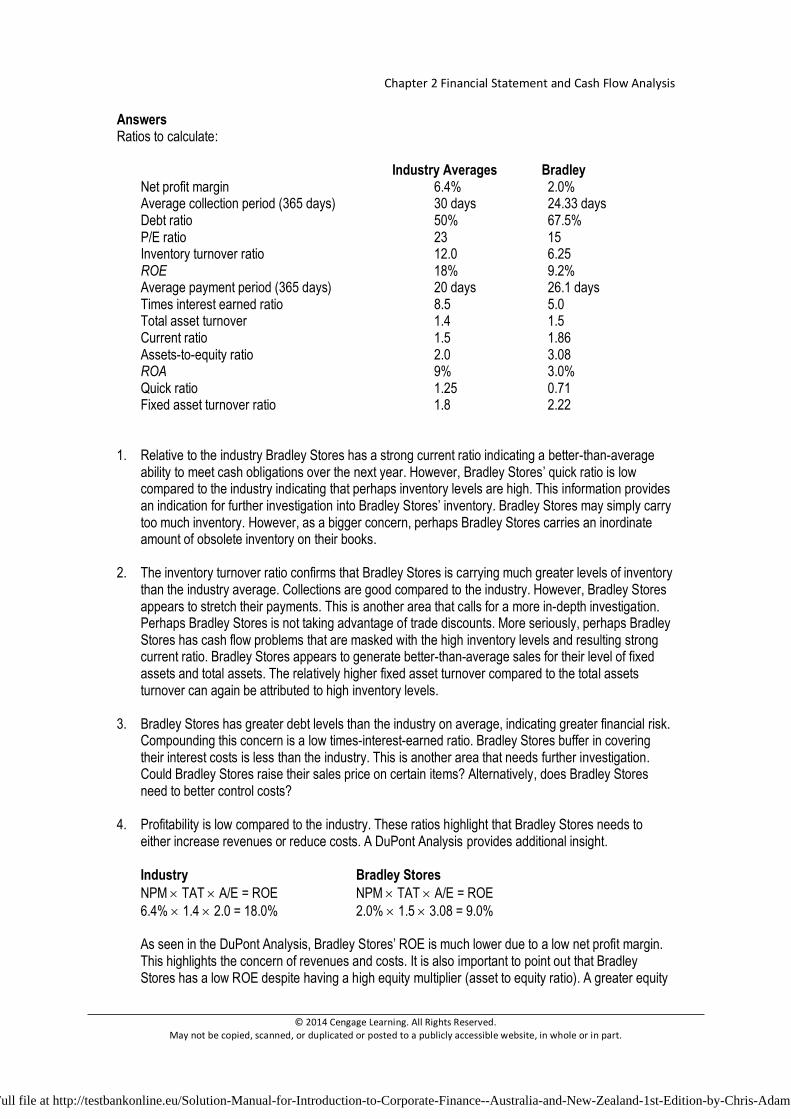
Chapter 2 Financial Statement and Cash Flow Analysis
© 2014 Cengage Learning. All Rights Reserved. May not be copied, scanned, or duplicated or posted to a publicly accessible website, in whole or in part.
Answers Ratios to calculate: Industry Averages Bradley Net profit margin 6.4% 2.0% Average collection period (365 days) 30 days 24.33 days Debt ratio 50% 67.5% P/E ratio 23 15 Inventory turnover ratio 12.0 6.25 ROE 18% 9.2% Average payment period (365 days) 20 days 26.1 days Times interest earned ratio 8.5 5.0 Total asset turnover 1.4 1.5 Current ratio 1.5 1.86 Assets-to-equity ratio 2.0 3.08 ROA 9% 3.0% Quick ratio 1.25 0.71 Fixed asset turnover ratio 1.8 2.22 1. Relative to the industry Bradley Stores has a strong current ratio indicating a better-than-average
ability to meet cash obligations over the next year. However, Bradley Stores’ quick ratio is low compared to the industry indicating that perhaps inventory levels are high. This information provides an indication for further investigation into Bradley Stores’ inventory. Bradley Stores may simply carry too much inventory. However, as a bigger concern, perhaps Bradley Stores carries an inordinate amount of obsolete inventory on their books.
2. The inventory turnover ratio confirms that Bradley Stores is carrying much greater levels of inventory
than the industry average. Collections are good compared to the industry. However, Bradley Stores appears to stretch their payments. This is another area that calls for a more in-depth investigation. Perhaps Bradley Stores is not taking advantage of trade discounts. More seriously, perhaps Bradley Stores has cash flow problems that are masked with the high inventory levels and resulting strong current ratio. Bradley Stores appears to generate better-than-average sales for their level of fixed assets and total assets. The relatively higher fixed asset turnover compared to the total assets turnover can again be attributed to high inventory levels.
3. Bradley Stores has greater debt levels than the industry on average, indicating greater financial risk.
Compounding this concern is a low times-interest-earned ratio. Bradley Stores buffer in covering their interest costs is less than the industry. This is another area that needs further investigation. Could Bradley Stores raise their sales price on certain items? Alternatively, does Bradley Stores need to better control costs?
4. Profitability is low compared to the industry. These ratios highlight that Bradley Stores needs to
either increase revenues or reduce costs. A DuPont Analysis provides additional insight. Industry Bradley Stores NPM × TAT × A/E = ROE NPM × TAT × A/E = ROE 6.4% × 1.4 × 2.0 = 18.0% 2.0% × 1.5 × 3.08 = 9.0% As seen in the DuPont Analysis, Bradley Stores’ ROE is much lower due to a low net profit margin.
This highlights the concern of revenues and costs. It is also important to point out that Bradley Stores has a low ROE despite having a high equity multiplier (asset to equity ratio). A greater equity
Full file at http://testbankonline.eu/Solution-Manual-for-Introduction-to-Corporate-Finance--Australia-and-New-Zealand-1st-Edition-by-Chris-Adam
Instructor’s Manual
© 2014 Cengage Learning. All Rights Reserved. May not be copied, scanned, or duplicated or posted to a publicly accessible website, in whole or in part.
multiplier indicates greater financial risk, where all else being equal, we would expect a higher ROE to compensate for this greater risk.
5. The PE ratio shows that investors value Bradley Stores at a lower multiple than they do other
companies in the industry. It appears that market participants have also uncovered these operational problems associated with Bradley Stores.
6. The concerns with Bradley Stores include high inventory levels, slow payments to vendors, high
debt levels, low interest coverage, and low profit margins. Further investigation is necessary, but based on this analysis Bradley Stores does not appear to be in a strong borrowing position.
Full file at http://testbankonline.eu/Solution-Manual-for-Introduction-to-Corporate-Finance--Australia-and-New-Zealand-1st-Edition-by-Chris-Adam