chapter 2 design of ip virtual private networks under … · to-end quality of service (e2e qos)...
TRANSCRIPT

Chapter 2
DESIGN OF IP VIRTUAL PRIVATENETWORKS UNDER END-TO-ENDQOS CONSTRAINTS
Emilio C.G. WilleMarco MelliaEmilio LeonardiMarco Ajmone Marsan
Abstract Traditional approaches to optimal design and planning of packet net-works focus on the network-layer infrastructure. The next generationInternet will be faced with problems concerning end-to-end Quality ofService and Service Level Agreement guarantees. In this chapter, wepropose a new packet network design and planning approach, for Vir-tual Private Networks, that is based on user-layer QoS parameters.Our proposed approach maps the end-user performance constrains intotransport-layer performance constraints first, and then into network-layer performance constraints. The latter are then considered togetherwith a realistic representation of traffic patterns at the network layer todesign the IP network. Examples of application of the proposed designmethodology to different networking configurations show the effective-ness of our approach.
1. Introduction
The pioneering works of Kleinrock (1976) spurred many research ac-tivities in the field of optimal design and planning of packet networks,and a vast literature is available on this subject. Almost invariably, how-ever, packet network design focused on the network-layer infrastructure,so that the designer is faced with a trade-off between total cost andaverage performance (network-wide packet delay, packet loss ratio, linkutilization, network reliability, etc.). This approach adopts the view-point of network operators, who quite naturally aim at the optimizationof some aggregate performance measure, that describe the general behav-

36 NEXT GENERATION INTERNET
ior of their network, averaging over all traffic relations. This may leadto situations where the average performance is good, but, while sometraffic relations obtain very good QoS, some others suffer unacceptableperformance levels.
Today, with the enormous success of the Internet, packet networkshave reached their maturity and they are used for very critical services.Accordingly, researchers as well as operators are concerned with end-to-end Quality of Service (e2e QoS) issues and Service Level Agreement(SLA) guarantees for IP networks. In this new context, average network-wide performance cannot be taken as the sole metric for network designand planning any longer, specially in the case of corporate virtual privatenetwork (VPN).
From the end user's point of view, QoS is driven by end-to-end per-formance parameters, such as data throughput, web page latency, trans-action reliability, etc. Matching the user-layer QoS requirements to thenetwork-layer performance parameters is not a straightforward task. In-deed, the QoS perceived by end users in their access to Internet servicesis mainly driven by TCP, the reliable transport protocol of the Internet,whose congestion control algorithms dictate the latency of informationtransfer. Indeed, it is well known that TCP accounts for a great amountof the total traffic volume in the Internet, and among all the TCP flows,a vast majority is represented by short-lived flows (also called mice),while the rest is represented by long-lived flows (also called elephants);see for example: Gribble and Brewer (1977), Claffy et al. (1998), Melliaet al. (2002).
In this chapter, we propose for the first time (to the best of our knowl-edge) a packet network design and planning approach that is based onuser-layer QoS parameters and explicitly accounts for the impact of theTCP protocol x.
Our proposed approach maps the end-user performance constraintsinto transport-layer performance constraints first, and then into network-layer performance constraints. The mapping process is then consideredtogether with a realistic representation of traffic patterns at the networklayer to design the IP network.
The representation of traffic patterns inside the Internet is a particu-larly delicate issue, since it is well known that IP packets do not arrive atrouter buffers following a Poisson process, see Paxson and Floyd (1995),but a higher degree of correlation exists, which can be partly due tothe TCP control mechanisms. This means that the usual approach of
1Fraleigh et al. (2003) account for user-layer QoS constraints focus mainly on voice traffic,and do not consider the impact of TCP at the transport layer.
2 Design of IP VPNs under End-to-end QoS Constraints 37
modeling packet networks as networks of M/M/l queues as discussed inGavish and Neuman (1989), Kamimura and Nishino (1991), Cheng andLin (1995), Gavish (1992), Mai Hoang and Zorn (2001) is not acceptable.In this chapter we adopt a refined IP traffic modeling technique, alreadypresented in Garetto and Towsley (2003), that provides an accurate de-scription of the traffic dynamics in multi-bottleneck IP networks loadedwith TCP mice and elephants. The resulting analytical model is capa-ble of producing accurate performance estimates for general topologyIP networks loaded by realistic TCP traffic patterns, while still beinganalytically tractable.
In summary, in this chapter we propose a new approach to the packetnetwork design problem, which considers as constraints the e2e QoS per-ceived by users. Given (i) the network topology, (ii) the average trafficexchanged by all source/destination pairs (i.e., the traffic matrix), (iii) arouting algorithm (e.g., shortest path), we solve the capacity assignmentproblem, minimizing the link capacity cost, subject to the e2e QoS con-straints expressed by users, i.e., either the average data throughput, orthe file transfer latency, obtained by considering TCP as the transportprotocol. In addition, our approach is capable of also solving either thedroptail buffer dimensioning problem, or the AQM (Active Queue Man-agement) parameter dimensioning problem in the case of AQM buffers(e.g., RED). While the buffer cost is usually considered to be negligible,it is important to have a procedure to dimensioning the correct buffersize, to limit the impact of queueing delay on the performance. More-over, the availability of buffers in high-capacity router is limited by thecost of high-speed static RAM.
The rest of the chapter is organized as follows. Section 2 describesthe general network design methodology. The e2e QoS mapping intotransport- and network-layer performance constraints, and some trans-lations examples, are described in Section 2.1. Section 3 provides the for-mulation of the general optimization problem, and lists the assumptionsneeded for the modeling phase. Afterwards, the Capacity Assignment(CA) and the Buffer Assignment (BA) problems are presented. Resultsobtained for both problems are tabulated and compared with results ofns-2 simulations in Section 4, Conclusions are given in Section 5.
2, The IP network design methodology
Of course, in any realistic network problem the notion of "optimumdesign" is an extremely difficult task. The IP network design methodol-ogy that we propose in this chapter is based on a "Divide and Conquer"approach, in the sense that it consists of several subproblems. Thus, the
38 NEXT GENERATION INTERNET
! : • - • • • • • : • • •
::i-th S-D pair constraints :
Page latency,Data throughput
: • : • : • : • : • : ! : • : • : • : • : • : •
Application layei^QoS translator ^
. 1 File completion tim<•;•••;•;•/ File throughput
in^Transport layer 4|Qo^ton£aJ.orJ
Round Trip TimeLoss probability
mmm•••••• - S s
: : : O p t i m i z a t i o n ; : : :r Buffer size / :AQM parameters / ; ! !
^Buffer Assignamentl
•:•/ Link Capacity / : :
Capacity Assignament ^
:: I n p u t s ::::
: • / Physical Topology / : • : / Traffic matrix / •y Routing algorithm / : • : • / Capacity cost /;•;
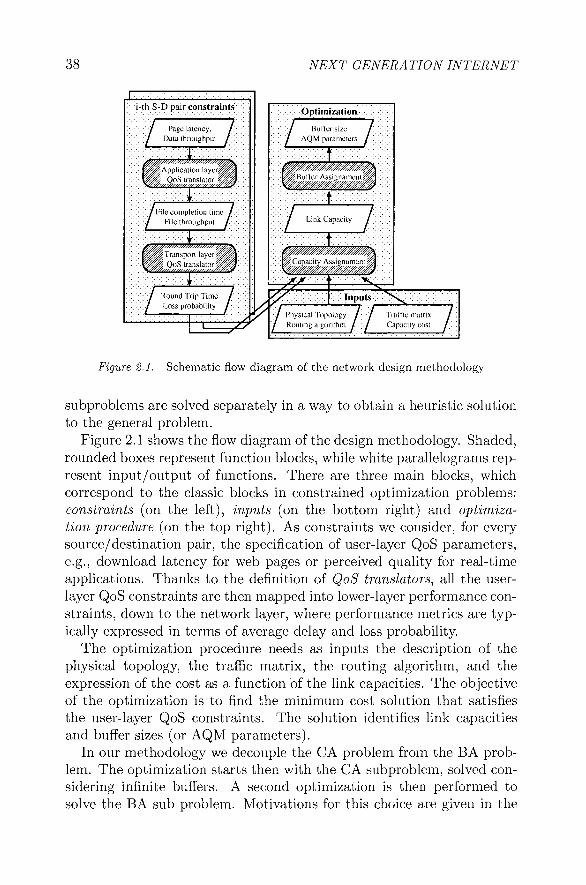
Figure 2.1. Schematic flow diagram of the network design methodology
subproblems are solved separately in a way to obtain a heuristic solutionto the general problem.
Figure 2.1 shows the flow diagram of the design methodology. Shaded,rounded boxes represent function blocks, while white parallelograms rep-resent input/output of functions. There are three main blocks, whichcorrespond to the classic blocks in constrained optimization problems:constraints (on the left), inputs (on the bottom right) and optimiza-tion procedure (on the top right). As constraints we consider, for everysource/destination pair, the specification of user-layer QoS parameters,e.g., download latency for web pages or perceived quality for real-timeapplications. Thanks to the definition of QoS translators, all the user-layer QoS constraints are then mapped into lower-layer performance con-straints, down to the network layer, where performance metrics are typ-ically expressed in terms of average delay and loss probability.
The optimization procedure needs as inputs the description of thephysical topology, the traffic matrix, the routing algorithm, and theexpression of the cost as a, function of the link capacities. The objectiveof the optimization is to find the minimum cost solution that satisfiesthe user-layer QoS constraints. The solution identifies link capacitiesand buffer sizes (or AQM parameters).
In our methodology we decouple the CA problem from the BA prob-lem. The optimization starts then with the CA subproblem, solved con-sidering infinite buffers. A second optimization is then performed tosolve the BA sub problem. Motivations for this choice are given in the

2 Design of IP VPNs under End-to-end QoS Constraints 39
following sections, where we briefly comment on the main steps of thedesign methodology, and we provide a formal description for the opti-mization problem.
2,1 QoS translators
The process of translating QoS specifications between different layersof the protocol stack is called QoS translation or QoS mapping. Severalparameters can be translated from layer to layer, for example: delay,jitter, throughput, or reliability (see Knoche and de Meer, 1997 and thereferences therein). According to the Internet protocol architecture, atleast two QoS mapping procedures should be considered in our case;the first translates the application-layer QoS constraints into transport-layer QoS constraints, and the second translates transport-layer QoSconstraints into network-layer QoS constraints, such as Round Trip Time(RTT) and Packet Loss Probability (P/oss).
Matching the user-layer QoS requirements to the network-layer per-formance parameters is not a straightforward task. In this section wepresent some examples of QoS constraints translation and propose a newQoS translator tailored for the TCP protocol case.
2.1.1 Application-layer QoS translator. This module takesas inputs the application-layer QoS constraints, such as web page trans-fer latency, data throughput, audio quality, etc. Assuming then that foreach application we know which transport protocol is used, i.e., eitherTCP or UDP, this module maps the application-layer QoS constraintsinto transport-layer QoS constraints. Given the multitude of Internetapplications, it is not possible to devise a generic procedure to solvethis problem, and we do not focus on generic translators, since ad-hocsolutions should be used, depending on the application.
For real-time applications over UDP, the output of the application-layer translator is given in terms of packet loss probability, and maximumnetwork e2e delay.
For elastic applications exploiting TCP, the output of the application-layer translator is still a set of high-level constraints, expressed as filetransfer latency (Lt), or throughput (T^).
Example - Voice over UDP. In this case, the application-layerQoS translator is in charge of translating the high-level QoS constraint,such as the Mean Opinion Score (MOS), into transport-layer perfor-mance constraints, expressed in terms of packet loss probability, maxi-mum network e2e delay. Several studies were conducted on this subjectin Markopoulou et al. (2002). For example, good vocal perceived quality

40 NEXT GENERATION INTERNET
is associated with an average packet loss probability of the order of 1%,and a maximum e2e delay smaller than 200 ms.
Example - Web page download. In this case, the input of theapplication-layer QoS translator is a desired download time, expressedas a function of the page size, the protocol type, the number of objectsin the page, etc. As output, the TCP latency constraint is evaluated.For example, given a desired web page download time smaller than 1.5s,a web page which contains 20 objects, downloaded using 4 parallel TCPconnections at most, each object must be transferred with a TCP con-nection of average duration smaller than 0.3s.
2.1.2 Transport-layer QoS translator. The Transport-layer QoS translator maps transport-layer performance constraints intonetwork-layer performance constraints; the translator in this case mustbe tailored to the transport protocol used: either UDP or TCP.
Real time applications - UDP. The translation from transport-layer performance constraints into network-layer performance con-straints in the case of real-time UDP applications is rather straight-forward, since the transport-layer performance constraints are usuallyexpressed in terms of packet loss probability and maximum e2e networkdelay, which can be directly used also as network-level performance pa-rameters. Jitter and delay variation may also be considered. The onlyeffect of UDP that must be taken into account is related to the protocoloverhead, which increases the offered load to the network. This effectmay be significant, specially for applications like voice, that use smallpackets.
Elastic traffic — TCP. The translation from transport-layer QoSconstraints to network-layer QoS parameters, such as Round Trip Time(RTT) and packet loss probability (Pjoss) in this case is more difficult.This is mainly due to the complexity of the TCP protocol, and in par-ticular to the error, flow and congestion control algorithms.
The TCP QoS translator accepts as inputs either the maximum filetransfer latency (Lj), or the minimum file transfer throughput (T^). Weimpose that all flows shorter than a given threshold (i.e., TCP mice)meet the maximum file transfer latency constraint, while longer flows(i.e., TCP elephants) are subjected to the throughput constraint. Forexample, from measurements of the file length distribution over the In-ternet, presented in Mellia et al. (2002), it is possible to say that 85%of all TCP flows are shorter than 20 segments. For these flows, we im-

2 Design of IP VPNs under End-to-end QoS Constraints 41
pose that the latency constraint must hold. Instead, for flows longerthan 20 segments we impose that the throughput constraint must bemet. Obviously, the most stringent constraint must be considered in thetranslation. The maximum RTT and Pioss that satisfy both constraintsconstitute the output of this translator.
To solve the translation problem, we exploit recent research resultsin the field of TCP modeling (see Garetto and Towsley, 2003 and thereferences therein). Usually, TCP models take network-layer parametersas inputs, i.e., RTT and packet loss probability, and give as outputeither the average throughput or the file transfer latency. Our approachis based on the inversion of known TCP models, taking as input eitherthe connection throughput or the file transfer latency, and obtaining asoutputs RTT and PiOSs- Among the many models of TCP presented inthe literature, when considering file transfer latency, we use the TCPlatency model described in Cardwell et al. (2000), which offers a goodtradeoff between computational complexity and accuracy of performancepredictions. We will refer to this model as CSA (from the last name ofauthors). When considering throughput, we instead exploit the well-known PFTK formula, from Padhye et al. (2000). Our methodologycan however be modified to incorporate more complex/accurate TCPmodels.
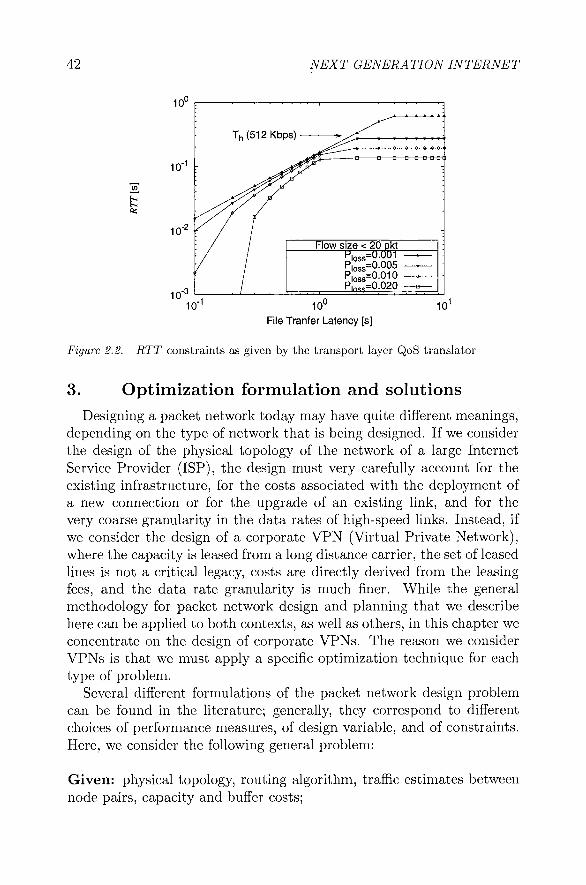
The inversion of TCP models is not simple, since there are at leasttwo parameters that impact TCP throughput and latency, i.e., RTT andPloss< An infinite number of possible solutions for these two parameterssatisfies a given constraint at the TCP level. We decided therefore to fixthe Pioss parameter, and leave RTT as the free variable. This choice isdue to the considerations that the loss probability has a larger impacton the latency of very short flows, and that it impacts the network loaddue to retransmissions. Furthermore, Pi0Ss is als° constrained by real-time applications. Finally, fixing the value of the loss probability allowsus to decouple the CA problem from the BA problem. Therefore, afterchoosing a value for Pi0Ss) a se^ °f curves can be derived, showing thebehavior of RTT versus file latency and throughput. From these curvesit is then possible to derive the maximum allowable RTT. The inversionof the CSA and PFTK formulas is obtained using numerical algorithms.
For example, given a maximum file transfer latency and a minimumthroughput T/i — 512 Kbps constraint, the curves of Figure 2.2 report themaximum admissible RTT which satisfies the most stringent constraintfor different values of Pi0Ss>
42 NEXT GENERATION INTERNET
as
10"c
File Tranter Latency [s]
Figure 2.2. RTT constraints as given by the transport layer QoS translator
3, Optimization formulation and solutionsDesigning a packet network today may have quite different meanings,
depending on the type of network that is being designed. If we considerthe design of the physical topology of the network of a large InternetService Provider (ISP), the design must very carefully account for theexisting infrastructure, for the costs associated with the deployment ofa new connection or for the upgrade of an existing link, and for thevery coarse granularity in the data rates of high-speed links. Instead, ifwe consider the design of a corporate VPN (Virtual Private Network),where the capacity is leased from a long distance carrier, the set of leasedlines is not a critical legacy, costs are directly derived from the leasingfees, and the data rate granularity is much finer. While the generalmethodology for packet network design and planning that we describehere can be applied to both contexts, as well as others, in this chapter weconcentrate on the design of corporate VPNs. The reason we considerVPNs is that we must apply a specific optimization technique for eachtype of problem.
Several different formulations of the packet network design problemcan be found in the literature; generally, they correspond to differentchoices of performance measures, of design variable, and of constraints.Here, we consider the following general problem:
Given: physical topology, routing algorithm, traffic estimates betweennode pairs, capacity and buffer costs;

2 Design of IP VPNs under End-to-end QoS Constraints 43
Minimize: total capacity cost, total buffer cost;With respect to: link capacities, buffer sizes;Subject to: packet delay constraints, packet loss probability.
In the solution of the CA and BA problems, we need to evaluatethe packet delay and loss probability to verify that the constraints aremet. We thus first introduce the network model and discuss the relationsbetween performance measures, input parameters, design variables, andconstraints that appear in the general design problem. Then we defineand solve the CA and BA problems.
3-1 Traffic model
The network model is an open network of queues, where each queuerepresents an output interface of an IP router, with its buffer. Therouting of customers on this queuing network reflects the actual routingof packets within the IP network. In the description of the networkmodel, we assume that all router buffers exhibit a droptail behavior.
Traditionally, M/M/l/B queueing models were considered good rep-resentations of packet networks. However, given the well-known correla-tion of actual IP traffic, we choose to model the increased traffic bursti-ness induced by TCP using the arrival of packets in groups (batch ar-rivals), hence using M[X}/M/l/B queues. The batch size varies between1 and W with distribution [X], where W is the maximum TCP windowsize expressed in segments. The distribution [X] is obtained consideringthe number of segments that TCP sources send in one RTT, as discussedin Garetto and Towsley (2003). Our choice of using batch arrivals fol-lowing a Poisson process has the advantage of combining the nice char-acteristics of Poisson processes (analytical tractability in the first place)with the possibility of capturing the burstiness of the TCP traffic, Thedecision to model the router output interfaces with M[X]/M/l/B queuesis the results of a careful and detailed study of a wide gamut of perfor-mance investigations of queue lengths in IP networks, conducted withthe ns-2 simulator in Garetto and Towsley (2003).
The Markovian assumption for the batch arrival process is mainly dueto the Poisson assumption for the TCP connection generation process(when dealing with TCP mice), as well as the fairly large number ofTCP connections simultaneously present in the network. The averagepacket loss probability, and the average time spent by packets in therouter buffer, are obtained directly from the solution of the M[x]/M/1/Bqueue. Given the flow length distribution, a stochastic model of TCP
44 NEXT GENERATION INTERNET
(described in Garetto and Towsley, 2003) is used to obtain the batchsize distribution [X].
3,2 Delay analysis
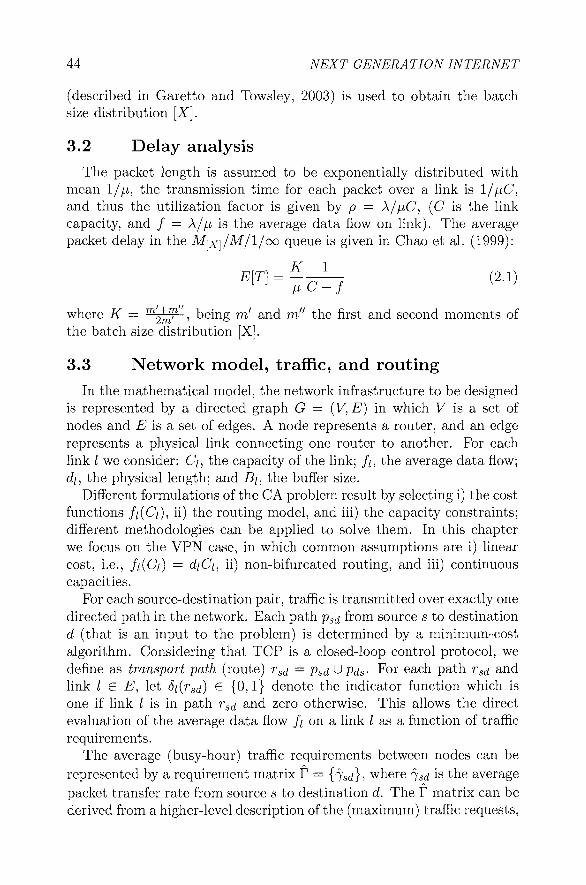
The packet length is assumed to be exponentially distributed withmean 1///, the transmission time for each packet over a link is l//xC,and thus the utilization factor is given by p — A//iC, (C is the linkcapacity, and / = A//i is the average data flow on link). The averagepacket delay in the M[X]/M/l/oo queue is given in Chao et al. (1999):
where K = m^1 , being m' and m" the first and second moments ofthe batch size distribution [X].
3.3 Network model, traffic, and routing
In the mathematical model, the network infrastructure to be designedis represented by a directed graph G — (V, E) in which V is a set ofnodes and E is a set of edges. A node represents a router, and an edgerepresents a physical link connecting one router to another. For eachlink / we consider: C/, the capacity of the link; //, the average data flow;d/, the physical length; and £?/, the buffer size.
Different formulations of the CA problem result by selecting i) the costfunctions fi(Ci), ii) the routing model, and hi) the capacity constraints;different methodologies can be applied to solve them. In this chapterwe focus on the VPN case, in which common assumptions are i) linearcost, i.e., fi(Ci) = diCu ii) non-bifurcated routing, and iii) continuouscapacities.
For each source-destination pair, traffic is transmitted over exactly onedirected path in the network. Each path psd from source s to destinationd (that is an input to the problem) is determined by a minimum-costalgorithm. Considering that TCP is a closed-loop control protocol, wedefine as transport path (route) rsd = psd Upds- For each path rsd andlink I £ E, let Si(rsd) € {0,1} denote the indicator function which isone if link I is in path rsd and zero otherwise. This allows the directevaluation of the average data flow // on a link / as a function of trafficrequirements.
The average (busy-hour) traffic requirements between nodes can berepresented by a requirement matrix T — {jsd}i where ^sd is the averagepacket transfer rate from source s to destination d. The T matrix can bederived from a higher-level description of the (maximum) traffic requests,

2 Design of IP VPNs under End-to-end QoS Constraints 45
expressed in terms of "pages per second", or "flows per second" for a givensource/destination pair.
We consider as traffic offered to the network 7 ^ = lJpd—, thus ac-counting for the retransmissions due to the losses that flows experiencealong their path to the destination. PiOss(rsd) is the desired e2e lossprobability for path rsrf.
3,4 The Capacity Assignment problem
As previously said, we solve the Capacity Assignment (CA) problemby considering infinite buffers. The only constraint that has to be met istherefore the e2e packet delay, which is evaluated thanks to the adoptionof the M[x]/M/l/oo model for links. Given the network topology, thetraffic requirements, and the link flows in the general problem, it ispossible to formulate the CA problem as follows.Minimize:
leE
Subject to:
^ " ^ " ^ VMeV (2.3)
fi= Y, Wsdhsd, Vs,deV (2.4)
Ci>fu yieE (2.5)
The objective function (2.2) represents the total link cost, which is thesum of the cost functions of link /, //(C/), Equation (2.3) is the packetdelay constraint for each source/destination node pair; where RTTsd isthe desired Round Trip Time for (aggregated) TCP traffic from node sto node d, and rsd is the propagation delay for path p5Cj. Equation (2.4)defines the average data flow on the link. Constraints (2.5) are non-negativity constraints. The only design variables are the link capacitiesQ.
We notice that the objective function and the constraint functionsare (weakly) convex, therefore the CA problem is a convex optimizationproblem.
3,5 The Buffer Assignment problem
Given the network topology, the traffic requirements and the linkflows, by fixing the link capacities in the general problem, it is possible

46 NEXT GENERATION INTERNET
to formulate the Buffer Assignment (BA) problem as follows. Minimize:
leE
Subject to:
~ ; 8 i { r 8 d ) . p { B u C u fu [X]) < Pioss{rsd), Vs.deV ( 2 . 7 )leE
Bi>0, VI eE (2.8)
The objective function (2.6) represents the total buffer cost, which is thesum of the cost functions of buffer /, gi{B{) = J3/. Equation (2.7) is theloss probability constraint for each source/destination node pair. Wherep(Bi)Cufi,[X\) is the average loss probability for the M^/M/l/Bqueue, which is evaluated by solving its Continuous Time Markov Chain(CTMC). Constraints (2.8) are non-negativity constraints.
In the previous formulation we have considered the following upperbound on the value of Pioss (constraint (2.7)).
Pioss(rsd) = 1 - I ] (J ~ Si{rad).p{Bh Cu fu [X])) <leE (2.9)
leE
Notice also that the first part of equation (2.9) is based on the assump-tion that link losses are independent.
Therefore, the solution of the BA problem is a conservative solutionto the full problem. Notice also that, to evaluate the packet droppingprobability, we explicitly consider the bidirectional transport path rsd,taking into account the fact that the performance of TCP is affectedby data segments lost on the forward path ps^, and by ACKs lost onthe reverse path pds> While the second event has less impact on TCPperformance, it is not negligible for short file transfers.
The proof that the BA problem is a convex optimization problem isnot a straightforward task. The difficulty in this proof derives from theneed of showing that p{B) C, / , [X]) is convex. Since, to the best of ourknowledge, no closed form expression for the M[X]/M/l/B stationarydistribution is knowrn, no closed form expression for p{B) C, / , [X]) canbe derived. However, we conjecture that the BA problem is a convexoptimization problem by considering that: (i) for an M/M/l/B queue,p(B,C,f) is a convex function (see Nagarajan and Towsley, 1992); and(ii) approximating p(B, C, / , [X]) = Y^IZB ^ where TT̂ is the stationary
2 Design of IP VPNs under End-to-end QoS Constraints 47
distribution of an M[X]/M/l/oo queue, the loss probability is a convexfunction of B.
We can thus classify both the CA and BA problems as multivari-able constrained convex minimization problems; therefore, the globalminimum (for each subproblem) can be found using convex program-ming techniques. We solve the minimization problems applying first aconstraints reduction procedure which reduces the set of constraints byeliminating redundancies. Then the solution of the CA and BA problemsis obtained using the logarithm barrier method, see Wright (1992).
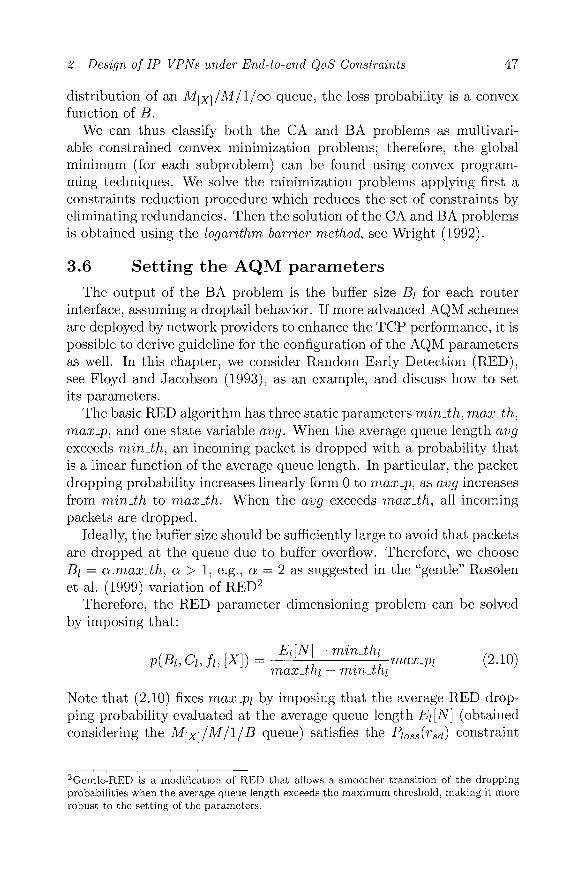
3.6 Setting the AQM parameters
The output of the BA problem is the buffer size J3/ for each routerinterface, assuming a droptail behavior. If more advanced AQM schemesare deployed by network providers to enhance the TCP performance, it ispossible to derive guideline for the configuration of the AQM parametersas well. In this chapter, we consider Random Early Detection (RED),see Floyd and Jacobson (1993), as an example, and discuss how to setits parameters.
The basic RED algorithm has three static parameters min-th, max-th,maxjp, and one state variable avg. When the average queue length avgexceeds min-th, an incoming packet is dropped with a probability thatis a linear function of the average queue length. In particular, the packetdropping probability increases linearly form 0 to maxjp, as avg increasesfrom minJbh to maxJh. When the avg exceeds maxJbh, all incomingpackets are dropped.
Ideally, the buffer size should be sufficiently large to avoid that packetsare dropped at the queue due to buffer overflow. Therefore, we chooseB\ — a.maxJh, a > 1, e.g., a = 2 as suggested in the "gentle" Rosolenet al. (1999) variation of RED2
Therefore, the RED parameter dimensioning problem can be solvedby imposing that:
(T> n * rvn Et[N} - minJhi ( .p(Bh Cu fu [X]) = L
7 7 -—7-max.pi (2.10)maxJhi- min.thi
Note that (2.10) fixes maxjpi by imposing that the average RED drop-ping probability evaluated at the average queue length E[ [N] (obtainedconsidering the Mnq/M/1/.B queue) satisfies the Pi0Ss{rsd) constraint
2Gentle-RED is a modification of RED that allows a smoother transition of the droppingprobabilities when the average queue length exceeds the maximum threshold, making it morerobust to the setting of the parameters.

48 NEXT GENERATION INTERNET
in (2.7). Finally, we set mindhi = p.maxJhi, (3 < 1. In the numericalexamples that follow, we selected a = 2, /? = 1/16,
4, Numerical examples and simulations
In this section we present some selected numerical results, showing theaccuracy of the IP network designs produced by our methodology. Wefirst applied our optimization method to design some networks topologiesand next used a simulation procedure to evaluate if the QoS constraintswere actually respected. The tool used for simulation is ns version 2.For all simulations, the "batch means" technique, with 30 batches, wasconsidered.
We assume that New Reno is the TCP version of interest. In addition,we assume that TCP connections are established choosing at random aserver-client pair, and are opened at instants described by a Poissonprocess. Connection opening rates are determined so as to set the linkflows // to their desired values. The packet size is assumed constant,equal to the maximum segment size (MSS), the maximum window sizeis assumed to be 32 segments. The amount of data to be transferredby each connection (i.e., the file size) is expressed in number of seg-ments. We consider a mixed traffic scenario where the file size followsthe distribution shown in Figure 2,3, which is derived from one-weeklong measurements, conducted in Mellia et al. (2002), in three differenttime periods. In particular, we report the discretized CDF, obtainedby splitting the flow distribution in 15 groups with the same number offlows per group, from the shortest to the longest flow, and then com-puting the average flow length in each group. The large plot reports thediscretized CDF using bytes as unit, while the inside one reports thesame distribution taking today's most common MSS of 1460 bytes asunit. We use the most recent measurements in the following simulations.
4,1 Single-bottleneck topology
We start by considering a very simple single bottleneck topology. Weassume one-way TCP New Reno connections with uncongested back-ward path. The topology comprises the bottleneck link, and a numberof peripheral links, whose capacities are equal to 25 Mbps and whosepropagation delays are uniformly distributed between 0.01 and 0.03ms.
Table 2.1 reports the capacity and buffer size of the bottleneck linkobtained with our method. In order to obtain some comparisons, wealso implemented a design procedure using the classical formula, seeKleinrock (1976), which considers an M/M/l queue model in the CAproblem. We also extended the classical approach to the BA problem,

2 Design of IP VPNs under End-to-end QoS Constraints 49
2 4 8 16 32 64128E56
102 103 10"File Size [Bytes]
105 10°
Figure 2.3. TCP connection length cumulative distributions
which is solved considering M/M/l/B queues. We choose as targetparameters the following: latency Lt < 0.3s for flows shorter than 20segments, throughput Th > 512 Kbps for flow longer than 20 segmentsand Pioss = 0.01. Using the transport layer QoS translator, we ob-tain the equivalent constraint RTT < 0.03s (for the sake of simplicity,in the examples we will consider RTTsd = RTT, V s,d G V), whichcorresponds to the most stringent latency constraint (Figure 2.2). Weimposed these same constraints also in the classical approach. Look-ing at the CA solution we observe that using our methodology a muchhigher data rate than the classical approach is required, as shown by theaverage link utilization p\ = 0.64. Also when considering the buffer sizedesign, we observe that the adoption of the M\x]/M/1/B model leadsto larger buffer requirements than the one with a simpler M/M/l/Bmodel.
Table 2.2 shows the average packet delay E[T], the average queuesize E[N], and the packet loss probability PiOss, fr°m the M^X}/M/l/Bqueue model and from ns-2 simulations (considering droptail and REDbuffers). We can observe good agreement between model and simulationsresults. Notice also that the assumption of exponential length packetsdoes not affect the performance evaluation. Indeed, recalling that inthe simulation all data packets have a fixed length of 1460 bytes, nosignificant differences are noticed. This point out as an indication thatpacket length distribution is not a critical factor.
Table 2.3 reports file transfer latencies for different flow sizes (in num-ber of segments), as estimated by the CSA model (second column) and

50 NEXT GENERATION INTERNET
Table 2.1. Design results for bottleneck network
M[x]/M/1/B M/M/l/B
fi[Mbps] 16 16Ct[Mbps] 25 17
pi 0.64 0.93Bi\pkts] 79 28
Table 2.2. Model and simulation results for bottleneck network (network layer)
Mm/M/1/B droptail RED
E[T] 0.0095 0.010 0.0091E[N] 13.2 13.4 12.4Pioss 0.0098 0.0044 0.0039
as observed by simulations. Results are shown considering both our ap-proach and the classical methodology, and by considering either droptailor RED buffers. We can observe that the accuracy of the network designobtained with our methodology is extremely good, with flow latenciesalways meeting the QoS constraints. Note also that longer flows obtaina much higher throughput than the target, because the flow transferlatency constraint is more stringent (as also shown in Figure 2.2). Onthe contrary, the network design obtained with the classical formula failsto meet the QoS constraints. This is mainly due to the adoption of anM/M/l queue model, which fails to capture the high burstiness of IPtraffic. No major differences are visible when RED buffers are presentin the network, if our methodology is adopted, while a degradation ofperformance is observed if the classical approach is used. This is dueto the very small buffer sizes resulting from the classical design, whichdo not allow RED to work properly, and therefore cause a large packetdropping probability.
4.2 Multi-bottleneck topologies
As a second example, we present results obtained considering themulti-bottleneck mesh network shown in Figure 2.4 with 5 nodes and12 links. In this case, link propagation delays are all equal to 0.5ms,that correspond to a link length of 150 Km. Figure 2.4 shows link iden-tifiers, link weights (in parentheses), and the traffic requirements matrixF. Link weights are chosen in order to have one single path (by using aminimum cost routing algorithm) for every source/destination pair. A

2 Design of IP VPNs under End-to-end QoS Constraints 51
Table 2.3. Model and simulation results for bottleneck network (Lt)
M[x]/M/1/B M/M/l/B
seg. CSA droptail RED droptail RED
12461019
0.05s0.08s0.12s0.16s0.20s0.26s
0.08s0.09s0.12s0.13s0.15s0.18s
0.05s0.08s0.11s0.13s0.16s0.19s
1.84s2.12s2.44s2.56s2.84s3.16s
1.56s2.31s3.71s5.26s6.59s10.41s
195 2.07Mbps 5.2Mbps 5.1Mbps 180kbps 15kbps
(8)
O/D
1
2
3
4
5
1
0
9
4
8
3
2
7
0
1
1
8
3
9
3
0
6
4
4
8
9
8
0
9
5
3
2
7
2
0
Traffic Matrix [Mbps]
Figure 2.4- 5-node network: topology and traffic requirements
number of peripheral links (not shown in the picture) are attached toeach node. These links are not congested, their capacities being equal to30 Mbps, and their propagation delays are uniformly distributed between0.01 and 0.03ms.
We considered the same QoS target constraints for all source/destina-tion pairs, which are: (i) file latency Lt < 0.5s for TCP flows shorterthan 20 segments, and (ii) throughput Th > 512 Kbps for TCP flowslonger than 20 segments. Selecting P/oss = 0.01, we obtain as designconstraint RTT < 0.07s as can be seen in Figure 2.2.
The CA and BA problems associated with this network have 12 un-known variables and 11 constraint functions (we have discarded 9 re-dundant constraint functions). Table 2.4 reports the link capacities,link utilizations, and buffer sizes obtained with the proposed method.We also report in the same table the average packet delay E[T], averagequeue size E[N], and the average packet loss probability Pi0Ss-> computedusing the Mw/M/l/B queue model.

52 NEXT GENERATION INTERNET
Table 2.4- Design results for 5-node network
Link
123456789101112
C [Mbps]
18.923.926.911.94.425.418.423.423.913.99.43.4
204.16
M[X}/M/1/B
P
0.850.880.890.750.670.820.760.810.880.790.850.58
~P
0.794
B
1962612651378818416018824315416372
B
175
E[T]
0.0330.0350.0340.0310.0610.0210.0210.0220.0340.0320.0620.061
E[T]
0.037
E[N]
47.865.273.225.316.140.226.837.063.331.143.910.8
E[N]
40.0
Ploss
0.0060.0040.0060.0040.0100.0040.0020.0030.0050.0050.01
0.009
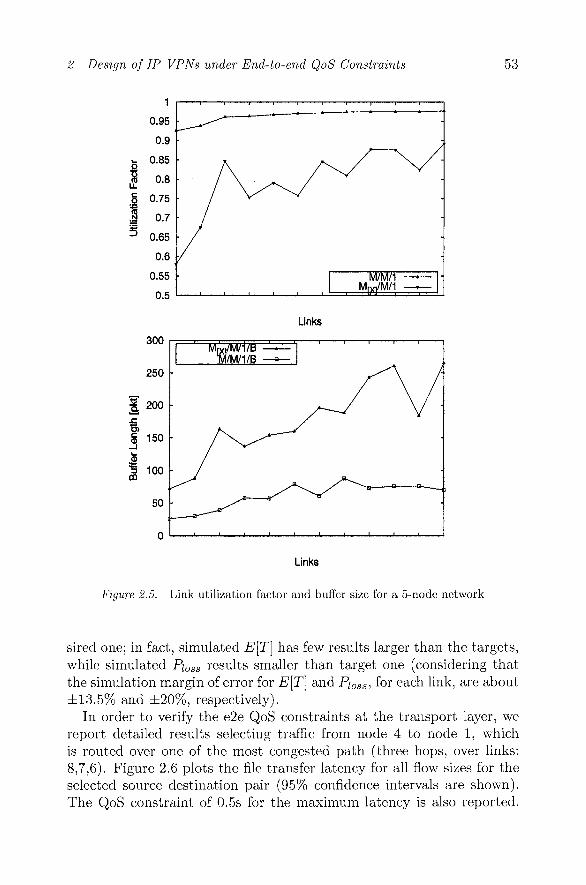
It can be noticed that the link utilization factors are in the range[0.67,0.89], with average equal to about ~p = 0.8. Buffer sizes are inthe range [70 : 270], with average B — 175, which is about 4 times theaverage number of packets in the queue (E[N] = 40). This is due tothe bursty arrival process of IP traffic, which is well captured by theM[X]/M/1/B model.
To complete the evaluation of the new methodology, we compare thelink utilization factors and buffer sizes obtained when considering theclassical algorithm, i.e., by using an M/M/l/B queueing model. Fig-ure 2.5 shows the link utilizations (first plot) and buffer sizes (secondplot) obtained with our method and with the classical approach. It canbe immediately noticed that considering the burstiness of IP traffic rad-ically changes the network design. Indeed, the link utilizations obtainedwith our methodology are much smaller than those produced by theclassical approach, and buffers are much longer.
To evaluate the quality of the design results, we ran ns-2 simula-tions for droptail and RED buffers. Considering first network layer QoSparameters (E[T] and PjoSS), Table 2.5 reports ns-2 simulation resultsfor the average packet delay and the average packet loss probability onevery link (considering droptail and RED buffers). It can be noticedthat the resulting delay and loss probability are very close to the de-
2 Design of IP VPNs under End-to-end QoS Constraints 53
1
0.95
0.9
0.85
0.8
0.75
0.7
0.65
0.6
0.55
0.5
M7M7rM[yl/M/1
Links
Links
Figure 2.5. Link utilization factor and buffer size for a 5-node network
sired one; in fact, simulated E[T] has few results larger than the targets,while simulated Pioss results smaller than target one (considering thatthe simulation margin of error for E[T] and P/oss, for each link, are about±13.5% and ±20%, respectively).
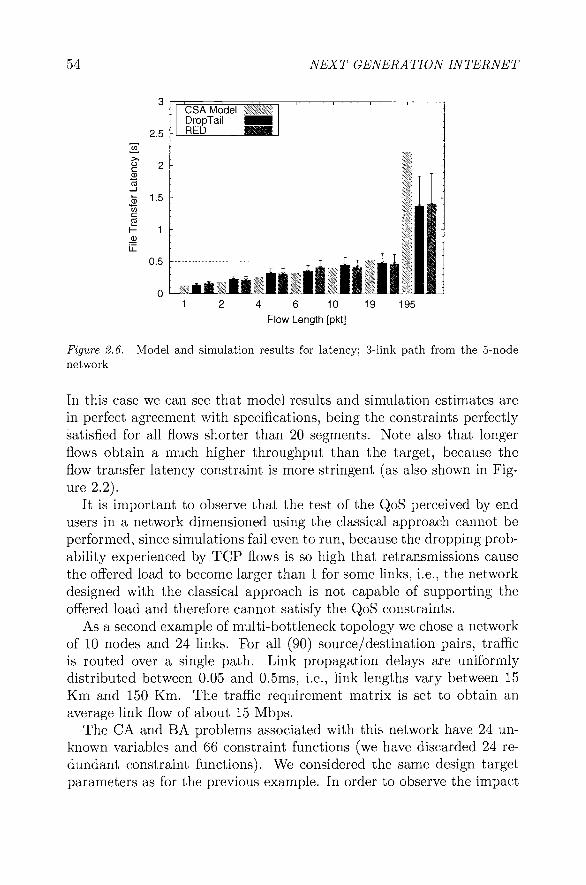
In order to verify the e2e QoS constraints at the transport layer, wereport detailed results selecting traffic from node 4 to node 1, whichis routed over one of the most congested path (three hops, over links:8,7,6). Figure 2.6 plots the file transfer latency for all flow sizes for theselected source destination pair (95% confidence intervals are shown).The QoS constraint of 0.5s for the maximum latency is also reported.
54 NEXT GENERATION INTERNET
2.5
1
0.5
0
CSA ModelDropTailRED
4 6 10Flow Length [pkt]
19 195
Figure 2.6. Model and simulation results for latency; 3-link path from the 5-nodenetwork
In this case we can see that model results and simulation estimates arein perfect agreement with specifications, being the constraints perfectlysatisfied for all flows shorter than 20 segments. Note also that longerflows obtain a much higher throughput than the target, because theflow transfer latency constraint is more stringent (as also shown in Fig-ure 2.2).
It is important to observe that the test of the QoS perceived by endusers in a network dimensioned using the classical approach cannot beperformed, since simulations fail even to run, because the dropping prob-ability experienced by TCP flows is so high that retransmissions causethe offered load to become larger than 1 for some links, i.e., the networkdesigned with the classical approach is not capable of supporting theoffered load and therefore cannot satisfy the QoS constraints.
As a second example of multi-bottleneck topology we chose a networkof 10 nodes and 24 links. For all (90) source/destination pairs, trafficis routed over a single path. Link propagation delays are uniformlydistributed between 0.05 and 0.5ms, i.e., link lengths vary between 15Km and 150 Km. The traffic requirement matrix is set to obtain anaverage link flow of about 15 Mbps.
The CA and BA problems associated with this network have 24 un-known variables and 66 constraint functions (we have discarded 24 re-dundant constraint functions). We considered the same design targetparameters as for the previous example. In order to observe the impact

2 Design of IP VPNs under End-to-end QoS Constraints 55
Table 2.5. Simulation results for 5-node network (network layer)
Link
123456789101112
E[T]
0.0290.0150.0190.0330.0790.0180.0200.0230.0240.0310.0550.096
drop tail
E[N]
40.326.840.325.520.433.424.438.844.529,238.216.5
±loss
0.0020.0010.0010.0040.0050.0030.0040.0050.0020.0030.0020.010
E[T]
0.0270.0190.0290.0330.0860.0210.0260.0330.0200.0310.0520.090
RED
E[N]
38.335.961.625.622.337.831.254.836.629.336.315.4
±loss
0.0040.0020.0030.0040.0080.0050.0020.0040.0020.0030.0050.010
of traffic load and performance constraints on our design methodology,we consider different numerical experiments.
Figure 2.7 shows the range of network link utilizations versus trafficload (first plot). Looking at how traffic requirements impact the CAproblem, we observe that the larger is the traffic load, the higher theutilization factor. This is quite intuitively explained by a higher statis-tical multiplexing gain, and by the fact that the RTT is less affectedby the transmission delay of packets at higher speed. The behavior ofbuffer sizes versus traffic requirements is shown in the second plot. Asexpected, the larger is the traffic load the higher the space needed inqueue (buffer sizes).
The impact of more stringent QoS requirements is considered in Fig-ure 2.8 (Pioss — 0.01, link traffic load = 15 Mbps). Notice that, in orderto satisfy a very tight constraint (file latency Lt < 0.2s), it is necessaryan utilization factor close to 20% on some particularly congested links(first plot). Tight constraints mean packet delays with small values andthus larger capacity values concerning the link flows. On the contrary,relaxing the QoS constraints, we note a general increase in the link uti-lization, up to 90%. The behavior of buffer sizes versus file transferlatency requirements is shown in the second plot.
Finally, Figure 2.9 shows link utilizations and buffer sizes consideringdifferent packet loss probability constraints, while keeping fixed the filetransfer latency Lt < 2s and throughput T^ > 512 Kbps (link traffic load

56 NEXT GENERATION INTERNET
0.8 -
i«0.4 -
0.2 •Average —•—
Min — :Max —*—
5 10 15 20
Source/Destination Average Traffic [Mbps]
300 -
5 10 15Source/Destination Average Traffic [Mbps]
20
Figure 2.7. Link utilization factor and buffer length for a 10-node network (consid-ering different source/destination traffics)
= 15 Mbps). Obviously, an increase of Pi0Ss values forces the transportlayer QoS translator to reduce the RTT to meet the QoS constraints.As a consequence, the utilization factor decreases (first plot).
More interesting is the effect of selecting different values of Pi0Ss o n
buffer sizes (second plot). Indeed, to obtain Pioss < 0.005, buffer sizeslonger than 350 packets are required, while Pi0Ss < 0.02 can be guaran-teed with buffers shorter than 70 packets. This result stems from thecorrelation of TCP traffic and is not captured by a Poisson model.

2 Design of IP VPNs under End-to-end QoS Constraints 57
•« 0.6
13
0.5 1 1.5File Transfer Latency [s]
600 -
0.5 1 1.5File Transfer Latency [s]
Figure 2.8. Link utilization factor and buffer length for a 10-node network (consid-ering different target file transfer latencies)
Running simulations in ns-2 with more than about 1000 TCP connec-tions becomes very expensive with standard computers, so in this casewe performed path simulations rather than simulating the complete net-work, i.e., we selected a single path, and simulated only that one, usingns-2. TCP connection opening rates are determined so as to set the linkflows to their determined values. The results obtained by path simula-tions are in general a worst case with respect to what would be obtainedby running simulations of the entire network, because the "interfering"

58 NEXT GENERATION INTERNET
0.8
5•g 0.4'3
0.2
0.005 0.01 0.015
Packet Loss Probability
0.02
400
0.005 0.01 0.015
Packet Loss Probability
0.02
Figure 2.9. Link utilization factor and buffer length for a 10-node network (consid-ering different target packet loss probabilities)
traffic is more aggressive, since it does not cross all links along its path,hence no loss and no traffic shaping occurs.
As an example, by choosing a 4-link path, we obtained average packetdelay E[T] and average packet loss probability Pi0Ss results that are re-ported in Table 2.6, considering three scaled versions of the traffic matrix(and network designs). It can be observed that, for all the traffic sce-narios, simulated E[T] are in accordance to the targets, and simulatedPloss have results smaller than the targets (considering that the simu-
2 Design of IP VPNs under End-to-end QoS Constraints 59
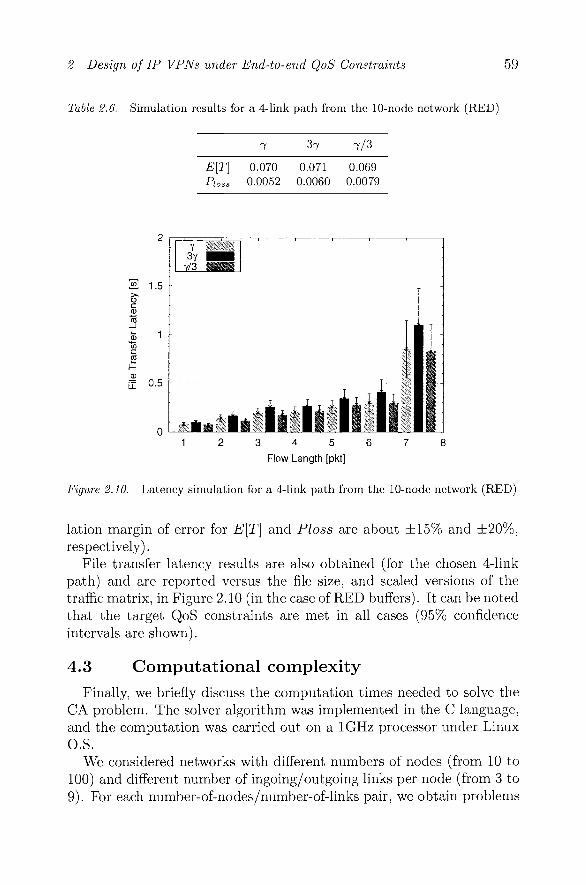
Table 2.6. Simulation results for a 4-link path from the 10-node network (RED)
37 7/3
E[T] 0.070 0.071 0.069Pioss 0.0052 0.0060 0.0079
Figure 2.10. Latency simulation for a 4-link path from the 10-node network (RED)
lation margin of error for E[T] and Ploss are about ±15% and ±20%,respectively).
File transfer latency results are also obtained (for the chosen 4-linkpath) and are reported versus the file size, and scaled versions of thetraffic matrix, in Figure 2.10 (in the case of RED buffers). It can be notedthat the target QoS constraints are met in all cases (95% confidenceintervals are shown).
4,3 Computational complexity
Finally, we briefly discuss the computation times needed to solve theCA problem. The solver algorithm was implemented in the C language,and the computation was carried out on a lGHz processor under LinuxO.S.
We considered networks with different numbers of nodes (from 10 to100) and different number of ingoing/outgoing links per node (from 3 to9). For each number-of-nodes/number-of-links pair, we obtain problems

60 NEXT GENERATION INTERNET
with different number of variables and different number of constraints.CPU times range from less than 1 second (to solve a 10-nodes/30-linksnetwork design problem) to about than 40 minutes (to solve a 100-node/900-links network design problem).
5. Conclusion
In this chapter, we have proposed a new packet network design andplanning approach that is based on user-layer QoS parameters.
The main novelty of our approach is that it considers the end-to-end performance constrains at the application layer, mapping them intotransport layer QoS constraints first, and finally into network layer per-formance constraints. Traditional packet network design approachesmodel a communication network as a Jackson queueing network, thusassuming packet flows to be Poisson. A second important improvementwith respect to traditional approaches lies in the fact that we have triedto consider more realistic packet traffic models, accounting for both long-lived and short-lived TCP connections, and considering more complexsystems of queues which have been recently proved to effectively rep-resent the performance of modern IP networks (Garetto and Towsley,2003), Examples of application of the proposed design methodology todifferent networking configurations have shown the effectiveness of ourapproach.
Acknowledgments The authors would like to thank the anonymousreviewers for their helpful comments and suggestions.
ReferencesCardwell, N., Savage, S., and Anderson, T. (2000). Modeling TCP latency. In: Pro-
ceedings of Infocom 2000, pp. 1742-1751, Tel Aviv, Israel.Chao, X., Miyazawa, M., and Pinedo, M. (1999). Queueing Networks, Customers,
Signals and Product Form Solutions. John Wiley.Cheng, K.T. and Lin, F.Y.S. (1995). Minmax end-to-end delay routing and capacity
assignment for virtual circuit networks. In: Proceedings of IEEE Globecom 1995,pp. 2134-2138.
Claffy, K., Miller, G., and Thompson, K. (1998). The nature of the beast: Recent traf-fic measurements from an Internet backbone. In: Proceedings of INET'98, Geneva,CH.
Floyd, S. and Jacobson, V. (1993). Random early detection gateways for congestionavoidance. IEEE/ACM Transactions on Networking, 1(4):397-413.
Fraleigh, C, Tobagi, F., and Diot, C. (2003). Provisioning IP backbone networks tosupport latency sensitive traffic. In: Proceedings of IEEE Infocom 2003, pp. 375-385, San Francisco, CA.
Garetto, M. and Towsley, D. (2003). Modeling, simulation and measurements of queu-ing delay under long-tail Internet traffic. In: Proceedings of ACM SIGMETRICS
2 Design of IP VPNs under End-to-end QoS Constraints 61
2003, pp. 47-57, San Diego, CA.Gavish, B. and Neuman, I. (1989). A system for routing and capacity assignment
in computer communication networks. IEEE Transactions on Communications,37(4):360-366.
Gavish, B. (1992). Topological design of computer communication networks - theoverall design problem. European lournal of Operational Research, 58:149-172.
Gribble, S.D. and Brewer, E.A. (1997). System design issues for Internet middlewareservices: Deductions from a large client trace. In: US ITS'97.
Kamimura, K. and Nishino, H. (1991). An efficient method for determining economi-cal configurations of elementary packet-switched networks. IEEE Transactions onCommunications, 39(2):278-288.
Kleinrock, L. (1976). Queueing Systems, Volume II: Computer Applications. WileyInterscience, New York.
Knoche, H. and de Meer, H. (1997). Quantitative QoS mapping: A unifying ap-proach. In: Proceedings of the 5th Int. Workshop on Quality of Service (IWQoS97),pp. 347-358, New York, NY.
Mai Hoang, T.T. and Zorn, W. (2001). Genetic algorithms for capacity planning of IP-based networks. In: Proceedings of the 2001 Congress on Evolutionary ComputationCEC2001, pp. 1309-1315.
Markopoulou, A,, Tobagi, F., and Karam, M. (2002). Assessment of VoIP qualityover Internet backbones. In: Proceedings of IEEE Infocom 2002, pp. 747-760, NewYork, NY.
Mellia, M., Carpani, A., and Lo Cigno, R. (2002). Measuring IP and TCP behavioron edge nodes. In: Proceedings of IEEE Globecom 2002, pp. 2533-2537, Taipei,TW.
Nagarajan, R. and Towsley, D. (1992). A Note on the convexity of the probability ofa full buffer in the M/M/l/K queue. CMP SCI Technical Report TR 92-85.
Padhye, J., Firoiu, V., Towsley, D., and Kurose, J. (2000). Modeling TCP Reno per-formance: a simple model and its empirical validation. IEEE/ACM Transactionson Networking, 8(2):133-145.
Paxson, V. and Floyd, S. (1995). Wide-area traffic: The failure of poisson modeling.IEEE/ACM Transactions on Networking, 3(3):226-244.
Rosolen, V., Bonaventure, O., and Leduc, G. (1999). A RED discard strategy for ATMnetworks and its performance evaluation with TCP/IP traffic. ACM ComputerCommunication Review, 29(3):23-43.
Wright, M. (1992). Interior methods for constrained optimization. Acta Numerica,1:341-407.