chapter 14 financial planning lawrence j. gitman jeff madura introduction to finance
TRANSCRIPT

Chapter
14
Financial Planning
Lawrence J. GitmanJeff Madura
Introduction to Finance

14-2Copyright © 2001 Addison-Wesley
Understand the financial planning process, including long-term (strategic) financial plans and short-term (operating) plans.
Discuss cash planning, sales forecasts, and the procedures for preparing the cash budget.
Describe how the cash budget is evaluated and the procedures for coping with uncertainty in the cash budget.
Learning Goals

14-3Copyright © 2001 Addison-Wesley
Prepare a pro forma income statement using both the percent-of-sales method and a breakdown of costs and expenses into their fixed and variable components.
Explain the procedures used to develop a pro forma balance sheet using the judgmental approach and an external financing required figure.
Cite the weaknesses of the simplified approaches to pro forma preparation and the common uses of pro forma financial statements.
Learning Goals

14-4Copyright © 2001 Addison-Wesley
The Financial Planning Process
Long-Term (Strategic) Financial Plans Long-term (strategic) financial plans lay out a
company’s planned financial actions and the anticipated impact of those actions over periods ranging from 2 to 10 years.
Firms that are exposed to a high degree of operating uncertainty tend to use shorter plans.
These plans are one component of a company’s integrated strategic plan (along with production and marketing plans) that guide a company toward achievement of its goals.

14-5Copyright © 2001 Addison-Wesley
The Financial Planning Process
Long-Term (Strategic) Financial Plans Long-term financial plans consider a number
of financial activities including:
• Proposed fixed asset investments
• Research and development activities
• Marketing and product development
• Capital structure
• Sources of financing
These plans are generally supported by a series of annual budgets and profit plans.

14-6Copyright © 2001 Addison-Wesley
The Financial Planning Process
Short-Term (Operating) Financial Plans Short-term (operating) financial plans specify short-term
financial actions and the anticipated impact of those actions and typically cover a 1- to 2-year operating period.
Key inputs include the sales forecast and other operating and financial data.
Key outputs include operating budgets, the cash budget, and pro forma financial statements.
This process is described graphically on the following slide.

14-7Copyright © 2001 Addison-Wesley
The Financial Planning Process
Short-Term (Operating) Financial Plans
Figure 14.1

14-8Copyright © 2001 Addison-Wesley
The Financial Planning Process
Short-Term (Operating) Financial Plans As indicated in the previous exhibit, short-term financial planning
begins with a sales forecast.
From this sales forecast, production plans are developed that consider lead times and raw material requirements.
From the production plans, direct labor, factory overhead, and operating expense estimates are developed.
From this information, the pro forma income statement and cash budget are prepared—ultimately leading to the development of the pro forma balance sheet.

14-9Copyright © 2001 Addison-Wesley
Cash Planning: Cash Budgets
The cash budget is a statement of the firm’s planned inflows and outflows of cash.
It is used to estimate short-term cash requirements with particular attention to anticipated cash surpluses and shortfalls.
Surpluses must be invested and shortfalls must be funded.
The cash budget is a useful tool for determining the timing of cash inflows and outflows during a given period.
Typically, monthly budgets are developed covering a 1-year time period.

14-10Copyright © 2001 Addison-Wesley
The cash budget begins with a sales forecast, which is simply a prediction of the sales activity during a given period.
A prerequisite to the sales forecast is a forecast for the economy, the industry, the company, and other external and internal factors that might influence company sales.
The sales forecast is then used as a basis for estimating the monthly cash inflows that will result from projected sales—and outflows related to production, overhead and other expenses.
Cash Planning: Cash Budgets

14-11Copyright © 2001 Addison-Wesley Table 14.1
Cash Planning: Cash Budgets

14-12Copyright © 2001 Addison-Wesley
Cash Planning: Cash Budgets
An Example: The Intercom Company
Intercom Company, a defense contractor, is developing a cash budget for October, November, and December. Intercom’s sales in August and September were $100,000 and $200,000 respectively. Sales of $400,000, $300,000 and $200,000 have been forecast for October, November, and December. Historically, 20% of the firm’s sales have been for cash, 50% have been collected after 1 month, and the remaining 30% after 2 months. In December, Intercom will receive a $30,000
dividend from stock in a subsidiary.

14-13Copyright © 2001 Addison-Wesley
Cash Planning: Cash Budgets
An Example: The Intercom Company Based on this information, we are able to develop the following
schedule of cash receipts for Intercom Company
Table 14.2

14-14Copyright © 2001 Addison-Wesley
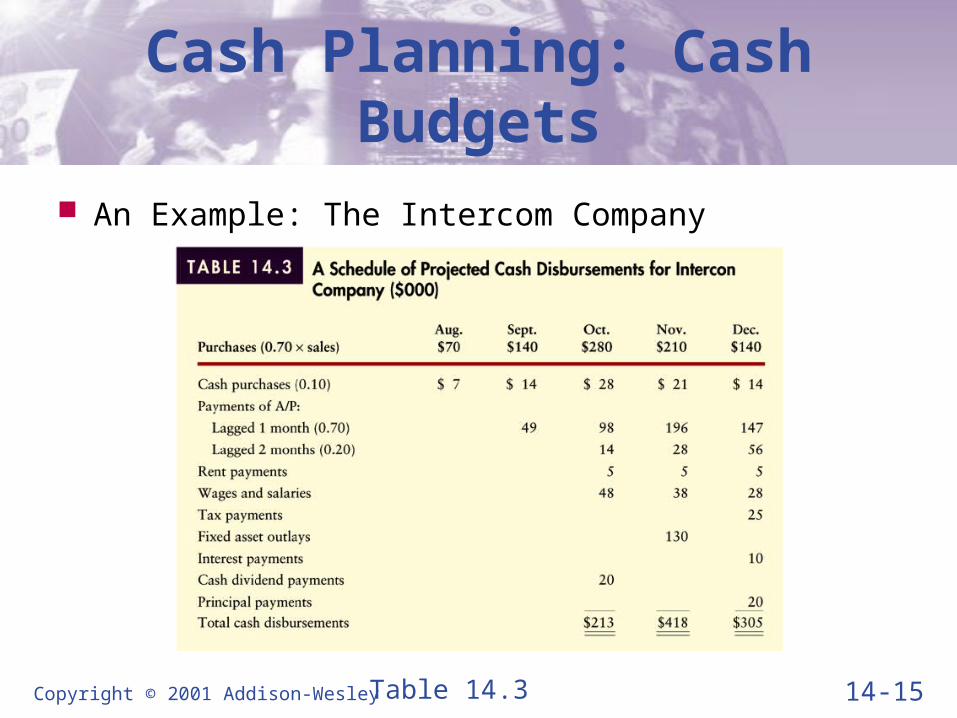
Cash Planning: Cash Budgets
An Example: The Intercom Company Intercom Company has also gathered the relevant information
for the development of a cash disbursement schedule. Purchases will represent 70% of sales—10% will be paid immediately in cash, 70% is paid the month following the purchase, and the remaining 20% is paid two months following the purchase. The firm will also expend cash on rent, wages and salaries, taxes, capital assets, interest, dividends, and a portion of the principal on its loans. The resulting disbursement schedule thus follows.
14-15Copyright © 2001 Addison-Wesley
Cash Planning: Cash Budgets
An Example: The Intercom Company
Table 14.3

14-16Copyright © 2001 Addison-Wesley
Cash Planning: Cash Budgets
An Example: The Intercom Company The Cash Budget for Intercom can be derived by combining the
receipts budget with the disbursements budget. At the end of September, Intercom’s cash balance was $50,000, notes payable was $0, and marketable securities balance was $0. Intercom also wishes to maintain a minimum cash balance of $25,000. As a result, it will have excess cash in October, and a deficit of cash in November and December. The resulting cash budget follows.

14-17Copyright © 2001 Addison-Wesley
Cash Planning: Cash Budgets
An Example: The Intercom Company
Table 14.4

14-18Copyright © 2001 Addison-Wesley
The excess cash of $22,000 in October should be invested in marketable securities. The deficits in November and December need to be financed.
Evaluating Cash Budgets
Cash budgets indicate the extent to which cash shortages or surpluses are expected in the months covered by the forecast.

14-19Copyright © 2001 Addison-Wesley
Coping with Uncertainty in the Cash Budget
One way to cope with cash budgeting uncertainty is to prepare several cash budgets based on several forecasted scenarios (i.e., pessimistic, most likely, optimistic).
From this range of cash flows, the financial manager can determine the amount of financing necessary to cover the most adverse situation.
This method will also provide a sense of the riskiness of alternatives.
An example of this sort of “sensitivity analysis” for the Intercom Company for the month of October is shown on the following slide.

14-20Copyright © 2001 Addison-Wesley
Coping with Uncertainty in the Cash Budget
Table 14.5

14-21Copyright © 2001 Addison-Wesley
Profit Planning: Pro Forma Financial Statements
Pro forma financial statements are projected, or forecast, financial statements—income statements and balance sheets.
The inputs required to develop pro forma statements using the most common approaches include: Financial statements from the preceding year
The sales forecast for the coming year
Key assumptions about a number of factors
The development of pro forma financial statements will be demonstrated using the financial statements for Carson Manufacturing.

14-22Copyright © 2001 Addison-Wesley
Profit Planning: Pro Forma Financial Statements
Table 14.6

14-23Copyright © 2001 Addison-Wesley
Profit Planning: Pro Forma Financial Statements
Table 14.7

14-24Copyright © 2001 Addison-Wesley Table 14.8
Profit Planning: Pro Forma Financial Statements
Step 1: Start with a Sales Forecast The first and key input for developing pro forma financial
statements is the sales forecast for Carson Manufacturing.

14-25Copyright © 2001 Addison-Wesley Table 14.8
Profit Planning: Pro Forma Financial Statements
Step 1: Start with a Sales Forecast
This forecast is based on an increase from $20 to $25 per unit for Model X and $40 to $50 per unit for Model Y.
These increases are required to cover anticipated increases in various costs, including labor, materials, and overhead.

14-26Copyright © 2001 Addison-Wesley
Profit Planning: Pro Forma Financial Statements
Step 2: Develop the Pro Forma Income Statement One method for developing a pro forma income
statement is the percent-of-sales method.
This method starts with the sales forecast and then expresses the cost of goods sold, operating expenses, and other accounts as a percentage of projected sales.
By using the dollar values taken from Carson’s 2001 income statement (Table 14.6), we find that these percentages are as follows:

14-27Copyright © 2001 Addison-Wesley
Profit Planning: Pro Forma Financial Statements
Step 2: Develop the Pro Forma Income Statement

14-28Copyright © 2001 Addison-Wesley
Profit Planning: Pro Forma Financial Statements
Step 2: Develop the Pro Forma Income Statement Using these percentages and the 20021 sales
forecast we developed, the entire income statement can be projected.
The results are shown on the following slide.
It is important to note that this method implicitly assumes that all costs are variable and that all increase or decrease in proportion to sales.
This will understate profits when sales are increasing and overstate them when sales are decreasing.

14-29Copyright © 2001 Addison-Wesley Table 14.9
Profit Planning: Pro Forma Financial Statements
Step 2: Develop the Pro Forma Income Statement

14-30Copyright © 2001 Addison-Wesley
Profit Planning: Pro Forma Financial Statements
Step 2: Develop the Pro Forma Income Statement Clearly, some of the firm’s expenses will increase
with the level of sales while others will not.
As a result, the strict application of the percent-of-sales method is a bit naïve.
The best way to generate a more realistic pro forma income statement is to segment the firm’s expenses into fixed and variable components.
This may be demonstrated as follows.

14-31Copyright © 2001 Addison-Wesley
Profit Planning: Pro Forma Financial Statements
Step 2: Develop the Pro Forma Income Statement

14-32Copyright © 2001 Addison-Wesley
Profit Planning: Pro Forma Financial Statements
Step 3: Develop the Pro Forma Balance Sheet Probably the best approach to use in developing the
pro forma balance sheet is the judgmental approach.
Using this approach, the values of some balance sheet accounts are estimated while others are calculated.
The company’s external financing (required) is used as the balancing account.
To apply this method to Carson Manufacturing, a number of simplifying assumptions must be made.

14-33Copyright © 2001 Addison-Wesley
Profit Planning: Pro Forma Financial Statements
Step 3: Develop the Pro Forma Balance Sheet A minimum cash balance of $6,000 is desired.
Marketable securities will remain at their current level of $4,000.
Accounts receivable will be approximately $16,875 which represents 45 days of sales on average [(45/365) x $135,000].
Ending inventory will remain at about $16,000. 25% ($4,000) represents raw materials and 75% ($12,000) is finished goods.
A new machine costing $20,000 will be purchased. Total depreciation will be $8,000. Adding $20,000 to existing net fixed assets of $51,000 and subtracting the $8,000 depreciation yields a net fixed assets figure of $63,000.

14-34Copyright © 2001 Addison-Wesley
Profit Planning: Pro Forma Financial Statements
Step 3: Develop the Pro Forma Balance Sheet Purchases will be $40,500 which represents 30% of annual
sales (30% x $135,000). Carson takes about 72 days to pay on its accounts payable. As a result, accounts payable will equal $8,100 [(72/360) x $40,500].
Taxes payable will be $455 which represents one-fourth of the 1998 tax liability.
Notes payable will remain unchanged at $8,300.
There will be no change in other current liabilities, long-term debt, and common stock.
Retained earnings will change in accordance with the pro forma income statement.

14-35Copyright © 2001 Addison-Wesley Table 14.10
Profit Planning: Pro Forma Financial Statements
Step 3: Develop the Pro Forma Balance Sheet

14-36Copyright © 2001 Addison-Wesley
Evaluation of Pro Forma Statements
Weaknesses of Simplified Approaches The major weaknesses of the approaches to pro
forma statement development outlined above lie in two assumptions:
• That the firm’s past financial performance will be replicated in the future.
• That certain accounts can be forced to take on desired values.
For these reasons, it is imperative to first develop a forecast of the overall economy and make adjustments to accommodate other facts or events.
14-37Copyright © 2001 Addison-Wesley
Using Microsoft® Excel
The Microsoft® Excel Spreadsheets used in the Chapter 14 presentation can be downloaded from the Introduction to Finance companion web site: http://www.awl.com/gitman_madura

Chapter
14
End of Chapter
Lawrence J. GitmanJeff Madura
Introduction to Finance