chapter 13 charts: predicting corporate earningspredicting the markets: chapter 13 charts:...
TRANSCRIPT

Predicting the Markets:Chapter 13 Charts:
Predicting Corporate EarningsYardeni Research, Inc.
February 25, 2018
Dr. Edward YardeniChief Investment Strategist
Mali QuintanaSenior Economist
Please visit our sites atwww.yardeni.comblog.yardeni.com
thinking outside the box

Table Of Contents Table Of ContentsTable Of Contents
February 25, 2018 / Chapter 13 Charts: Predicting Corporate Earnings www.yardeni.com
Yardeni Research, Inc.
Predicting Corporate Earnings 1-24
95 96 97 98 99 00 01 02 03 04 05 06 07 08 09 10 11 12 13 14 15 16 17 18 19 2030
50
70
90
110
130
150
170
30
50
70
90
110
130
150
170Feb
95
96
97
98
9900
01 0203
04
05
06
07
0809
10
11
12
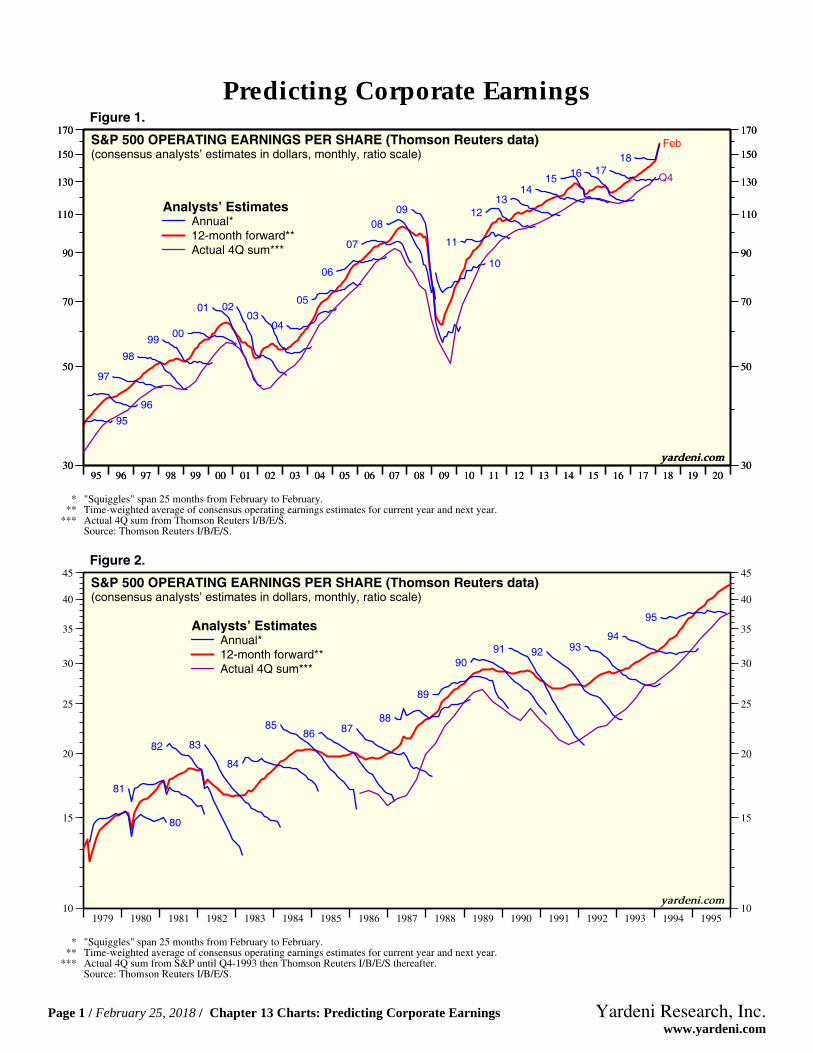
S&P 500 OPERATING EARNINGS PER SHARE (Thomson Reuters data)(consensus analysts’ estimates in dollars, monthly, ratio scale)
Analysts’ EstimatesAnnual*12-month forward**
* "Squiggles" span 25 months from February to February.** Time-weighted average of consensus operating earnings estimates for current year and next year.
*** Actual 4Q sum from Thomson Reuters I/B/E/S.Source: Thomson Reuters I/B/E/S.
yardeni.com
95 96 97 98 99 00 01 02 03 04 05 06 07 08 09 10 11 12 13 14 15 16 17 18 19 2030
50
70
90
110
130
150
170
30
50
70
90
110
130
150
170
Q4
1314
15 16 1718
Actual 4Q sum***
yardeni.com
Figure 1.
1979 1980 1981 1982 1983 1984 1985 1986 1987 1988 1989 1990 1991 1992 1993 1994 199510
15
20
25
30
35
40
45
10
15
20
25
30
35
40
45
80
81
82 83
84
8586 87
88
89
9091 92 93
94
95
S&P 500 OPERATING EARNINGS PER SHARE (Thomson Reuters data)(consensus analysts’ estimates in dollars, monthly, ratio scale)
Analysts’ EstimatesAnnual*12-month forward**Actual 4Q sum***
* "Squiggles" span 25 months from February to February.** Time-weighted average of consensus operating earnings estimates for current year and next year.
*** Actual 4Q sum from S&P until Q4-1993 then Thomson Reuters I/B/E/S thereafter.Source: Thomson Reuters I/B/E/S.
yardeni.com
Figure 2.
Predicting Corporate Earnings
Page 1 / February 25, 2018 / Chapter 13 Charts: Predicting Corporate Earnings www.yardeni.com
Yardeni Research, Inc.
2008 2009 2010 2011 2012 2013 2014 2015 2016 2017 201850
70
90
110
130
150
170
50
70
90
110
130
150
170
09
10
11
12
1314
1516 17
18
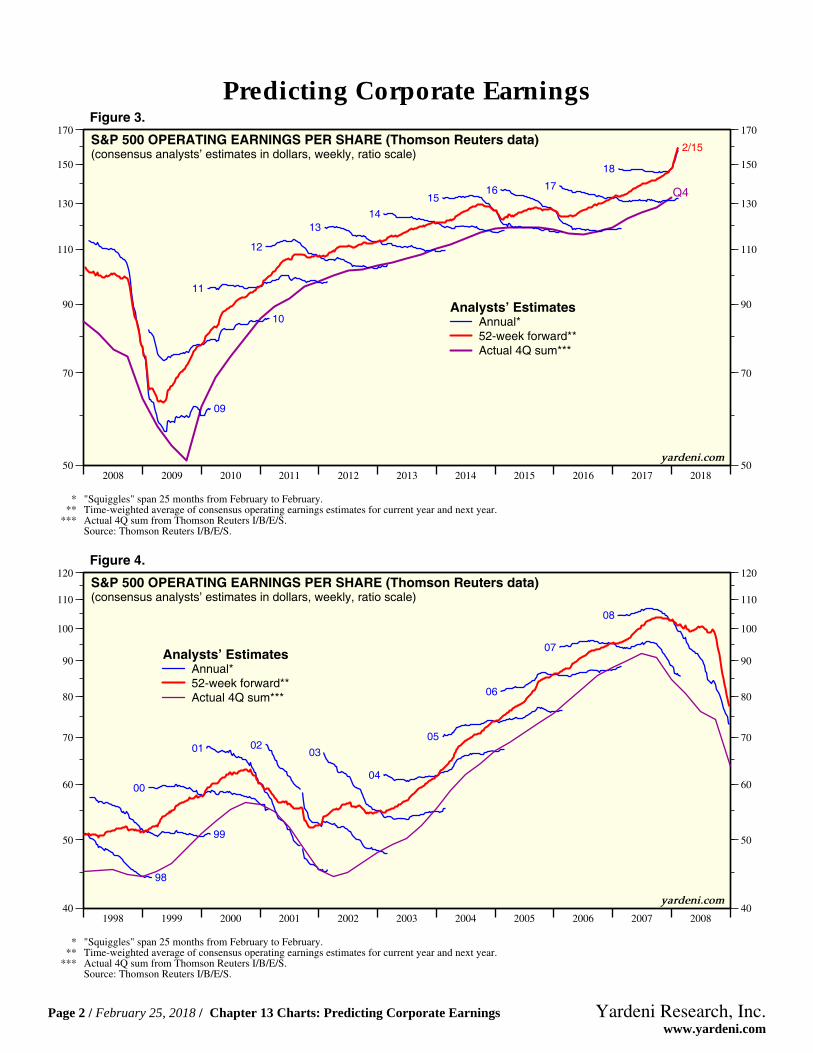
2/15S&P 500 OPERATING EARNINGS PER SHARE (Thomson Reuters data)(consensus analysts’ estimates in dollars, weekly, ratio scale)
Analysts’ EstimatesAnnual*52-week forward**Actual 4Q sum***
Q4
* "Squiggles" span 25 months from February to February.** Time-weighted average of consensus operating earnings estimates for current year and next year.
*** Actual 4Q sum from Thomson Reuters I/B/E/S.Source: Thomson Reuters I/B/E/S.
yardeni.com
Figure 3.
1998 1999 2000 2001 2002 2003 2004 2005 2006 2007 200840
50
60
70
80
90
100
110
120
40
50
60
70
80
90
100
110
120
98
99
00
01 0203
04
05
06
07
08
S&P 500 OPERATING EARNINGS PER SHARE (Thomson Reuters data)(consensus analysts’ estimates in dollars, weekly, ratio scale)
Analysts’ EstimatesAnnual*52-week forward**Actual 4Q sum***
* "Squiggles" span 25 months from February to February.** Time-weighted average of consensus operating earnings estimates for current year and next year.
*** Actual 4Q sum from Thomson Reuters I/B/E/S.Source: Thomson Reuters I/B/E/S.
yardeni.com
Figure 4.
Predicting Corporate Earnings
Page 2 / February 25, 2018 / Chapter 13 Charts: Predicting Corporate Earnings www.yardeni.com
Yardeni Research, Inc.
80 81 82 83 84 85 86 87 88 89 90 91 92 93 94 95 96 97 98 99 00 01 02 03 04 05 06 07 08 09 10 11 12 13 14 15 16 17 18-60
-50
-40
-30
-20
-10
0
10
20
30
-60
-50
-40
-30
-20
-10
0
10
20
30
9.4
8.7
2.4
8.8
8.3
8.2
5.0
2.4
-11.
0
-38.
9
-30.
9
-11.
6
-31.
7 -26.
4
-19.
3
-6.3
-20.
9
-35.
3
-26.
2
-15.
1
-5.4
-4.8
-5.2
-16.
0 -11.
3
-5.3
-33.
2 -29.
9
-14.
9
-8.8
-32.
3
-45.
6
-6.9
-7.8 -5
.8
-11.
3
-13.
0
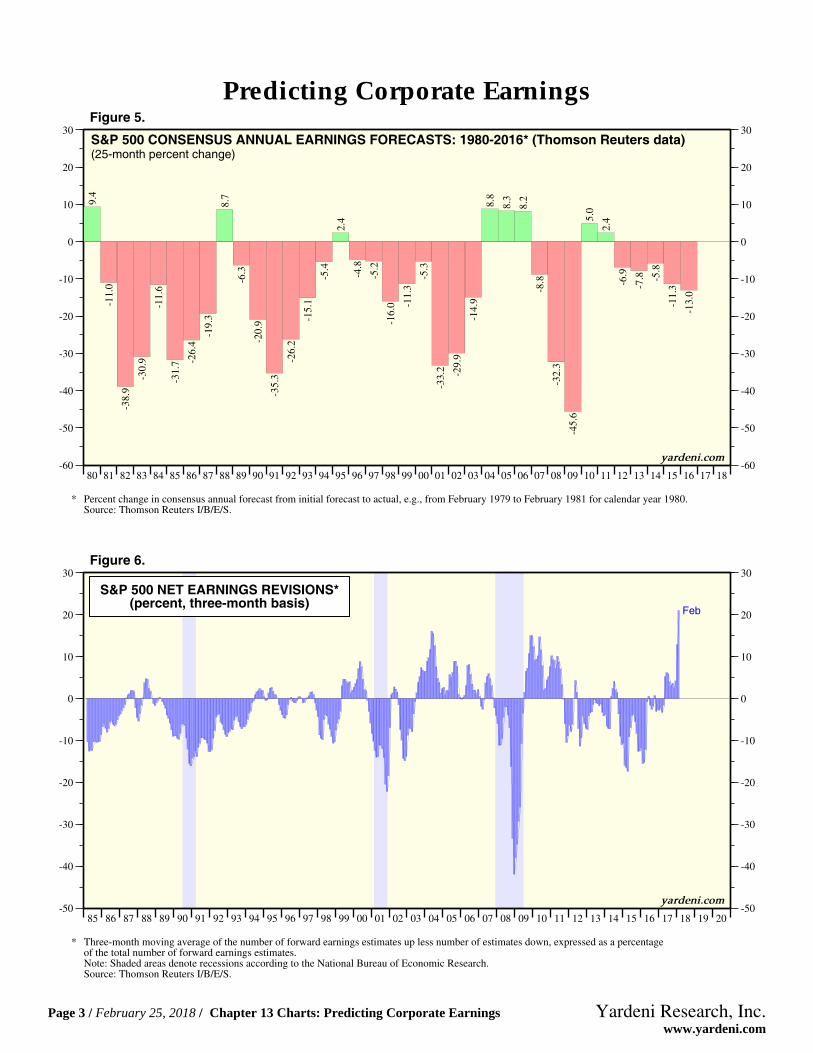
S&P 500 CONSENSUS ANNUAL EARNINGS FORECASTS: 1980-2016* (Thomson Reuters data)(25-month percent change)
Source: Thomson Reuters I/B/E/S.* Percent change in consensus annual forecast from initial forecast to actual, e.g., from February 1979 to February 1981 for calendar year 1980.
yardeni.com
Figure 5.
85 86 87 88 89 90 91 92 93 94 95 96 97 98 99 00 01 02 03 04 05 06 07 08 09 10 11 12 13 14 15 16 17 18 19 20-50
-40
-30
-20
-10
0
10
20
30
-50
-40
-30
-20
-10
0
10
20
30
S&P 500 NET EARNINGS REVISIONS*(percent, three-month basis)
Feb
yardeni.com
* Three-month moving average of the number of forward earnings estimates up less number of estimates down, expressed as a percentageof the total number of forward earnings estimates.Note: Shaded areas denote recessions according to the National Bureau of Economic Research.Source: Thomson Reuters I/B/E/S.
Figure 6.
Predicting Corporate Earnings
Page 3 / February 25, 2018 / Chapter 13 Charts: Predicting Corporate Earnings www.yardeni.com
Yardeni Research, Inc.
86 87 88 89 90 91 92 93 94 95 96 97 98 99 00 01 02 03 04 05 06 07 08 09 10 11 12 13 14 15 16 17 18 19 2010
20
30
40
50
60
70
80
90
100
110
120
130
140
150
160
170
180
10
20
30
40
50
60
70
80
90
100
110
120
130
140
150
160
170
180
Q4
2/15
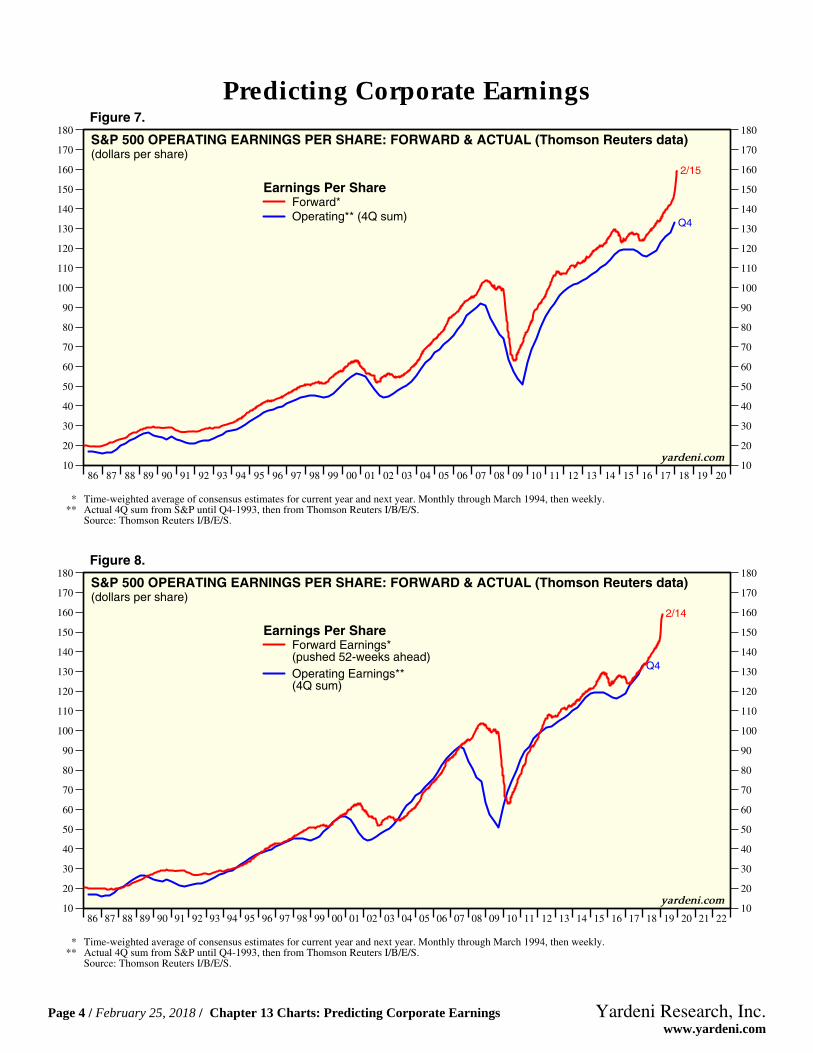
S&P 500 OPERATING EARNINGS PER SHARE: FORWARD & ACTUAL (Thomson Reuters data)(dollars per share)
Earnings Per Share
Operating** (4Q sum)Forward*
* Time-weighted average of consensus estimates for current year and next year. Monthly through March 1994, then weekly.** Actual 4Q sum from S&P until Q4-1993, then from Thomson Reuters I/B/E/S.
Source: Thomson Reuters I/B/E/S.
yardeni.com
Figure 7.
86 87 88 89 90 91 92 93 94 95 96 97 98 99 00 01 02 03 04 05 06 07 08 09 10 11 12 13 14 15 16 17 18 19 20 21 2210
20
30
40
50
60
70
80
90
100
110
120
130
140
150
160
170
180
10
20
30
40
50
60
70
80
90
100
110
120
130
140
150
160
170
180
Q4
2/14
S&P 500 OPERATING EARNINGS PER SHARE: FORWARD & ACTUAL (Thomson Reuters data)(dollars per share)
Earnings Per Share
Operating Earnings**(4Q sum)
Forward Earnings*(pushed 52-weeks ahead)
* Time-weighted average of consensus estimates for current year and next year. Monthly through March 1994, then weekly.** Actual 4Q sum from S&P until Q4-1993, then from Thomson Reuters I/B/E/S.
Source: Thomson Reuters I/B/E/S.
yardeni.com
Figure 8.
Predicting Corporate Earnings
Page 4 / February 25, 2018 / Chapter 13 Charts: Predicting Corporate Earnings www.yardeni.com
Yardeni Research, Inc.
79 80 81 82 83 84 85 86 87 88 89 90 91 92 93 94 95 96 97 98 99 00 01 02 03 04 05 06 07 08 09 10 11 12 13 14 15 16 17 18 19 20 210
250
500
750
1000
1250
1500
1750
2000
2250
2500
2750
3000
3250
0
250
500
750
1000
1250
1500
1750
2000
2250
2500
2750
3000
3250
x5
x10
x15
x20
x25
Jan
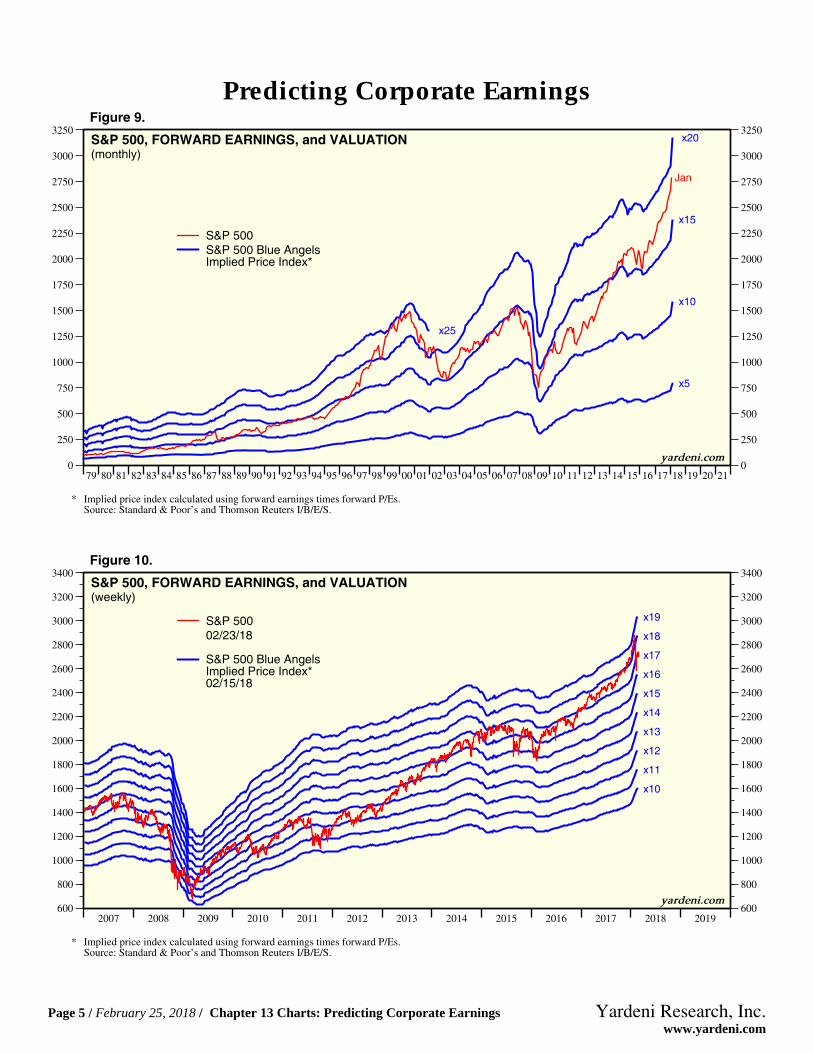
S&P 500, FORWARD EARNINGS, and VALUATION(monthly)
S&P 500S&P 500 Blue AngelsImplied Price Index*
* Implied price index calculated using forward earnings times forward P/Es.Source: Standard & Poor’s and Thomson Reuters I/B/E/S.
yardeni.com
Figure 9.
2007 2008 2009 2010 2011 2012 2013 2014 2015 2016 2017 2018 2019600
800
1000
1200
1400
1600
1800
2000
2200
2400
2600
2800
3000
3200
3400
600
800
1000
1200
1400
1600
1800
2000
2200
2400
2600
2800
3000
3200
3400
x10
x11
x12
x13
x14
x15
x16
x17
x18
x19
S&P 500, FORWARD EARNINGS, and VALUATION(weekly)
S&P 50002/23/18
S&P 500 Blue AngelsImplied Price Index*02/15/18
* Implied price index calculated using forward earnings times forward P/Es.Source: Standard & Poor’s and Thomson Reuters I/B/E/S.
yardeni.com
Figure 10.
Predicting Corporate Earnings
Page 5 / February 25, 2018 / Chapter 13 Charts: Predicting Corporate Earnings www.yardeni.com
Yardeni Research, Inc.
35 40 45 50 55 60 65 70 75 80 85 90 95 00 05 10 15 20 25.05
6.05
12.05
18.0524.0530.0536.05
.05
6.05
12.05
18.0524.0530.0536.05
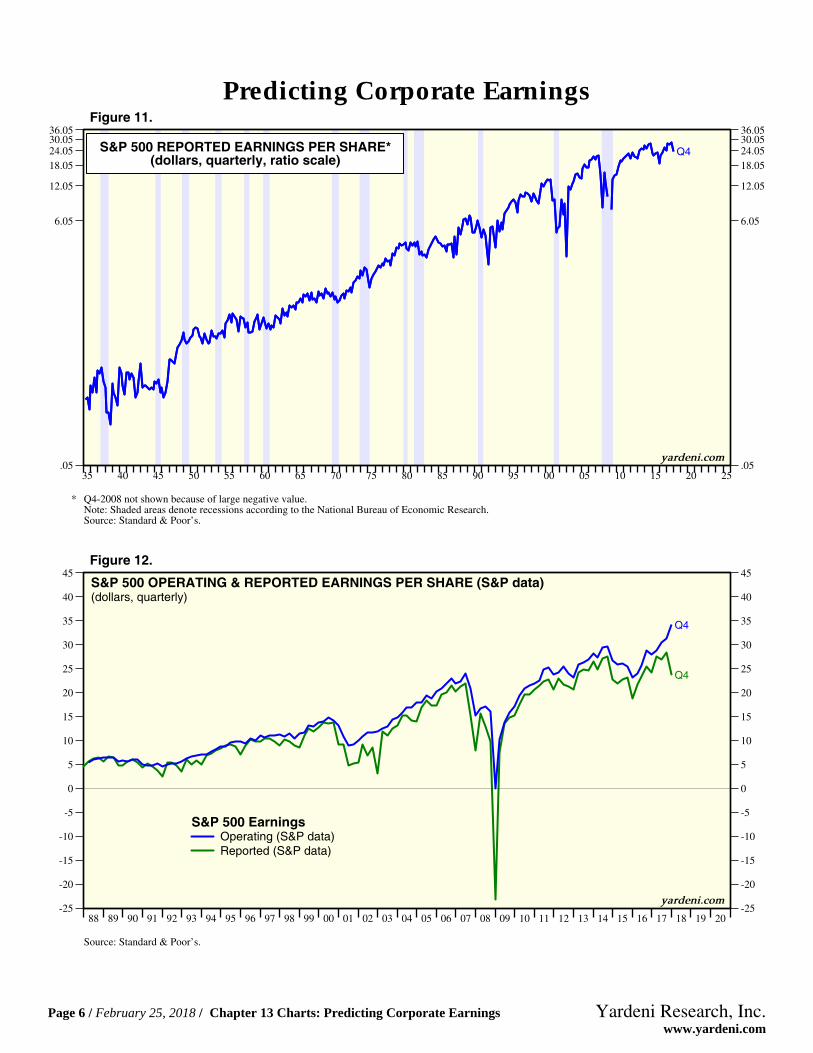
S&P 500 REPORTED EARNINGS PER SHARE*(dollars, quarterly, ratio scale)
Q4
* Q4-2008 not shown because of large negative value.Note: Shaded areas denote recessions according to the National Bureau of Economic Research.Source: Standard & Poor’s.
yardeni.com
Figure 11.
88 89 90 91 92 93 94 95 96 97 98 99 00 01 02 03 04 05 06 07 08 09 10 11 12 13 14 15 16 17 18 19 20-25
-20
-15
-10
-5
0
5
10
15
20
25
30
35
40
45
-25
-20
-15
-10
-5
0
5
10
15
20
25
30
35
40
45
Q4
Q4
S&P 500 OPERATING & REPORTED EARNINGS PER SHARE (S&P data)(dollars, quarterly)
S&P 500 EarningsOperating (S&P data)Reported (S&P data)
Source: Standard & Poor’s.
yardeni.com
Figure 12.
Predicting Corporate Earnings
Page 6 / February 25, 2018 / Chapter 13 Charts: Predicting Corporate Earnings www.yardeni.com
Yardeni Research, Inc.
93 94 95 96 97 98 99 00 01 02 03 04 05 06 07 08 09 10 11 12 13 14 15 16 17 18 19 20-5
0
5
10
15
20
25
30
35
40
-5
0
5
10
15
20
25
30
35
40
Q4Q4
yardeni.com
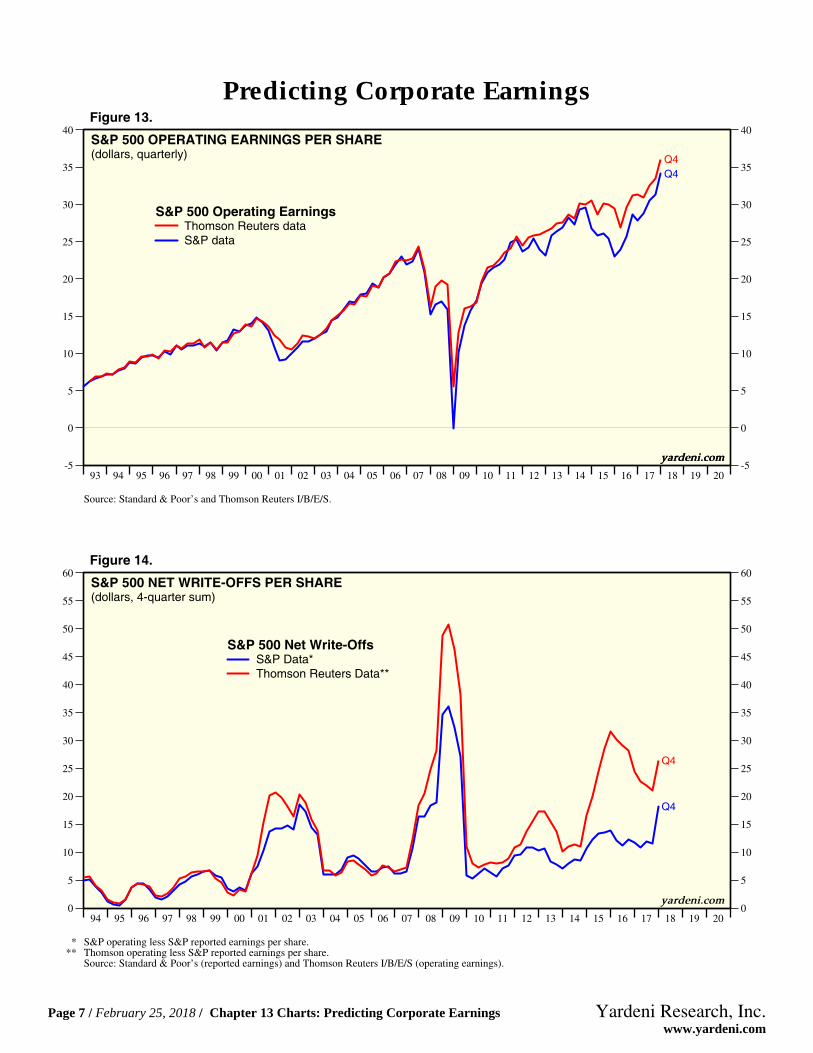
S&P 500 OPERATING EARNINGS PER SHARE(dollars, quarterly)
S&P 500 Operating EarningsThomson Reuters dataS&P data
Source: Standard & Poor’s and Thomson Reuters I/B/E/S.
yardeni.com
Figure 13.
94 95 96 97 98 99 00 01 02 03 04 05 06 07 08 09 10 11 12 13 14 15 16 17 18 19 200
5
10
15
20
25
30
35
40
45
50
55
60
0
5
10
15
20
25
30
35
40
45
50
55
60
Q4
Q4
S&P 500 NET WRITE-OFFS PER SHARE(dollars, 4-quarter sum)
S&P 500 Net Write-OffsS&P Data*Thomson Reuters Data**
* S&P operating less S&P reported earnings per share.** Thomson operating less S&P reported earnings per share.
Source: Standard & Poor’s (reported earnings) and Thomson Reuters I/B/E/S (operating earnings).
yardeni.com
Figure 14.
Predicting Corporate Earnings
Page 7 / February 25, 2018 / Chapter 13 Charts: Predicting Corporate Earnings www.yardeni.com
Yardeni Research, Inc.
-200
-150
-100
-50
0
50
100
150
200
-200
-150
-100
-50
0
50
100
150
200
Q3
70 72 74 76 78 80 82 84 86 88 90 92 94 96 98 00 02 04 06 08 10 12 14 16 18 20-250
-200
-150
-100
-50
0
50
100
150
200
250
-250
-200
-150
-100
-50
0
50
100
150
200
250
Q4
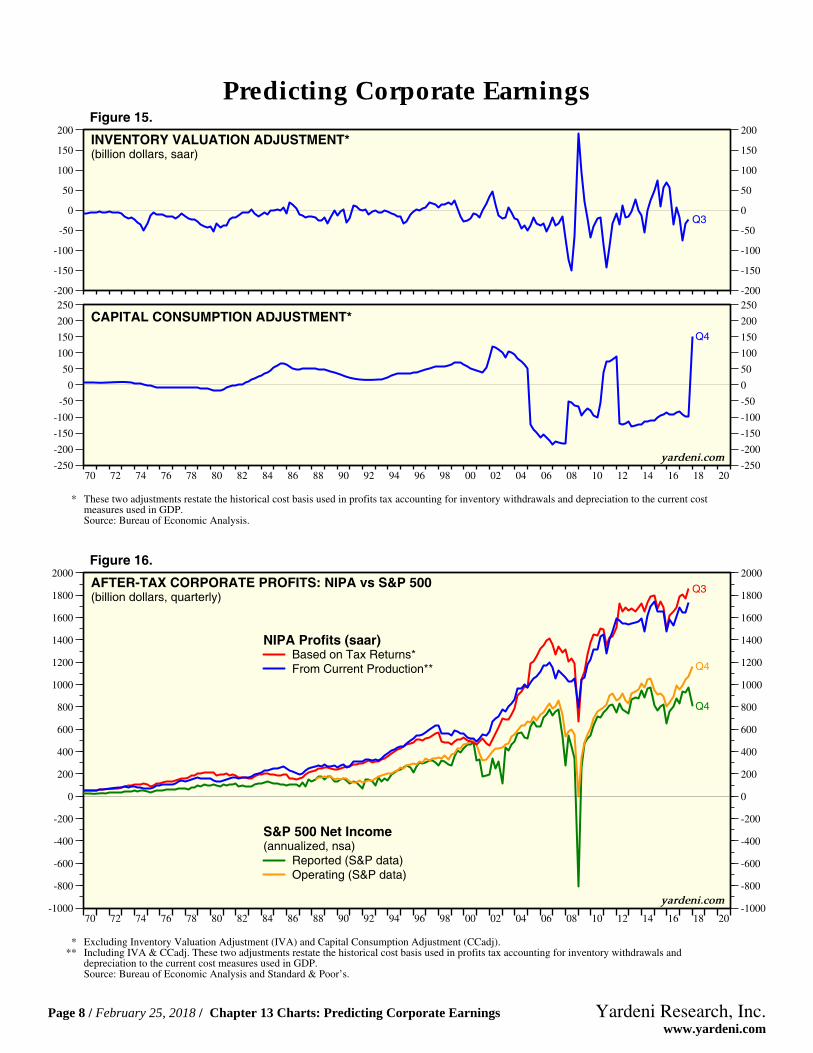
INVENTORY VALUATION ADJUSTMENT*(billion dollars, saar)
CAPITAL CONSUMPTION ADJUSTMENT*
* These two adjustments restate the historical cost basis used in profits tax accounting for inventory withdrawals and depreciation to the current costmeasures used in GDP.Source: Bureau of Economic Analysis.
yardeni.com
Figure 15.
70 72 74 76 78 80 82 84 86 88 90 92 94 96 98 00 02 04 06 08 10 12 14 16 18 20-1000
-800
-600
-400
-200
0
200
400
600
800
1000
1200
1400
1600
1800
2000
-1000
-800
-600
-400
-200
0
200
400
600
800
1000
1200
1400
1600
1800
2000
Q4
Q4
Q3AFTER-TAX CORPORATE PROFITS: NIPA vs S&P 500(billion dollars, quarterly)
NIPA Profits (saar)Based on Tax Returns*From Current Production**
S&P 500 Net Income(annualized, nsa)
Operating (S&P data)Reported (S&P data)
* Excluding Inventory Valuation Adjustment (IVA) and Capital Consumption Adjustment (CCadj).** Including IVA & CCadj. These two adjustments restate the historical cost basis used in profits tax accounting for inventory withdrawals and
depreciation to the current cost measures used in GDP.Source: Bureau of Economic Analysis and Standard & Poor’s.
yardeni.com
Figure 16.
Predicting Corporate Earnings
Page 8 / February 25, 2018 / Chapter 13 Charts: Predicting Corporate Earnings www.yardeni.com
Yardeni Research, Inc.
70 72 74 76 78 80 82 84 86 88 90 92 94 96 98 00 02 04 06 08 10 12 14 16 18 2040
440
840
1240
1640
2040
40
440
840
1240
1640
2040
Q4
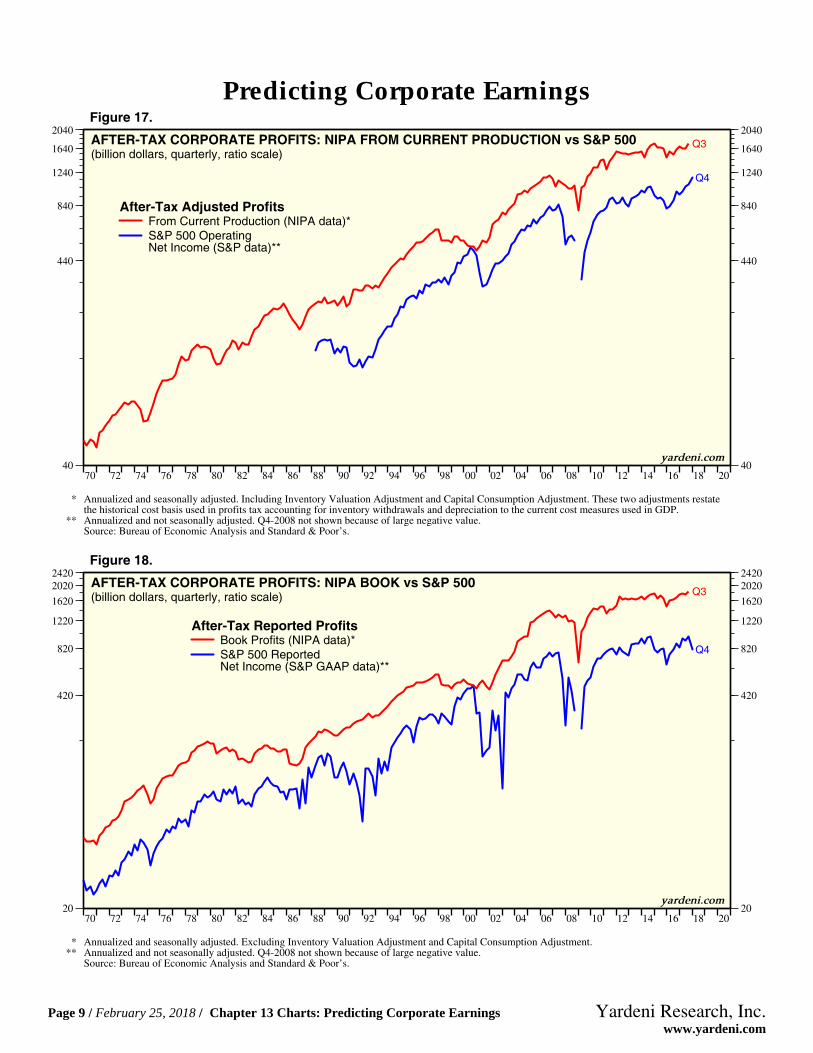
Q3AFTER-TAX CORPORATE PROFITS: NIPA FROM CURRENT PRODUCTION vs S&P 500(billion dollars, quarterly, ratio scale)
After-Tax Adjusted ProfitsFrom Current Production (NIPA data)*S&P 500 OperatingNet Income (S&P data)**
* Annualized and seasonally adjusted. Including Inventory Valuation Adjustment and Capital Consumption Adjustment. These two adjustments restatethe historical cost basis used in profits tax accounting for inventory withdrawals and depreciation to the current cost measures used in GDP.
** Annualized and not seasonally adjusted. Q4-2008 not shown because of large negative value.Source: Bureau of Economic Analysis and Standard & Poor’s.
yardeni.com
Figure 17.
70 72 74 76 78 80 82 84 86 88 90 92 94 96 98 00 02 04 06 08 10 12 14 16 18 2020
420
820
1220
1620
20202420
20
420
820
1220
1620
20202420
Q4
Q3AFTER-TAX CORPORATE PROFITS: NIPA BOOK vs S&P 500(billion dollars, quarterly, ratio scale)
After-Tax Reported ProfitsBook Profits (NIPA data)*S&P 500 ReportedNet Income (S&P GAAP data)**
* Annualized and seasonally adjusted. Excluding Inventory Valuation Adjustment and Capital Consumption Adjustment.** Annualized and not seasonally adjusted. Q4-2008 not shown because of large negative value.
Source: Bureau of Economic Analysis and Standard & Poor’s.
yardeni.com
Figure 18.
Predicting Corporate Earnings
Page 9 / February 25, 2018 / Chapter 13 Charts: Predicting Corporate Earnings www.yardeni.com
Yardeni Research, Inc.
64 66 68 70 72 74 76 78 80 82 84 86 88 90 92 94 96 98 00 02 04 06 08 10 12 14 16 18 2005101520253035404550556065707580859095100105110115
05
101520253035404550556065707580859095
100105110115
Q3
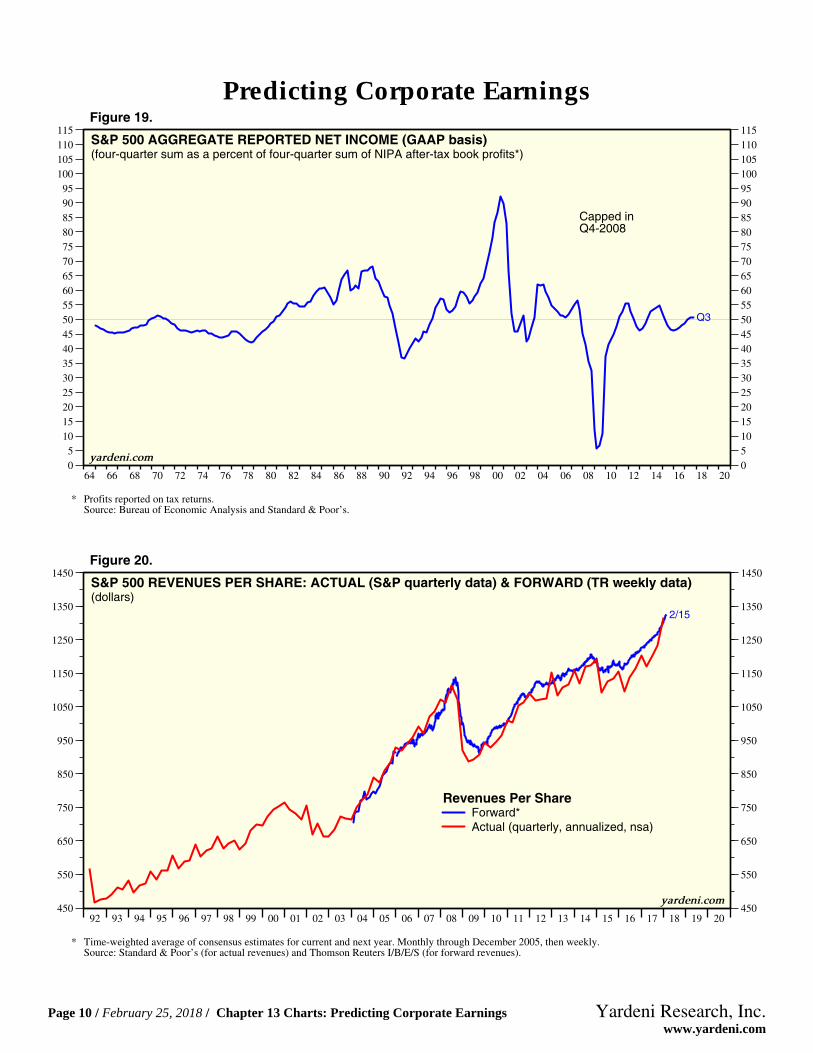
S&P 500 AGGREGATE REPORTED NET INCOME (GAAP basis)(four-quarter sum as a percent of four-quarter sum of NIPA after-tax book profits*)
Capped inQ4-2008
* Profits reported on tax returns.Source: Bureau of Economic Analysis and Standard & Poor’s.
yardeni.com
Figure 19.
92 93 94 95 96 97 98 99 00 01 02 03 04 05 06 07 08 09 10 11 12 13 14 15 16 17 18 19 20450
550
650
750
850
950
1050
1150
1250
1350
1450
450
550
650
750
850
950
1050
1150
1250
1350
1450
2/15
S&P 500 REVENUES PER SHARE: ACTUAL (S&P quarterly data) & FORWARD (TR weekly data)(dollars)
Revenues Per ShareForward*Actual (quarterly, annualized, nsa)
* Time-weighted average of consensus estimates for current and next year. Monthly through December 2005, then weekly.Source: Standard & Poor’s (for actual revenues) and Thomson Reuters I/B/E/S (for forward revenues).
yardeni.com
Figure 20.
Predicting Corporate Earnings
Page 10 / February 25, 2018 / Chapter 13 Charts: Predicting Corporate Earnings www.yardeni.com
Yardeni Research, Inc.
92 93 94 95 96 97 98 99 00 01 02 03 04 05 06 07 08 09 10 11 12 13 14 15 16 17 18 19 202.5
4.5
6.5
8.5
10.5
12.5
14.5
16.5
18.5
20.522.5
2.5
4.5
6.5
8.5
10.5
12.5
14.5
16.5
18.5
20.522.5
Dec
Q4
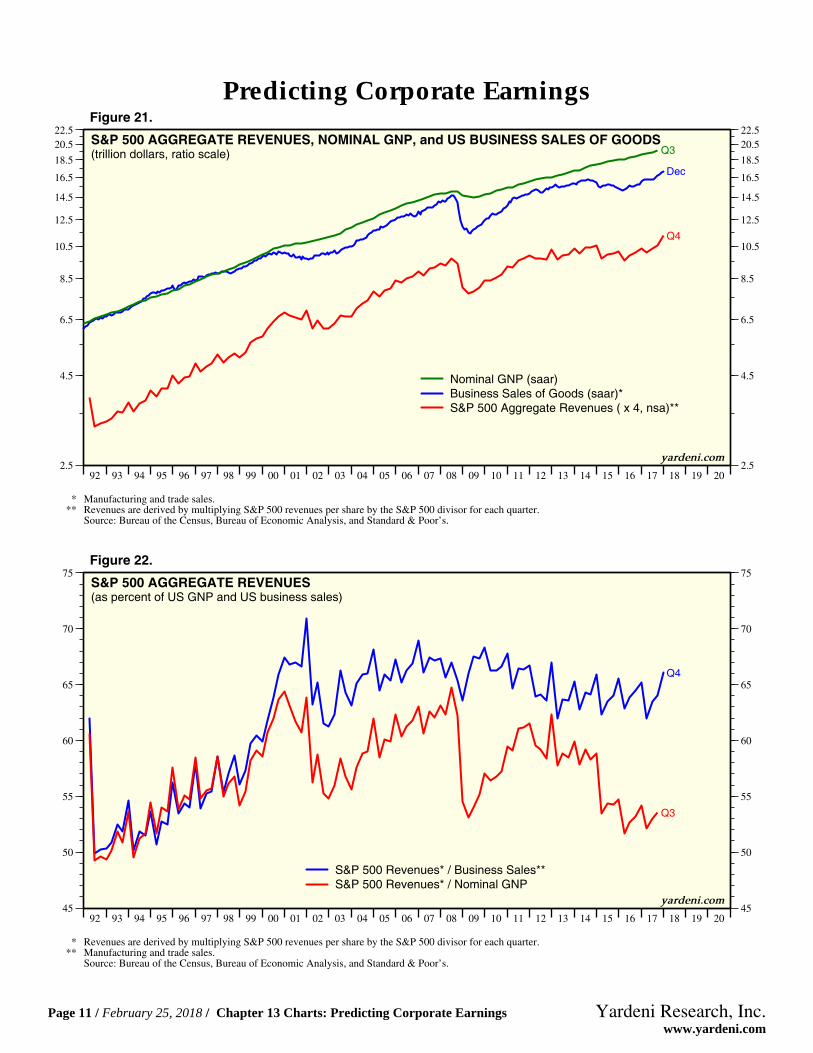
Q3S&P 500 AGGREGATE REVENUES, NOMINAL GNP, and US BUSINESS SALES OF GOODS(trillion dollars, ratio scale)
S&P 500 Aggregate Revenues ( x 4, nsa)**Business Sales of Goods (saar)*Nominal GNP (saar)
** Revenues are derived by multiplying S&P 500 revenues per share by the S&P 500 divisor for each quarter.* Manufacturing and trade sales.
Source: Bureau of the Census, Bureau of Economic Analysis, and Standard & Poor’s.
yardeni.com
Figure 21.
92 93 94 95 96 97 98 99 00 01 02 03 04 05 06 07 08 09 10 11 12 13 14 15 16 17 18 19 2045
50
55
60
65
70
75
45
50
55
60
65
70
75
Q4
Q3
S&P 500 AGGREGATE REVENUES(as percent of US GNP and US business sales)
S&P 500 Revenues* / Business Sales**S&P 500 Revenues* / Nominal GNP
* Revenues are derived by multiplying S&P 500 revenues per share by the S&P 500 divisor for each quarter.** Manufacturing and trade sales.
Source: Bureau of the Census, Bureau of Economic Analysis, and Standard & Poor’s.
yardeni.com
Figure 22.
Predicting Corporate Earnings
Page 11 / February 25, 2018 / Chapter 13 Charts: Predicting Corporate Earnings www.yardeni.com
Yardeni Research, Inc.
50 52 54 56 58 60 62 64 66 68 70 72 74 76 78 80 82 84 86 88 90 92 94 96 98 00 02 04 06 08 10 12 14 16 18 2075
3075
6075
9075
1207515075
75
3075
6075
9075
1207515075
Q3
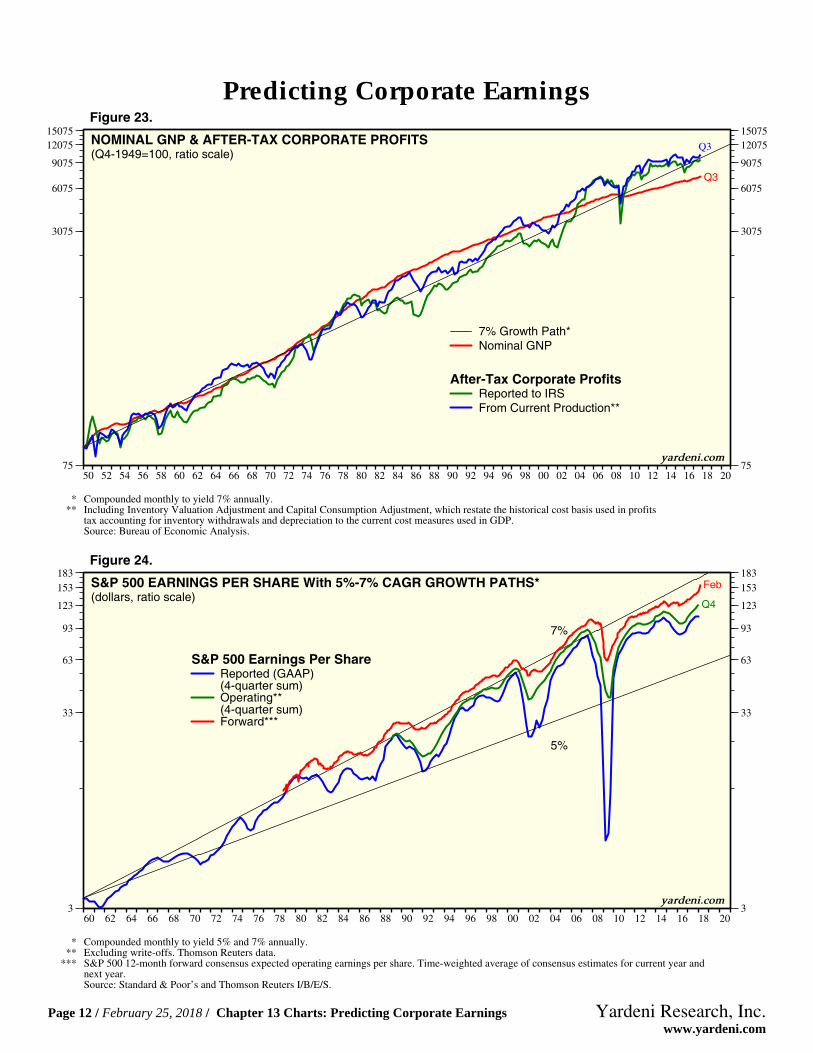
NOMINAL GNP & AFTER-TAX CORPORATE PROFITS(Q4-1949=100, ratio scale)
Nominal GNP7% Growth Path*
After-Tax Corporate ProfitsReported to IRSFrom Current Production**
Q3
* Compounded monthly to yield 7% annually.** Including Inventory Valuation Adjustment and Capital Consumption Adjustment, which restate the historical cost basis used in profits
tax accounting for inventory withdrawals and depreciation to the current cost measures used in GDP.Source: Bureau of Economic Analysis.
yardeni.com
Figure 23.
60 62 64 66 68 70 72 74 76 78 80 82 84 86 88 90 92 94 96 98 00 02 04 06 08 10 12 14 16 18 203
33
63
93
123
153183
3
33
63
93
123
153183
Feb
Q4
S&P 500 EARNINGS PER SHARE With 5%-7% CAGR GROWTH PATHS*(dollars, ratio scale)
S&P 500 Earnings Per ShareReported (GAAP)(4-quarter sum)Operating**(4-quarter sum)Forward***
7%
5%
* Compounded monthly to yield 5% and 7% annually.** Excluding write-offs. Thomson Reuters data.
*** S&P 500 12-month forward consensus expected operating earnings per share. Time-weighted average of consensus estimates for current year andnext year.Source: Standard & Poor’s and Thomson Reuters I/B/E/S.
yardeni.com
Figure 24.
Predicting Corporate Earnings
Page 12 / February 25, 2018 / Chapter 13 Charts: Predicting Corporate Earnings www.yardeni.com
Yardeni Research, Inc.
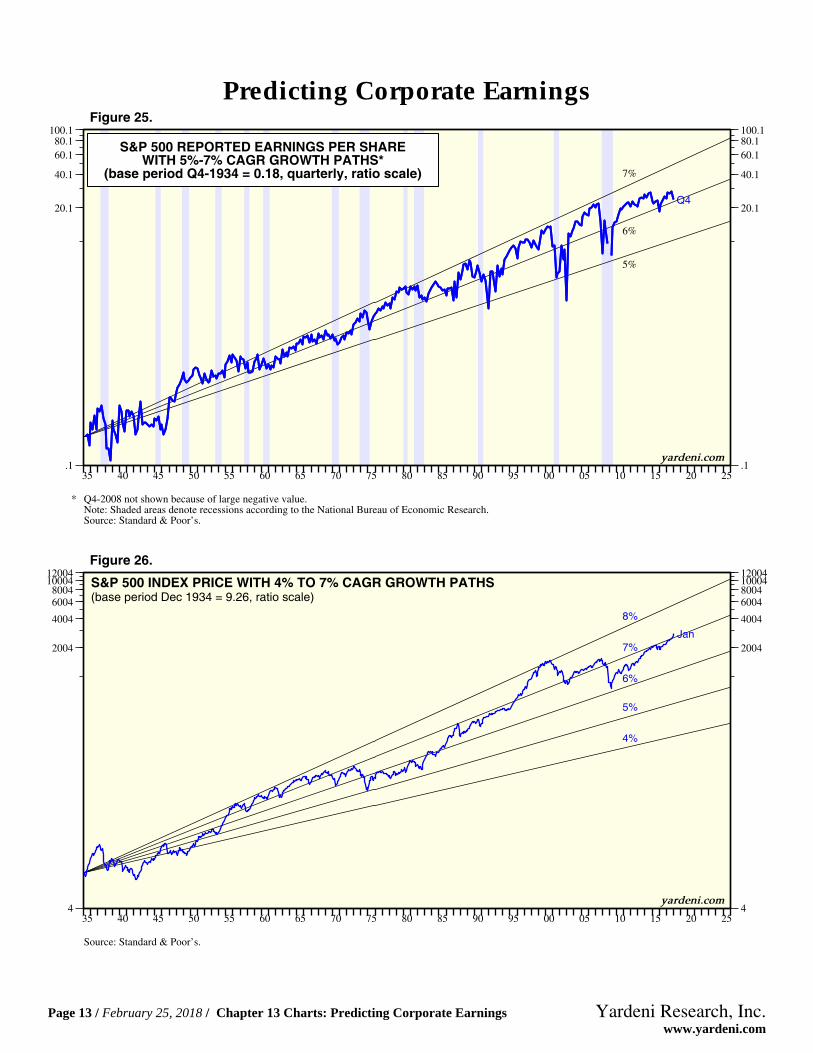
35 40 45 50 55 60 65 70 75 80 85 90 95 00 05 10 15 20 25.1
20.1
40.1
60.180.1100.1
.1
20.1
40.1
60.180.1
100.1
S&P 500 REPORTED EARNINGS PER SHAREWITH 5%-7% CAGR GROWTH PATHS*
(base period Q4-1934 = 0.18, quarterly, ratio scale)
Q4
5%
6%
7%
* Q4-2008 not shown because of large negative value.Note: Shaded areas denote recessions according to the National Bureau of Economic Research.Source: Standard & Poor’s.
yardeni.com
Figure 25.
35 40 45 50 55 60 65 70 75 80 85 90 95 00 05 10 15 20 254
2004
4004
600480041000412004
4
2004
4004
60048004
1000412004
Jan
S&P 500 INDEX PRICE WITH 4% TO 7% CAGR GROWTH PATHS(base period Dec 1934 = 9.26, ratio scale)
4%
5%
6%
7%
8%
yardeni.com
Source: Standard & Poor’s.
Figure 26.
Predicting Corporate Earnings
Page 13 / February 25, 2018 / Chapter 13 Charts: Predicting Corporate Earnings www.yardeni.com
Yardeni Research, Inc.
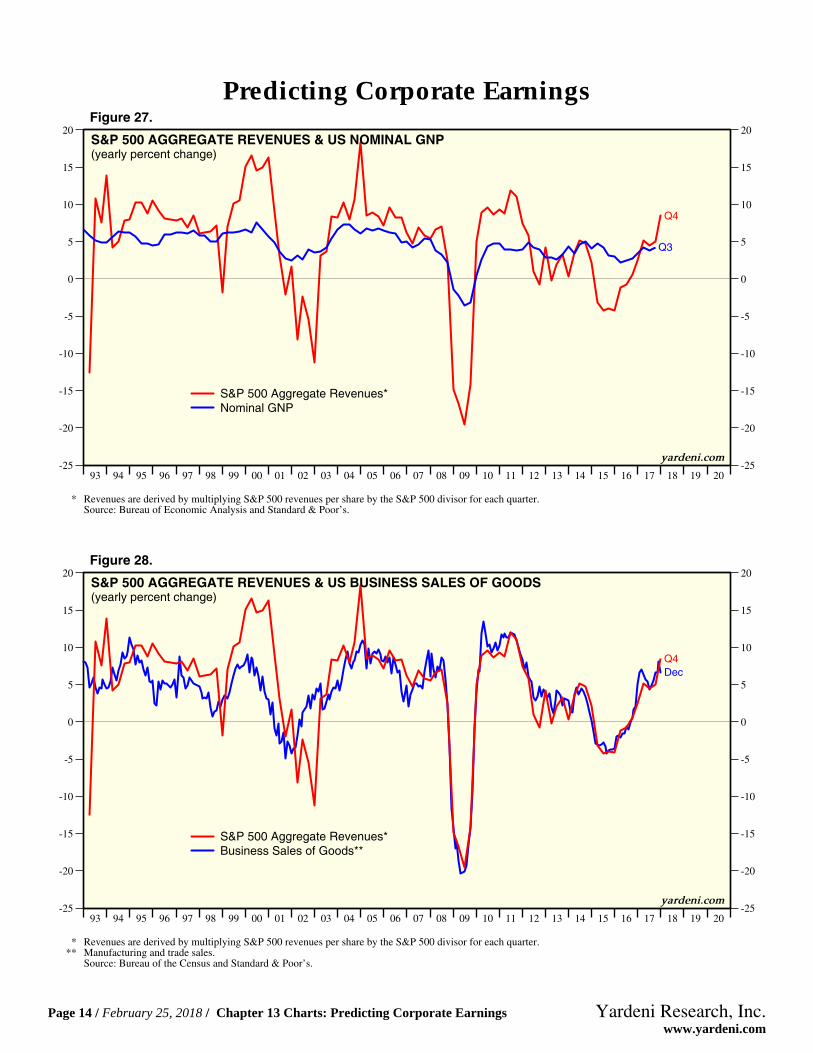
93 94 95 96 97 98 99 00 01 02 03 04 05 06 07 08 09 10 11 12 13 14 15 16 17 18 19 20-25
-20
-15
-10
-5
0
5
10
15
20
-25
-20
-15
-10
-5
0
5
10
15
20
Q4
Q3
S&P 500 AGGREGATE REVENUES & US NOMINAL GNP(yearly percent change)
S&P 500 Aggregate Revenues*Nominal GNP
* Revenues are derived by multiplying S&P 500 revenues per share by the S&P 500 divisor for each quarter.Source: Bureau of Economic Analysis and Standard & Poor’s.
yardeni.com
Figure 27.
93 94 95 96 97 98 99 00 01 02 03 04 05 06 07 08 09 10 11 12 13 14 15 16 17 18 19 20-25
-20
-15
-10
-5
0
5
10
15
20
-25
-20
-15
-10
-5
0
5
10
15
20
DecQ4
S&P 500 AGGREGATE REVENUES & US BUSINESS SALES OF GOODS(yearly percent change)
S&P 500 Aggregate Revenues*Business Sales of Goods**
** Manufacturing and trade sales.* Revenues are derived by multiplying S&P 500 revenues per share by the S&P 500 divisor for each quarter.
Source: Bureau of the Census and Standard & Poor’s.
yardeni.com
Figure 28.
Predicting Corporate Earnings
Page 14 / February 25, 2018 / Chapter 13 Charts: Predicting Corporate Earnings www.yardeni.com
Yardeni Research, Inc.
92 93 94 95 96 97 98 99 00 01 02 03 04 05 06 07 08 09 10 11 12 13 14 15 16 17 18 19 20-12
-10
-8
-6
-4
-2
0
2
4
6
8
10
12
-12
-10
-8
-6
-4
-2
0
2
4
6
8
10
12
Q4
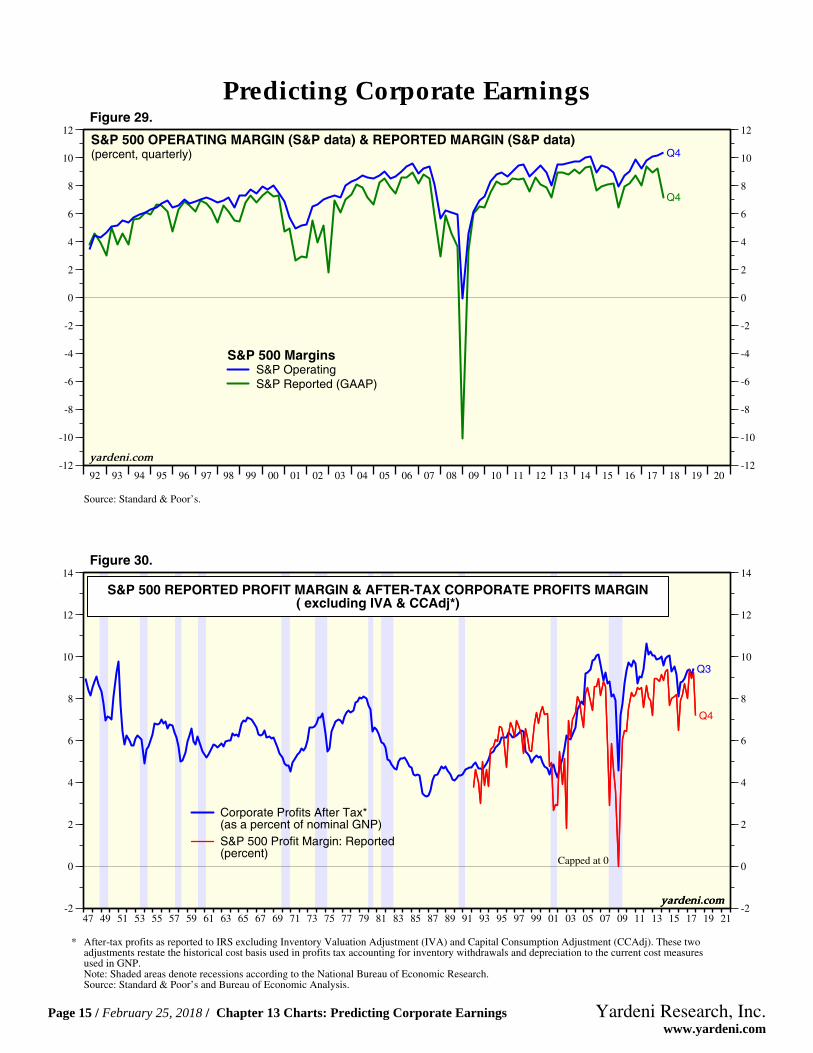
Q4S&P 500 OPERATING MARGIN (S&P data) & REPORTED MARGIN (S&P data)(percent, quarterly)
S&P 500 MarginsS&P OperatingS&P Reported (GAAP)
Source: Standard & Poor’s.
yardeni.com
Figure 29.
47 49 51 53 55 57 59 61 63 65 67 69 71 73 75 77 79 81 83 85 87 89 91 93 95 97 99 01 03 05 07 09 11 13 15 17 19 21-2
0
2
4
6
8
10
12
14
-2
0
2
4
6
8
10
12
14
S&P 500 REPORTED PROFIT MARGIN & AFTER-TAX CORPORATE PROFITS MARGIN( excluding IVA & CCAdj*)
Q3
Q4
yardeni.com
S&P 500 Profit Margin: Reported(percent)
Corporate Profits After Tax*(as a percent of nominal GNP)
Capped at 0
Note: Shaded areas denote recessions according to the National Bureau of Economic Research.
* After-tax profits as reported to IRS excluding Inventory Valuation Adjustment (IVA) and Capital Consumption Adjustment (CCAdj). These twoadjustments restate the historical cost basis used in profits tax accounting for inventory withdrawals and depreciation to the current cost measuresused in GNP.
Source: Standard & Poor’s and Bureau of Economic Analysis.
yardeni.com
Figure 30.
Predicting Corporate Earnings
Page 15 / February 25, 2018 / Chapter 13 Charts: Predicting Corporate Earnings www.yardeni.com
Yardeni Research, Inc.
47 49 51 53 55 57 59 61 63 65 67 69 71 73 75 77 79 81 83 85 87 89 91 93 95 97 99 01 03 05 07 09 11 13 15 17 19 212
4
6
8
10
12
2
4
6
8
10
12
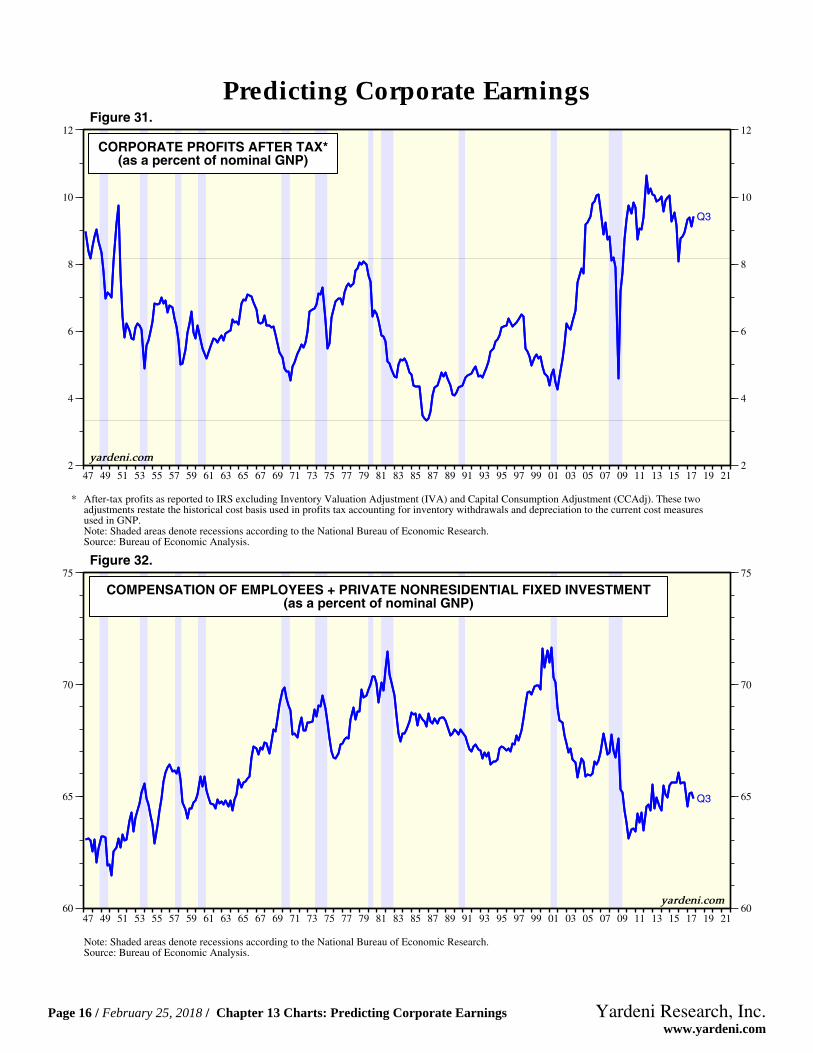
CORPORATE PROFITS AFTER TAX*(as a percent of nominal GNP)
Q3
* After-tax profits as reported to IRS excluding Inventory Valuation Adjustment (IVA) and Capital Consumption Adjustment (CCAdj). These twoadjustments restate the historical cost basis used in profits tax accounting for inventory withdrawals and depreciation to the current cost measuresused in GNP.
Source: Bureau of Economic Analysis.Note: Shaded areas denote recessions according to the National Bureau of Economic Research.
yardeni.com
Figure 31.
47 49 51 53 55 57 59 61 63 65 67 69 71 73 75 77 79 81 83 85 87 89 91 93 95 97 99 01 03 05 07 09 11 13 15 17 19 2160
65
70
75
60
65
70
75
COMPENSATION OF EMPLOYEES + PRIVATE NONRESIDENTIAL FIXED INVESTMENT(as a percent of nominal GNP)
Q3
Source: Bureau of Economic Analysis.Note: Shaded areas denote recessions according to the National Bureau of Economic Research.
yardeni.com
Figure 32.
Predicting Corporate Earnings
Page 16 / February 25, 2018 / Chapter 13 Charts: Predicting Corporate Earnings www.yardeni.com
Yardeni Research, Inc.
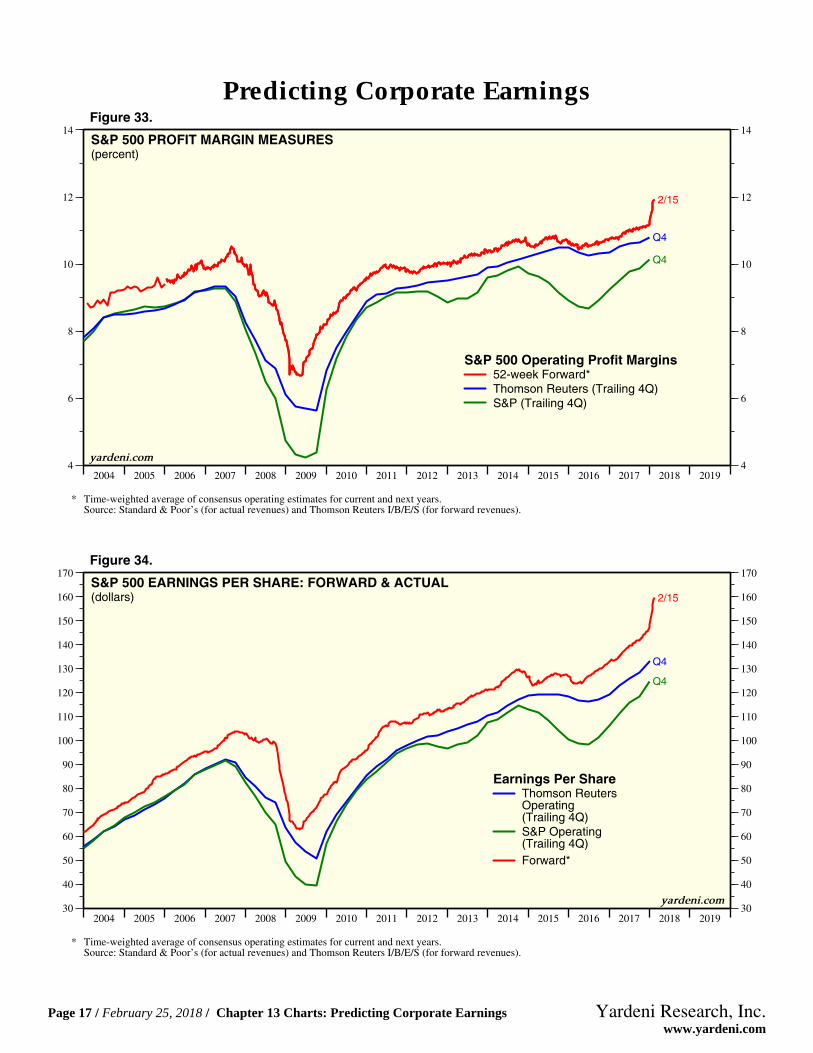
2004 2005 2006 2007 2008 2009 2010 2011 2012 2013 2014 2015 2016 2017 2018 20194
6
8
10
12
14
4
6
8
10
12
14
2/15
Q4
Q4
S&P 500 PROFIT MARGIN MEASURES(percent)
S&P 500 Operating Profit Margins52-week Forward*Thomson Reuters (Trailing 4Q)S&P (Trailing 4Q)
* Time-weighted average of consensus operating estimates for current and next years.Source: Standard & Poor’s (for actual revenues) and Thomson Reuters I/B/E/S (for forward revenues).
yardeni.com
Figure 33.
2004 2005 2006 2007 2008 2009 2010 2011 2012 2013 2014 2015 2016 2017 2018 201930
40
50
60
70
80
90
100
110
120
130
140
150
160
170
30
40
50
60
70
80
90
100
110
120
130
140
150
160
170
Q4
2/15
Q4
S&P 500 EARNINGS PER SHARE: FORWARD & ACTUAL(dollars)
Earnings Per ShareThomson ReutersOperating(Trailing 4Q)S&P Operating(Trailing 4Q)Forward*
* Time-weighted average of consensus operating estimates for current and next years.Source: Standard & Poor’s (for actual revenues) and Thomson Reuters I/B/E/S (for forward revenues).
yardeni.com
Figure 34.
Predicting Corporate Earnings
Page 17 / February 25, 2018 / Chapter 13 Charts: Predicting Corporate Earnings www.yardeni.com
Yardeni Research, Inc.
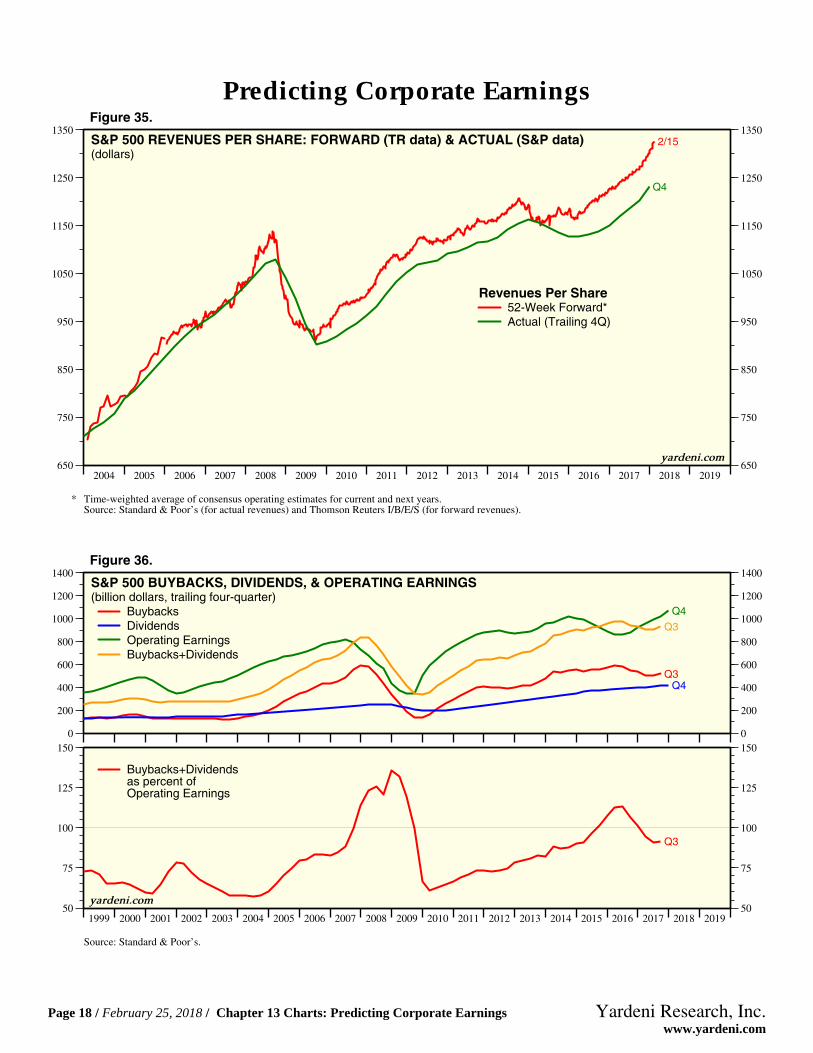
2004 2005 2006 2007 2008 2009 2010 2011 2012 2013 2014 2015 2016 2017 2018 2019650
750
850
950
1050
1150
1250
1350
650
750
850
950
1050
1150
1250
13502/15
Q4
S&P 500 REVENUES PER SHARE: FORWARD (TR data) & ACTUAL (S&P data)(dollars)
Revenues Per Share52-Week Forward*Actual (Trailing 4Q)
* Time-weighted average of consensus operating estimates for current and next years.Source: Standard & Poor’s (for actual revenues) and Thomson Reuters I/B/E/S (for forward revenues).
yardeni.com
Figure 35.
0
200
400
600
800
1000
1200
1400
0
200
400
600
800
1000
1200
1400
Q3Q4
Q4
Q3
1999 2000 2001 2002 2003 2004 2005 2006 2007 2008 2009 2010 2011 2012 2013 2014 2015 2016 2017 2018 201950
75
100
125
150
50
75
100
125
150
Q3
S&P 500 BUYBACKS, DIVIDENDS, & OPERATING EARNINGS(billion dollars, trailing four-quarter)
BuybacksDividendsOperating EarningsBuybacks+Dividends
Buybacks+Dividendsas percent ofOperating Earnings
Source: Standard & Poor’s.
yardeni.com
Figure 36.
Predicting Corporate Earnings
Page 18 / February 25, 2018 / Chapter 13 Charts: Predicting Corporate Earnings www.yardeni.com
Yardeni Research, Inc.
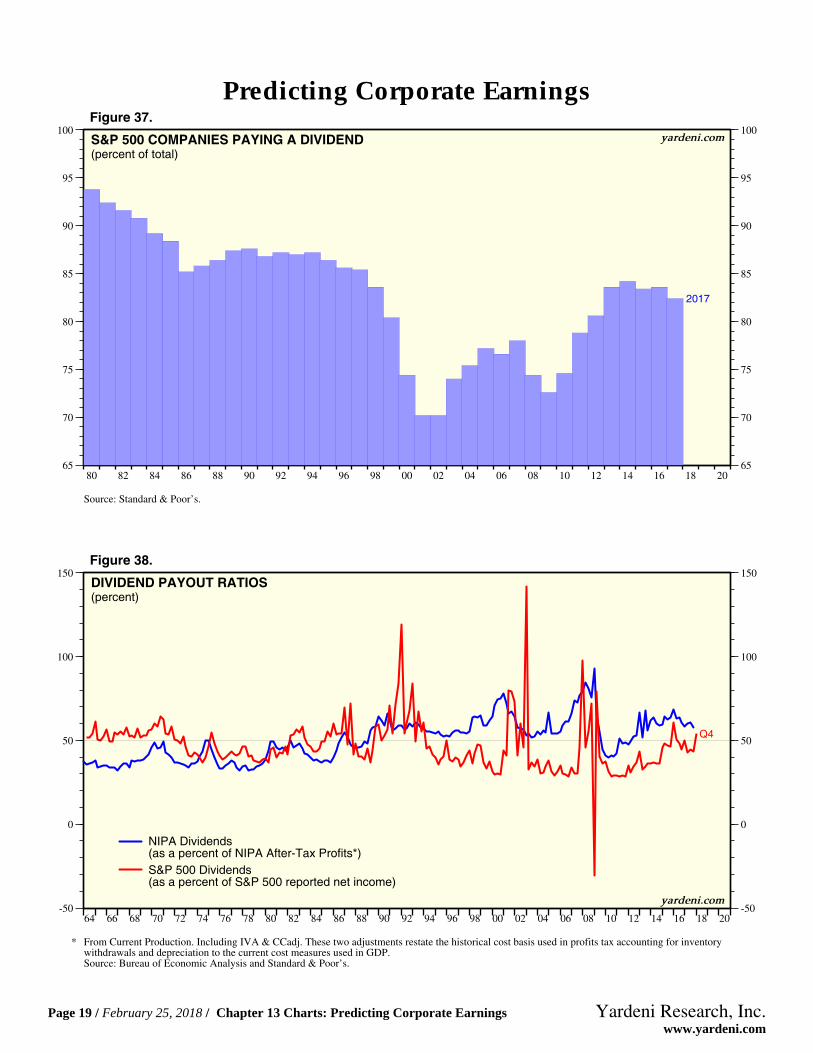
80 82 84 86 88 90 92 94 96 98 00 02 04 06 08 10 12 14 16 18 2065
70
75
80
85
90
95
100
65
70
75
80
85
90
95
100
2017
S&P 500 COMPANIES PAYING A DIVIDEND(percent of total)
Source: Standard & Poor’s.
yardeni.com
Figure 37.
64 66 68 70 72 74 76 78 80 82 84 86 88 90 92 94 96 98 00 02 04 06 08 10 12 14 16 18 20-50
0
50
100
150
-50
0
50
100
150
Q4
DIVIDEND PAYOUT RATIOS(percent)
S&P 500 Dividends(as a percent of S&P 500 reported net income)
NIPA Dividends(as a percent of NIPA After-Tax Profits*)
* From Current Production. Including IVA & CCadj. These two adjustments restate the historical cost basis used in profits tax accounting for inventorywithdrawals and depreciation to the current cost measures used in GDP.Source: Bureau of Economic Analysis and Standard & Poor’s.
yardeni.com
Figure 38.
Predicting Corporate Earnings
Page 19 / February 25, 2018 / Chapter 13 Charts: Predicting Corporate Earnings www.yardeni.com
Yardeni Research, Inc.

46 48 50 52 54 56 58 60 62 64 66 68 70 72 74 76 78 80 82 84 86 88 90 92 94 96 98 00 02 04 06 08 10 12 14 16 18 20 22.2
20.2
40.2
60.2
80.2
.2
20.2
40.2
60.2
80.2
Q4S&P 500 DIVIDENDS & RETAINED EARNINGS PER SHARE(dollars, trailing 4-quarter sum, ratio scale)
DividendsRetained Earnings*
* Reported earnings minus dividends per share.Source: Standard & Poor’s.
yardeni.com
Figure 39.
45 50 55 60 65 70 75 80 85 90 95 00 05 10 15 20 25.7
50.7
100.7
150.7
200.7250.7300.7
.7
50.7
100.7
150.7
200.7250.7300.7
Q4
S&P 500 TRAILING 4-QUARTER DIVIDENDS WITH 5% TO 8% CAGR GROWTH PATHS(base period Dec 1946 = 0.71, ratio scale)
5%
6%
7%
8%
yardeni.com
Source: Standard & Poor’s.
Figure 40.
Predicting Corporate Earnings
Page 20 / February 25, 2018 / Chapter 13 Charts: Predicting Corporate Earnings www.yardeni.com
Yardeni Research, Inc.

60 62 64 66 68 70 72 74 76 78 80 82 84 86 88 90 92 94 96 98 00 02 04 06 08 10 12 14 16 18 2020
420
820
1220
1620
202024202820
20
420
820
1220
1620
202024202820
Q3CORPORATE CASH FLOW(ratio scale, billion dollars, saar)
Corporate Cash Flow*
Tax-Reported Depreciation***Economic Depreciation**
* After-tax retained earnings plus tax-reported depreciation.** Corporate capital consumption allowances.
*** Corporate capital consumption allowances with capital consumption adjustment.Source: Bureau of Economic Analysis.
yardeni.com
Figure 41.
70 72 74 76 78 80 82 84 86 88 90 92 94 96 98 00 02 04 06 08 10 12 14 16 18 20-250
-200
-150
-100
-50
0
50
100
150
200
250
-250
-200
-150
-100
-50
0
50
100
150
200
250
Q4
CAPITAL CONSUMPTION ADJUSTMENT*(billion dollars, saar)
Tax-Reported > Economic Depreciation
Tax-Reported < Economic Depreciation
* This adjustment is used to restate the historical cost basis used in profits tax accounting for depreciation to the current cost measures used in GDP.Source: Bureau of Economic Analysis.
yardeni.com
Figure 42.
Predicting Corporate Earnings
Page 21 / February 25, 2018 / Chapter 13 Charts: Predicting Corporate Earnings www.yardeni.com
Yardeni Research, Inc.
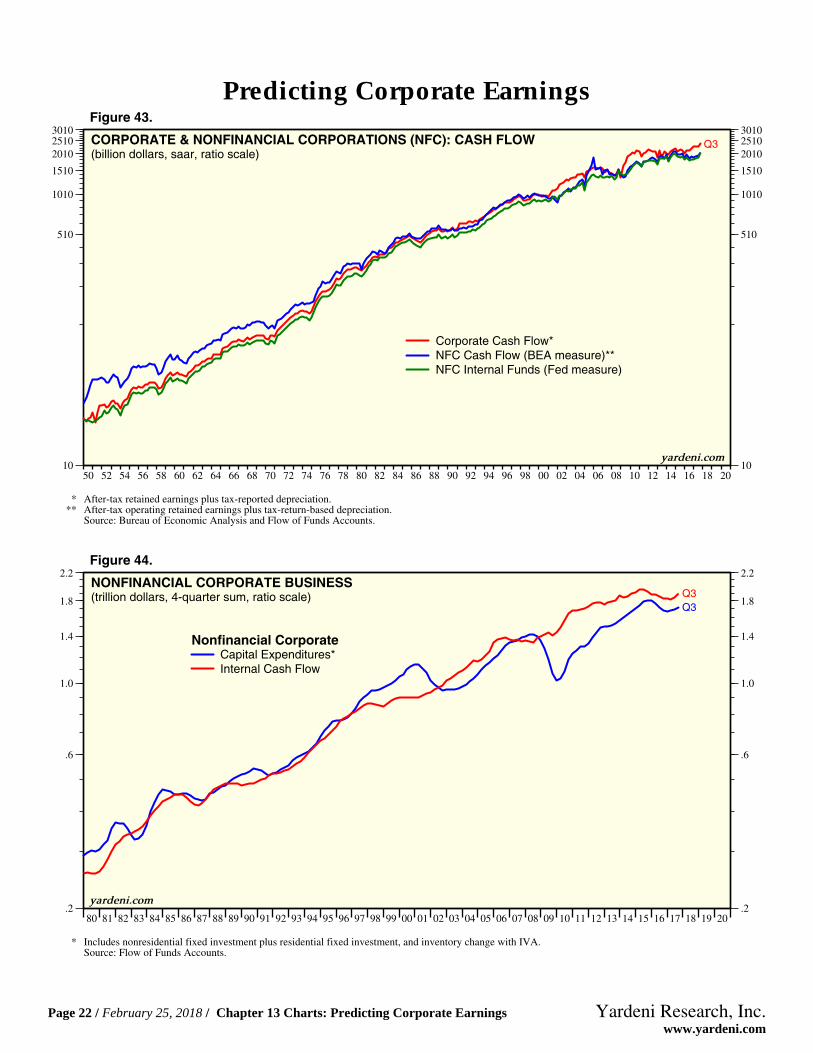
50 52 54 56 58 60 62 64 66 68 70 72 74 76 78 80 82 84 86 88 90 92 94 96 98 00 02 04 06 08 10 12 14 16 18 2010
510
1010
1510
201025103010
10
510
1010
1510
201025103010
Q3CORPORATE & NONFINANCIAL CORPORATIONS (NFC): CASH FLOW(billion dollars, saar, ratio scale)
Corporate Cash Flow*NFC Cash Flow (BEA measure)**NFC Internal Funds (Fed measure)
* After-tax retained earnings plus tax-reported depreciation.** After-tax operating retained earnings plus tax-return-based depreciation.
Source: Bureau of Economic Analysis and Flow of Funds Accounts.
yardeni.com
Figure 43.
80 81 82 83 84 85 86 87 88 89 90 91 92 93 94 95 96 97 98 99 00 01 02 03 04 05 06 07 08 09 10 11 12 13 14 15 16 17 18 19 20.2
.6
1.0
1.4
1.8
2.2
.2
.6
1.0
1.4
1.8
2.2
Q3Q3
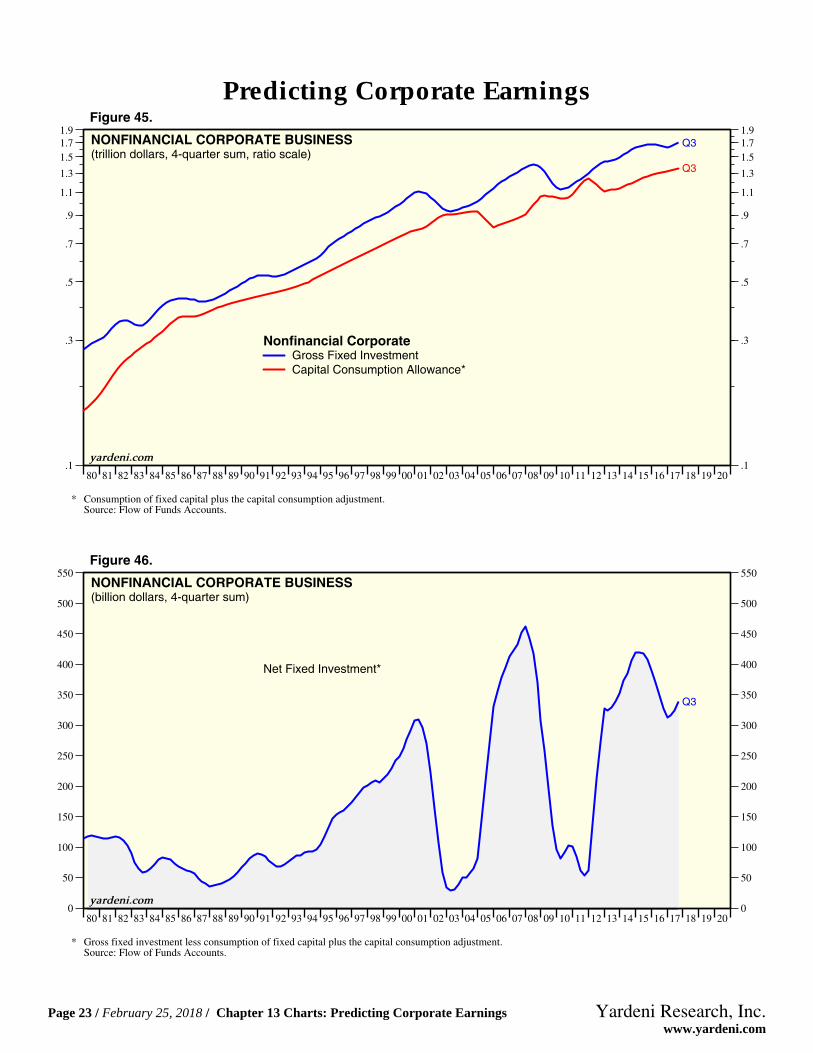
NONFINANCIAL CORPORATE BUSINESS(trillion dollars, 4-quarter sum, ratio scale)
Nonfinancial CorporateCapital Expenditures*Internal Cash Flow
* Includes nonresidential fixed investment plus residential fixed investment, and inventory change with IVA.Source: Flow of Funds Accounts.
yardeni.com
Figure 44.
Predicting Corporate Earnings
Page 22 / February 25, 2018 / Chapter 13 Charts: Predicting Corporate Earnings www.yardeni.com
Yardeni Research, Inc.
80 81 82 83 84 85 86 87 88 89 90 91 92 93 94 95 96 97 98 99 00 01 02 03 04 05 06 07 08 09 10 11 12 13 14 15 16 17 18 19 20.1
.3
.5
.7
.9
1.1
1.3
1.51.71.9
.1
.3
.5
.7
.9
1.1
1.3
1.51.71.9
Q3
Q3NONFINANCIAL CORPORATE BUSINESS(trillion dollars, 4-quarter sum, ratio scale)
Nonfinancial CorporateGross Fixed InvestmentCapital Consumption Allowance*
* Consumption of fixed capital plus the capital consumption adjustment.Source: Flow of Funds Accounts.
yardeni.com
Figure 45.
80 81 82 83 84 85 86 87 88 89 90 91 92 93 94 95 96 97 98 99 00 01 02 03 04 05 06 07 08 09 10 11 12 13 14 15 16 17 18 19 200
50
100
150
200
250
300
350
400
450
500
550
0
50
100
150
200
250
300
350
400
450
500
550
Q3
NONFINANCIAL CORPORATE BUSINESS(billion dollars, 4-quarter sum)
Net Fixed Investment*
* Gross fixed investment less consumption of fixed capital plus the capital consumption adjustment.Source: Flow of Funds Accounts.
yardeni.com
Figure 46.
Predicting Corporate Earnings
Page 23 / February 25, 2018 / Chapter 13 Charts: Predicting Corporate Earnings www.yardeni.com
Yardeni Research, Inc.
94 95 96 97 98 99 00 01 02 03 04 05 06 07 08 09 10 11 12 13 14 15 16 17 18 19 20-900
-800
-700
-600
-500
-400
-300
-200
-100
0
100
200
300
400
500
-900
-800
-700
-600
-500
-400
-300
-200
-100
0
100
200
300
400
500
Q3
Q3
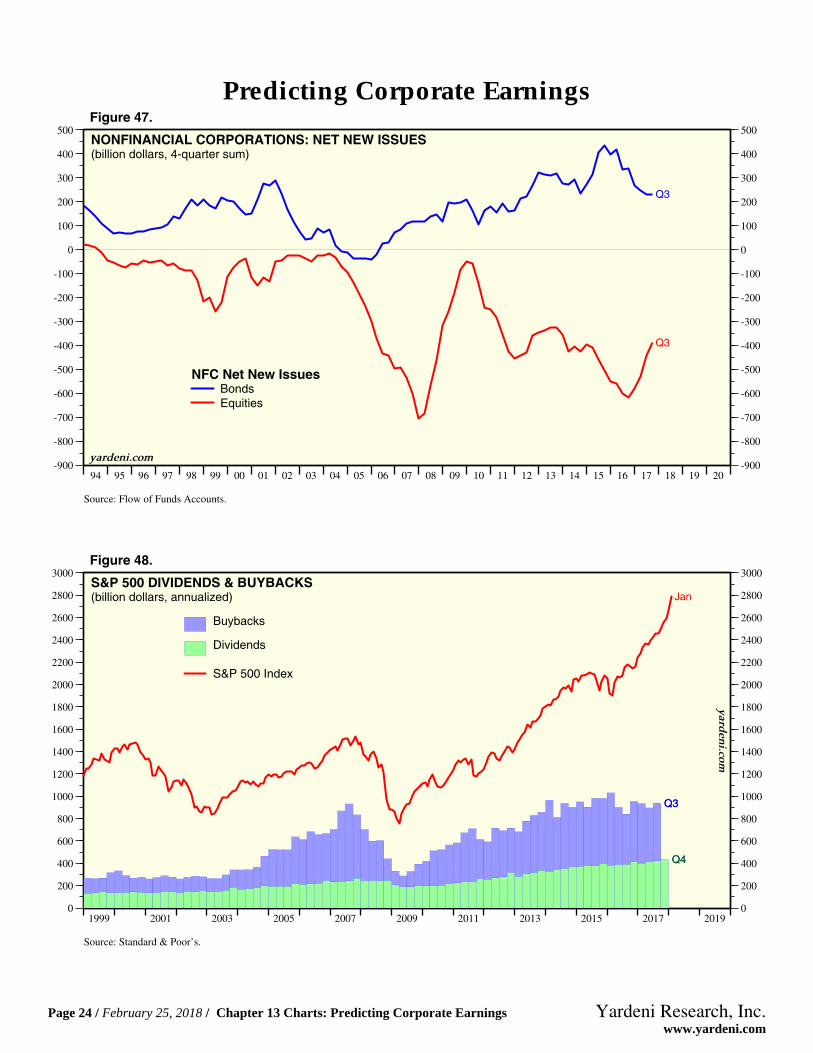
NONFINANCIAL CORPORATIONS: NET NEW ISSUES(billion dollars, 4-quarter sum)
NFC Net New Issues
EquitiesBonds
Source: Flow of Funds Accounts.
yardeni.com
Figure 47.
1999 2001 2003 2005 2007 2009 2011 2013 2015 2017 20190
200
400
600
800
1000
1200
1400
1600
1800
2000
2200
2400
2600
2800
3000
0
200
400
600
800
1000
1200
1400
1600
1800
2000
2200
2400
2600
2800
3000
Q4
Q3
Jan
Q4
Q3
S&P 500 DIVIDENDS & BUYBACKS(billion dollars, annualized)
Buybacks
Dividends
S&P 500 Index
Source: Standard & Poor’s.
yarden
i.com
Figure 48.
Predicting Corporate Earnings
Page 24 / February 25, 2018 / Chapter 13 Charts: Predicting Corporate Earnings www.yardeni.com
Yardeni Research, Inc.
http://blog.yardeni.com
http://blog.yardeni.com
Copyright (c) Yardeni Research, Inc. 2018. All rights reserved. The informationcontained herein has been obtained from sources believed to be reliable, but is notnecessarily complete and its accuracy cannot be guaranteed. No representation orwarranty, express or implied, is made as to the fairness, accuracy, completeness, orcorrectness of the information and opinions contained herein. The views and the otherinformation provided are subject to change without notice. All reports posted onwww.yardeni.com, blog.yardeni.com, and YRI’s Apps for iPads and iPhones are issuedwithout regard to the specific investment objectives, financial situation, or particular needsof any specific recipient and are not to be construed as a solicitation or an offer to buy or sellany securities or related financial instruments. Past performance is not necessarily a guideto future results. Company fundamentals and earnings may be mentioned occasionally, butshould not be construed as a recommendation to buy, sell, or hold the company’s stock.Predictions, forecasts, and estimates for any and all markets should not be construed asrecommendations to buy, sell, or hold any security--including mutual funds, futurescontracts, and exchange traded funds, or any similar instruments.
The text, images, and other materials contained or displayed on any Yardeni Research, Inc.product, service, report, email or website are proprietary to Yardeni Research, Inc. andconstitute valuable intellectual property. No material from any part of www.yardeni.com, blog.yardeni.com, and YRI’s Apps for iPads and iPhones may be downloaded, transmitted,broadcast, transferred, assigned, reproduced or in any other way used or otherwisedisseminated in any form to any person or entity, without the explicit written consent ofYardeni Research, Inc. All unauthorized reproduction or other use of material from YardeniResearch, Inc. shall be deemed willful infringement(s) of this copyright and other proprietaryand intellectual property rights, including but not limited to, rights of privacy. YardeniResearch, Inc. expressly reserves all rights in connection with its intellectual property,including without limitation the right to block the transfer of its products and services and/orto track usage thereof, through electronic tracking technology, and all other lawful means,now known or hereafter devised. Yardeni Research, Inc. reserves the right, without furthernotice, to pursue to the fullest extent allowed by the law any and all criminal and civilremedies for the violation of its rights.
The recipient should check any email and any attachments for the presence of viruses.Yardeni Research, Inc. accepts no liability for any damage caused by any virus transmittedby this company’s emails, website, blog and Apps. Additional information available onrequest.