changes in wheelchair cushions over time
DESCRIPTION
Changes in Wheelchair Cushions Over Time. Stephen Sprigle, PhD PT. Study Principals (alphabetically). Wheelchair seat cushion degradation study. Laura Cohen PhD, PT Kim Davis, PT Cami Godsey Michelle Nemeth, PT David Rivard. Wheelchair seat cushion degradation study. - PowerPoint PPT PresentationTRANSCRIPT
Changes in Wheelchair Cushions Over Time
Stephen Sprigle, PhD PT

Study Principals (alphabetically)
• Laura Cohen PhD, PT• Kim Davis, PT• Cami Godsey• Michelle Nemeth, PT• David Rivard
Wheelchair seat cushion degradation study
Wheelchair seat cushion degradation study
• To document the state of wheelchair cushions after everyday use
• To determine changes in state and performance over time
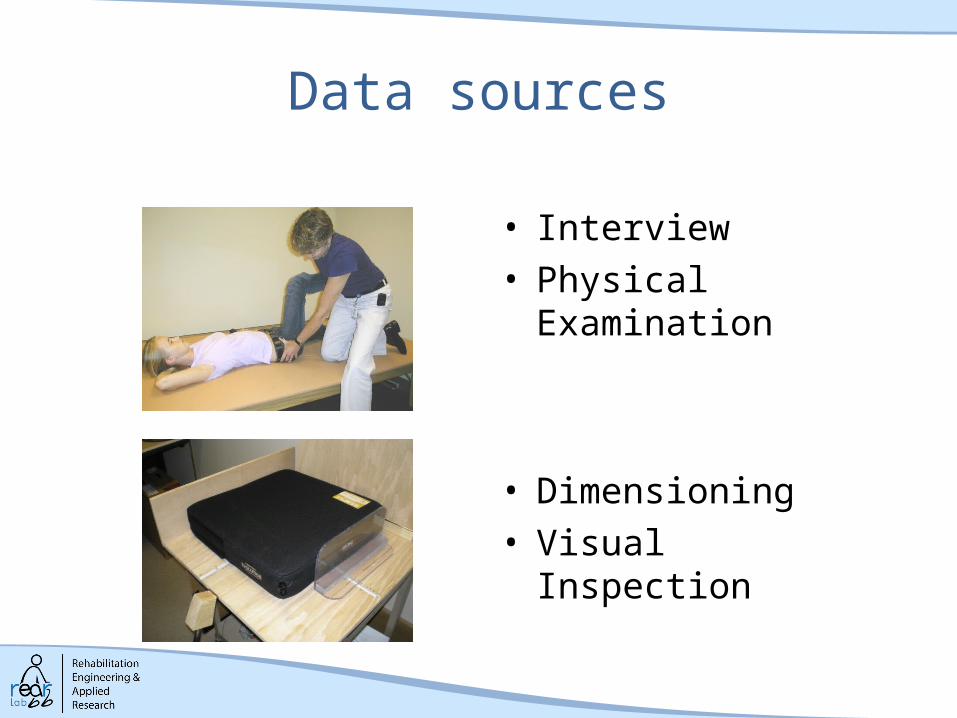
Data sources
• Interview• Physical Examination
• Dimensioning• Visual Inspection
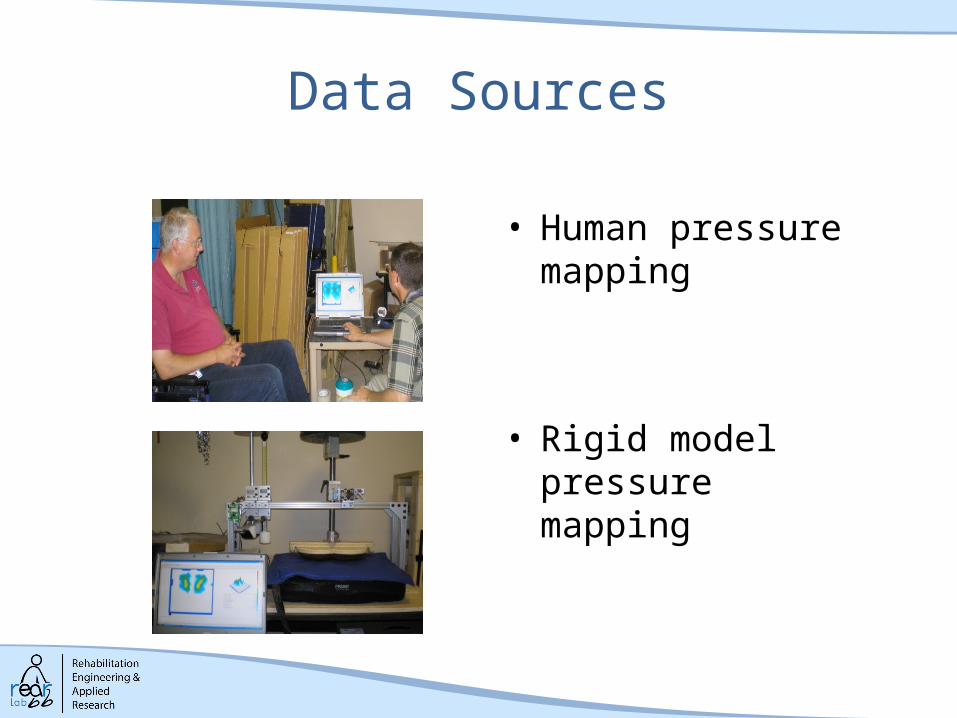
Data Sources
• Human pressure mapping
• Rigid model pressure mapping
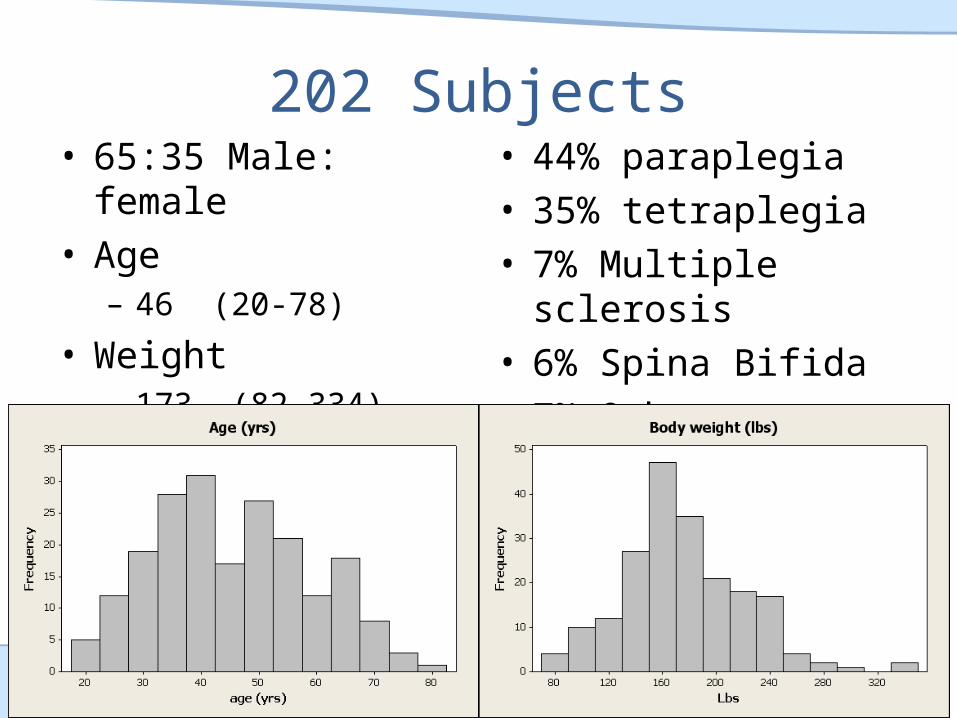
202 Subjects• 65:35 Male: female• Age
– 46 (20-78)
• Weight– 173 (82-334)
• 44% paraplegia• 35% tetraplegia• 7% Multiple sclerosis• 6% Spina Bifida• 7% Other
Cushion Descriptions
• Avg Age: 32 months– ‘New’→ 196 months (16 yrs)
• Hours sat upon per day– Mean= 12– 1 → 22 hrs
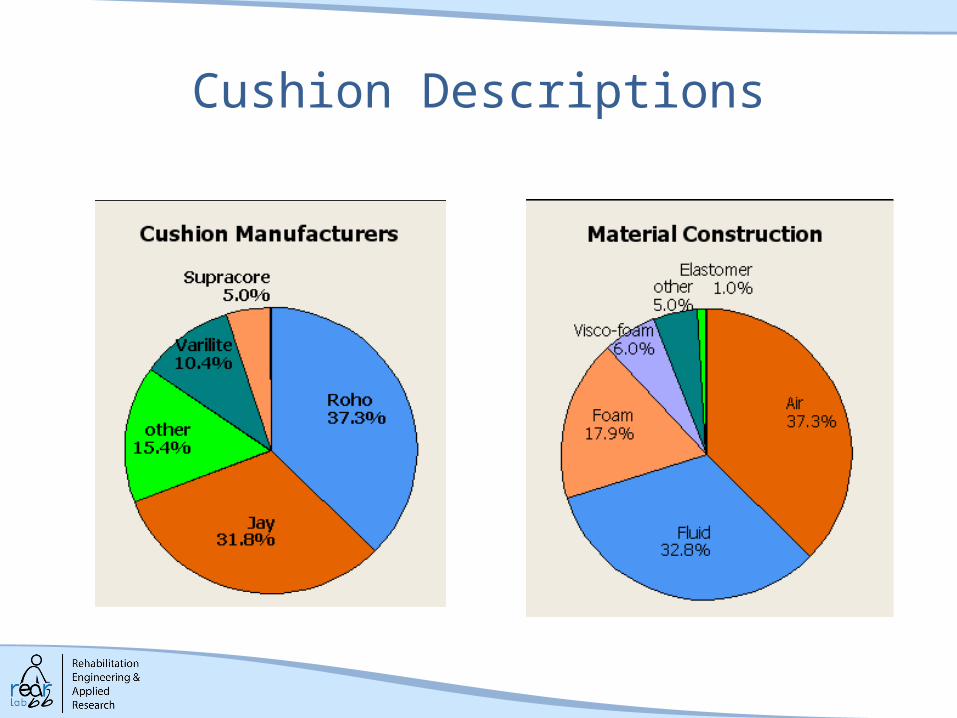
Cushion Descriptions
Repeat visits
• 10 cushions were measured 4 times• 30 cushions were measured 3 times • 51 cushions were measured twice
345 visits in total

Tons of variables collected
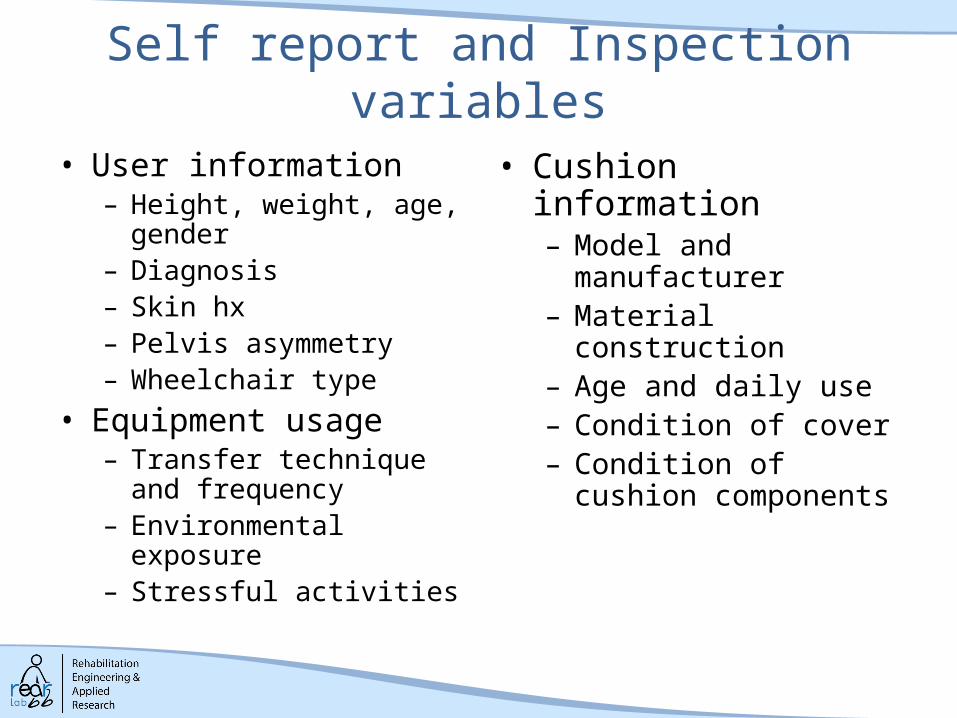
Self report and Inspection variables
• User information– Height, weight, age,
gender– Diagnosis– Skin hx– Pelvis asymmetry– Wheelchair type
• Equipment usage– Transfer technique and
frequency– Environmental exposure– Stressful activities
• Cushion information– Model and manufacturer– Material construction– Age and daily use– Condition of cover– Condition of cushion
components
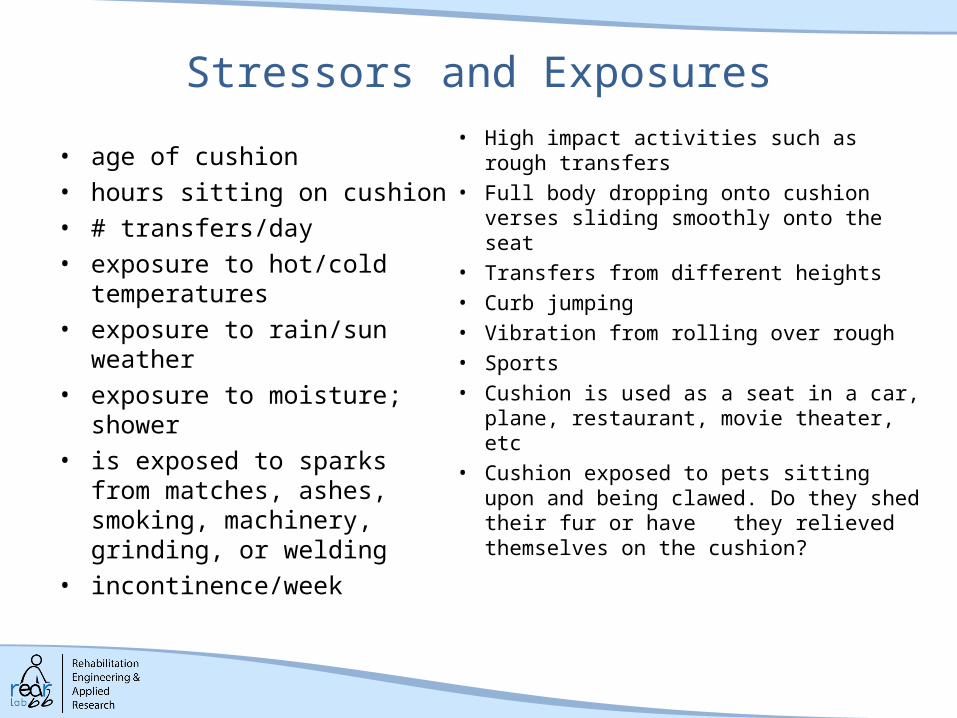
Stressors and Exposures
• age of cushion• hours sitting on cushion• # transfers/day • exposure to hot/cold
temperatures• exposure to rain/sun weather• exposure to moisture; shower• is exposed to sparks from
matches, ashes, smoking, machinery, grinding, or welding
• incontinence/week
• High impact activities such as rough transfers
• Full body dropping onto cushion verses sliding smoothly onto the seat
• Transfers from different heights • Curb jumping • Vibration from rolling over rough • Sports • Cushion is used as a seat in a car, plane,
restaurant, movie theater, etc• Cushion exposed to pets sitting upon and
being clawed. Do they shed their fur or have they relieved themselves on the cushion?
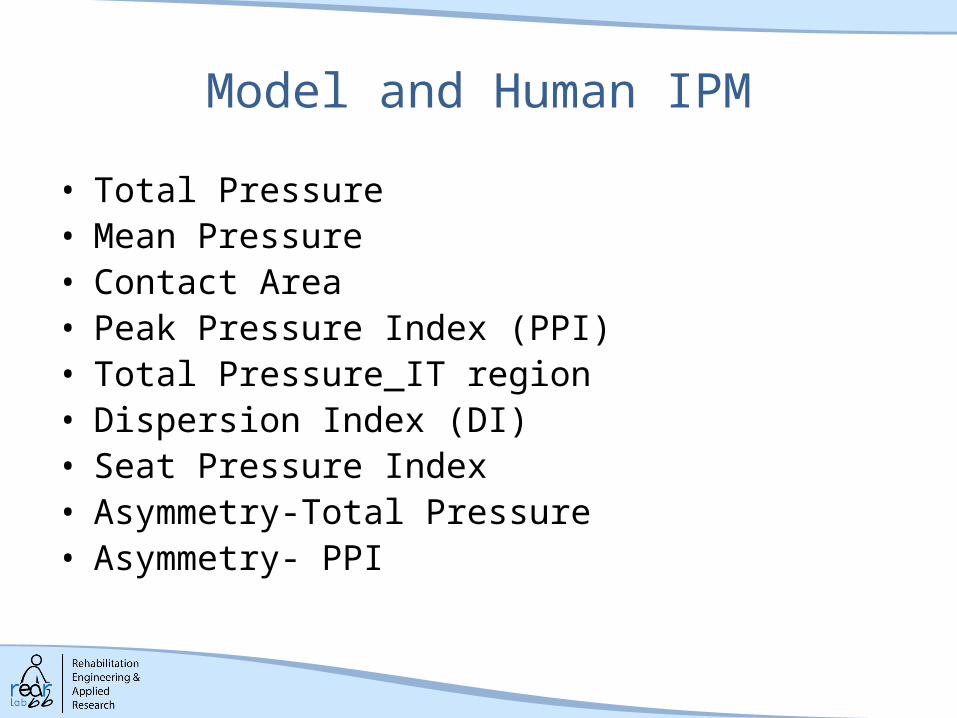
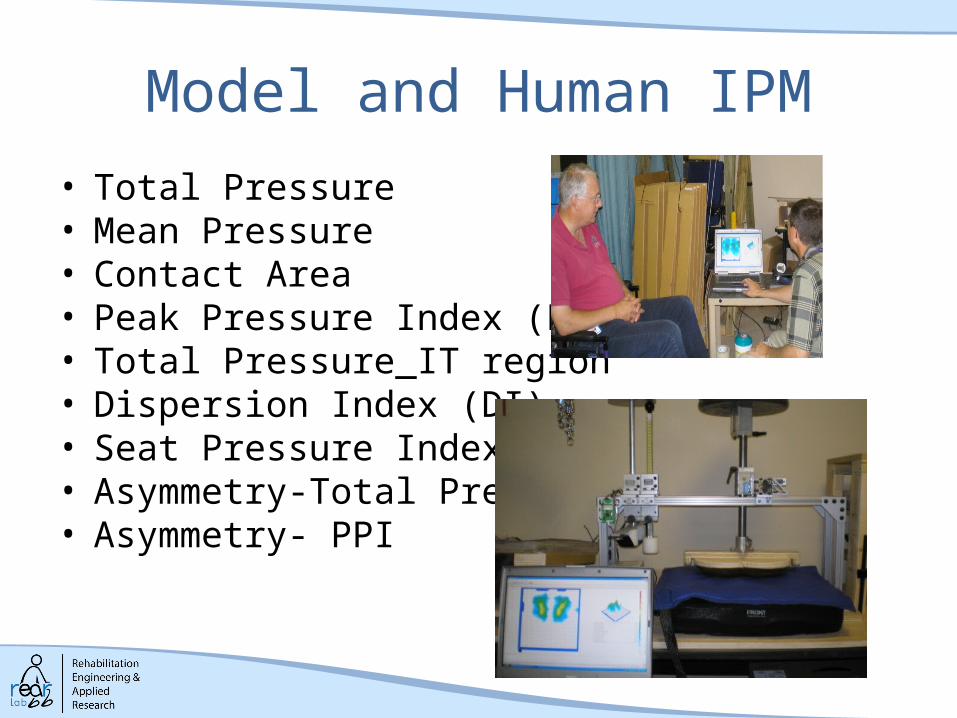
Model and Human IPM
• Total Pressure• Mean Pressure• Contact Area• Peak Pressure Index (PPI)• Total Pressure_IT region• Dispersion Index (DI)• Seat Pressure Index• Asymmetry-Total Pressure • Asymmetry- PPI
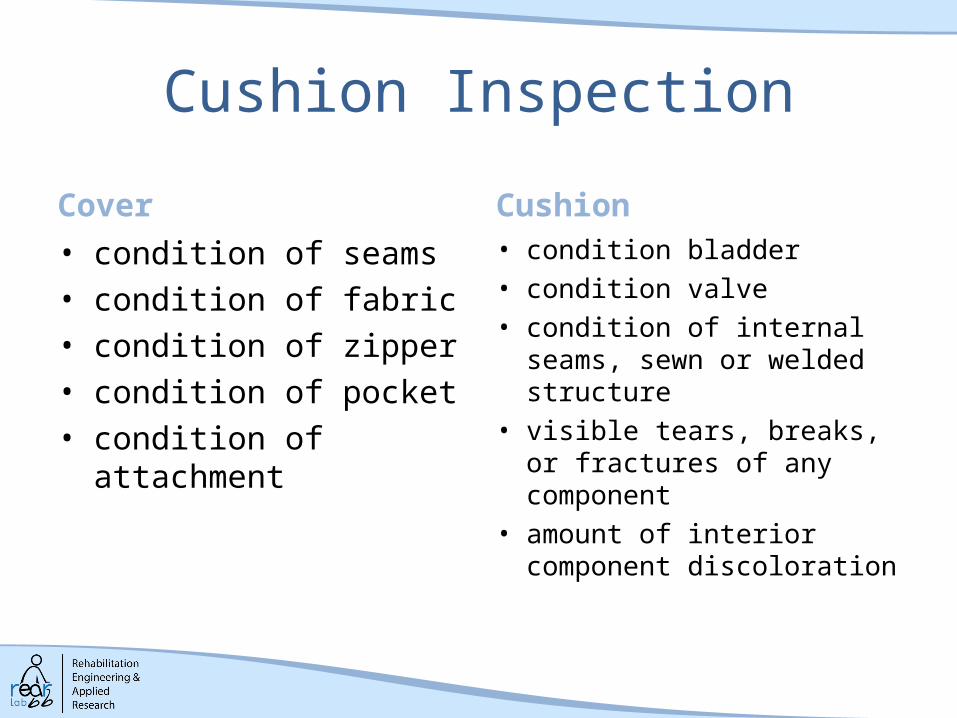
Cushion Inspection
Cover• condition of seams• condition of fabric• condition of zipper• condition of pocket• condition of attachment
Cushion• condition bladder• condition valve• condition of internal seams,
sewn or welded structure• visible tears, breaks, or
fractures of any component• amount of interior
component discoloration
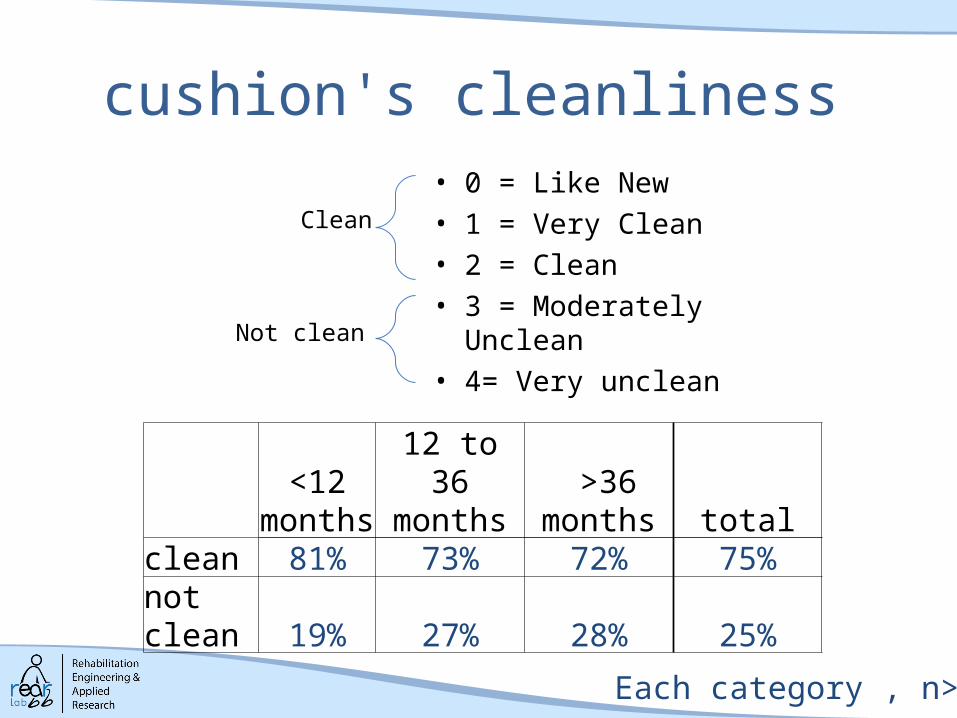
cushion's cleanliness• 0 = Like New • 1 = Very Clean• 2 = Clean• 3 = Moderately Unclean• 4= Very unclean
<12 months
12 to 36 months
>36 months total
clean 81% 73% 72% 75%not clean 19% 27% 28% 25%
Clean
Not clean
Each category , n>80
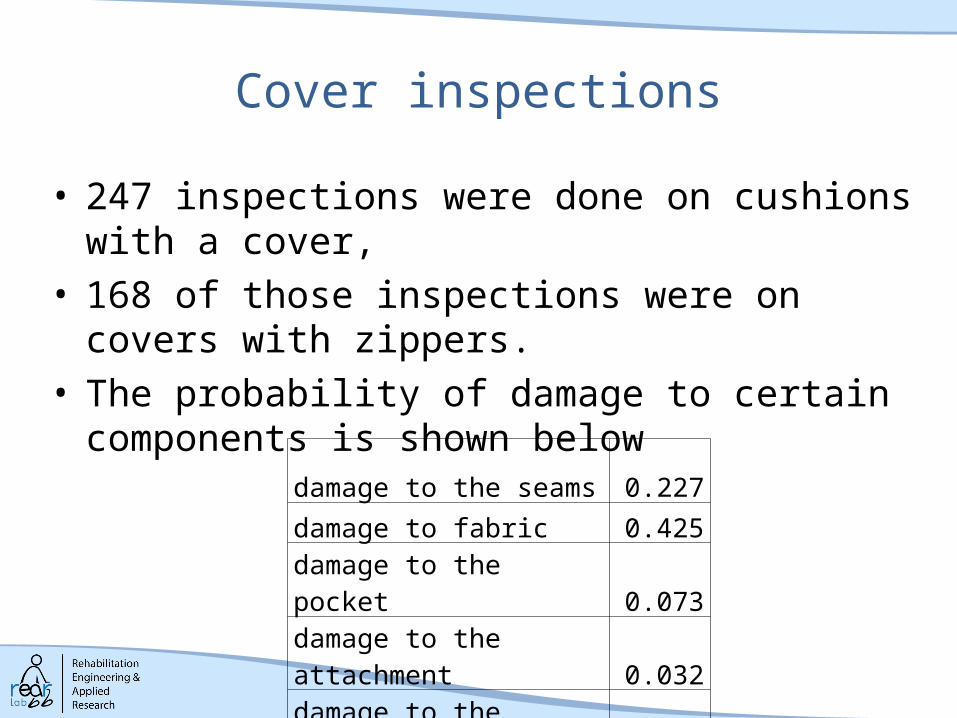
Cover inspections
damage to the seams 0.227
damage to fabric 0.425
damage to the pocket 0.073
damage to the attachment 0.032
damage to the zipper 0.077
• 247 inspections were done on cushions with a cover, • 168 of those inspections were on covers with zippers. • The probability of damage to certain components is
shown below
Data allows calculation of the prevalence of different signs of wear
Gives insight into what wears out and how often
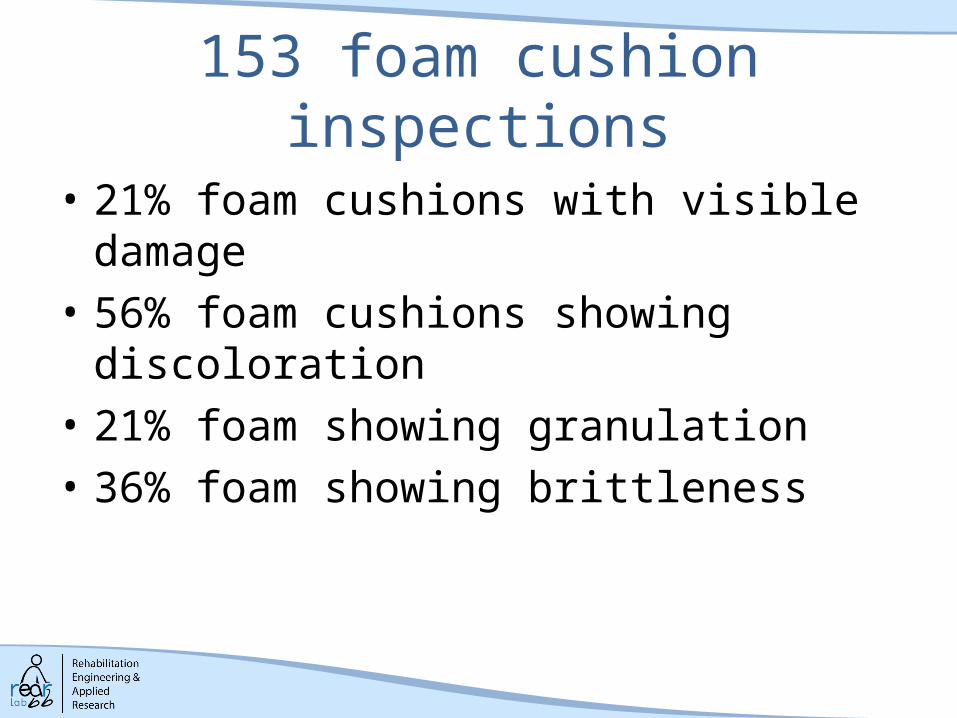
153 foam cushion inspections
• 21% foam cushions with visible damage• 56% foam cushions showing discoloration• 21% foam showing granulation• 36% foam showing brittleness
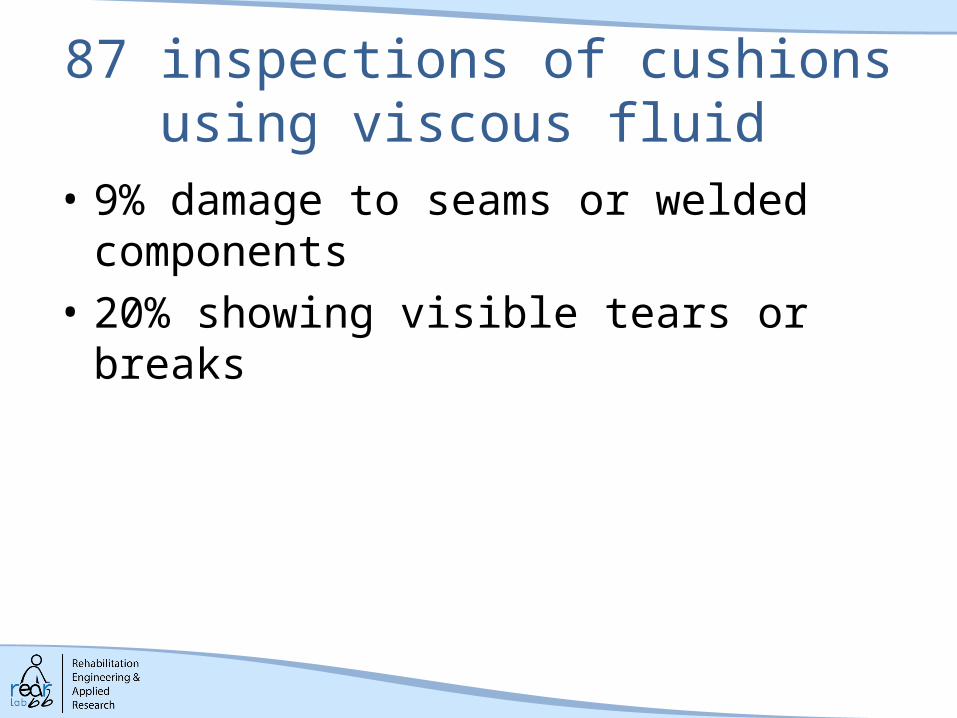
87 inspections of cushions using viscous fluid
• 9% damage to seams or welded components• 20% showing visible tears or breaks
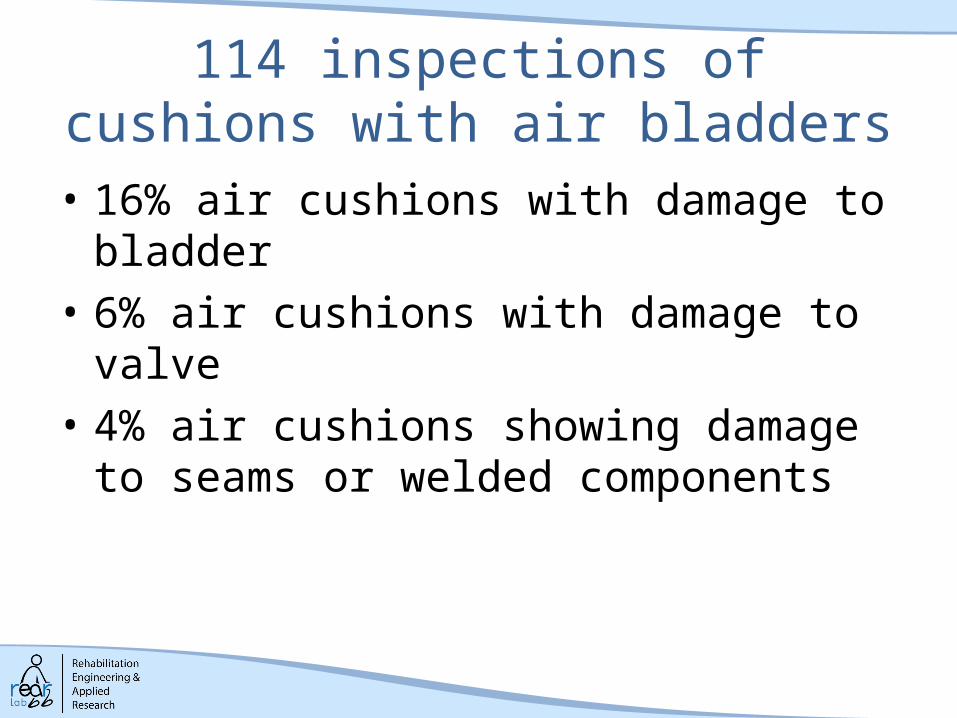
114 inspections of cushions with air bladders
• 16% air cushions with damage to bladder• 6% air cushions with damage to valve• 4% air cushions showing damage to seams or
welded components
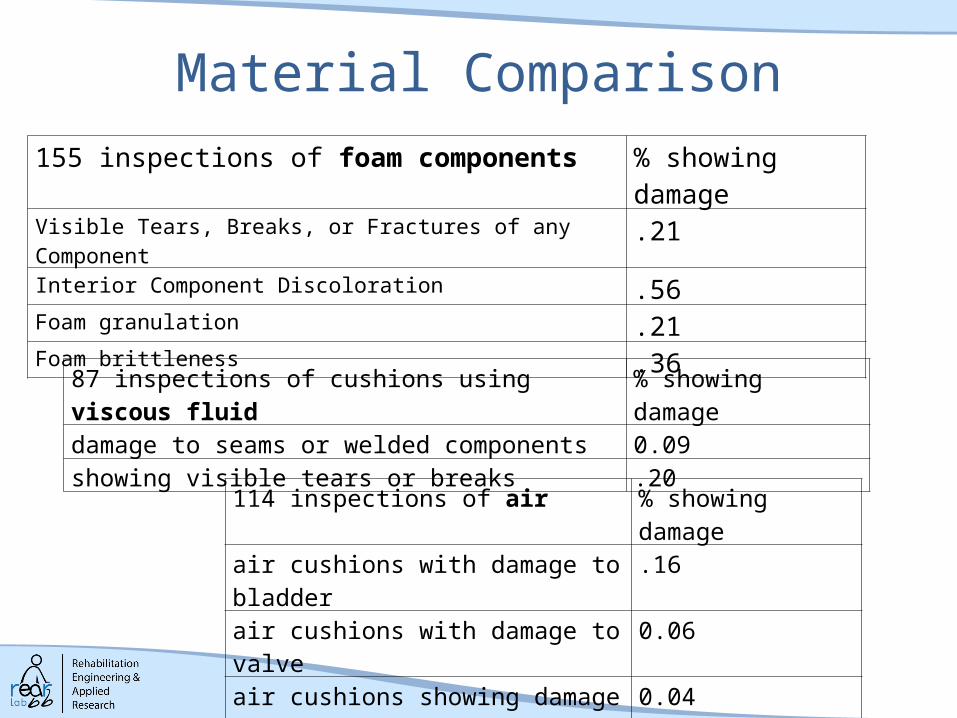
Material Comparison155 inspections of foam components % showing damageVisible Tears, Breaks, or Fractures of any Component .21Interior Component Discoloration .56Foam granulation .21Foam brittleness .36
114 inspections of air % showing damageair cushions with damage to bladder .16air cushions with damage to valve 0.06air cushions showing damage to seams or welded components
0.04
87 inspections of cushions using viscous fluid % showing damagedamage to seams or welded components 0.09showing visible tears or breaks .20
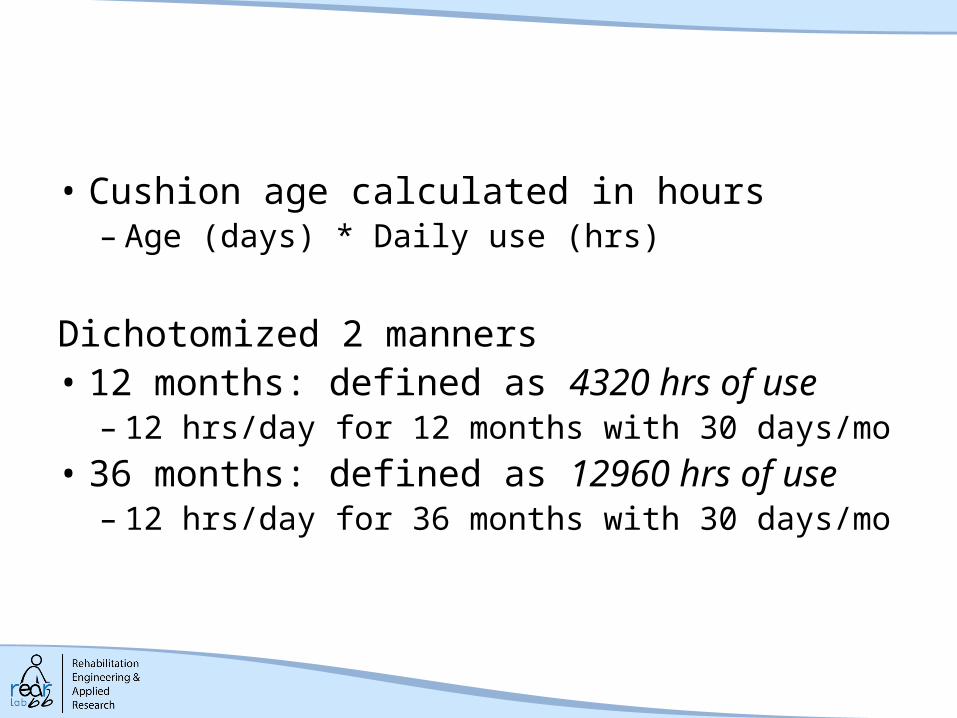
• Cushion age calculated in hours– Age (days) * Daily use (hrs)
Dichotomized 2 manners• 12 months: defined as 4320 hrs of use
– 12 hrs/day for 12 months with 30 days/mo• 36 months: defined as 12960 hrs of use
– 12 hrs/day for 36 months with 30 days/mo
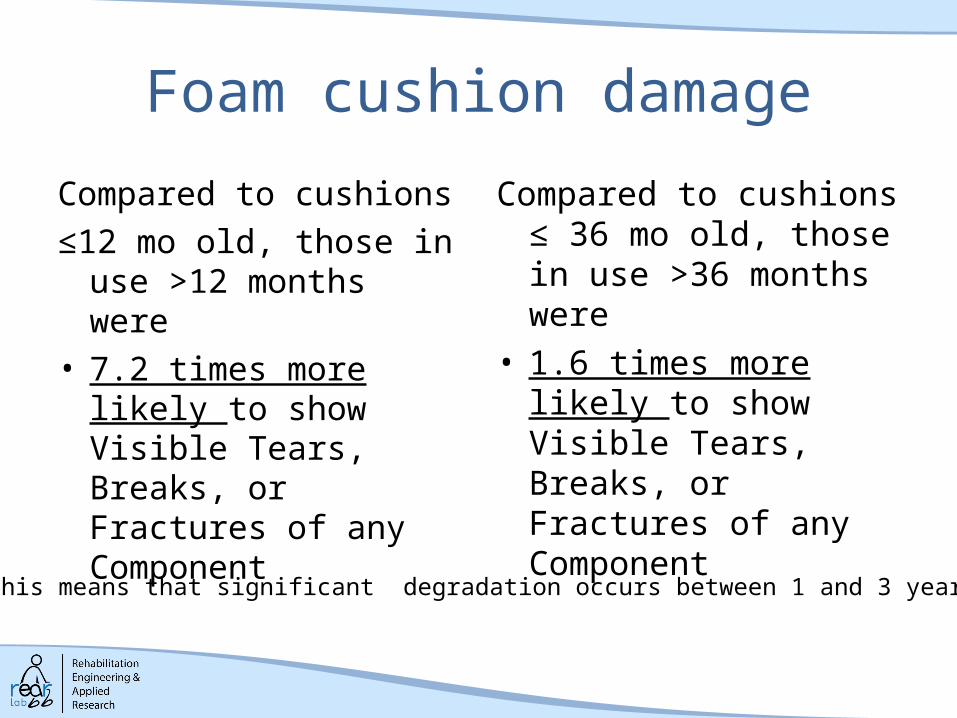
Foam cushion damage
Compared to cushions ≤12 mo old, those in use
>12 months were• 7.2 times more likely to
show Visible Tears, Breaks, or Fractures of any Component
Compared to cushions ≤ 36 mo old, those in use >36 months were
• 1.6 times more likely to show Visible Tears, Breaks, or Fractures of any Component
This means that significant degradation occurs between 1 and 3 years

That was inspection
Now, look at performance
Model and Human IPM• Total Pressure• Mean Pressure• Contact Area• Peak Pressure Index (PPI)• Total Pressure_IT region• Dispersion Index (DI)• Seat Pressure Index• Asymmetry-Total Pressure • Asymmetry- PPI
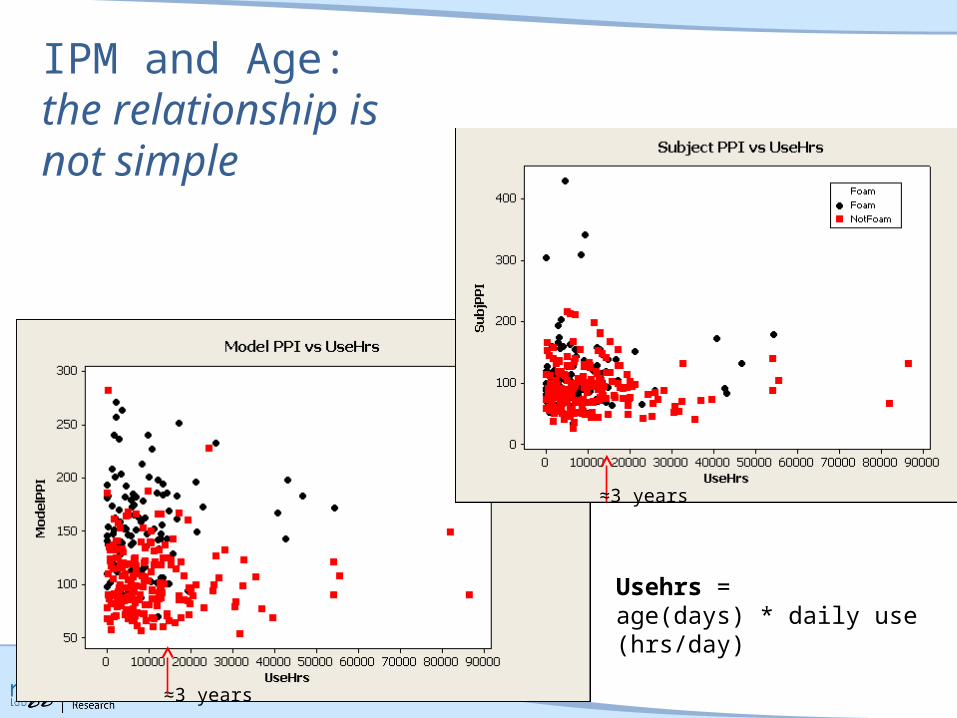
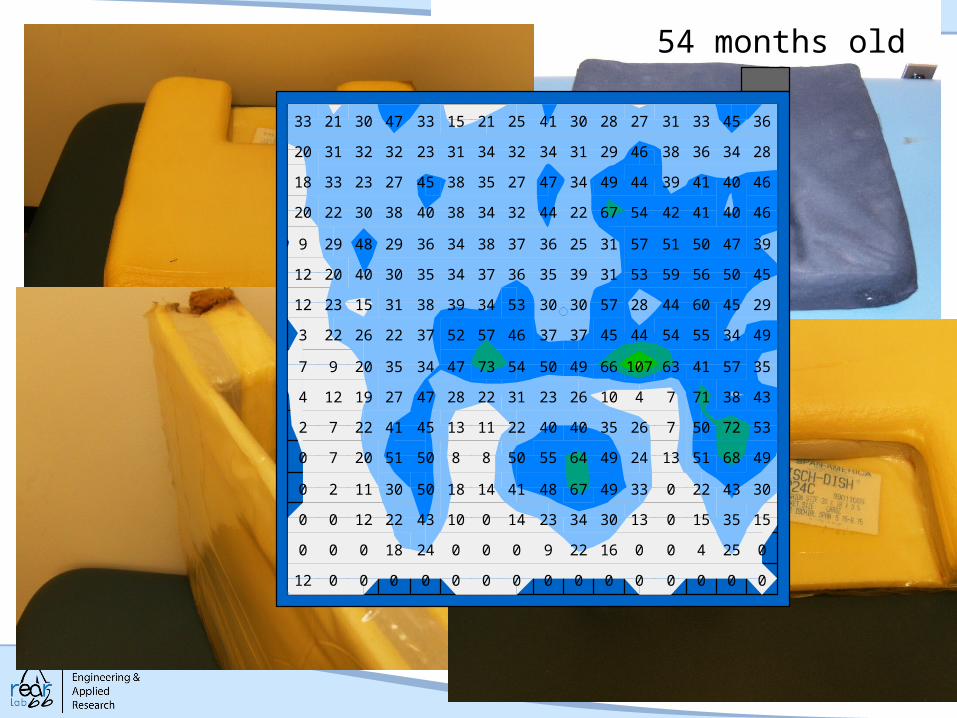
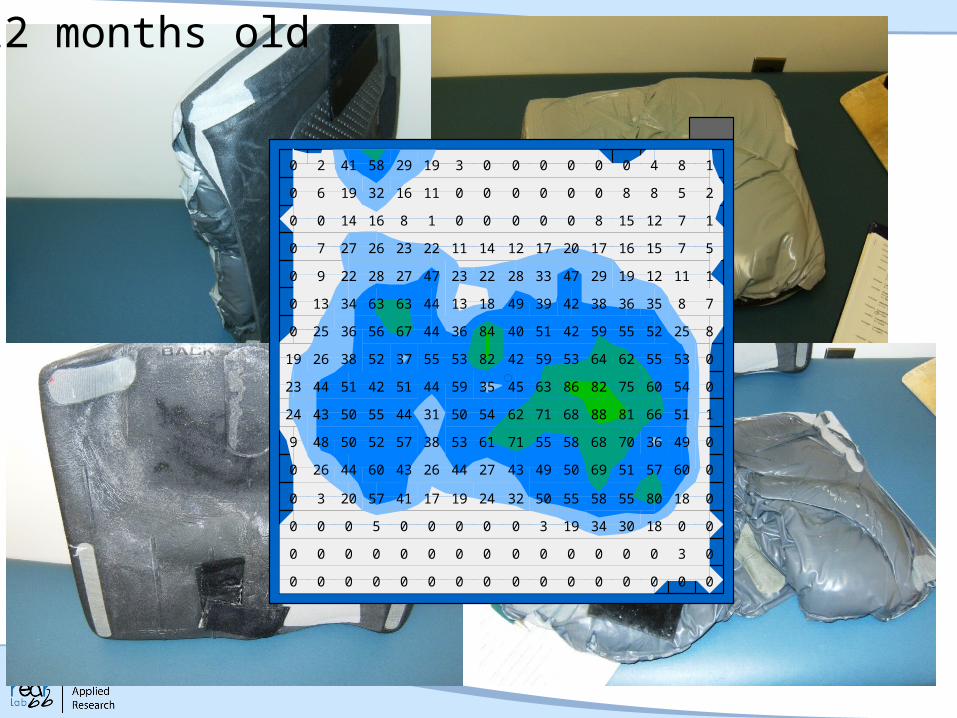
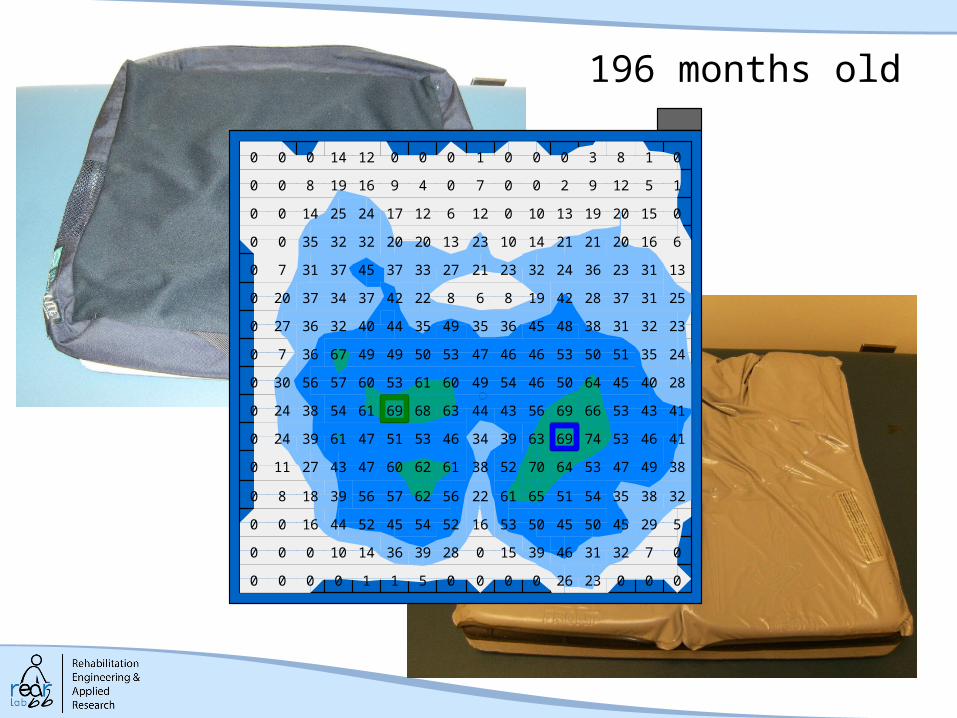
IPM and Age: the relationship is not simple
≈3 years
≈3 years
Usehrs = age(days) * daily use (hrs/day)

Examples illustrate complexity
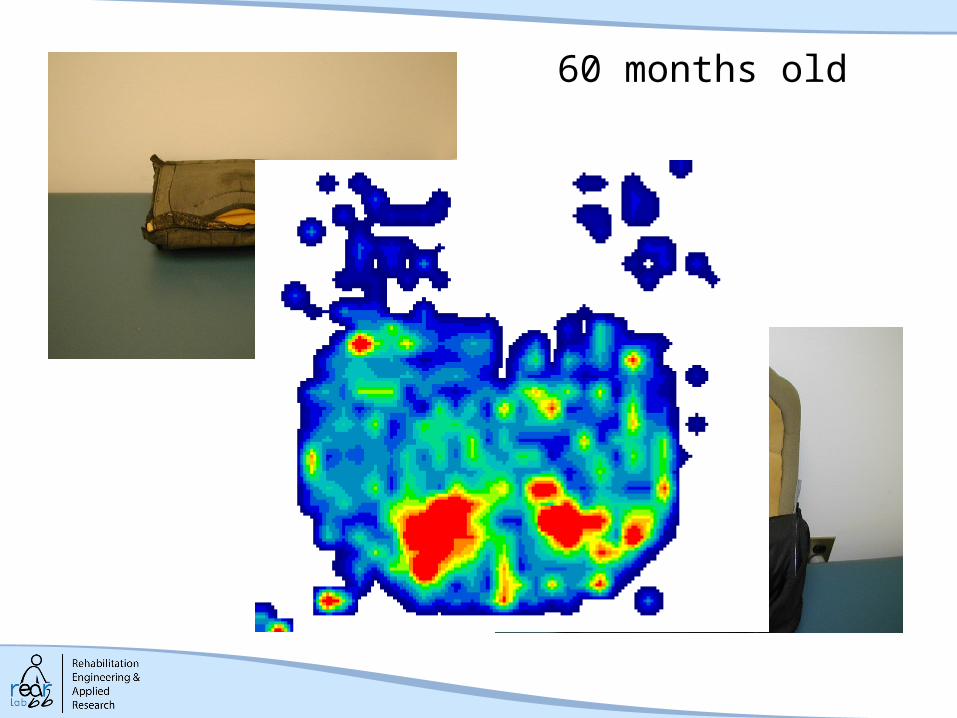
60 months old
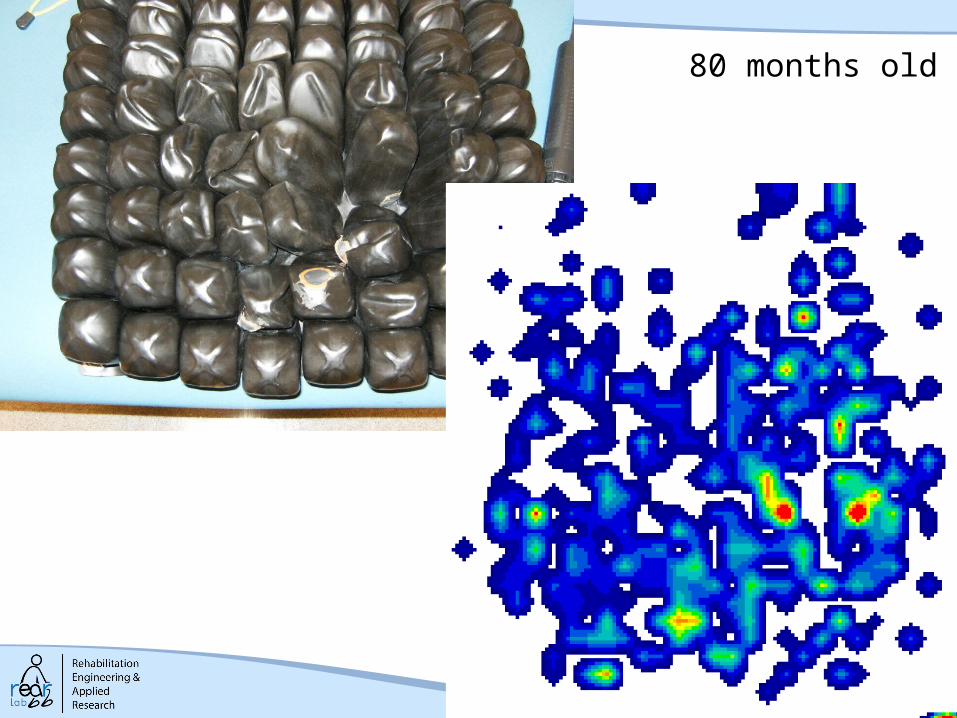
80 months old
00000000000000012
025400162290002418000
1535150133034231401043221200
30432203349674841141850301120
4968511324496455508850512070
53725072635404022111345412272
43387174102623312228472719124
3557416310766495054734734352097
4934555444453737465752372226223
29456044285730305334393831152312
45505659533139353637343530402012
3947505157312536373834362948299
46404142546722443234384038302220
46404139444934472735384527233318
28343638462931343234312332323120
36453331272830412521153347302133
Minimum
200
mmHg
0secs 1-1-2-3-4-5-6-7-8-9
Minimum (mmHg)
Maximum (mmHg)
Average (mmHg)
Variance (mmHg²)
Standard deviation (mmHg)
Coefficient of variation (%)
Horizontal center (in)
Vertical center (in)
Sensing area (in²)
Regional distribution (%)
Comfort index (%)
0.00
106.80
29.93
349.92
18.71
62.51
6.99
6.80
256.00
100.00
74.99
0
20
40
60
80
100
120
140
160
180
200
54 months old
0000000000000000
0300000000000000
00183034193000005000
01880555855503224191741572030
060575169504943274426436044260
049367068585571615338575250489
1516681886871625450314455504324
0546075828663453559445142514423
0535562645359428253553752382619
825525559425140843644675636250
78353638423949181344636334130
11112192947332822234727282290
5715161720171214112223262770
17121580000018161400
25880000001116321960
18400000031929584120
Minimum
200
mmHg
0secs 1-1-2-3-4-5-6-7-8-9
Minimum (mmHg)
Maximum (mmHg)
Average (mmHg)
Variance (mmHg²)
Standard deviation (mmHg)
Coefficient of variation (%)
Horizontal center (in)
Vertical center (in)
Sensing area (in²)
Regional distribution (%)
Comfort index (%)
0.00
88.05
25.79
611.44
24.73
95.89
7.78
8.23
256.00
100.00
8.23
0
20
40
60
80
100
120
140
160
180
200
12 months old
000232600005110000
07323146391502839361410000
52945504550531652544552441600
323835545165612256625756391880
3849475364705238616260474327110
4146537469633934465351476139240
4143536669564344636869615438240
2840456450465449606153605756300
243551505346464753504949673670
2332313848453635493544403236270
2531372842198682242373437200
133123362432232127333745373170
61620212114102313202032323500
015201913100126121724251400
1512920070491619800
018300010001214000
Minimum
200
mmHg
0secs 1-1-2-3-4-5-6-7-8-9
Minimum (mmHg)
Maximum (mmHg)
Average (mmHg)
Variance (mmHg²)
Standard deviation (mmHg)
Coefficient of variation (%)
Horizontal center (in)
Vertical center (in)
Sensing area (in²)
Regional distribution (%)
Comfort index (%)
69.15
69.15
69.15
0.00
0.00
0.00
10.50
9.50
1.00
0.96
100.00
69.04
69.04
69.04
0.00
0.00
0.00
4.50
10.50
1.00
0.96
100.00
0
20
40
60
80
100
120
140
160
180
200
196 months old
007015401330101114160
1013354038341516474354473260
65164257864540486482755444220
1518364037453848297286825338260
4629454443334344445767805749300
4534455651383456583648645048372
3842413743393544333046444768509
37323531364140362540383034485314
2930302932393230363632334134313
2320282730333024262629233754216
18132925262514321720222934381614
282415151914532181822314450
192024168710041115402200
24162324143000122440361700
111123226000072129361700
758110000011817161000
Minimum
200
mmHg
0secs 1-1-2-3-4-5-6-7-8-9
Minimum (mmHg)
Maximum (mmHg)
Average (mmHg)
Variance (mmHg²)
Standard deviation (mmHg)
Coefficient of variation (%)
Horizontal center (in)
Vertical center (in)
Sensing area (in²)
Regional distribution (%)
Comfort index (%)
0.00
85.93
26.43
378.13
19.45
73.58
8.12
9.32
256.00
100.00
52.84
0
20
40
60
80
100
120
140
160
180
200
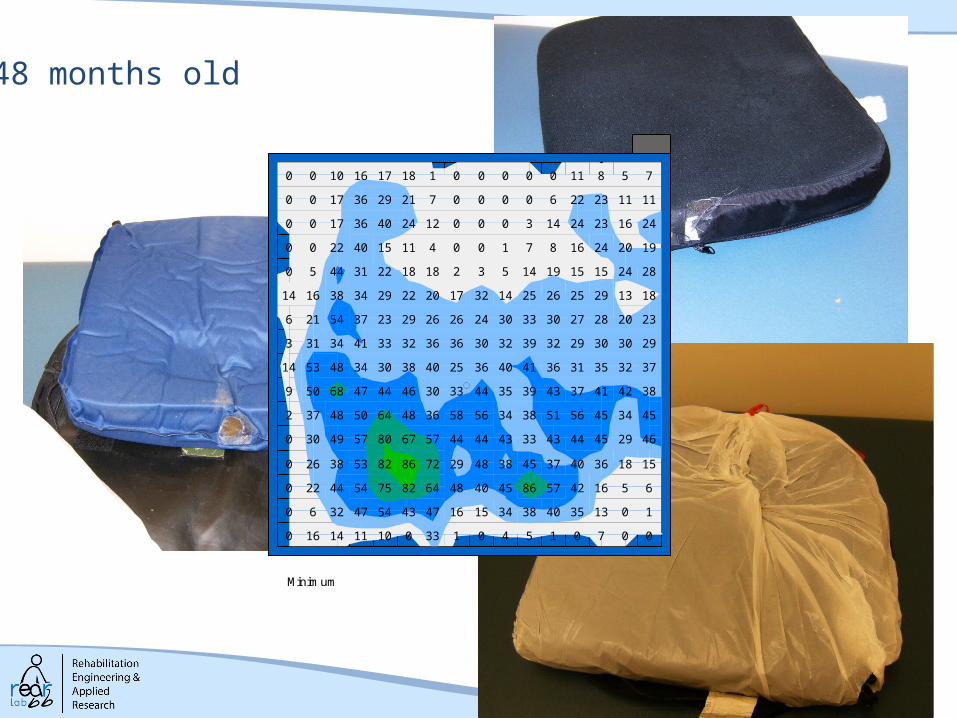
48 months old

08193242534557514853545339330
12122151526249454745535151312214
442528342425203141130304440130
584143364768248285055282014210
54594760807433312885686053385312
7574424775491542559535756256131
5849353652261512255494456206042
434120151270035192636224127
40283725344132174031323938584724
32362228243122244438244355333839
34212425242334404426373252501417
2115262322171420203539392153200
101219191513121025342338352550
0581210711128302328241700
004643003118292322400
000550002919302415000
Minimum
200
mmHg
0secs 1-1-2-3-4-5-6-7-8-9
Minimum (mmHg)
Maximum (mmHg)
Average (mmHg)
Variance (mmHg²)
Standard deviation (mmHg)
Coefficient of variation (%)
Horizontal center (in)
Vertical center (in)
Sensing area (in²)
Regional distribution (%)
Comfort index (%)
0.00
85.21
28.89
367.03
19.16
66.31
8.04
9.46
256.00
100.00
67.38
0
20
40
60
80
100
120
140
160
180
200
60 months old

Sometimes, inspection reflects performance
Sometimes, it doesn’t
Model IPM data designed to provide consistency
0000102112000000000
000327393783202270123702100
0005199801308215951401801295520
0068110711714811650128202142717310
00085106145143131271211981929974100
000898118126127291121281171144600
0000270699571191078634000
0000000000000000
0000000000000000
0000000000000000
0000000000000000
0000000000000000
0000000000000000
0000000000000000
0000000000000000
0000000000000000
Minimum (mmHg)
Maximum (mmHg)
Average (mmHg)
Variance (mmHg²)
Standard deviation (mmHg)
Coefficient of variation (%)
Horizontal center (in)
Vertical center (in)
Sensing area (in²)
0.00
201.99
23.06
2127.67
46.13
200.07
8.68
12.04
256.00
0
20
40
60
80
100
120
140
160
180
200
0000000000000000
0009221700014120000
004871101857405689857444000
0041119110182801311111816917052000
0020102174137476721592009520000
002491149200115121021881046247000
000591151201431912816574828000
00004202903026710000
0000000000000000
0000000000000000
0000000000000000
0000000000000000
0000000000000000
0000000000000000
0000000000000000
0000000000000000
Minimum (mmHg)
Maximum (mmHg)
Average (mmHg)
Variance (mmHg²)
Standard deviation (mmHg)
Coefficient of variation (%)
Horizontal center (in)
Vertical center (in)
Sensing area (in²)
0.00
200.00
19.97
1986.00
44.56
223.13
8.02
12.13
289.27
0
20
40
60
80
100
120
140
160
180
200
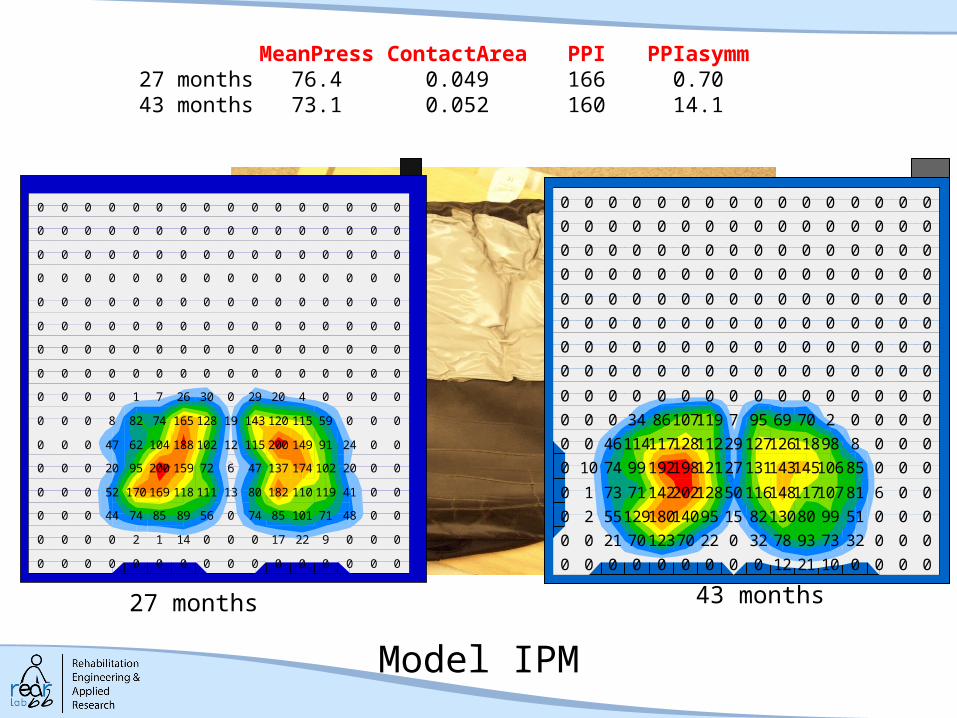
27 months 43 months
MeanPress ContactArea PPI PPIasymm27 months 76.4 0.049 166 0.7043 months 73.1 0.052 160 14.1
Model IPM

A lot of variables, a lot of variance
• In principal components analysis (PCA), one wishes to extract from a set of p variables a reduced set of m components that accounts for most of the variance in the p variables.
• Goal: to reduce a set of p variables to m components prior to further analyses
Karl L. Wuensch

Principal Component Analysis
Data subset of Repeat Visits only (232 assessments)
• Model IPM data• Information about user• Information about cushion use
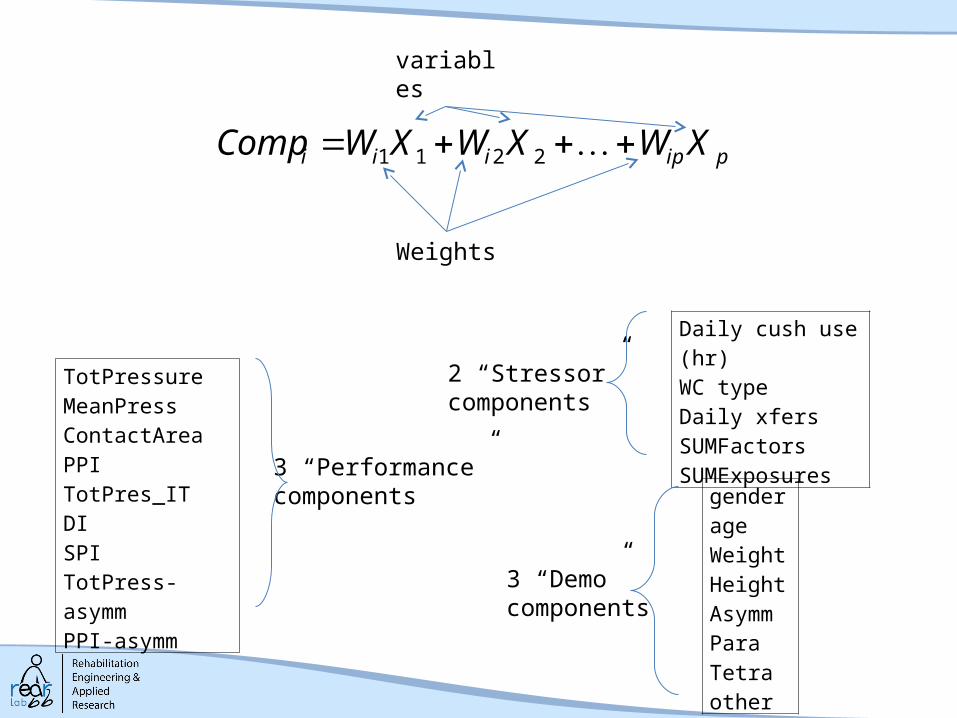
pipiii XWXWXWComp 2211
Weights
variables
TotPressureMeanPressContactAreaPPITotPres_ITDISPITotPress-asymmPPI-asymm
Daily cush use (hr)WC typeDaily xfersSUMFactorsSUMExposures
genderageWeightHeightAsymmParaTetraother
3 “Performance”components
3 “Demo”components
2 “Stressor” components
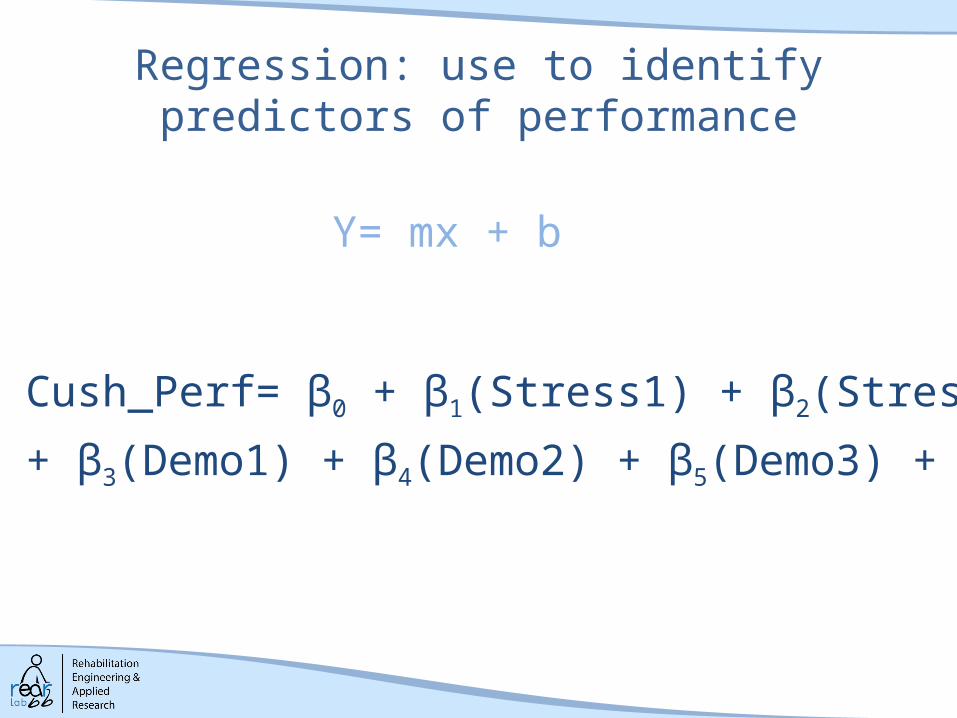
Regression: use to identify predictors of performance
Cush_Perf= β0 + β1(Stress1) + β2(Stress 2)
+ β3(Demo1) + β4(Demo2) + β5(Demo3) + β6(AgeHrs)
Y= mx + b

Regression model: can the Components predict Performance?
),3,2,1,2,1(_ AgeHrsDemoDemoDemoStressorStressorfComponentPerf
Standardized
Sig.Beta(Constant) .163
Stress1 .287 .000Demo1 -.226 .000Demo2 -.354 .000Demo3 -.114 .038AgeHrs .108 .048
R R Square.611 .373
Positive Beta
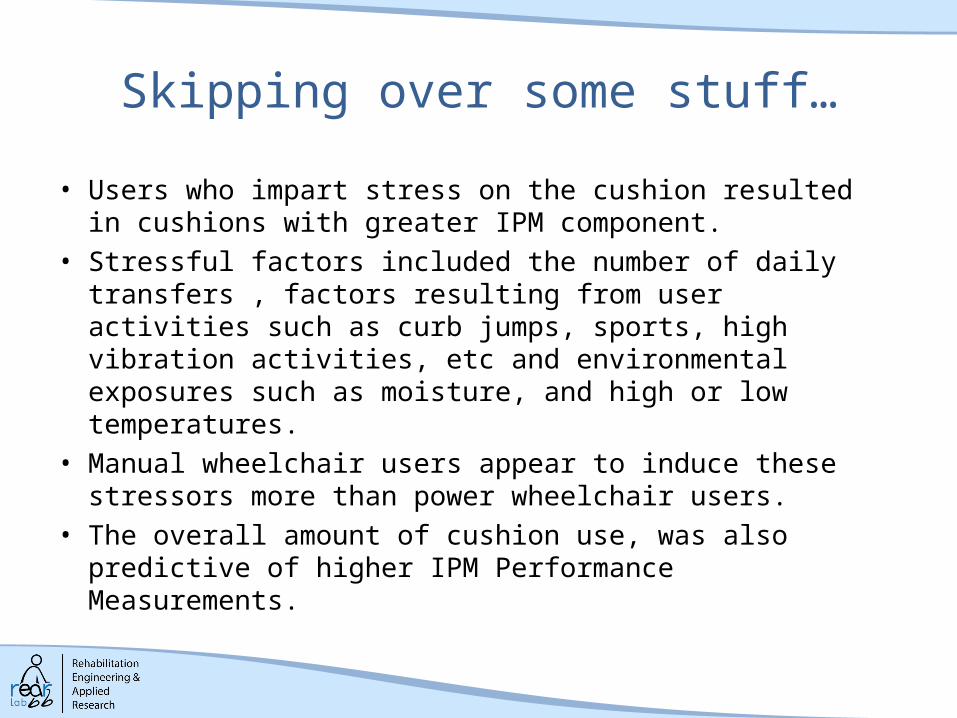
Skipping over some stuff…
• Users who impart stress on the cushion resulted in cushions with greater IPM component.
• Stressful factors included the number of daily transfers , factors resulting from user activities such as curb jumps, sports, high vibration activities, etc and environmental exposures such as moisture, and high or low temperatures.
• Manual wheelchair users appear to induce these stressors more than power wheelchair users.
• The overall amount of cushion use, was also predictive of higher IPM Performance Measurements.
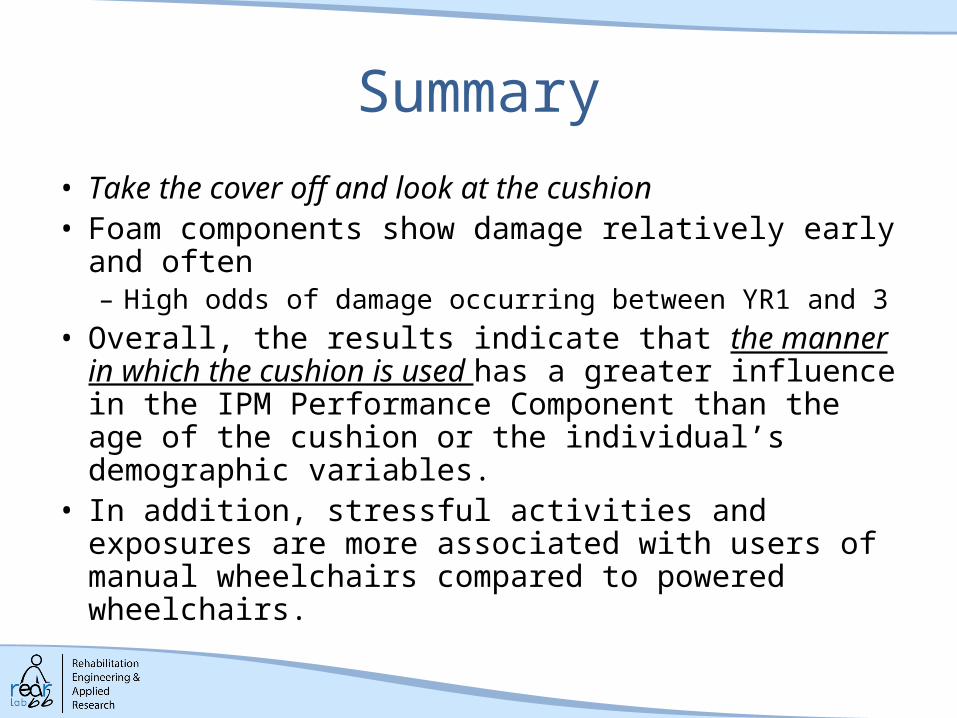
Summary
• Take the cover off and look at the cushion• Foam components show damage relatively early and
often – High odds of damage occurring between YR1 and 3
• Overall, the results indicate that the manner in which the cushion is used has a greater influence in the IPM Performance Component than the age of the cushion or the individual’s demographic variables.
• In addition, stressful activities and exposures are more associated with users of manual wheelchairs compared to powered wheelchairs.

Acknowledgements• This study was funded from two grants
supported by the National Institute on Disability and Rehabilitation Research within the Department of Education.
• The study design and data collection was funded as part of the Spinal Cord Injury Model Systems (SCIMS): Georgia Regional Spinal Cord Injury System grant #H133N060009.
• Secondary data analysis was supported by the Wheeled Mobility RERC- #H133030035.

State of the Science Conference:Wheeled Mobility in Everyday Life
In conjunction with RESNA, July 1-2, 2012
Please Visit:www.catea.gatech.edu/SOSC.php
For More Information

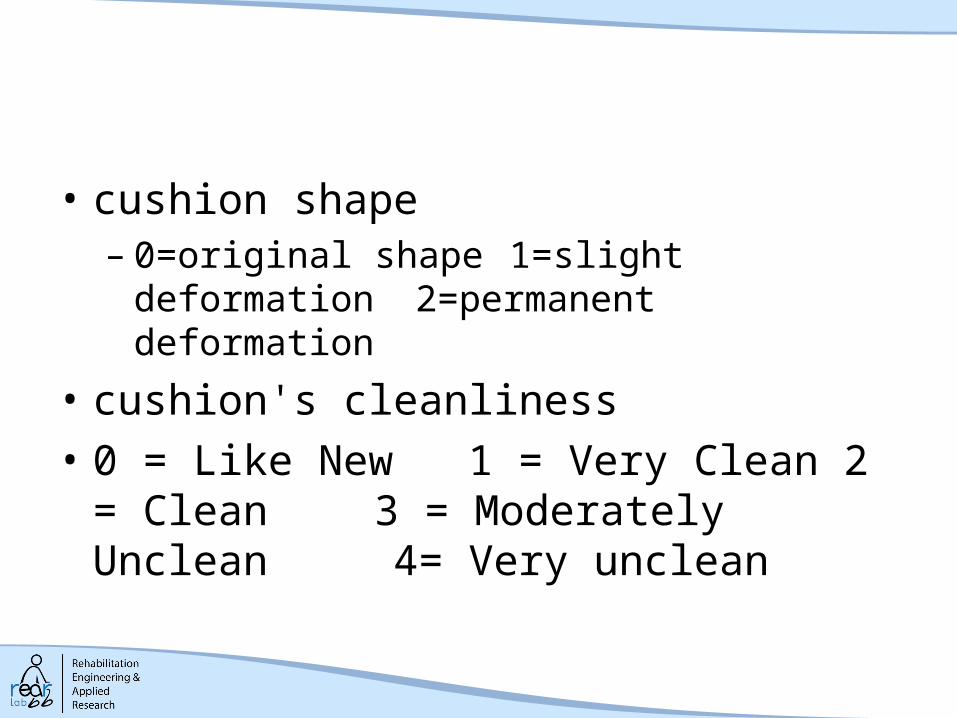
• cushion shape– 0=original shape 1=slight deformation
2=permanent deformation
• cushion's cleanliness• 0 = Like New 1 = Very Clean 2 = Clean 3
= Moderately Unclean 4= Very unclean