changes in intertidal communities in strangford lough s. vize, s.j. preston & a. portig
TRANSCRIPT

Changes inChanges inIntertidal CommunitiesIntertidal Communities
in Strangford Loughin Strangford Lough
S. Vize,S.J. Preston & A. Portig

IntroductionIntroduction
• Northern Ireland Littoral Survey (NILS)Northern Ireland Littoral Survey (NILS)
• Strangford Lough Ecological Change Strangford Lough Ecological Change Investigation (SLECI)Investigation (SLECI)
• SitesSites
• MethodologyMethodology
• Summary of SLECI intertidal findingsSummary of SLECI intertidal findings
• ConclusionsConclusions

• Northern Ireland Littoral Survey (NILS) completed in 1980’s (Wilkinson et al., 1988)
• 200 sites around Northern Ireland
• 59 sites in Strangford Lough
29 sediment sites
30 rocky shore sites
• Strangford Lough Ecological Change Investigation (SLECI) 2003-’04
• 17 sites in Strangford Lough
8 sediment sites
(4 firm, 4 soft)
9 rocky shore sites

Shores of Strangford LoughShores of Strangford Lough
• Major rocky shore habitat – boulder in nature; ranging from cobbles to large boulders
• Boulder shores may be steep & narrow or gently sloping & extensive
• Areas of muddy sand & muddy gravel & pebbles – often associated with boulder shores
• Rocky shores on eastern side of lough physically more diverse than western
• Western shores are siltier than slightly more wave exposed eastern shores
• North end – wide sedimentary flats, mainly muddy sand

Soft-Sediment SitesSoft-Sediment SitesMahee Island North
• Black Causeway, Mahee Island North, Quarterland Bay & Taggart Island
•Sampling from boat at high water
• 10 x Van Veen grabs (0.0625m2)
• Sieved (1 mm), retained, preserved and identified
• 2 grabs (abundance); 8 grabs (presence/absence)

Firm-Sediment SitesFirm-Sediment SitesMid Island Bay Greyabbey Bay
Reagh Bay Newtownards A - E

• Location descriptions & sketch maps from NILS survey examined
•Samples from upper, upper-mid, mid, mid-lower and lower shore
• 5 cores at each shore height/location
• NILS survey: 5 x box cores (0.01 m3)
• SLECI survey: 5 x cylinder cores (0.025 m3)
• Sieved (1 mm), retained, preserved and identified
• 1 core (abundance); 4 cores(presence/absence)
Firm-Sediment SitesFirm-Sediment Sites

Rocky Shore SitesRocky Shore SitesGreen Island
Kircubbin PointLong Sheelah
Mahee Island
Marlfield Rocks

• Original NILS transect locations revisited and re-surveyed
• All zones described and compared to NILS
• NILS survey methodology repeated: 8-point abundance scale
• Species composition within each zone: abundance of species identifiable in the field determined; unknown species collected for identification in the lab.
• Voucher specimens collected and preserved
Rocky Shore SitesRocky Shore Sites

Total number of species during NILS and SLECI survey, along with mean ( se) number of species per site recorded by SLECI. Pooled data from 10 x 1 litre Van Veen grabs
0
5
10
15
20
25
30
35
Mahee IslandNorth
BlackCauseway
QuarterlandBay
TaggartIsland
Site Name
Num
ber
of S
peci
es
NILS
SLECI
SLECImean +/-SE
Soft-Sediment SitesSoft-Sediment Sites
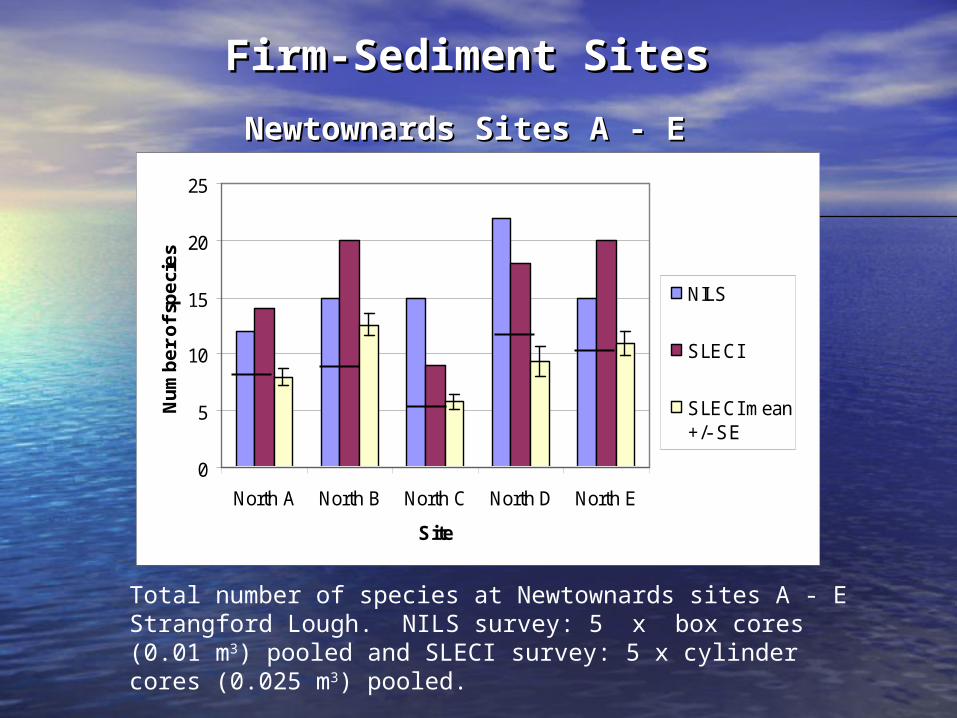
Total number of species at Newtownards sites A - E Strangford Lough. NILS survey: 5 x box cores (0.01 m3) pooled and SLECI survey: 5 x cylinder cores (0.025 m3) pooled.
Firm-Sediment SitesFirm-Sediment Sites
+3;;
+3
+8
+19
+10+13
+4
+16
+11
0
5
10
15
20
25
North A North B North C North D North E
Site
Nu
mb
er
of
spe
cie
s
NILS
SLECI
SLECI mean+/- SE
Newtownards Sites A - ENewtownards Sites A - E

Firm-Sediment SitesFirm-Sediment SitesNewtownards Sites A - ENewtownards Sites A - E
Two-dimensional MDS plot showing similarity relationships between the community composition at firm sediment sites (A-E) located at Newtownards, from NILS and SLECI surveys.

Number of species recorded at different shore heights during the NILS survey and the SLECI survey at Greyabbey Bay. NILS survey: 5 x box cores (0.01 m3) pooled and SLECI survey: 5 x cylinder cores (0.025 m3) pooled
Firm-Sediment SitesFirm-Sediment Sites
+3;;
Greyabbey BayGreyabbey Bay
0
2
4
6
8
10
12
14
16
Zone 2 Upper-Mid Shore
Zone 3 MidShore
Zone 4 Mid-Lower Shore
Zone 5 LowerShore
Shore height
Num
ber
of s
peci
es
NILS
SLECI

Firm-Sediment SitesFirm-Sediment Sites
Number of species at different shore heights from NILS survey and SLECI survey, Mid Island Bay. NILS survey: 5 x box cores (0.01 m3) pooled and SLECI survey: 5 x cylinder cores (0.025 m3) pooled.
Mid Island BayMid Island Bay
0
5
10
15
20
25
30
Zone 1UpperShore
Zone 2Upper-Mid
Shore
Zone 3 Mid Shore
Zone 4Mid-Lower
Shore
Zone 5LowerShore
Shore height
Nu
mb
er
of
spe
cie
s
NILS
SLECI
SLECImean +/-SE

Firm-Sediment SitesFirm-Sediment Sites
Number of species at different shore heights from NILS survey and the SLECI survey at Reagh Bay. NILS survey: 5 x box cores (0.01 m3) pooled and SLECI survey: 5 x cylinder cores (0.025 m3) pooled.
Reagh BayReagh Bay
0
5
10
15
20
25
30
Zone 1UpperShore
Zone 2Upper-Mid
Shore
Zone 3 Mid Shore
Zone 4Mid-Lower
Shore
Zone 5LowerShore
Shore height
Nu
mb
er
of
spec
ies
NILS
SLECI

Rocky Shore SitesRocky Shore Sites
ANOSIM R = 0.176, p = 0.001
Two-dimensional MDS plot showing similarity relationships between the community composition at different zones on the shore at rocky shore sites.
Two-dimensional MDS plot showing similarity relationships between the community composition at different zones on the shore at rocky shore sites.
ANOSIM R = 0.122, p = 0.002
BEFORE
AFTER
Rocky Shore SitesRocky Shore Sites
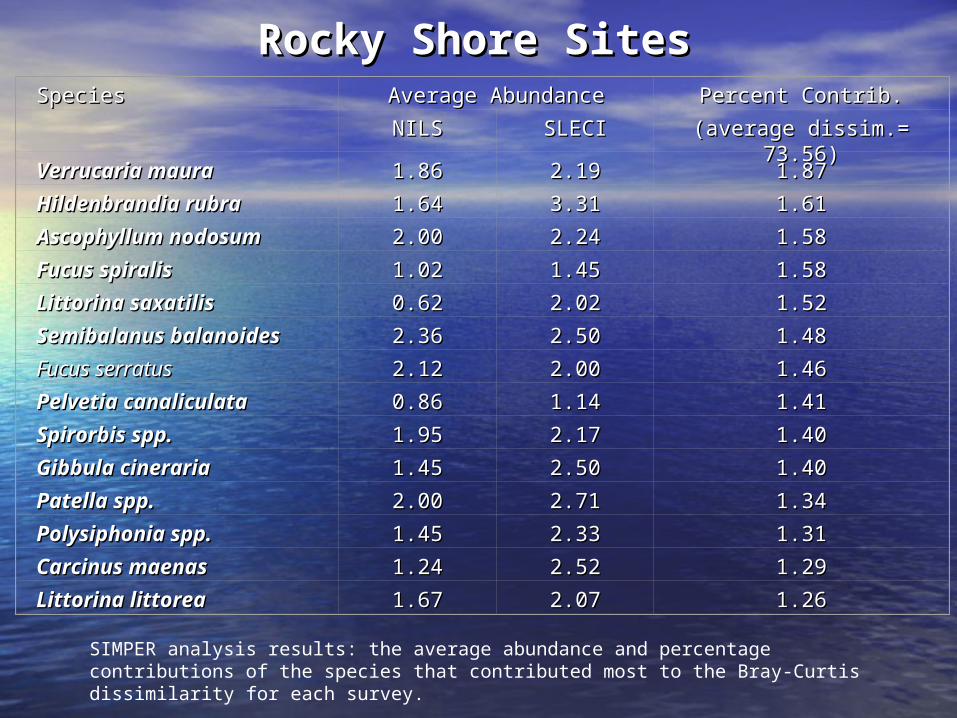
SIMPER analysis results: the average abundance and percentage contributions of the species that contributed most to the Bray-Curtis dissimilarity for each survey.
SpeciesSpecies Average AbundanceAverage Abundance Percent Contrib.Percent Contrib.
NILSNILS SLECISLECI (average dissim.= 73.56)(average dissim.= 73.56)
Verrucaria mauraVerrucaria maura 1.861.86 2.192.19 1.871.87
Hildenbrandia rubraHildenbrandia rubra 1.641.64 3.313.31 1.611.61
Ascophyllum nodosumAscophyllum nodosum 2.002.00 2.242.24 1.581.58
Fucus spiralisFucus spiralis 1.021.02 1.451.45 1.581.58
Littorina saxatilisLittorina saxatilis 0.620.62 2.022.02 1.521.52
Semibalanus balanoidesSemibalanus balanoides 2.362.36 2.502.50 1.481.48
Fucus serratusFucus serratus 2.122.12 2.002.00 1.461.46
Pelvetia canaliculataPelvetia canaliculata 0.860.86 1.141.14 1.411.41
Spirorbis spp.Spirorbis spp. 1.951.95 2.172.17 1.401.40
Gibbula cinerariaGibbula cineraria 1.451.45 2.502.50 1.401.40
Patella spp.Patella spp. 2.002.00 2.712.71 1.341.34
Polysiphonia spp.Polysiphonia spp. 1.451.45 2.332.33 1.311.31
Carcinus maenasCarcinus maenas 1.241.24 2.522.52 1.291.29
Littorina littoreaLittorina littorea 1.671.67 2.072.07 1.261.26

Rocky Shore SitesRocky Shore Sites
South Island
Photo from NILS survey - 1986
Photo from SLECI survey - 2003

North end - 2001
North end - 2002

Sargassum muticumSargassum muticum present: present:
Chapel Island CausewayChapel Island Causeway
Kircubbin PointKircubbin Point
Marlfield RocksMarlfield Rocks
Limestone RockLimestone Rock
Long SheelahLong Sheelah
South IslandSouth Island
Invasive AlgaInvasive Alga

SummarySummary
• Soft-sediment sites: high spatial variability – not Soft-sediment sites: high spatial variability – not indicative of temporal changeindicative of temporal change
• Firm-sediment sites: expected increase in numbers Firm-sediment sites: expected increase in numbers of species due to doubling sampling effortof species due to doubling sampling effort
• Rocky shore sites: significant difference between Rocky shore sites: significant difference between NILS & SLECI surveys – difference still apparent NILS & SLECI surveys – difference still apparent after species repertoires refined to reduce after species repertoires refined to reduce survey/species expertisesurvey/species expertise
• Loss of Loss of Ascophyllum nodosumAscophyllum nodosum at Marlfield Rocks, at Marlfield Rocks, Mahee Island, Kircubbin Point, South Island. Mahee Island, Kircubbin Point, South Island.
• Japanese alga Japanese alga Sargassum muticumSargassum muticum now present in now present in Strangford Lough.Strangford Lough.

AcknowledgementsAcknowledgements
• Investigation commissioned by the Environment and Heritage Service, Northern Ireland
• Adam Mellor (DARD) for assisting with boat work
• David Hall (Unicomarine) NMBAQCS quality control
• Mark Johnson (QUB) and James Strong (DARD) for assisting with data analysis
• Christine Maggs (QUB) for assisting with algal identification