changes in blood pressure, body mass index, and salt consumption in a chinese population
TRANSCRIPT

Preventive Medicine 29, 165–172 (1999)Article ID pmed.1999.0530, available online at http://www.idealibrary.com on
Changes in Blood Pressure, Body Mass Index, and Salt Consumptionin a Chinese Population1
Zhijie Yu, M.D.,*,2 Guide Song, M.D.,† Zeyu Guo, M.D.,† Gengwen Zheng, M.D.,†Huiguang Tian, M.P.H., Ph.D.,† Erkki Vartiainen, M.D., Ph.D.,‡ Pekka Puska, M.D., Ph.D.,‡
and Aulikki Nissinen, M.D., Ph.D.*
*Department of Public Health and General Practice, University of Kuopio, FIN-70211 Kuopio, Finland;h Bureau, Tianjin, the People’s Republic of China; and, National Public Health Institute, Helsinki, Finland
†Department of Chronic Diseases, Tianjin Public Healt‡Department of Epidemiology and Health Promotion
Background. The prevalence of hypertension amongthe population of Tianjin is one of the highest in China.We attempted to assess the changes in blood pressure,body mass index, and salt consumption in Tianjin from1989 to 1996.
Methods. Two independent cross-sectional popula-tion surveys with the representative samples of 14,046persons in 1989 and 2,000 persons in 1996 were carriedout in Tianjin. A salt surveillance system was estab-lished with four salt consumption surveys (in 1992,1993, 1994, and 1996) to estimate the changes in saltconsumption at the household level.
Results. From 1989 to 1996, the prevalence of hyper-tension and obesity decreased among people aged45–64 years in both genders. Mean systolic blood pres-sure decreased significantly in women and leveled offin men. Diastolic blood pressure increased signifi-cantly. Body mass index remained unchanged. The un-favorable trends were mainly attributable to the nega-tive changes in younger people (15–34 years) in bothgenders. There were no changes in salt consumptionbetween 1992 and 1996 at the house level.
Conclusions. There was a favorable development in
prevalence of hypertension and obesity among individ-uals in the age group of 45–64 years in the study popula-tion. Health education needs to pay more attention toyoung people. q 1999 American Health Foundation and Academic Press1 This study was jointly supported by a grant from the TianjinPublic Health Bureau, Tianjin, the People’s Republic of China; a grantfrom the National Public Health Institute, Helsinki, Finland; and agrant from the University of Kuopio, Kuopio, Finland.
2 To whom correspondence and reprint requests should beaddressed at Department of Public Health and General Practice,University of Kuopio, P.O. Box 1627, FIN-70211 Kuopio, Finland.Fax: 1358-17-162937. E-mail: [email protected].
165
Key Words: blood pressure; body mass index; salt con-sumption.
INTRODUCTION
Due to the development of modernization, the diseasepattern in the People’s Republic of China has changednotably during recent years. Coronary heart diseaseand stroke have become the most important causes ofdeath. In 1984, a community-based program for preven-tion of noncommunicable chronic diseases, especiallystroke, coronary heart disease, and cancer, through life-style and risk factor changes was initiated in Tianjin,the third largest city in China [1–3]. This is the firsteffort to identify ways to avoid the increases in cardio-vascular diseases and cancer in China [4].
Hypertension, as one of the main cardiovascular riskfactors, has become a major public health problem inTianjin [3] where the prevalence of hypertension is oneof the highest in China [1]. In the prevention strategy,hypertension has been one of the main targets of theintervention. Systematic efforts to control and preventhigh blood pressure at the community level werelaunched in the intervention areas in Tianjin in 1989.Intervention focused on reduction of salt intake, controlof body weight in the community, and appropriate ther-apy with antihypertensive medications for the hyper-tensive patients [3,5]. A very high salt consumption hasbeen identified in Tianjin in local [6–10], national [11],and international studies [12]. INTERSALT study, sofar, is the biggest international epidemiological study ofthe relationship between salt intake and blood pressure(BP), which simultaneously studied 52 populations in
32 countries. Tianjin, as one of the three centers inChina involved in the INTERSALT study, has the high-est recorded sodium excretion among all the 52 centers,as well as the highest body mass index (BMI), mean0091-7435/99 $30.00Copyright q 1999 by American Health Foundation and Academic Press
All rights of reproduction in any form reserved.

T
166 YU Eblood pressure, and percentage of hypertensives in thethree Chinese centers [12].
In order to evaluate the program and to monitor thetrends, two independent cross-sectional population sur-veys and a salt surveillance were carried out. A baselinesurvey took place in 1989 and another risk factor surveywas conducted in 1996. The salt surveillance systemwas implemented annually four times during 1992 to1996 with the exception of the year 1995. All the abovesurveys were carried out in the intervention areas ofTianjin. The main aims of the surveys were to assessthe levels of risk factors related to cardiovascular dis-eases and cancer and to monitor the trends in behav-ioral risk factors and salt consumption. To our knowl-edge, there are little data reporting the long-term
trends in BP, BMI, and salt consumption either in Chinaor in other developing countries. The purpose of thisstudy was to analyze the changes in BP and the twokey factors related to BP, BMI, and salt consumptionover the 7-year period.MATERIALS AND METHODS
Altogether seven Non-Communicable Diseases Inter-vention Areas, with the target population of 200,000,are included in the intervention program in urban Tian-jin. All the measurements were done by public healthworkers from the health centers of the Non-Communi-cable Diseases Intervention Areas. All the investigatorswere intensively trained before the fieldwork.
Population Survey
The two independent cross-sectional population sur-
25–34 1,086 1,10535–44 1,098 1,08945–54 1,094 1,09355–64 616 684Total 5,003 5,049
AL.
area. The 1989 survey had a sample of 15,300 peopleand the 1996 survey consisted of 2,000 people. The sam-ples were stratified according to the WHO MONICAprotocol [13] so that at least 200 subjects of each genderand 10-year age group were chosen for each survey. Theage range was 15–64 years in the 1989 survey and15–69 years (the age range of the eldest age group was55–69 years) in the 1996 survey; the common age rangeof the two surveys was 15–64 years. The sample wasdrawn randomly by gender and 10-year age group ineach of the seven areas; the sample size of each area wasalmost equal. Totally, there were 14,046 participants in1989 and 2,000 participants in 1996; the response rateswere 92 and 100% of the two surveys, respectively. Inorder to compare the results of the survey conductedin 1989 with those obtained in 1996, participants whowere older than 65 years of age in the 1996 survey wereexcluded from this study. A subsample with a similarsample structure to that of 1996 after excluding thosewho were older than 65 years of age, with the commonage range of 15–64 years, was drawn randomly fromthe sample in 1989 by the SPSS program (Table 1).
BP was measured from the right arm using a stan-dard mercury sphygmomanometer, after 5 min of rest,with the subject in the sitting position. The fifth-phaseKorotkoff sounds were recorded as the diastolic pres-sure. Following the WHO MONICA methodology, BPwas measured twice and the mean value of the two BPmeasurements was used for the analysis. Hypertensionwas defined as systolic blood pressure (SBP) $160 mmHg and/or diastolic blood pressure (DBP) $95 mm Hg.
Height and weight measurements were taken usinga stadiometer and beam balance scale with subjects wearing usual light indoor clothing without shoes.veys were conducted in the intervention area in 1989Height and weight were measured twice and the meanand in 1996. For both surveys, an independent randomsample was drawn from the population register in the values of the readings were used for the analysis.
TABLE 1
Sample Structures by Gender, Age, and Year in Two Population Surveys and in This Study: The Tianjin Project, Tianjin, China
The 1989 survey The 1996 survey
Age group (years) Men Women Age group (years) Men Women
15–24 1,346 1,333 15–24 200 19825–34 1,474 1,473 25–34 203 20135–44 1,399 1,391 35–44 202 20345–54 1,360 1,402 45–54 197 19655–64 1,391 1,478 55–69 205 195Total 6,969 7,077 Total 1,007 993
Study sample15–24 1,109 1,078 200 198
203 201202 203197 196120 117922 915

N
mean SBP, DBP, or BMI among the same age groups
CHANGES IN BP, BMI, A
BMI was calculated by dividing the subject’s weightby the square of the height (kg/m2). Overweight andobese were defined as 25 # BMI , 30 and BMI $30, respectively.
Salt Surveillance
Four salt consumption surveys (in 1992, 1993, 1994,and 1996) using the same method were conducted inthe intervention areas. A separate random sample ineach survey was drawn with the method of two-stagesampling; first, five resident streets were drawn ran-domly from each of the seven intervention areas; sec-ond, 10 households were drawn randomly from each ofthe resident streets. Fifty households was the sampleof each of the seven intervention areas; a total of 350households were thus selected in each of the surveys.The number of the households and response rates inthe salt surveys are presented in Table 2.
The salt consumption was assessed by weighing 7-day salt and soy sauce consumption with personal re-cords. Standardized weighing scales of 5 kg (accurateto 0.01 kg) were used for weighing salt and soy sauceincluding their containers because the weight range ofthe salt or soy sauce with their containers was usuallyfrom 1 to 4 kg. The survey started with measuring theweight of salt and soy sauce with their containers aftersupper before the first day of the surveillance. The pub-lic health workers followed-up the households after sup-per during the next day to record the age, gender, andlabor intensity of the persons who had consumed thesalt and/or the soy sauce in home and the new salt and/or soy sauce bought during the surveillance period. Thetotal consumption of each household was calculated as(inventory 1 new purchase) 2 remainder.
Individuals of different age, gender, and labor inten-sity have the different recommended energy allowance[14]. The recommended energy allowance of the adultmales aged 18–45 years who do the lightest labor inten-sity, which is 2,400 kcal/day/per capita, was selected
as the standard. The labor intensity was defined in1993 345 991994 345 991996 341 97
Total 1,373 98
D SALT CONSUMPTION 167
recommended energy allowance by the standard recom-mended energy allowance. Based on the results of sev-eral nutrition surveys conducted in Tianjin, the people’saverage energy proportion from three meals consumedeach day in the urban area in Tianjin is 0.2:0.4:0.4(breakfast:lunch:supper) [7,8,11]. Therefore, the indi-vidual’s total person days could be calculated by howmany times he/she ate the salt and/or soy sauce at homeand which meal he consumed. For instance, if a personate salt and soy sauce at home only at supper duringthe investigation period, his total person days were then0.4 3 7 5 2.8. The individual’s total person days werethen adjusted to the standard person days by takinginto account his/her energy coefficient. The average saltor soy sauce consumption was calculated by dividingthe total salt or soy sauce consumption by the totalstandard person days. The total salt consumption wascalculated as the consumption of cooking salt plussodium chloride from soy sauce [9].
The data were analyzed with the SPSS program inthe National Public Health Institute, Finland. The dif-ferences in the mean values of BP, BMI, and salt con-sumption among either between the study years or be-tween age groups were tested by analysis of variance(ANOVA). Scheffe’s test was used for comparisons of
women, the prevalence of hypertension declined among
accordance with the definition of nutrition fascicle of“Chinese Medical Encyclopedia” [15]. The individual’senergy coefficient was calculated by dividing his/her
TABLE 2
The Number of Households and Response Rates by Year in SaltSurveillance: The Tianjin Project, Tianjin, China
Year Number of households Response rates (%)
1992 342 98
between the 2 study years. Differences in the proportionof hypertension and individuals who were overweightor obese among either the years or age groups weretested by the loglinear model.
RESULTS
Blood Pressure
From 1989 to 1996, mean values of SBP decreasedsignificantly in women but remained unchanged inmen. SBP fell in men aged 15–24 and 45–64 years andincreased in those aged 25–44 years. In women, SBPdecreased in people aged 35–64 years and increased inthose aged 15–34 years. The mean DBP increased inboth genders from 1989 to 1996. Tested by Scheffe’stest, only the difference of DBP in women aged 25–34years was found to be statistically significant betweenthe 2 study years. For SBP and DBP, a significant in-crease with age was seen in both surveys for both gen-ders (Tables 3 and 4).
The prevalence of hypertension fell from 11 to 9% inmen and 9 to 7% in women from 1989 to 1996. Thedecline was statistically significant. In men, the preva-lence of hypertension fell among all age groups; thegreatest decrease was in those aged 35–64 years. In
those aged 35–64 years, the greatest decrease beingfound in people aged 45–64 years. Prevalence of hyper-tension was also positively associated with age in bothgenders (Table 5).

Year 3 age group *** ***
Note. ns, not significant.a P values for Scheffe’s test.
* P , 0.05.** P , 0.01.
*** P , 0.001.
Body Mass Index
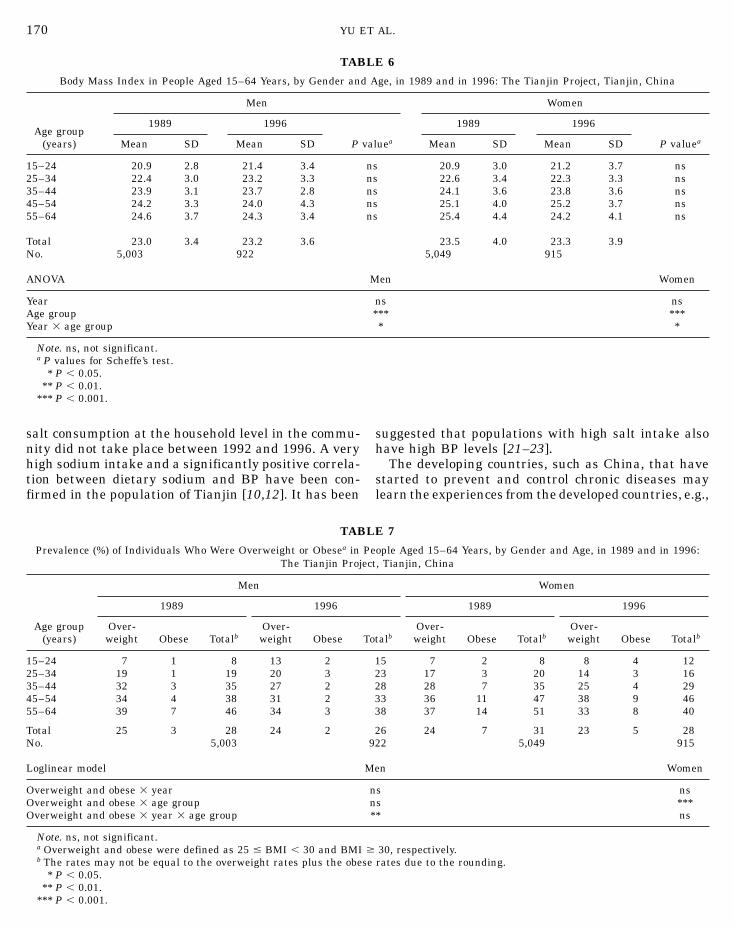
As a whole, BMI remained unchanged from 1989 to1996 in both genders. Comparing with the values from1989, BMI was lower in men aged 35–64 years and inwomen aged 25–44 and 55–64 years and was higherin men aged 15–34 years and in women aged 15–24and 45–54 years in 1996. However, no statistical signifi-cance was detected by Scheffe’s test applied for boththe decrease and the increase between the 2 studyyears. The mean values of BMI were positively associ-ated with age in both genders (Table 6).
The percentages of individuals who were overweightor obese fell by 1% in men and by 3% in women from1989 to 1996. However, the decline was marginally sig-nificant (P 5 0.06) in women only. In men, the propor-tion of individuals who were overweight or obese fellin people aged 35–64 years and increased in those aged15–34 years. For women, there was a positive relation-ship between age and the prevalence of individuals whowere overweight or obese (Table 7).
Salt Consumption
168 YU ET AL.
TABLE 3
Systolic Blood Pressure in People Aged 15–64 Years, by Gender and Age, in 1989 and in 1996 (mm Hg):The Tianjin Project, Tianjin, China
Men Women
1989 1996 1989 1996
Age group (years) Mean SD Mean SD P valuea Mean SD Mean SD P valuea
15–24 118 13 117 12 ns 108 11 109 12 ns25–34 119 14 121 11 ns 110 13 113 13 ns35–44 124 16 125 13 ns 119 17 117 15 ns45–54 132 21 129 18 ns 132 24 128 20 ns55–64 142 23 137 21 ns 142 25 137 22 ns
Total 125 19 125 16 121 22 119 19No. 5,003 922 5,049 915
ANOVA Men Women
Year ns *Age group *** ***
There were no changes in cooking salt, salt from soysauce, and total salt consumption from 1992 to 1996(Table 8). The consumption of total salt and cookingsalt were high and they remained virtually unchangedduring the 5 years, although the consumption of saltfrom soy sauce increased marginally.
DISCUSSION
The Chinese diet is quite different from the Westerndiet. The discretionary use of salt and soy sauce provide53 and 16% of the total sodium intake; only 17% of thetotal sodium intake comes from the processed foods inthe urban area of Tianjin [9]. In contrast, sodium fromprocessed foods represents over 50, 66, and 77% in theFinnish, British, and American diets, respectively [16–20]. The community-based intervention launched in Ti-anjin emphasized salt reduction, especially on the skillsneeded to reduce salt and soy sauce added during cook-ing [5]. Thus for the salt surveillance, salt and soy saucewere selected as the surveillance indicators excludingother foods which contained sodium. We used salt andsoy sauce weighing with personal records of 7 consecu-tive days to assess the salt consumption. Although theresults did not account for the entire sodium intake,assessments used in the surveillance did make it possi-ble to evaluate the changes in salt consumption duringthe study period at the house level. The duration ofthe measurement was 7 consecutive days including theweekend; thus it represented the usual salt consump-
tion more adequately than a single 24-h or a 3-dayfood records.Our results show that the prevalence of hypertensionand obesity decreased significantly among people aged45–64 years in both genders from 1989 to 1996. Meansystolic blood pressure decreased significantly in

Year 3 age group ns ns
Note. ns, not significant.a P values for Scheffe’s test.
* P , 0.05.** P , 0.01.
*** P , 0.001.
Hypertension 3 year 3 age group ns ns
Note. ns, not significant.a SBP $160 mm Hg and/or DBP $95 mm Hg.
* P , 0.05.** P , 0.01.
*** P , 0.001.
in both genders. There were no changes in salt con-sumption between 1992 and 1996 at the house level.
A community-based intervention aiming at control ofhigh BP through reduction of salt intake and controlof body weight among the entire population had beenimplemented from 1989 to 1992 in the interventionareas in Tianjin [5]. Favorable changes have been seenafter the 3-year intervention. The total dietary sodiumintake and SBP have decreased by 6% and 3 mm Hg,respectively [5]. From then on, the antihypertensiveactivities inherent in the program have become part ofthe major routine intervention carried out by the Tian-jin Project. These activities include regular follow-up ofhypertensive patients for guidance on antihypertensivetherapy and modification of unhealthy lifestyles; an-nual measurement of BP in those above 35 years fordetecting the patients and monitoring the change inBP level among the population and providing healtheducation for the population [3]. These efforts may con-tribute to the improvement in the prevalence of hyper-tension and obesity among people in older age groupsover the study period.
From 1989 to 1992 sodium intake was measured by
CHANGES IN BP, BMI, AND SALT CONSUMPTION 169
TABLE 4
Diastolic Blood Pressure in People Aged 15–64 Years, by Gender and Age, in 1989 and in 1996 (mm Hg):The Tianjin Project, Tianjin, China
men Women
1989 1996 1989 1996
Age group (years) Mean SD Mean SD P valuea Mean SD Mean SD P valuea
15–24 74 9 76 7 ns 69 8 72 8 ns25–34 76 10 79 8 ns 71 9 74 9 *35–44 80 11 81 10 ns 76 11 77 10 ns45–54 83 12 83 10 ns 81 12 82 12 ns55–64 86 13 85 11 ns 82 13 84 11 ns
Total 79 12 80 10 75 12 77 11No. 5,003 922 5,049 915
ANOVA Men Women
Year * ***Age group *** ***
women and leveled off in men. Diastolic blood pressureincreased significantly. Body mass index remained un-changed. The unfavorable trends were mainly attribut-able to the negative changes in those aged 15–34 years
TABLE 5
Prevalence (%) of Hypertensiona in People Aged 15–64 Years, byGender and Age, in 1989 and in 1996: The Tianjin Project,
Tianjin, China
Men WomenAge group
(years) 1989 1996 1989 1996
15–24 2 1 0 025–34 4 3 1 135–44 10 7 6 545–54 19 15 18 1455–64 29 20 27 18
Total 11 9 9 7No. 5,003 922 5,049 915
Loglinear model Men Women
Hypertension 3 year * *Hypertension 3 age group *** ***
24-h urinary sodium excretion with 3-day food records[5,6,10]. Also since 1992 the salt surveillance systemwas established and carried out four times. Due to thedifferent methodology, we can only assume that theintakes of salt in 1992 were at the same level. Theresults of the salt surveillance showed that changes in
Note. ns, not significant.a P values for Scheffe’s test.
* P , 0.05.** P , 0.01.
*** P , 0.001.
salt consumption at the household level in the commu-
Note. ns, not significant.a Overweight and obese were defined as 25 # BMI , 30 and BMI $b The rates may not be equal to the overweight rates plus the obese
* P , 0.05.** P , 0.01.
*** P , 0.001.
170 YU ET AL.
TABLE 6
Body Mass Index in People Aged 15–64 Years, by Gender and Age, in 1989 and in 1996: The Tianjin Project, Tianjin, China
Men Women
1989 1996 1989 1996Age group
(years) Mean SD Mean SD P valuea Mean SD Mean SD P valuea
15–24 20.9 2.8 21.4 3.4 ns 20.9 3.0 21.2 3.7 ns25–34 22.4 3.0 23.2 3.3 ns 22.6 3.4 22.3 3.3 ns35–44 23.9 3.1 23.7 2.8 ns 24.1 3.6 23.8 3.6 ns45–54 24.2 3.3 24.0 4.3 ns 25.1 4.0 25.2 3.7 ns55–64 24.6 3.7 24.3 3.4 ns 25.4 4.4 24.2 4.1 ns
Total 23.0 3.4 23.2 3.6 23.5 4.0 23.3 3.9No. 5,003 922 5,049 915
ANOVA Men Women
Year ns nsAge group *** ***Year 3 age group * *
suggested that populations with high salt intake also
have high BP levels [21–23].nity did not take place between 1992 and 1996. A veryhigh sodium intake and a significantly positive correla- The developing countries, such as China, that havestarted to prevent and control chronic diseases maytion between dietary sodium and BP have been con-
firmed in the population of Tianjin [10,12]. It has been learn the experiences from the developed countries, e.g.,
TABLE 7
Prevalence (%) of Individuals Who Were Overweight or Obesea in People Aged 15–64 Years, by Gender and Age, in 1989 and in 1996:The Tianjin Project, Tianjin, China
Men Women
1989 1996 1989 1996
Age group Over- Over- Over- Over-(years) weight Obese Totalb weight Obese Totalb weight Obese Totalb weight Obese Totalb
15–24 7 1 8 13 2 15 7 2 8 8 4 1225–34 19 1 19 20 3 23 17 3 20 14 3 1635–44 32 3 35 27 2 28 28 7 35 25 4 2945–54 34 4 38 31 2 33 36 11 47 38 9 4655–64 39 7 46 34 3 38 37 14 51 33 8 40
Total 25 3 28 24 2 26 24 7 31 23 5 28No. 5,003 922 5,049 915
Loglinear model Men Women
Overweight and obese 3 year ns nsOverweight and obese 3 age group ns ***Overweight and obese 3 year 3 age group ** ns
30, respectively.rates due to the rounding.

N
Note. ns, not significant.a
Number of households.* P , 0.05.** P , 0.01.
*** P , 0.001.
Finland, where great successes in prevention and con-trol of cardiovascular diseases have been achieved [24–26]. From 1979 to 1982, the first community-based in-tervention program to reduce salt consumption wascarried out in Finland after assessment of salt intake[27]. The intervention, which aimed at reducing highsalt intake in North Karelia, was implemented as partof activities in primary health care and general healtheducation of the population. The results showed thatchanges in salt intake and BP were not so optimisticduring the initial stage [25,28]. The significant down-ward trends in salt intake paralleled with BP havetaken place in the past 10 years in North Karelia. Di-etary salt intake declined by 16–20%; SBP and DBPfell by 4.8 and 8.1% in men and 11.3 and 13.9% inwomen, respectively [24–26]. The small reduction ofsalt intake during the initial stage is interpreted asbeing partly due to insufficient environmentalchanges [24,29].
It is obvious that the food industry is in a key positionin Finland, because over 50% of the salt in the Finnishdiet is added by food manufacturers and in catering[27]. Hence, environmental changes, such as a law tominimize the salt content of processed foods, is as im-portant as the health education [24]. The Tianjinese
diet is quite different from the Finnish diet. Discretion-ary use of salt and soy sauce provide 69% of total sodiumintake in the urban area. Hence, further intensivehealth education especially emphasizing the ways toreduce salt and soy sauce use during cooking is moreD SALT CONSUMPTION 171
important than the environmental changes, eventhough these too are necessary.
The very important findings of the INTERSALTstudy are that sodium intake, BMI, and alcohol con-sumption in individuals are strongly and independentlyrelated to BP [21–23,30,31]. A local study [10] showsthat no significant association is found between BP andalcohol intake in the population of Tianjin. This canpartly explained by the less alcohol consumption in thispopulation than those in western populations [8,10].Over the study period, we found the similar divergenttrends in SBP and BMI in both genders, with SBP andBMI increasing in younger age groups and decreasingin older age groups. Prevalence of individuals who wereoverweight or obese increased among men in the agegroup of 15–24 years and decreased among those inthe age group of 35–64 years. However, the consistentcoincidence of the change in SBP, BMI, prevalence ofhypertension, and individuals who were overweight orobese was observed among people in the older age group(men in the age group of 45–64 years and women inthe age group of 55–64 years). Several studies havereported that in both adolescents and adults, the corre-lation between BP and weight are highly significant[21–23,30] and in longitudinal studies [23], the changein BP over time is correlated with the change in weight.Although further studies are needed, the coincidenceoccurring in the older people may indicate that whenthe salt consumption remained at a level, the changein BP among those in the older age group in the studypopulation might be related to the changes in otherfactors which are associated with BP, particularly tothose in BMI.
The Tianjin Project is a national pilot of preventionand control for chronic disease by implementing thecommunity-based intervention program in China. Overthe 7-year study period, we observed a favorable devel-opment in prevalence of hypertension and obesityamong the people aged 45–64 years in the study popula-tion. However, the changes in BP, BMI, and salt con-sumption in the community seem relatively slow. Thesmall changes in DBP and BMI are mainly due to thenegative changes among people in the age group of15–34 years. We conclude that influencing obesity andsalt consumption at the community level in presentChina is a challenging task. During the early years ofintervention, the major reduction was only observed inthe older people; hence further intensive research andmultifactoral intervention approaches are solelyneeded. The mean values of SBP, DBP, and BMI as wellas the prevalence of hypertension and obesity among
CHANGES IN BP, BMI, A
TABLE 8
Cooking Salt, Salt from Soy Sauce, and Total Salt Consumptionin the Population of the Tianjin Project from 1992 to 1996
(g/Standard Person Day), Tianjin, China
Salt fromCooking salt soy sauce Total salt
Year Mean SD Mean SD Mean SD
1992 10.5 5.5 2.0 1.7 12.5 6.01993 10.7 5.4 2.0 1.7 12.8 5.91994 9.8 4.7 2.2 1.8 12.0 5.31996 10.3 4.4 2.3 1.8 12.6 5.1
Total 10.4 5.0 2.1 1.8 12.5 5.6No.a 1,373 1,373 1,373
ANOVA
Cooking salt nsSalt from soy sauce nsTotal salt ns
the population of Tianjin are positively associated withage. The increases of BP and BMI in the young peoplewarrant that further health education and health pro-motion should pay more attention to them because theyrepresent the future of the country.

27. Pietinen P, Tanskanen A, Nissinen A, Tuomilehto J, Puska P.
172 YU ET
ACKNOWLEDGMENTS
The authors thank all co-workers who contributed to the TianjinProject.
REFERENCES
1. Tianjin Public Health Bureau, China. Strategies on chronic dis-eases prevention and control in China: technical reports on theTianjin Project. Tianjin: Tianjin Public Health Bureau, 1991.[in Chinese]
2. Tianjin Public Health Bureau, China. A brief introduction toTianjin Four Diseases program: 1984 to 1992. Tianjin: PublicHealth Bureau, 1993. [in Chinese]
3. Tianjin Public Health Bureau, China. Ten-year achievement ofTianjin NCD prevention and control. Tianjin: Public Health Bu-reau, 1994.
4. Vartiainen E, Du DJ, Marks JS, Korhonen H, Geng GY, Guo ZY,et al. Mortality, cardiovascular risk factors and diet in China,Finland, and the United States. Pub Health Rep 1991;5:59–67.
5. Tian HG, Guo ZY, Hu G, Yu SJ, Sun W, Pietinen P. Changes insodium intake and blood pressure in a community-based inter-vention project in China. J Hum Hypertens 1995;9:959–68.
6. Tian HG, Hu G, Dong QN, Yang XL, Nan Y. Dietary sodium andpotassium, socioeconomic status and blood pressure in a Chinesepopulation. Appetite 1996;6:235–46.
7. Wang DS, Xu GC, Wang ZL, Chu SP, Ren DL, Muo JX, et al.Results of nutrition survey from 1986–1988 in Tianjin. Tianjin:Academic Press, 1988. [in Chinese]
8. Tian HG, Nan Y, Hu G, Dong QN, Yang XL, Pietinen P, et al.Dietary survey in a Chinese population. Eur J Clin Nutr 1995;49:26–32.
9. Nan Y, Tian HG, Shao RC, Hu G, Dong QN, Pietinen P, et al.Assessment of sodium and potassium in processed foods in an
urban area in China. Eur J Clin Nutr 1995;49:299–306.10. Tian HG, Nan Y, Shao RC, Dong QN, Hu G, Pietinen P., etal. Associations between blood pressure and dietary intake andurinary excretion of electrolytes in a Chinese population. J Hyp-ertens 1995;13:49–56.
11. Chinese Academy of Preventive Medicine. Report on a nationalnutrition survey in 1982. Beijing: Preventive Medicine Press,1986. [in Chinese]
12. Stamler R, Liu LS, Nichols R, Huang DX, Long ZP, Xie JX, etal. Blood pressure and life style in the People’s Republic of China:three samples in the INTERSALT study. J Hum Hypertens1993;7:429–35.
13. WHO MONICA Project (prepared by Tunstall-Pedoe H.). TheWorld Health Organization MONICA project (monitoring trendsand determinants in cardiovascular disease): major internationalcollaboration. J Clin Epidemiol 1988;41:105–14.
14. National Nutrition Association. Recommended dietary allow-ances. Beijing: Public Health Press, 1988. [in Chinese]
AL.
15. Chinese Medical Encyclopedia, Nutrition Fascicle. Beijing: Pub-lic Health Press, 1988. [in Chinese]
16. Pietinen P. Estimating sodium intake from food consumptiondata. Ann Nutr Metab 1982;26:90–9.
17. Kesteloot H, Joossens JV. The relationship between dietary in-take and urinary excretion of sodium, potassium, calcium andmagnesium: Belgian Interuniversity Research on Nutrition andHealth. J Hum Hypertens 1990;4:527–33.
18. Bull NL, Buss DH. Contributions of foods to sodium intake. ProcNutr Soc 1980a;39:30A.
19. Edward DG, Kaye AE, Druce E. Source and intakes of sodiumin the United Kingdom diet. Eur J Clin Nutr 1989;43:855–61.
20. Mattes RD, Donnelly D. Relative contributions of dietary sodiumsource. J Am Coll Nutr 1991;10:383–93.
21. Stamler R. Implications of the INTERSALT study. Hypertension1991;17(Suppl I):I16–20.
22. Stamler J, Rose G, Elliott P, Dyer A, Marmot M, Kesteloot H.Findings of the international cooperative INTERSALT study. Hy-pertension 1991;17(Suppl I):I9–15.
23. Kotchen TA, Kotchen JM, Boegehold MA. Nutrition and hyper-tension prevention. Hypertension 1991;18(Suppl I):I115–20.
24. Pietinen P, Vartiainen E, Seppa¨nen R, Aro A, Puska P. Changes
in diet in Finland from 1972 to 1992: impact on coronary heartdisease risk. Prev Med 1996;25:243–50.
25. Vartiainen E, Puska P, Jousilahti P, Korhonen HJ, TuomilehtoJ, Nissinen A. Twenty-year trends in coronary risk factors inNorth Karelia and in other areas of Finland. Int J Epidemiol1994;23:495–504.
26. Vartiainen E, Puska P, Pekkanen J, Tuomilehto J, JousilahtiP. Changes in risk factors explain changes in mortality fromischaemic heart disease in Finland. BMJ 1994;309:23–7.
Changes in dietary habits and knowledge concerning salt duringa community-based prevention program for hypertension. AnnClin Res 1984;16(Suppl 53):150–5.
28. Tuomilehto J, Pietinen P, Uusitalo U, Korhonen H, Nissinen A.Changes in sodium and potassium intake in Finland during the1980’s. In: Yamori Y, Strsser T, editors. New horizons in pre-venting cardiovascular diseases. Amsterdam: Elsevier, 1989:229–39.
29. Pietinen P, Vartiainen E, Korhonen HJ, Kartovaara L, UusitaloU, Tuomilehto J, Puska P. Nutrition as a component in commu-nity control cardiovascular disease (the North Karelia Project).Am J Clin Nutr 1989;49:1017–24.
30. Dyer AR, Elliott P. The INTERSALT study: relations of bodymass index to blood pressure—INTERSALT Co-operative. J HumHypertens 1989;3:299–308.
31. Slater E, Dusta H, Grimm J. Rh, Kotchen T, Landsberg L, Mccar-ron D, et al. Workshop: metabolic and nutritional factors in hyper-tension. Hypertension 1991;18(Suppl I):I121–5.