champaign community unit school district #4 district...
TRANSCRIPT

Champaign Community Unit School District #4
District Financial Presentation
Tier II Committee Meeting
June 2, 2016

Presentation Outline
• Overview of Current District Financial Position
• Detail of Considerations Impacting Financial Planning
• Review District Use of County School Facility Occupation Tax (1%)
• Discussion of Financing Options to Address District Facility Needs

District Financial Position - Overview
• Overall District Budget (FY 2016) – $147.0MM
• District Operating Budget (FY 2016) – $112.7MM
• Current District Tax Rate: 4.4117
• Current District EAV: $1.962BB
• District Fund Balance (July 1, 2015): $86.3MM

District Financial Position – Primary Revenue Sources
• Primary Local Sources
• Property Tax Extension
• 1% School Facility Occupation Tax
• Corporate Personal Property Replacement Tax
• Food Service Payments
• Registration Fees
• Primary State Sources
• General State Aid
• Categorical Payments for Special Education
• Categorical Payments for Transportation
• Primary Federal Sources
• Title Grants
• Breakfast and Lunch Programs
• Build American Bonds Reimbursements

Local77%
State14%
Federal9%
FY 2016 Budget - Total Revenues by Source

76%
7%
7%
5%3%
1%0% 1%
0%
FY 2016 Budget - Total Revenues by FundEducation O & M Debt Service Transportation IMRF/SS Capital Projects Working Cash Tort Fire Prevention & Safety
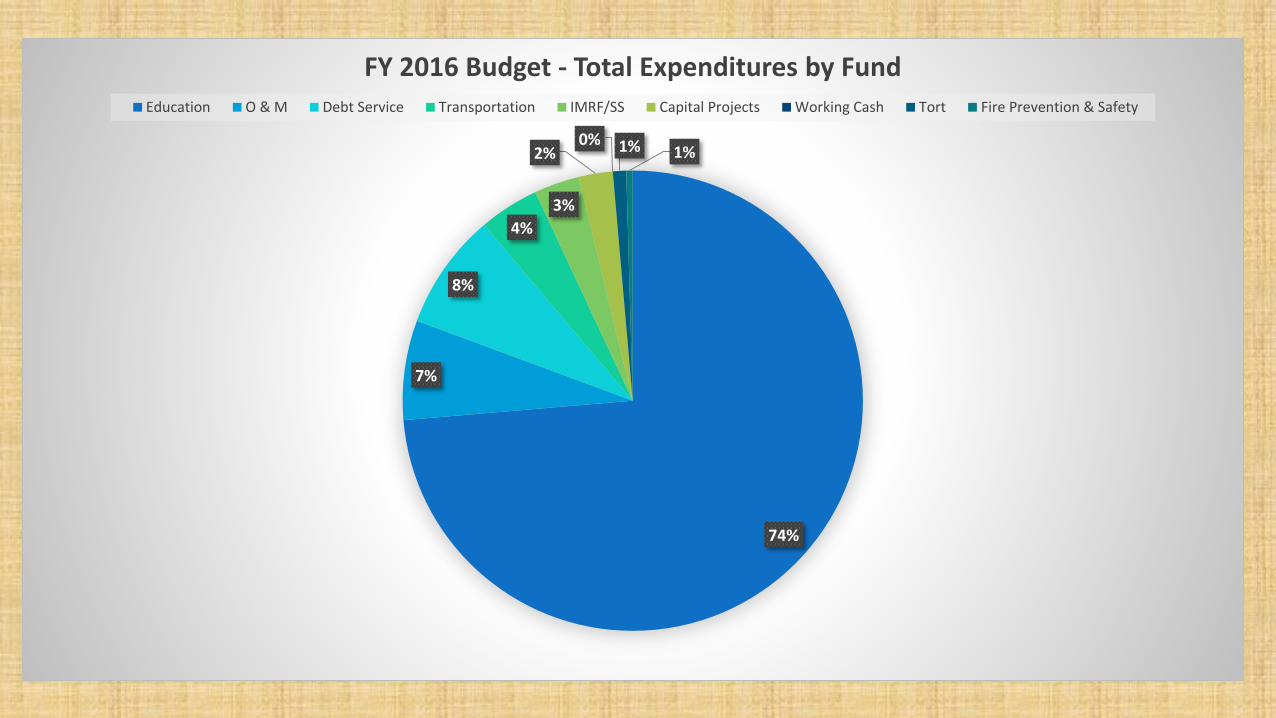
74%
7%
8%
4%
3%
2%0% 1% 1%
FY 2016 Budget - Total Expenditures by FundEducation O & M Debt Service Transportation IMRF/SS Capital Projects Working Cash Tort Fire Prevention & Safety

61%18%
10%
7%
1%
3%
FY 2016 Budget - Total Expenditures by ObjectSalaries Employee Benefits Purchased Services Supplies & Materials Capital Outlay Other

56%
16%
10%
6%
1% 11%
FY 2016 Budget - Total Expenditures by Object (including Debt Service)Salaries Employee Benefits Purchased Services Supplies & Materials Capital Outlay Other

District Financial Position –ISBE Financial Profile Designation
• Illinois State Board of Education Rating System Considers Several Factors• Fund Balance to Revenue Ratio
• Expenditures to Revenue Ratio
• Days Cash on Hand
• Percent of Short-Term Borrowing Maximum Remaining
• Percent of Long-Term Debt Margin Remaining
• District Has Received the Highest Designation – Recognition

District Financial Position - Statutory Debt Limit
• Established by Illinois School Code (105 ILCS 5/19-1)
• Amounts to 13.8% of a District’s Equalized Assessed Value
• Existing Debt Attributable to the Limitation
• Current District Statutory Debt Limit Margin - $257,546,551

Financial Planning Considerations –General State Aid Payments
• State Superintendent Proposal to Recalibrate Formula
• Stagnant Foundation Level
• Proration
• Competing Education Funding Bills

Senate Bill 231 Impact Comparison –Peer Downstate Districts
With SB 231 Protections Without SB 231 Protections
School District Enrollment % A-A/Hisp. %ELL % Low Inc. PSA Total Under SB231 FY15 FY15/Student SB231 Aid/Student $Δ FY15 SB231 Aid/Student $Δ FY15
Champaign CUSD 4 8,617 44.6% 8.0% 57.9% $1,744,811.12 $12,695,055.81 $12,695,055.81 $1,473.26 $1,473.26 $0.00 $202.48 ($1,270.77)
McLean County USD 5 12,783 18.2% 4.1% 32.7% $11,387,410.83 $19,548,208.29 $19,548,208.29 $1,529.23 $1,529.23 $0.00 $890.82 ($638.41)
Bloomington SD 87 5,067 36.5% 6.2% 58.0% $5,372,702.68 $7,277,506.57 $7,277,508.67 $1,436.26 $1,436.26 ($0.00) $1,060.33 ($375.92)
Urbana SD 116 3,709 48.3% 11.3% 72.5% $7,773,517.53 $8,033,677.32 $8,033,677.33 $2,166.00 $2,166.00 ($0.00) $2,095.85 ($70.14)
Danville CCSD 118 5,491 48.1% 2.7% 81.4% $31,656,259.83 $31,656,259.83 $28,837,205.90 $5,251.72 $5,765.12 $513.40 $5,765.12 $513.40
Springfield SD 186 13,537 41.9% 1.0% 67.1% $44,873,452.40 $44,873,452.40 $41,465,252.94 $3,063.11 $3,314.87 $251.77 $3,314.87 $251.77
Decatur SD 61 7,839 49.4% 0.9% 75.1% $44,508,688.53 $44,508,688.53 $39,240,340.05 $5,005.78 $5,677.85 $672.07 $5,677.85 $672.07
Peoria SD 150 11,926 66.4% 5.3% 75.4% $54,646,048.98 $54,646,048.98 $49,262,384.80 $4,130.67 $4,582.09 $451.42 $4,582.09 $451.42

Financial Planning Considerations –Other State Action
• Property Tax Freeze
• Pension Cost Shift
• CPPRT Overpayments

Financial Planning Considerations –Ongoing District Facility Projects
• Need for Additional Portable Classrooms to Address Capacity Needs
• 2014 Health Life Safety Survey• Required by State and Monitored by ISBE• Priority A Items Completed• Priority B Items
• Must Be Completed by 2019• $6.8MM in Projects Remaining ($6.3M in Tier II Considered Buildings)
• 10-Year Capital Improvement Plan• Funded Primarily Through Excess Revenues Received from the 1% Sales Tax• Supplemented by Operations & Maintenance and Health Life Safety Funds• Approximately $1.5MM Budgeted Annually for 10-Year Capital Improvement Plan
Projects
• Tier II Committee Final Report Includes Schedule of Health Life Safety and 10-Year Capital Improvement Plan Projects Detailed by Building

County School Facility Occupation Tax -General
• 55 ILCS 5/5-1006.7
• Authorization Procedure
• Collection and Distribution
• Use of Revenues Received
• Other Approving Counties

County School Facility Occupation Tax –Champaign County
• Fall 2008 Election
• Spring 2009 Election
• Approval of Champaign County Board
• Receipt of Sales Tax Revenues

County School Facility Occupation Tax –Champaign Unit 4
• Promises Made by Unit 4 Board of Education
• Issuance of Alternate Revenue Bonds
• Build America Bond Reimbursements

County School Facility Occupation Tax –Champaign Unit 4 Promises
• Projects Accomplished Through 2010 Bond Issue
• Dedication of Excess Funds to 10-Year Capital Improvement Plan Projects
• Promises Made Promises Kept Committee

County School Facility Occupation Tax –Champaign Unit 4 Future Projections
• Capital Projects Fund Balance (Fund 61)
• Projections• 2.3% Annual Growth
• Actual Performance
• 125% Coverage under Local Government Debt Reform Act and Commitment to Funding Capital Improvement Plan with Sales Tax Revenues

Financing Options for AddressingDistrict Facility Needs
• Issue General Obligation Bonds Based Upon Voter Approval of a District Referendum
• Future Access of 1% Sales Tax• Pros
• Cons

Property Tax Impact of General Obligation School Building Bond Options
1 2 3 4 5 6 7 8 9 10
Estimated Equalized Estimated Est. Added Est. Added Estimated Est. Added
Bond Issue
andAssessed Estimated Bond
Taxes for
Bonds
Monthly
TaxesBond Issue School Taxes
Project Value Bond Tax $150,000 $150,000 Tax % Per $1,000 of
Levy
Year
Payment
YearSize (EAV) Levy Rate Home ($) Home ($) Of Total Tax Rate School Taxes ($)
2016 2017 100,000,000 1,962,982,256 6,821,632 0.348 153 13 7.88% $ 79
2016 2017 125,000,000 1,962,982,256 8,524,631 0.434 191 16 9.84% $ 98
2016 2017 150,000,000 1,962,982,256 10,227,336 0.521 229 19 11.81% $ 118
2016 2017 175,000,000 1,962,982,256 11,935,406 0.608 268 22 13.78% $ 138
2016 2017 200,000,000 1,962,982,256 13,638,371 0.695 306 25 15.75% $ 157

Comparison of Levy Year 2015 Tax Rates –Peer Downstate Districts
4.4117
4.6727
5.05835.1588
5.20305.2841 5.2862
5.9828
4.0000
4.2000
4.4000
4.6000
4.8000
5.0000
5.2000
5.4000
5.6000
5.8000
6.0000
Champaign 4 Decatur 61 Normal 5 Bloomington 87 Springfield 186 Peoria 150 Danville 118 Urbana 116
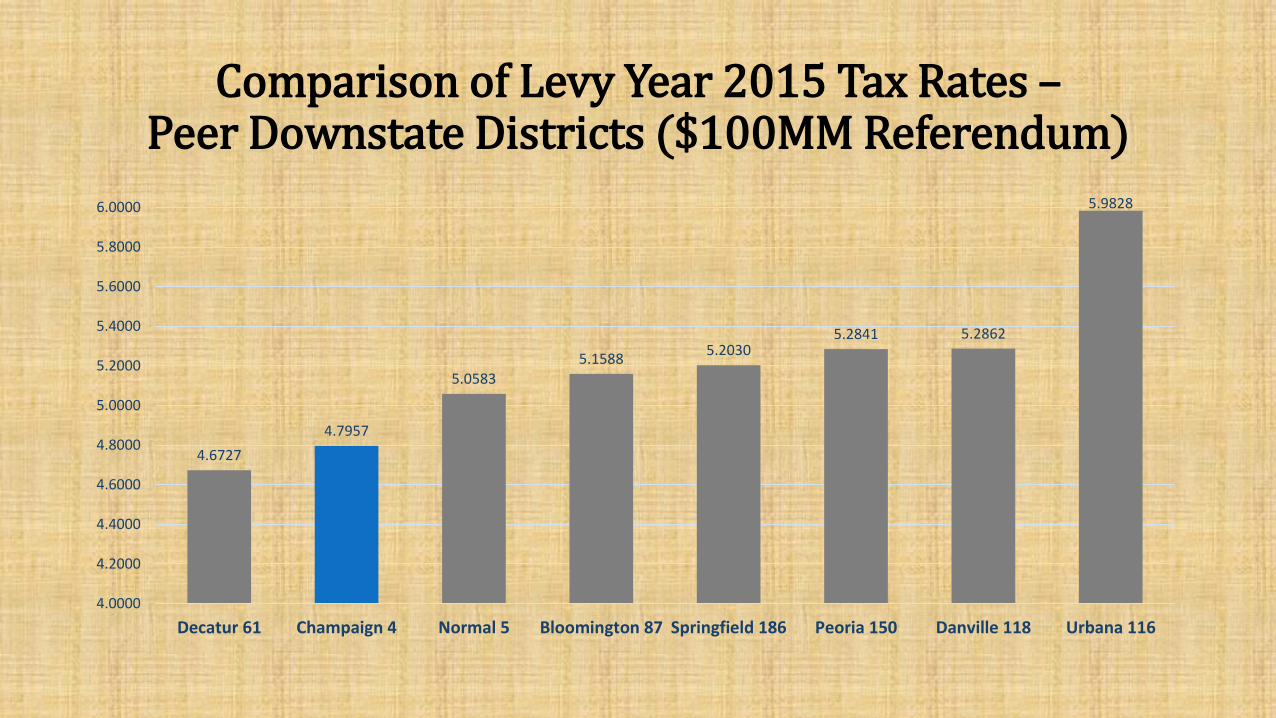
Comparison of Levy Year 2015 Tax Rates –Peer Downstate Districts ($100MM Referendum)
4.6727
4.7957
5.05835.1588
5.20305.2841 5.2862
5.9828
4.0000
4.2000
4.4000
4.6000
4.8000
5.0000
5.2000
5.4000
5.6000
5.8000
6.0000
Decatur 61 Champaign 4 Normal 5 Bloomington 87 Springfield 186 Peoria 150 Danville 118 Urbana 116

Comparison of Levy Year 2015 Tax Rates –Peer Downstate Districts ($150MM Referendum)
4.6727
4.9327
5.05835.1588
5.20305.2841 5.2862
5.9828
4.0000
4.2000
4.4000
4.6000
4.8000
5.0000
5.2000
5.4000
5.6000
5.8000
6.0000
Decatur 61 Champaign 4 Normal 5 Bloomington 87 Springfield 186 Peoria 150 Danville 118 Urbana 116
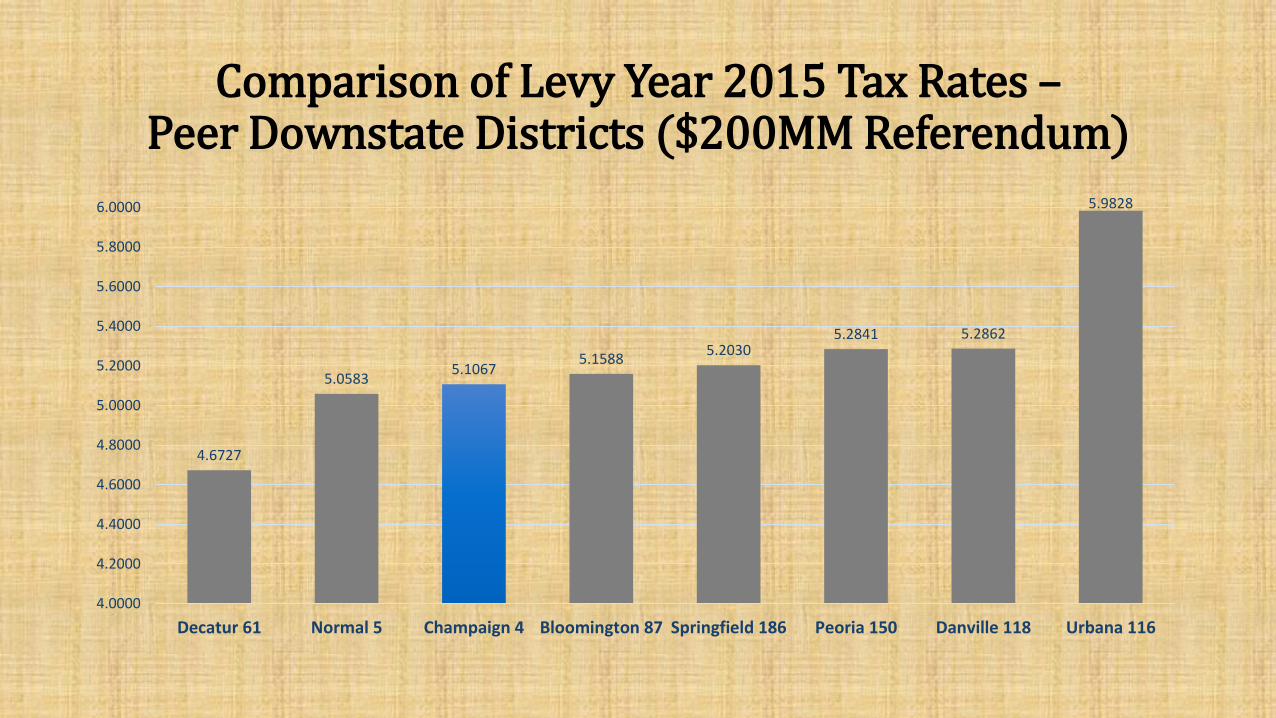
Comparison of Levy Year 2015 Tax Rates –Peer Downstate Districts ($200MM Referendum)
4.6727
5.05835.1067
5.15885.2030
5.2841 5.2862
5.9828
4.0000
4.2000
4.4000
4.6000
4.8000
5.0000
5.2000
5.4000
5.6000
5.8000
6.0000
Decatur 61 Normal 5 Champaign 4 Bloomington 87 Springfield 186 Peoria 150 Danville 118 Urbana 116

Outstanding Long-Term Debt –Downstate Peer Districts
0
20
40
60
80
100
120
140
160
180
Urbana 116 Decatur 61 Champaign 4 Danville 118 Bloomington 87 Springfield 186 Peoria 150 Normal 5
Property Tax Sales Tax

Financing Options for AddressingDistrict Facility Needs
• Refinancing Future Debt
• Other Potential Revenue Options• Issuing Working Cash Bonds (Potentially Subject to Referendum)
• Joint Ventures with Local Government Entities for Shared Use Facilities
• Private Fundraising

QUESTIONS?