challenges confronting regional malls intensify...may 2017 . challenges confronting regional malls...
TRANSCRIPT

May 2017
CHALLENGES CONFRONTING REGIONAL MALLS INTENSIFY Stewart Rubin
Senior Director New York Life Real Estate Investors
Within the spectrum of commercial real estate, no property type is confronting such profound challenges as regional malls. US malls are challenged by: (1A) income stagnation, (1B) income concentration, (2) retail oversupply, and (3) e-commerce. The challenges to US malls are not distributed equally and high-end regional malls such as those with sales in excess of $600/SF and trade areas with high median household income as well as dominant malls (despite lower sales/SF) are well positioned to cope with the pressures. Conversely, these threats are not being met successfully in many demographically and economically challenged parts of the United States. Malls that focus on experiential tenants that cannot be replaced online will be at an advantage. These malls may include discount retailers, theaters, restaurants, fitness centers, unique entertainment venues, and medical outpatient services.
There are 1,035 malls in the United States according to Green Street Advisors, which classifies 337 as being most at risk for closing due to such factors as declining occupancy and sales of $305 per square foot or less. A Green Street Advisors report1, asserted that department store companies need to close as many as 800 more locations — or one-fifth of all anchor space in US malls — to return to the levels of productivity they experienced 10 years ago2. Macy’s identified 68 of the 100 stores that it plans to close, Sears identified 108 Kmart stores and 42 Sears stores that it plans to shutter, and JCPenney announced 138 store closings 3. This follows the closure of 154 U.S. Wal-Mart stores last year and all 450 stores belonging to the bankrupt Sports Authority chain. According to Retail Metrics, department store earnings growth has lagged other retail in every quarter since the start of 2012.
Non-department store retailers that have recently closed or announced closure of a significant amount of stores include The Gap (175 stores), Aeropostale (84), and Finish Line (150). The Limited (250), Kenneth Cole (63), and Bebe (170) announced that they are closing all their physical stores and will focus on e- commerce sales. A recent Deutsche Bank report4 estimates that there is a backlog of upwards of 6,400 net stores that will close over the next several years.
CoStar conducted a study of retail demand and supply trends since 1983 that examined real buying power per square foot through measures of inventory, median household income and household count. The numbers were adjusted for the impact that e-commerce plays in siphoning off retail purchases from physical stores. The analysis concluded that the market would require a 10.7% (a removal of 864 million square feet of retail space) decline in supply at current real buying power and e-commerce levels to achieve equilibrium
An April 2017 Credit Suisse report5 maintains that year-to-date store closings are ahead of the previous peak in 2008 which portends a record breaking year for store closures. We expect further mall and store closings ahead. Malls in metro areas with less than one million people and non-metro areas are most vulnerable to closure. Malls situated in locations with weaker demographics are more reliant on anchor
1 Suzanne Kapner, “Department Stores Need to Cull Hundreds of Sites, Study Says”, The Wall Street Journal, April 24, 2016. 2 According to the article, Sears would have to close about 300 stores (or nearly half of its existing locations), JCPenney would have to close 320 stores (31% of its current fleet), Nordstrom would have to close 30 stores (25% of its fleet), and Macy's would have to close 70 stores (9% of its total) to generate the kind of sales per square foot they experienced in 2006. Overall, department stores' sales per square foot — have dropped 24% to $165 per square foot since 2006, according to the report. The closures could force significantly more shopping malls to shut down. 3The number of Kmart and Sears stores has fallen from about 3,800 a decade ago to 1,430 at the end of the last fiscal year. 4 Matthew Luzzetti, et al, “Cross Sector: Hightail from Retail?”, Deutsche Bank Research, February 7, 2017. 5 Christian Buss, et al, “Domestic Retail Store Closings at Record Pace”, Credit Suisse Equity Research, Retailing, April 6, 2017.
2
stores such as J.C. Penney, Sears and Macy’s and are more exposed to department stores closing and to the fallout that such closures bring6. There is a shortage of feasible replacement tenants. Other tenants in the mall may trigger co-tenancy clauses when anchors vacate, allowing them to pay lower rents or break their leases. Most important the failure of a department store in such an area is likely an indication that the area is not able to support such a mall in the current economic environment.
RETAIL JOBS ARE DECLINING IN CERTAIN AREAS WHILE GAINING IN OTHERS
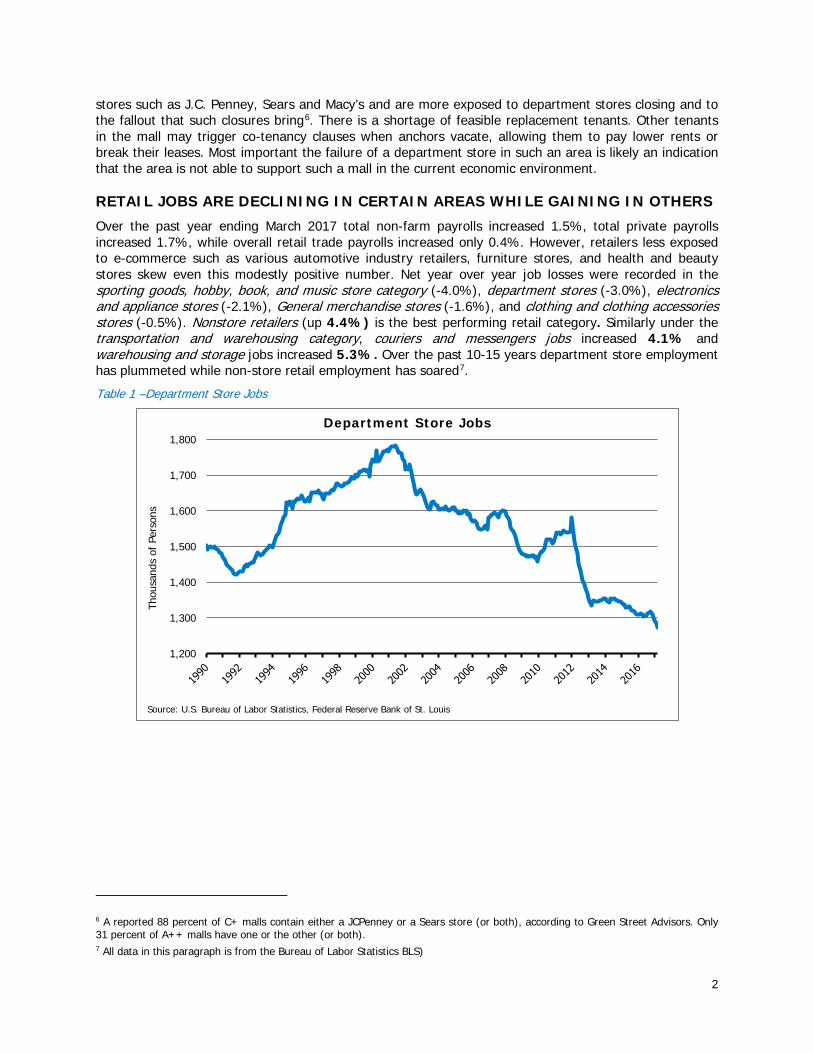
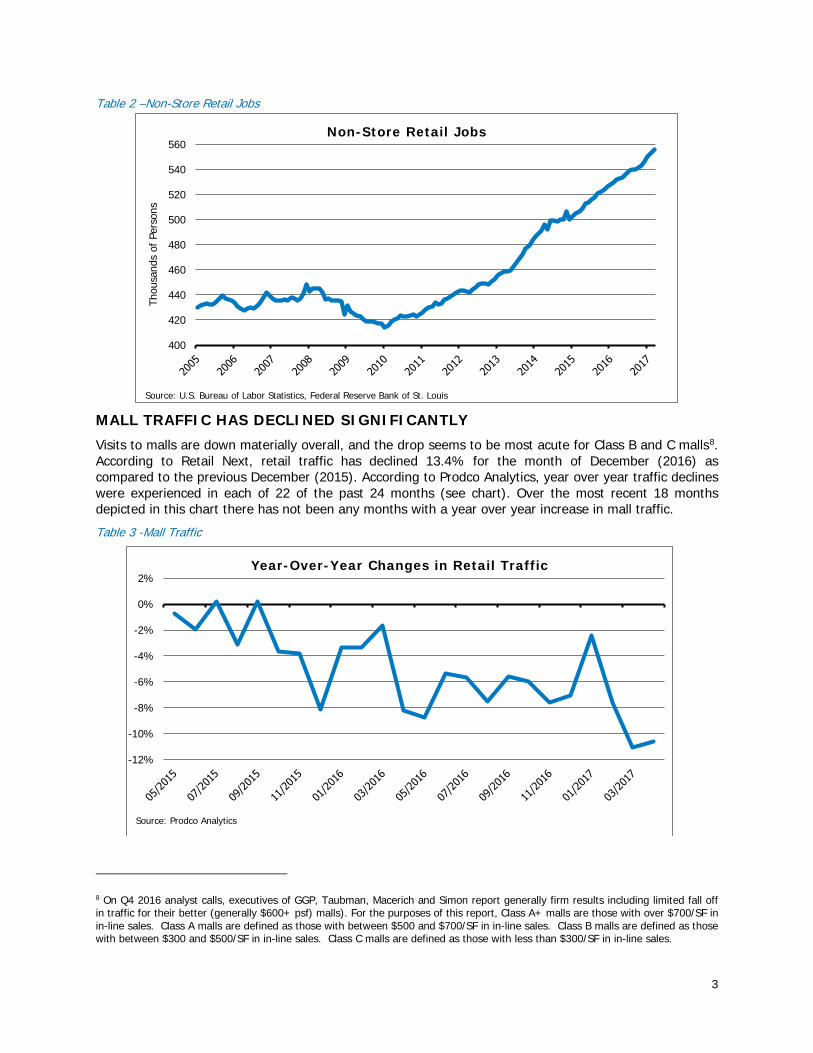
Over the past year ending March 2017 total non-farm payrolls increased 1.5%, total private payrolls increased 1.7%, while overall retail trade payrolls increased only 0.4%. However, retailers less exposed to e-commerce such as various automotive industry retailers, furniture stores, and health and beauty stores skew even this modestly positive number. Net year over year job losses were recorded in the sporting goods, hobby, book, and music store category (-4.0%), department stores (-3.0%), electronics and appliance stores (-2.1%), General merchandise stores (-1.6%), and clothing and clothing accessories stores (-0.5%). Nonstore retailers (up 4.4%) is the best performing retail category. Similarly under the transportation and warehousing category, couriers and messengers jobs increased 4.1% and warehousing and storage jobs increased 5.3%. Over the past 10-15 years department store employment has plummeted while non-store retail employment has soared7.
Table 1 –Department Store Jobs
6 A reported 88 percent of C+ malls contain either a JCPenney or a Sears store (or both), according to Green Street Advisors. Only 31 percent of A++ malls have one or the other (or both). 7 All data in this paragraph is from the Bureau of Labor Statistics BLS)
1,200
1,300
1,400
1,500
1,600
1,700
1,800
Thou
sand
s of
Per
sons
Department Store Jobs
Source: U.S. Bureau of Labor Statistics, Federal Reserve Bank of St. Louis
3
Table 2 –Non-Store Retail Jobs
MALL TRAFFIC HAS DECLINED SIGNIFICANTLY
Visits to malls are down materially overall, and the drop seems to be most acute for Class B and C malls8. According to Retail Next, retail traffic has declined 13.4% for the month of December (2016) as compared to the previous December (2015). According to Prodco Analytics, year over year traffic declines were experienced in each of 22 of the past 24 months (see chart). Over the most recent 18 months depicted in this chart there has not been any months with a year over year increase in mall traffic.
Table 3 -Mall Traffic
8 On Q4 2016 analyst calls, executives of GGP, Taubman, Macerich and Simon report generally firm results including limited fall off in traffic for their better (generally $600+ psf) malls). For the purposes of this report, Class A+ malls are those with over $700/SF in in-line sales. Class A malls are defined as those with between $500 and $700/SF in in-line sales. Class B malls are defined as those with between $300 and $500/SF in in-line sales. Class C malls are defined as those with less than $300/SF in in-line sales.
-12%
-10%
-8%
-6%
-4%
-2%
0%
2%Year-Over-Year Changes in Retail Traffic
Source: Prodco Analytics
400
420
440
460
480
500
520
540
560Th
ousa
nds
of P
erso
ns
Non-Store Retail Jobs
Source: U.S. Bureau of Labor Statistics, Federal Reserve Bank of St. Louis

4
Why is declining foot traffic important? Less mall foot traffic (1) leads to less spontaneous unplanned purchases and (2) less business even for “e-commerce resistant” tenants such as restaurants, fast food establishments and entertainment.
The change in purchasing behavior can have ripple effects on consumer spending. In-store shoppers are more likely to purchase more items than if they are shopping online and their buying activity is focused on exactly what they want. With many retailers offering no minimum for shipping (i.e. Amazon, Nordstrom, Allen Edmonds) there is no pressure or need to purchase more than one item at a time.
COMMERCIAL MORTGAGE BACKED SECURITIES (CMBS) PERFORMANCE
A manifestation of what happens when malls fail can be observed in the CMBS market. Losses on retail collateral can be significant and even exceed 100% of a loan’s balance9. There were 233 CMBS loans collateralized by retail properties with more than 250,000 square feet that were liquidated from CMBS between 2009 and 2016. Losses on 114 or almost half (49%) of the retail properties exceeded 50% while losses on 54 or 23% exceeded 75%. There were 64 CMBS loans collateralized by retail properties with more than 250,000 square feet that were liquidated from CMBS since 2015. Losses on 40 or almost half (62.5%) of the retail properties exceeded 50%. Losses on 19 or 30% exceeded 75%10.. There are several examples of such loans in which losses approached or exceeded 100% such as Hudson Valley Mall in Kingston, New York, Marley Station in Baltimore, MD, Fairgrounds Square Mall, Reading PA, Diamond Run Mall, Rutland, VT and Ft. Henry Mall, Kingsport, TN. The magnitude of loss is attributed to the lack of alternative uses, obsolescence, and weak locations.
THE THREE MAJOR CAUSES OF RETAIL CONTRACTION
Income Stagnation/Concentration
The stagnant income growth of most segments of US society and the corresponding concentration of income in the highest decile and centile of the US population is revealed by several metrics including real median household income, employment to population ratio and the Gini Ratio (Coefficient).
Despite recent improvements, the real median household income of $56,516 in 2015 is still lower than the $57,795 recorded in 2000. Real median household income has yet to fully rebound in the aftermath of the Great Recession.
9 The depth of the loss has been exacerbated by the fact that troubled loans are often held for years by special servicers who are not shopping center specialists, and who represent CMBS trusts that are ill positioned to invest the money needed to turn around a troubled mall once its prior tenant line up is no longer what it needs to be for the mall to do well. The tenants bleed away upon their lease expirations, servicing costs mount and the radical overhaul of the malls that is often needed to arrest the slide do not get taken while the mall still has a level of occupancy that might support repositioning. 10 Severity of loss information based on Wells Fargo collected data

5
Table 4 - Real Median Household Income
The cost of many categories of non-discretionary purchases (“needs”), has gone up faster than the rate of inflation. This has led to a shift of dollars away from discretionary uses.
Table 5 – Discretionary and Non-Discretionary Spending
48,000
49,000
50,000
51,000
52,000
53,000
54,000
55,000
56,000
57,000
58,000
Real Median Household Income in the U.S.(2015 CPI-Adjusted Dollars)
Source: U.S. Census Bureau, Federal Reserve Bank of St. Louis
80.0%
80.5%
81.0%
81.5%
82.0%
82.5%
83.0%
83.5%
84.0%
15.0%
15.5%
16.0%
16.5%
17.0%
17.5%
18.0%
18.5%
19.0%
19.5%
20.0%
Discretionary and Non-Discretionary Spending as Shares of Total Consumer Expenditures
Discretionary Share of Total (left) Non-Discretionary Share of Total (right)
Source: Deutsche Bank, BLS. Discretionary spending here is defined as food away from home, alcoholic beverages, apparel & services, entertainment, reading, tobacco products & smoking supplies, and miscellaneous. Non-discretionary spending here is defined as food at home, housing, transportation, healthcare, personal care products & services, education, cash contributions, and personal insurance & pensions.
6
Non-Discretionary Spending increased from 80.4% in 2000 to 83% in 2015, while Discretionary Spending decreased from 19.6% to17.1% during the same time period. Consumer dollars are shifting away from discretionary uses perhaps because expenses on non-discretionary expenditures are rising significantly faster than the rate of inflation11. Therefore, in addition to stagnant to declining real wage growth, net income for the lower portion of the income spectrum is actually declining. “Wants” such as electronics cost less, but “Needs” such housing, education, and healthcare are costing more.
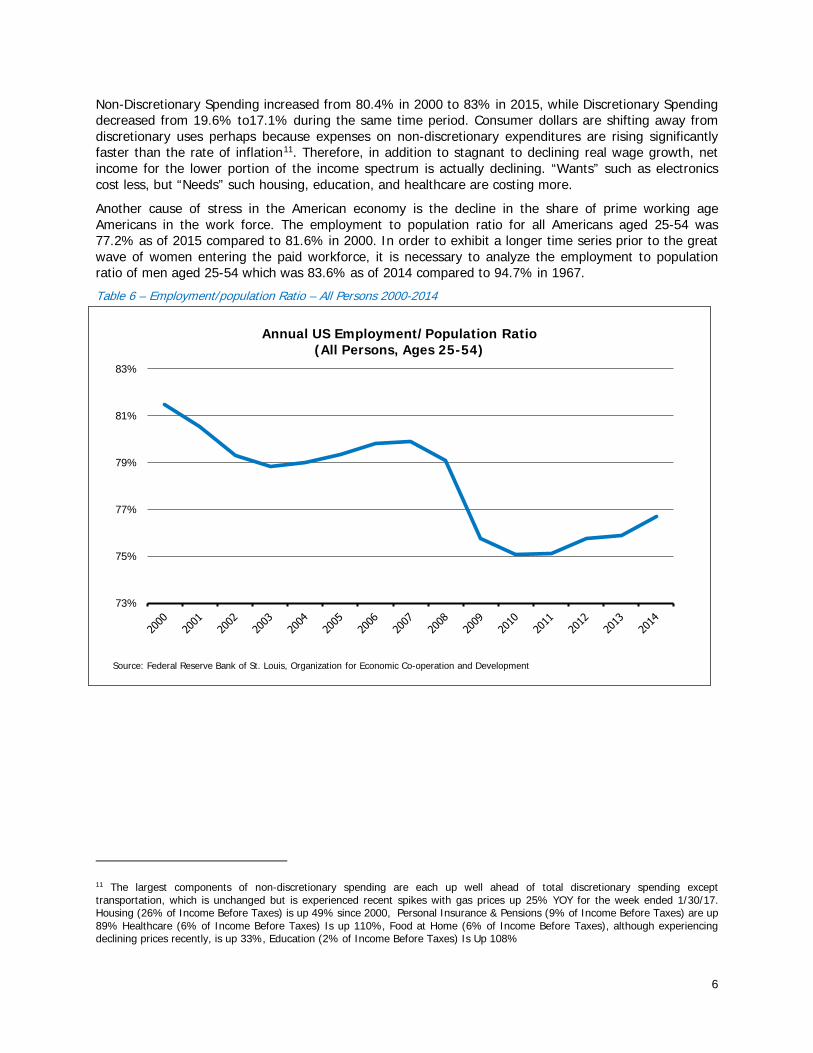
Another cause of stress in the American economy is the decline in the share of prime working age Americans in the work force. The employment to population ratio for all Americans aged 25-54 was 77.2% as of 2015 compared to 81.6% in 2000. In order to exhibit a longer time series prior to the great wave of women entering the paid workforce, it is necessary to analyze the employment to population ratio of men aged 25-54 which was 83.6% as of 2014 compared to 94.7% in 1967.
Table 6 – Employment/population Ratio – All Persons 2000-2014
11 The largest components of non-discretionary spending are each up well ahead of total discretionary spending except transportation, which is unchanged but is experienced recent spikes with gas prices up 25% YOY for the week ended 1/30/17. Housing (26% of Income Before Taxes) is up 49% since 2000, Personal Insurance & Pensions (9% of Income Before Taxes) are up 89% Healthcare (6% of Income Before Taxes) Is up 110%, Food at Home (6% of Income Before Taxes), although experiencing declining prices recently, is up 33%, Education (2% of Income Before Taxes) Is Up 108%
73%
75%
77%
79%
81%
83%
Annual US Employment/Population Ratio (All Persons, Ages 25-54)
Source: Federal Reserve Bank of St. Louis, Organization for Economic Co-operation and Development

7
Table 7 – Employment/population Ratio – Men 1967-2014
The Gini Ratio is a measure of income concentration. The higher the Gini Ratio number, the less income is evenly distributed. The US has become a significantly less equal society over the past 45 years. According to the US Census Bureau, the US Gini Ratio rose from 38.6% in 1968 to 47.9% in 2015. Consequently, income and its corresponding spending power have shifted away from the shrinking middle income and growing lower income brackets in favor of a smaller upper income segment. That segment spends less of their income in malls than other income categories.
Table 8 - Gini Ratio
Source: US Census
80%
82%
84%
86%
88%
90%
92%
94%
96%
Annual US Employment/Population Ratio(Men, Ages 25-54)
Source: Federal Reserve Bank of St. Louis, Organization for Economic Co-operation and Development
37%
39%
41%
43%
45%
47%
49%
Gini Index of Income Concentration
8
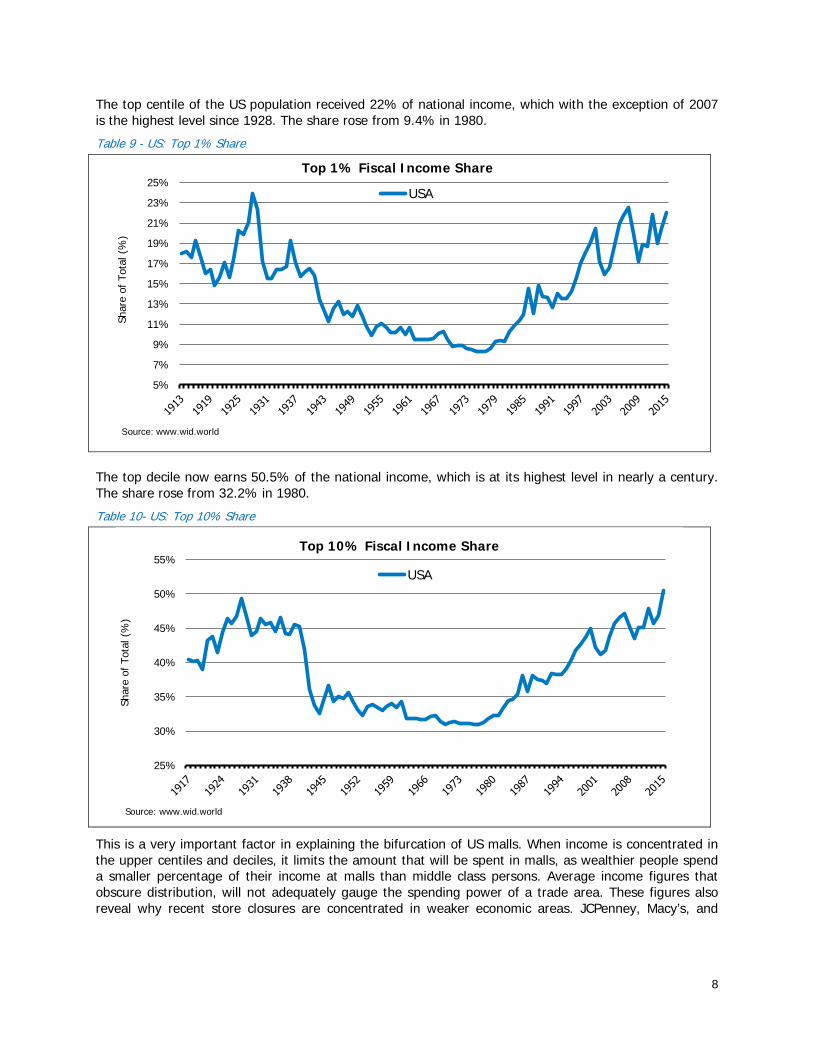
The top centile of the US population received 22% of national income, which with the exception of 2007 is the highest level since 1928. The share rose from 9.4% in 1980.
Table 9 - US: Top 1% Share
The top decile now earns 50.5% of the national income, which is at its highest level in nearly a century. The share rose from 32.2% in 1980.
Table 10- US: Top 10% Share
This is a very important factor in explaining the bifurcation of US malls. When income is concentrated in the upper centiles and deciles, it limits the amount that will be spent in malls, as wealthier people spend a smaller percentage of their income at malls than middle class persons. Average income figures that obscure distribution, will not adequately gauge the spending power of a trade area. These figures also reveal why recent store closures are concentrated in weaker economic areas. JCPenney, Macy’s, and
5%
7%
9%
11%
13%
15%
17%
19%
21%
23%
25%
Shar
e of
Tot
al (
%)
Top 1% Fiscal Income Share
USA
Source: www.wid.world
25%
30%
35%
40%
45%
50%
55%
Shar
e of
Tot
al (
%)
Top 10% Fiscal Income Share
USA
Source: www.wid.world

9
Sears have significant exposure to class B and C malls. Nordstrom and Bloomingdales have little to no exposure as they are primarily ensconced in class A malls12.
Median household income in non-metros and smaller metros is significantly lower than in larger urban areas. The number of individuals living below the poverty line has nearly doubled since the recession in 2008, eliminating purchasing power from a large group of consumers who patronized the B and C mall brands. The stress on the American consumer is not limited to income, as prices on essential expenditures not usually purchased at a mall have increased higher than CPI. As incomes have remained stagnant personal consumption expenditures for necessities have increased above the rate of inflation.
A number of regional malls in high-end areas significantly outperformed older malls in less wealthy areas. This is an oft-repeated story that may become more intense as Macy’s, Sears, JCPenney and the Limited Brands and others follow through on closing stores.
Our statistical analysis of Sears, Macys and JCPenney announced store closings reveal a significant bias toward malls in counties with lower median household income than average and declining or below average growth population change.
The CoStar Portfolio Strategy Location Quality Score (LQS) measures retail locational strength. It estimates the tenant sales potential of a property’s location based on its proximity to sources of retail spending as well as its distance from competitive retail clusters13. The chart below reveals a significant bifurcation between those in the top 10% LQS compared to those in the bottom 90%.
Table 11 – Asking Rent by LQS
12 Gary Silverman, Lindsay Whipp, Joe Rennison, “Struggling Sears Signals Decline of US Malls”, Financial Times, March 24, 2017 and based on data from Green Street Advisors. 13 The Location Quality Score model takes into account the following variables: Demographics (population density and affluence), Proximity to complementary and competitive retail, Locational attractiveness, Daytime population, Tourist spending. The model takes into account the collective pull from nearby, complementary retail through the use of “clusters,” compilations of retail properties located close enough together to serve as one coherent shopping experience. Buying power is allocated to each property or cluster from three unique sources: Resident Population, modeled on census block group demographics; Daytime Population, modeled on office building location and size; and Visitor, modeled on hotel location and size. The combined buying power is lastly adjusted for location-specific idiosyncrasies (transit stops, public safety, aesthetical appeal, etc.) that may affect a center’s attractiveness, and therefore its performance.
80
85
90
95
100
105Asking Rent Levels by Location Quality Score (Indexed to 4Q 2008)
0-50 50-75 75-90 90-100
Location Quality ScoresSource: Neustar, CoStar

10
The top retail locations significantly outperform all other categories in concert with the increased share of national income received by the top decile of American society
Too Much Surplus Retail
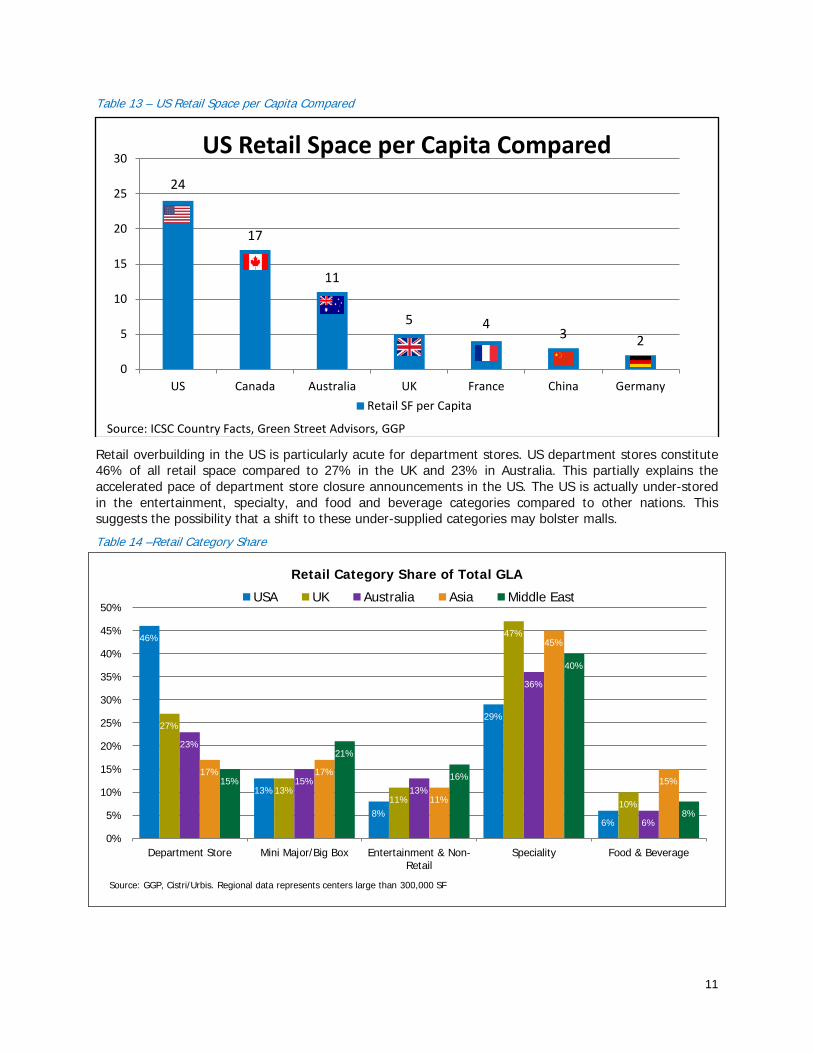
Currently there is close to 24 square feet of retail space per capita in the United States as calculated by the International Council of Shopping Space (ICSC). This number rises when small shopping centers and independent retailers are added.
Over the past 30 years, retail real estate growth has run well ahead of population growth. Since 1985, total retail space in the 209 markets tracked by CoStar has expanded by 75% (2.4% per year), while the national population has grown 41% (1.3% yearly).
Converting the data to an index and comparing it to population growth reveals a major dissonance.
Table 12 – US Retail Space and Population
The US retail space oversupply comes in sharp relief when compared to other nations with large land masses such as Canada (17) and Australia (11). It is significantly higher than countries with smaller land areas such as the UK (5), France (4) and Germany (2).
100
120
140
160
180
200
220
240U.S. Retail Space and Population (Indexed to 1982)
Population Retail GLA
Source: Cushman & Wakefield, CoStar Group, REIS, Federal Reserve Bank of St. Louis, US Census
11
Table 13 – US Retail Space per Capita Compared
Retail overbuilding in the US is particularly acute for department stores. US department stores constitute 46% of all retail space compared to 27% in the UK and 23% in Australia. This partially explains the accelerated pace of department store closure announcements in the US. The US is actually under-stored in the entertainment, specialty, and food and beverage categories compared to other nations. This suggests the possibility that a shift to these under-supplied categories may bolster malls.
Table 14 –Retail Category Share
24
17
11
5 43 2
0
5
10
15
20
25
30
US Canada Australia UK France China Germany
US Retail Space per Capita Compared
Retail SF per Capita
Source: ICSC Country Facts, Green Street Advisors, GGP
46%
13%
8%
29%
6%
27%
13%11%
47%
10%
23%
15%13%
36%
6%
17% 17%
11%
45%
15%15%
21%
16%
40%
8%
0%
5%
10%
15%
20%
25%
30%
35%
40%
45%
50%
Department Store Mini Major/Big Box Entertainment & Non-Retail
Speciality Food & Beverage
Retail Category Share of Total GLA
USA UK Australia Asia Middle East
Source: GGP, Cistri/Urbis. Regional data represents centers large than 300,000 SF
12
E-Commerce
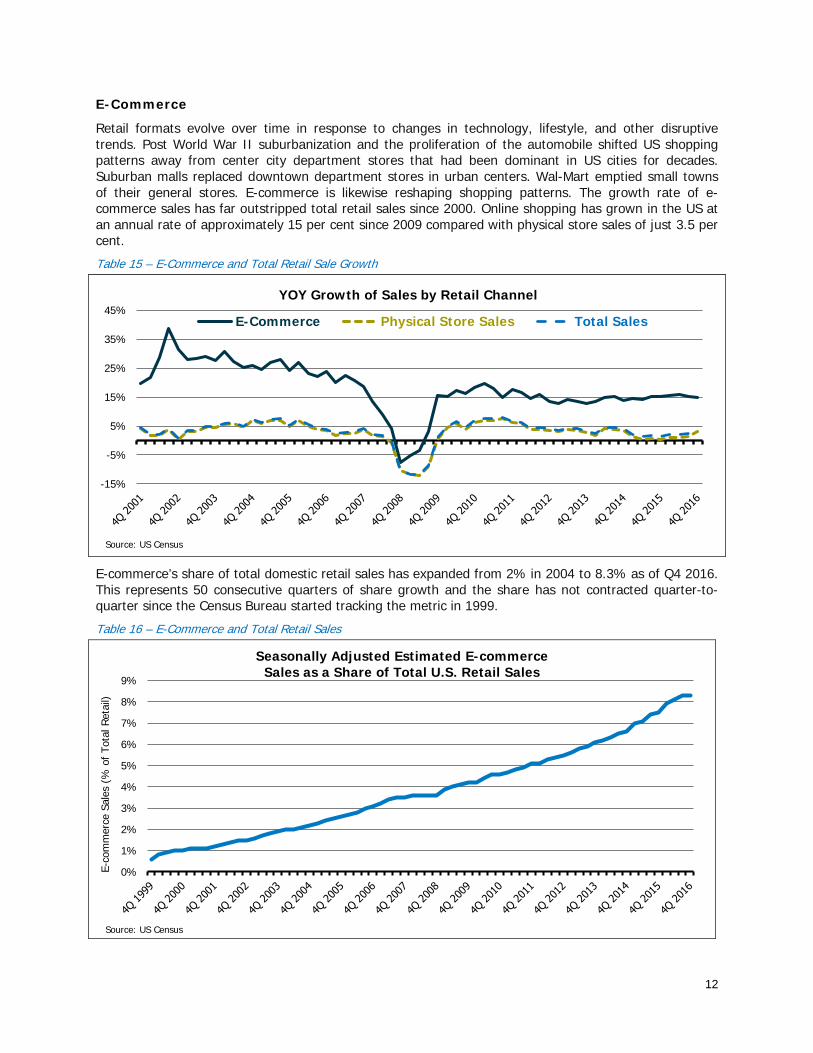
Retail formats evolve over time in response to changes in technology, lifestyle, and other disruptive trends. Post World War II suburbanization and the proliferation of the automobile shifted US shopping patterns away from center city department stores that had been dominant in US cities for decades. Suburban malls replaced downtown department stores in urban centers. Wal-Mart emptied small towns of their general stores. E-commerce is likewise reshaping shopping patterns. The growth rate of e-commerce sales has far outstripped total retail sales since 2000. Online shopping has grown in the US at an annual rate of approximately 15 per cent since 2009 compared with physical store sales of just 3.5 per cent.
Table 15 – E-Commerce and Total Retail Sale Growth
E-commerce’s share of total domestic retail sales has expanded from 2% in 2004 to 8.3% as of Q4 2016. This represents 50 consecutive quarters of share growth and the share has not contracted quarter-to-quarter since the Census Bureau started tracking the metric in 1999.
Table 16 – E-Commerce and Total Retail Sales
-15%
-5%
5%
15%
25%
35%
45%YOY Growth of Sales by Retail Channel
E-Commerce Physical Store Sales Total Sales
Source: US Census
0%
1%
2%
3%
4%
5%
6%
7%
8%
9%
E-co
mm
erce
Sal
es (
% o
f To
tal R
etai
l)
Seasonally Adjusted Estimated E-commerceSales as a Share of Total U.S. Retail Sales
Source: US Census
13
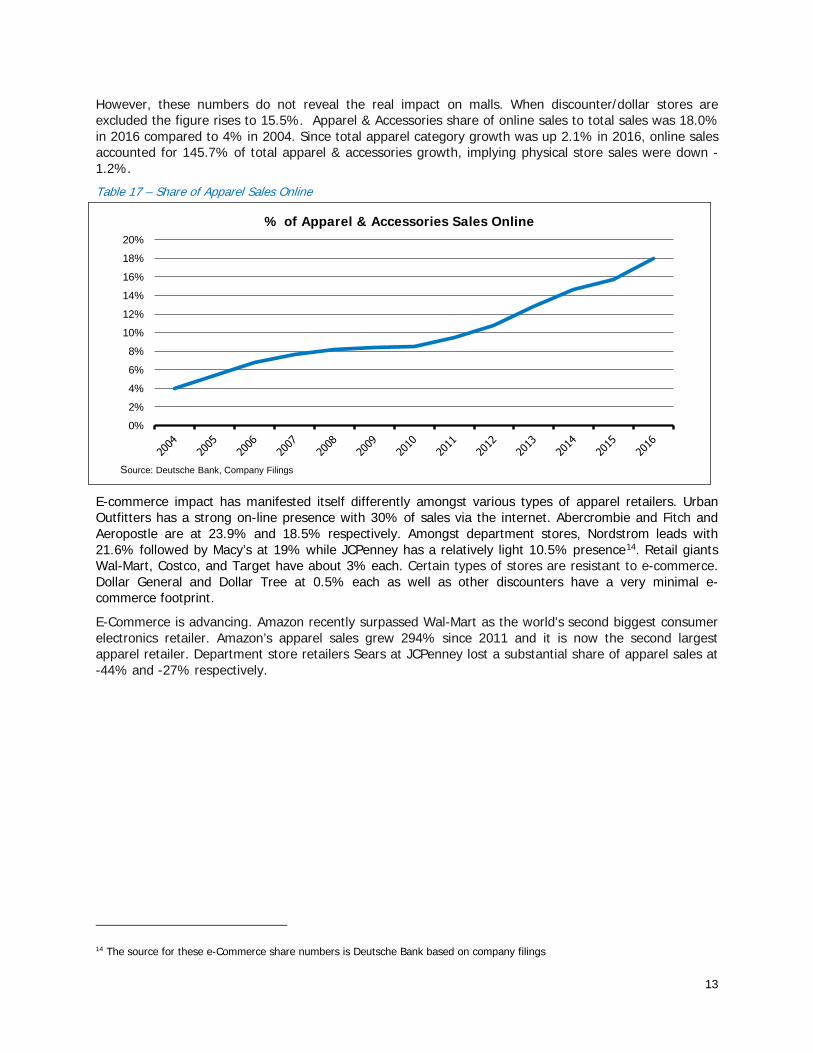
However, these numbers do not reveal the real impact on malls. When discounter/dollar stores are excluded the figure rises to 15.5%. Apparel & Accessories share of online sales to total sales was 18.0% in 2016 compared to 4% in 2004. Since total apparel category growth was up 2.1% in 2016, online sales accounted for 145.7% of total apparel & accessories growth, implying physical store sales were down -1.2%.
Table 17 – Share of Apparel Sales Online
E-commerce impact has manifested itself differently amongst various types of apparel retailers. Urban Outfitters has a strong on-line presence with 30% of sales via the internet. Abercrombie and Fitch and Aeropostle are at 23.9% and 18.5% respectively. Amongst department stores, Nordstrom leads with 21.6% followed by Macy’s at 19% while JCPenney has a relatively light 10.5% presence14. Retail giants Wal-Mart, Costco, and Target have about 3% each. Certain types of stores are resistant to e-commerce. Dollar General and Dollar Tree at 0.5% each as well as other discounters have a very minimal e-commerce footprint.
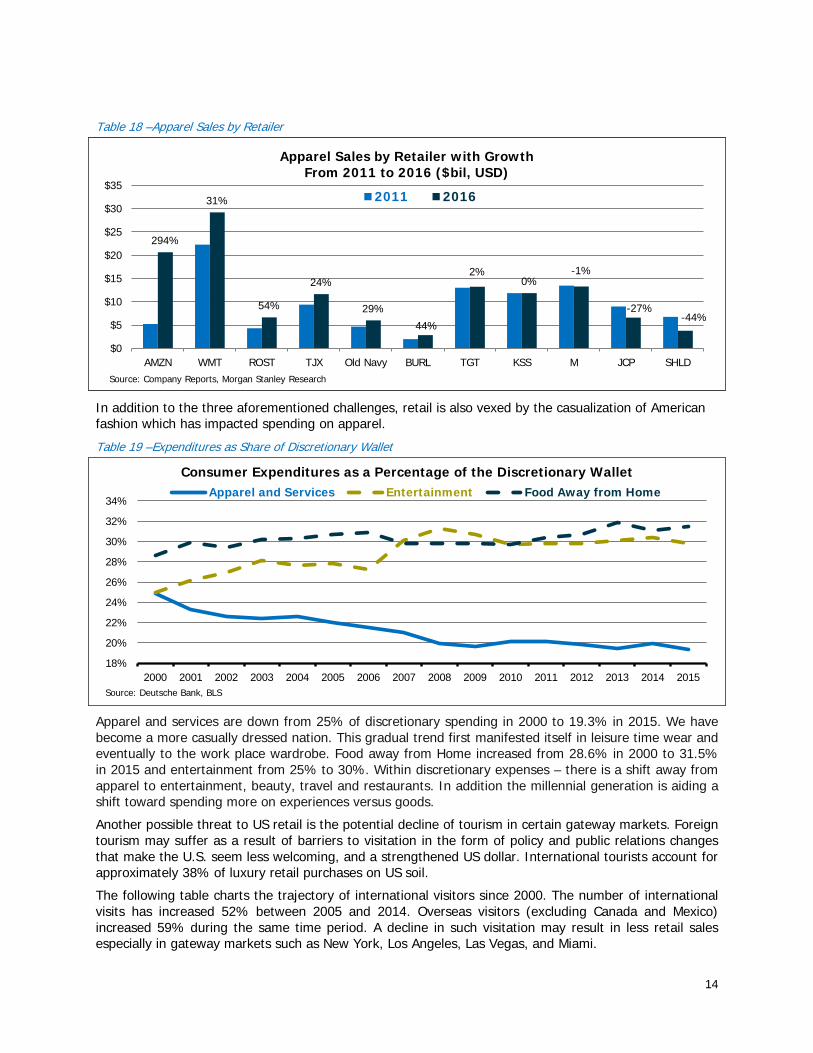
E-Commerce is advancing. Amazon recently surpassed Wal-Mart as the world's second biggest consumer electronics retailer. Amazon’s apparel sales grew 294% since 2011 and it is now the second largest apparel retailer. Department store retailers Sears at JCPenney lost a substantial share of apparel sales at -44% and -27% respectively.
14 The source for these e-Commerce share numbers is Deutsche Bank based on company filings
0%
2%
4%
6%
8%
10%
12%
14%
16%
18%
20%
% of Apparel & Accessories Sales Online
Source: Deutsche Bank, Company Filings
14
Table 18 –Apparel Sales by Retailer
In addition to the three aforementioned challenges, retail is also vexed by the casualization of American fashion which has impacted spending on apparel.
Table 19 –Expenditures as Share of Discretionary Wallet
Apparel and services are down from 25% of discretionary spending in 2000 to 19.3% in 2015. We have become a more casually dressed nation. This gradual trend first manifested itself in leisure time wear and eventually to the work place wardrobe. Food away from Home increased from 28.6% in 2000 to 31.5% in 2015 and entertainment from 25% to 30%. Within discretionary expenses – there is a shift away from apparel to entertainment, beauty, travel and restaurants. In addition the millennial generation is aiding a shift toward spending more on experiences versus goods.
Another possible threat to US retail is the potential decline of tourism in certain gateway markets. Foreign tourism may suffer as a result of barriers to visitation in the form of policy and public relations changes that make the U.S. seem less welcoming, and a strengthened US dollar. International tourists account for approximately 38% of luxury retail purchases on US soil.
The following table charts the trajectory of international visitors since 2000. The number of international visits has increased 52% between 2005 and 2014. Overseas visitors (excluding Canada and Mexico) increased 59% during the same time period. A decline in such visitation may result in less retail sales especially in gateway markets such as New York, Los Angeles, Las Vegas, and Miami.
294%
31%
54%
24%
29%
44%
2%0%
-1%
-27%-44%
$0
$5
$10
$15
$20
$25
$30
$35
AMZN WMT ROST TJX Old Navy BURL TGT KSS M JCP SHLD
Apparel Sales by Retailer with GrowthFrom 2011 to 2016 ($bil, USD)
2011 2016
Source: Company Reports, Morgan Stanley Research
18%
20%
22%
24%
26%
28%
30%
32%
34%
2000 2001 2002 2003 2004 2005 2006 2007 2008 2009 2010 2011 2012 2013 2014 2015
Consumer Expenditures as a Percentage of the Discretionary WalletApparel and Services Entertainment Food Away from Home
Source: Deutsche Bank, BLS

15
Table 20 –International Visitation to US
The Canadian Exception Proves the Rule
The U.S. regional mall experience is put in to focus when contrasted with Canadian mall performance. Since 2014 sales at Canadian malls were up 9% while they were down 2% in the US during the same time period. Canadian retail sales were C$744 (US$562) per square foot in 2016 compared to US$466 per square foot in the US15. The better performance also manifests itself in vacancy rates. Canadian malls recorded a vacancy rate of 6.3% in 2016 compared to 7.8% in the US for the same time period. Canada has not had large department store closure announcements in the past two years as experienced in the U.S. Hudson’s Bay Co., has been adding new Saks and Saks off Fifth stores in Canada contrasted with vacillating performance in the US. Hudson’s Bay stores in Canada have outperformed corresponding American stores. The largest Canadian malls such as Toronto’s CF-Eaton Centre outperform the largest US malls in terms of foot traffic. Unlike some of the dismal outcomes in US retail CMBS performance, Canadian CMBS has experienced only nominal defaults.
The three major causes of mall stress and failures in the US are either not present in Canada or appear in a more muted form. Real median household income in Canada continued its upward trajectory through 2014. Real median household income in the US in 2014 was 7% lower than it was in 2000. US income rose in 2015 and is now 2% lower than it was in 2000. Conversely, Canadian median household income in 201416 was 18% higher than it was in 2000.
15 “Canadian Shopping Center Study”, Retail Council of Canada, December, 2016. Canadian mall productivity numbers were collected for the 12-month period ending December 31, 2016 and pedestrian counts were also measured over a period of 12 months. 16 The most recent year this data was available was 2014 in Canada and 2015 in the US.
58% 56% 53% 52% 53% 44% 43% 43% 44% 43% 44% 44% 45% 46% 46%
33%35%
36% 37%36% 30% 31%
32% 33% 33%34% 34%
34%33% 31%
9%10%
11% 11%10%
26% 26%26% 24%
24%22%
22%21%
21%23%
0
10
20
30
40
50
60
70
80Shares of International Visitation in U.S. (millions)
Overseas Canada Mexico
Source: U.S. Department of Commerce, ITA, National Travel & Tourism Office

16
Table 21 –US and Canada Real Median Household Income
The Canadian middle class is stronger than in the US and is now considered to have the world’s highest income in that category17. According to the Organization for Economic Cooperation and Development (OECD), which calculates the Gini Ratio differently than the US Census Bureau18, Canada’s Gini Coefficient is 32% compared to 39% in the US., which is representative of more level income dispersion in Canada. In 2010 (latest data for Canada), the Canadian top 10% received 41% of income compared to 45% in the US. The US share rose to 50.5% by 2015. In 2010, the Canadian top 1% received 13.5% of income compared to 18.8% in the US. The US share rose to 22% by 2015.
17 David Leonhardt and Kevin Quealy, “The American Middle Class is No Longer the world’s Richest”, The New York Times, April 22, 2014.18 The OECD calculates the Gini Ratio considering disposable income, post taxes and transfers 18 The OECD calculates the Gini Ratio considering disposable income, post taxes and transfers
$51
$54
$57
$60
$63
$66
$69
$72
$75
$78
$81
U.S. and Canada Real Median Household Income ($ 000s)
US Real Median Income ($ USD) Canada Real Median Income ($ CAD)
Source: Citi Research, Statistics Canada, Federal Reserve Bank of St. Louis

17
Table 22 –US and Canada Top 10% Income Share
Table 23 –US and Canada Top 1% Income Share
Per capita retail space in Canada is 16.5 square feet per person, compared with 23.6 square feet per person in the U.S. There is significantly less mall space per person in Canada vs. the United States. Accordingly, Canadian malls are more efficient.
E-Commerce in Canada is a smaller share of total retail sales compared to the US. The retail Council of Canada (RCC) maintains that e-commerce penetration in Canada is 6%, however Statistics Canada
25%
30%
35%
40%
45%
50%
55%
Shar
e of
Tot
al (
%)
Top 10% Fiscal Income Share
USA Canada
Source: www.wid.world
5%
7%
9%
11%
13%
15%
17%
19%
21%
23%
25%
Shar
e of
Tot
al (
%)
Top 1% Fiscal Income ShareUSA Canada
Source: www.wid.world

18
recently reported that it was as low as 2%19. Perhaps it is higher shipping costs that has slowed the rise of e-commerce. Market research firm eMarketer predicts Canadian retail sales will grow 1.7% this year to $522.6 billion, with a 15% increase in e-commerce sales. Accordingly, e-commerce is certainly a future threat. The wider distribution of income combined with more efficient retailing, and less exposure to e-commerce for now has maintained the resilience of the majority of Canadian malls.
Class B and C Malls in Non-Core Markets are more vulnerable
The slow death of many regional malls is not evenly distributed. The store closings are predominantly in class B and C malls. Class C malls are common in smaller metro areas and non-metro areas. Their trade areas could barely support many of these malls and their stores. When confronted with the dual challenges of stagnant wages and e-commerce some of them folded and others are threatened. Considering that the US has more retail per capita than any other nation, it is no surprise that a significant shake out is occurring. Ironically, many less populated areas that were serviced more than a century ago by peddlers and mail catalogues20 are reverting to a modern version of these in the form of e-commerce. Many of these places were barely big enough for one mall – now with losing 8% to 15% of sale revenue – their malls often cannot survive.
A disproportionate number of recent high profile department store closure announcements have been concerning communities that are already struggling. Our study confirmed that they are concentrated in areas with median household income below the national average, below average population growth, or decreasing population.
The consequences of mall closings in smaller areas are manifold and extend beyond the loss of a place to shop. In addition to the loss of jobs and real estate tax revenues, there is a social toll suffered in the loss of communal space and a “town center” that is hard to measure.
Conclusion
In his popular book “The Sun Also Rises”, Ernest Hemingway presents the dialogue of two of his characters; "How did you go bankrupt?" Bill asked. "Two ways," Mike said. "Gradually and then suddenly." This is also a good characterization of how certain malls decline. The mall gradually experiences declining sales and occupancy over a long period of time. Eventually it loses one or more anchors, a flight of inline tenants ensues, a rapid deterioration in cash flow occurs and the mall is suddenly no longer viable.
The triple threats of net median income stagnation/income concentration, oversupply and e-commerce have taken their toll on US malls and the next recession may result in a violent shakeout. Successful malls will be resistant to the three challenges. High-end malls with sales exceeding $600/SF catering to those in the upper economic tier should prosper despite income stagnation and will benefit from income concentration. This is particularly true of upper decile malls. According to Green Street Advisors, American households that earn $100,000 or more account for 65% percent of all apparel and entertainment spending, while those that earn $150,000 or more account for 28% percent. Malls that dominate their markets (Dominant Malls) may continue to do well despite having lower sales. They may be the only mall for dozens of miles in any direction, with healthy occupancy cost ratios, acceptable sales
19 Hollie Shaw, “When it comes to shopping, Canadians just aren’t clicking as only 2% of sales are made online”, The Financial Post, November 30, 2016 20 In the 19th century many of these areas were serviced by peddlers going from place to place selling their wares. The Montgomery Ward catalogue was initialized in 1872 and the Sears, Roebuck and Co. catalog in the 1890s. These mail order brochures enabled those situated in relatively remote locations to receive goods by mail. Eventually Sears, Montgomery Ward and other department stores opened in smaller metro areas and drew patrons from a wide geographic area. Frequently they served as anchors for malls.
19
trends and stable occupancy. They are situated in a trade area with adequate spending power and are well positioned compared to other local competitors.
Certain types of retailers have thus far proven resistant to e-commerce. The two largest dollar stores, Dollar General and Dollar Tree as well as TJMaxx and Ross Dress for Less provide the consumer with a scavenger hunt type experience with the offerings changing constantly. TJX Companies, owner of T.J. Maxx, Marshalls, and HomeGoods indicated that they intend to increase the number of stores from the current level of 3,700 to 5,600 over time21. The company added 47 stores in the first fiscal quarter of 2017 and intends to add 150 more in the balance of the year. This is on the wake of adding 219 stores last year.
Retailers that provide consumers with experiences that cannot be enjoyed over the internet are likely to increase their foot print in malls. As noted earlier, the US is actually under-stored in the entertainment, and food and beverage categories compared to other nations. The number of restaurants is at an all time high, having increased by 40,000 net over the past five years. Americans now spend more eating out than eating at home. According to Census Bureau data, through January 2017, restaurant sales were up a robust 5.6 percent over a year earlier. The Bureau of Labor Statistics (BLS) revealed that the number of restaurants in the US increased by about 2 percent in 2016 and approximately 11% since 2011. It is important to note that this group is being fueled by independent restaurants which represent about 66% of the total. Same-Store Sales amongst chain store restaurants and especially fast food establishments has been low or declining recently. Restaurants and entertainment represent about 15-20% of regional mall tenants – a pivot away from waning apparel tenants to more restaurants in regional malls may mitigate some of the decline.
There are also retailers such as Ulta and Sephora that provide goods and an in store experience. Entertainment tenant KidZania average 75,000 square feet and can replace an anchor tenant. This popular “city for kids” is coming to the US later this year. Malls that are e-commerce resistant have many restaurants, movie theaters, fitness centers, outpatient medical centers. Recently more movie theaters are entering malls as anchors and restaurants are being incorporated into the malls as opposed to occupying pad sites.
While mid-market department stores have suffered some other large retailers have done well. Certain supermarkets and warehouse clubs such as Costco have been doing well despite the rise of E-Commerce. Such stores are increasingly sought out as a big-format substitute for vacating apparel-anchored department stores. Dick’s sporting goods is an example of a large format specialty goods retailer that has used both their stores and online channels successfully22. Omni-channel retailers exploit the Internet with sales and delivery systems that benefit from a physical presence23. Online retailers such as Warby Parker, Blue Nile and UNTUCit are also opening physical stores in malls, because the merchandising advantages and brand-building effects of omni-line retailing runs both to physical retailers and players that started in the digital realm. Retail has long been an industry characterized by creative destruction, and although the pace of destruction in some quarters has picked up, there will continue to be winners and losers at the retailing game.
Nevertheless the pace of change in retailing has accelerated and the impact among the losers may be severe. There are many malls in the process of decline; and the next recession may result in a fierce
21 Chris Isidore, “T.J. Maxx, Marshalls and HomeGoods plan to open thousands of new stores”, CNNMoney, May 18, 2016 22 They reported a 27% increase in on-line sales in Q4 2016, and E-commerce represented 18% of their total sales. They delivered 5% sales growth overall for the quarter, and they expect to open 43 new Dick’s stores in 2017. 23 such as online ordering with pickup at the store, in-store buying with delivery to the home, use of mobile apps by shoppers as a tool while shopping at the store, the on-line sale of services such as skilled installation to support sales out of stores such as Home Depot, use of the store to build brands as Apple and Microsoft have been doing, and other examples.
1736770

20
reckoning resulting in an avalanche of mall closings. More near term events that may precipitate an acceleration of the process include a Sears or JCPenney bankruptcy or more store closures as retailers curtail their physical store presence while relying more on online sales. Upper tier malls and malls with an entertainment, restaurant, or other experiential focus should continue to thrive.
The information presented herein represents the view of the author as of the date of publication, is for informational purposes only and subject to change without notice. The information herein was obtained from various sources we believe to be reliable but Real Estate Investors makes no representation or warranty as to the accuracy or completeness of any third party information or data. The charts and graphs provided herein are for illustrative purposes only to assist readers in understanding economic trends and market conditions. There is no guarantee that market expectation will be achieved
This document is for information purposes only. Any reproduction or distribution without the prior written consent of Real Estate Investors is prohibited. Real Estate Investors is an investment division within NYL Investors LLC, a wholly owned subsidiary if New York Life Insurance Company.
1736770