cfd simulation of condensing vapor bubble using vof model · pdf file... cfd modeling,...
TRANSCRIPT
Abstract—In this study, direct numerical simulation for the bubble
condensation in the subcooled boiling flow was performed. The main goal was to develop the CFD modeling for the bubble condensation and to evaluate the accuracy of the VOF model with the developed CFD modeling. CFD modeling for the bubble condensation was developed by modeling the source terms in the governing equations of VOF model using UDF. In the modeling, the amount of condensation was determined using the interfacial heat transfer coefficient obtained from the bubble velocity, liquid temperature and bubble diameter every time step. To evaluate the VOF model using the CFD modeling for the bubble condensation, CFD simulation results were compared with SNU experimental results such as bubble volume and shape, interfacial area, bubble diameter and bubble velocity. Simulation results predicted well the behavior of the actual condensing bubble. Therefore, it can be concluded that the VOF model using the CFD modeling for the bubble condensation will be a useful computational fluid dynamics tool for analyzing the behavior of the condensing bubble in a wide range of the subcooled boiling flow.
Keywords—Bubble condensation, CFD modeling, Subcooled boiling flow, VOF model.
I. INTRODUCTION
N nuclear engineering field, subcooled boiling flows have been studied as an important problem to the optimum design
and safety analysis of the nuclear system because in the subcooled boiling flow, the behavior of bubble has a large effect on the heat transfer characteristics of the nuclear system as well as pressure drops and flow instability, etc. And subcooled boiling flows become very complicated and dynamic phenomena by the vapor bubble-water interaction due to the boiling, condensation, break-up, and coalescence of the bubble. Therefore, in order to analyze the subcooled boiling flow, it should be required to understand the behavior of bubble firstly.
There have been many researches to analyze the behavior of bubble experimentally. However, it has been impossible to get complete information about the behavior of bubble because there is an interface between vapor and water phase. The shape and the area of the varying interface, which governs the behavior of each phase, are very complex and too difficult to analyze. And in the subcooled boiling flow, the change of
Seong-Su Jeon is with the Nuclear Engineering Department, Seoul National
University, Seoul, Republic of Korea (phone: 822-880-7588; fax: 822-883 -0827; e-mail: sagu100 @snu.ac.kr).
Seong-Jin Kim is with the Nuclear Engineering Department, Seoul National University, Seoul, Republic of Korea (e-mail: [email protected]).
Goon-Cherl Park is with the Nuclear Engineering Department, Seoul National University, Seoul, Republic of Korea (e-mail: [email protected]).
interface is affected by bubble condensation significantly so that it is very difficult to analyze the behavior of bubble. Therefore, it is necessary to carry out direct numerical simulations for the behavior of bubble as a complement to experiments. Direct numerical simulation may contribute to a better physical understanding of the complex phenomena for the bubble behavior.
Recently, there have been many studies devoted to numerical simulations for the rising bubble in various conditions [1]-[5]. In those simulations, many parameters describing the behavior of the bubble were analyzed such as the bubble sizes, bubble shapes, rising trajectory, and bubble velocity. The simulation results showed good agreements with the experimental data. However, most bubble simulations are limited to the case with adiabatic system such as air-water flow, where the heat and mass transfer between each phase were not considered. Those bubble simulations are only valid in analyzing the behavior of bubble in the adiabatic system. Therefore in order to understand the behavior of bubble in the subcooled boiling flow, the numerical study for the condensing bubble considering the heat and mass transfer through the bubble interface is required.
Bubble condensation is the key parameter to describe the heat transfer phenomena in the subcooled boiling flow. It affects the shape and the area of the varying interface significantly so that the behavior of bubble is different with that of the bubble in the adiabatic system. Therefore, this study focused on how to simulate the bubble condensation in CFD code. And the behavior of the condensing vapor bubble in the subcooled boiling flow was investigated numerically. In order to simulate the behavior of condensing vapor bubble, the VOF model was used. And in order to simulate the heat and mass transfer through the bubble interface, CFD modeling for the bubble condensation was developed by modeling the source terms in the governing equations of VOF model using the User-Defined Function (UDF) in FLUENT code.
And then in order to confirm the applicability of the developed CFD modeling into the VOF model, the sensitivity tests for the different bulk liquid temperatures and liquid velocities were performed. And in order to validate the capability of the VOF model using the CFD modeling to the bubble condensation phenomena, various parameters such as the bubble velocity, the interfacial area, Sauter diameter and bubble volume obtained from the CFD simulation were compared with the results of Seoul National University (SNU) experiment [6] where the behavior of single condensing vapor bubble was analyzed in the subcooled boiling flow.
CFD Simulation of Condensing Vapor Bubble using VOF Model
Seong-Su Jeon, Seong-Jin Kim, Goon-Cherl Park
I
World Academy of Science, Engineering and TechnologyInternational Journal of Mathematical, Computational, Physical, Electrical and Computer Engineering Vol:3, No:12, 2009
1098International Scholarly and Scientific Research & Innovation 3(12) 2009 scholar.waset.org/1999.7/1307
Inte
rnat
iona
l Sci
ence
Ind
ex, P
hysi
cal a
nd M
athe
mat
ical
Sci
ence
s V
ol:3
, No:
12, 2
009
was
et.o
rg/P
ublic
atio
n/13
07

II. NUMERICAL METHOD
A. VOF Model The bubble condensation simulations were carried out by
using the volume-of-fluid (VOF) model developed by Hirt and Nichols [7]. The VOF model could track the interface between two phases so that it has been used widely in analyzing various two phase flow system where the change of interface is important. In this study, the VOF model in a commercial CFD code FLUENT 6.2.16 was used [8].
In VOF model, the governing equations are solved using the volume fraction in each cell. In each cell, the summation of the each phase’s volume fraction kα is unity.
1
1n
kk
α=
=∑ (1)
Figure 1 shows how the volume fraction is marked in each
cells. For 1.0gα = and 0.0gα = , the cell represents the vapor
region and the water region, respectively. And for 0 1gα< < ,
the cell represents the interface region. The free surface of the bubble exists in the interface region. In this study, the bubble is defined as an aggregate composed of cells which have the volume fraction in the range of 0.5 gα≤ . Therefore, the bubble
volume is calculated by the summation of the vapor volume in each cells where the volume fraction is in the range of 0.5 gα≤ .
And bubble surface area is calculated using the area of iso-surface which has constant volume fraction, 0.5gα = .
In VOF model, all properties are calculated using the volume fraction in each cell. In two-phase system, if the phases are represented by the subscripts 1 and 2, and if the volume fraction of the second phase is being tracked, the density in each cell is determined as follows.
2 2 2 1(1 )ρ α ρ α ρ= + − (2)
All other properties such as viscosity are computed in the
same manner. Therefore, properties in each cell become different based on the volume fraction. And governing equations are solved using these properties.
Fig.1 Volume fraction and properties in each cell in the bubble simulation
In VOF model, the change of the bubble interface is tracked
by the solution of a continuity equation for the volume fraction.
For the thk phase, this equation has the following form.
kkk
k
Sv
tαα α
ρ∂
+ ∇ =∂
(3)
where
kSα is the mass source term. The mass transfer between
the phases during the bubble condensation could be simulated by modeling the mass source term.
In VOF model, a single momentum equation shown in (2.4) is solved throughout the domain, and the obtained velocity field is shared among the phases.
( ) ( ) ( )Tv vv p v v g Ft
ρ ρ μ ρ⎡ ⎤⎢ ⎥⎣ ⎦
∂ + ∇ = −∇ + ∇ ∇ + ∇ + +∂
(4)
where v is treated as the mass-averaged variable.
1 1 1 2 2 2v vv α ρ α ρρ+= (5)
In this bubble simulation, F represents the volumetric forces at the interface resulting from the surface tension.
The energy equation, shared among the phases, is shown below.
( ) ( ( )) ( )eff hE v E p k T St
ρ ρ∂ + ∇ + = ∇ ∇ +∂
(6)
The VOF model treats energy, E, and temperature, T, as mass-averaged variables.
1
1
n
k k kk
n
k kk
EE
α ρ
α ρ=
=
=∑
∑ (7)
where kE for each phase is based on the specific heat of that
phase and shared temperature. The source term, hS , is the
volumetric heat source term. In order to simulate the heat transfer between the phases during the bubble condensation, modeling the heat source term is required.
Fig. 2 Governing equations in each cell
World Academy of Science, Engineering and TechnologyInternational Journal of Mathematical, Computational, Physical, Electrical and Computer Engineering Vol:3, No:12, 2009
1099International Scholarly and Scientific Research & Innovation 3(12) 2009 scholar.waset.org/1999.7/1307
Inte
rnat
iona
l Sci
ence
Ind
ex, P
hysi
cal a
nd M
athe
mat
ical
Sci
ence
s V
ol:3
, No:
12, 2
009
was
et.o
rg/P
ublic
atio
n/13
07

Figure 2 shows the governing equations in each cell. In vapor cell and water-cell, governing equations are solved for only vapor and water phases, respectively. However, in the interface-cell, governing equations are solved for mixture phase assumed as 3rd phase. Using these equations, it is possible to simulate the complex behavior of an interface. And in Fig. 2, it should be noted that source terms exist only in governing equations of the interface-cell because the heat and mass transfer occurs on the interface during the bubble condensation.
B. CFD Modeling for the Bubble Condensation Using the default-VOF model in the FLUENT code, the
rising bubble could be simulated. However, in order to simulate the bubble condensation, source terms should be modeled. In this study, the UDF of FLUENT code was used to model the source terms. The UDF is a routine which can be dynamically linked with the FLUENT solver. It could be programmed by the user and it is possible to define user’s own boundary conditions, source terms, etc.
Bubble condensation occurs by convective heat transfer mechanism due to the temperature difference between vapor and water phase. Therefore, in order to simulate the heat and mass transfer through the bubble interface, the interfacial heat transfer coefficient should be known firstly. In this study, the interfacial heat transfer coefficient, hi, is calculated by substituting dimensionless numbers such as Re and Ja, which are obtained by analyzing the behavior of the bubble every time step, into the condensation correlation.
The condensation correlation has the following form.
i sc b
l
h DNu f (Re ,Ja,Pr)k
= = (8)
The calculations for each parameter are shown belows. Firstly, bubble Reynolds number (Reb) is defined as:
l rel sb
l
U DRe ρμ
= (9)
where lρ , Urel, Ds, lμ is liquid density, bubble relative velocity,
bubble Sauter diameter, and liquid viscosity, respectively. In (2.9), the bubble relative velocity ( relU ) is defined as:
( ) ( ) ( )22 2
, , ,rel b x b y b z lU U U U U= + + − (10)
where ,b xU , ,b yU , and ,b zU are the instantaneous absolute
bubble velocities. And Ul is the local liquid velocity. The bubble relative velocity was calculated from the change of the center of mass for the bubble at each time step. Center of mass (XCM) for the bubble is defined as:
, ,
,
( )g j g j CM j
jCM
g j g jj
Vol xCenter of mass X
Vol
α ρ
α ρ=
∑
∑ (11)
where ,g jα is the volume fraction of jth cell, Volj is the volume
of jth cell, gρ is vapor density. In (2.9), the bubble diameter
(Ds) is defined as the Sauter diameter of the bubble.
6.0sbubble volumeD
bubble surface area= × (12)
Substituting (2.10) and (2.12) into (2.9) yields bubble Reynolds number.
Secondly, Jakob number (Ja) is defined as:
( )l pl sat ll
g hg
C T TJa
hρ
ρ−
= (13)
where lT is the local liquid temperature, Cp,l is the liquid
specific heat, hfg is the latent heat. Thirdly, Prandtl number (Pr) is defined as:
pl ll
l
CPr
kμ
= (14)
where kl is the liquid thermal conductivity. Prandtl number is constant because properties are assumed as constant.
Finally, time-dependent interfacial heat transfer coefficient is obtained by substituting (2.9), (2.13), and (2.14) into (2.8).
Source terms were modeled by using hi computed from (2.8), and were adjusted in the interfacial cell because the bubble condensation occurs on the interface between the water phase and the vapor phase. The procedure to calculate the source terms is as follows.
Heat transfer rate between two phases is given by
( )i sat lq h T T A= − (15)
where hi is interfacial heat transfer coefficient, Tsat, Tl are vapor and liquid temperature, respectively, A is the bubble interfacial area between two phases.
From (2.15), total mass transfer rate (kg/s) from vapor to liquid is obtained as:
( )i sat l
fg fg
h T T AqMh h
−= = (16)
Because the total mass transfer rate is defined as the sum of
each cell’s mass transfer rate (kg/m3s) in the interface region, total mass transfer rate is given by
,j j g j jj j
M m Vol mVolα= =∑ ∑ (17)
where m is the mass transfer rate in the pure vapor cell, jm is
the each cell’s mass transfer rate proportional to vapor volume
fraction in the thj cell in the interface region.
World Academy of Science, Engineering and TechnologyInternational Journal of Mathematical, Computational, Physical, Electrical and Computer Engineering Vol:3, No:12, 2009
1100International Scholarly and Scientific Research & Innovation 3(12) 2009 scholar.waset.org/1999.7/1307
Inte
rnat
iona
l Sci
ence
Ind
ex, P
hysi
cal a
nd M
athe
mat
ical
Sci
ence
s V
ol:3
, No:
12, 2
009
was
et.o
rg/P
ublic
atio
n/13
07

From (2.17), m is given by
,g j jj
MmVolα
=∑
(18)
And jm is given by
,,
,
g jj g j
g j jj
m m MVol
αα
α= =
∑ (19)
By substituting (2.16) into (2.19), mass transfer rate in the
thj cell is determined as:
,,
,
( )sat g jl jij
g j jfgj
T T Ahmh Vol
αα−
=∑
(20)
where ,l jT is calculated as the local liquid temperature at the
cell position in the interface using liquid temperature profile. By applying (2.20) to the source terms in the interface cell, the amount of the bubble condensation was calculated.
Figure 3 shows how to calculate the source terms in the present condensation modeling. Re is determined by the behavior of single bubble, Ja is calculated using liquid temperature profile at the bubble center. Next, hi is calculated from condensation correlation using Re, Ja. Finally, source terms are computed by determined the interfacial heat transfer coefficient and local liquid temperature in the interface.
The characteristic of this CFD modeling is that the interfacial heat transfer coefficient is varied every time step and each cell’s mass transfer rate is different over the every interface cell by (2.20) although the interfacial heat transfer coefficient is uniform on the every interface cell at each time step.
Fig. 3 Calculation of the source terms in the CFD modeling
III. 2D CFD SIMULATION
In order to confirm the applicability of the developed CFD modeling into the VOF model, sensitivity tests for the different
bulk liquid temperatures and liquid velocities were performed. TABLE I
TEST CONDITION FOR 2D SIMULATION
Figure 4 shows the visual results for the behavior of the
condensing vapor bubble. When the condensation modeling was not applied, just the shape of bubble was deformed as time goes by without the change of bubble size. However, when the condensation modeling was applied, the bubble was condensed as the bubble rose up. And from Fig. 4 and Fig. 5, it was found that the bubble was condensed more rapidly by (2.20) as the bulk liquid temperature decreased.
Fig. 4 CFD simulation results for the liquid temperature (Case 1-4)
Fig. 5 Bubble diameter for the liquid temperature (Case 1-4)
Figure 6 represents the CFD simulation of the condensing
bubble for different liquid velocities. The bubble rose up more rapidly in the channel and the moving distance was increased during the bubble collapse as the liquid velocity increased.
Fig. 6 CFD simulation results for the liquid velocity (Case 4- 6)
World Academy of Science, Engineering and TechnologyInternational Journal of Mathematical, Computational, Physical, Electrical and Computer Engineering Vol:3, No:12, 2009
1101International Scholarly and Scientific Research & Innovation 3(12) 2009 scholar.waset.org/1999.7/1307
Inte
rnat
iona
l Sci
ence
Ind
ex, P
hysi
cal a
nd M
athe
mat
ical
Sci
ence
s V
ol:3
, No:
12, 2
009
was
et.o
rg/P
ublic
atio
n/13
07

However, as shown in Fig. 7, the changes of the bubble diameter were almost same because the bubble relative velocity was calculated by (2.10) so that the liquid velocity rarely affected the bubble Reynolds number. Therefore, from 2D simulations, it was concluded that the CFD modeling for the bubble condensation worked well in the VOF model.
Fig. 7 Bubble diameter for the liquid velocity (Case 4-6)
IV. 3D CFD SIMULATION
A. 3D CFD Simulation Procedure In order to simulate the bubble condensation, SNU
experiment [6] was used. In the experiment, the behavior of the condensing bubble was analyzed using the actual bubble image extracted by image processing technique. Figure 8 shows that how the condensing bubble was analyzed in the experiment.
Fig. 8 Procedure of analyzing the behavior of bubble in SNU experiment
The procedure of simulating the bubble condensation
experiment is shown in Fig. 9. Firstly, the flow channel and meshes were generated using GAMBIT 2.2.30. The dimension of test channel is 15 mm×15 mm×30 mm and the flow direction is upward. The inlet and outlet of the channel are modeled as velocity-inlet and pressure-outlet, respectively. Secondly, initial conditions such as liquid temperature, liquid velocity, and image bubble were set using UDF in the FLUENT code. For the initial condition setting, local liquid temperature distribution was specified by using measured temperatures in the experiment. Local liquid velocity distribution was specified by using the velocity profile used to develop the correlation in that experiment. And asymmetric bubble image which had the same volume with the actual bubble measured in the experiment was applied. Thirdly, adapted mesh was applied to the bubble interface in order to better resolve the change of interface with minimal numerical cost. Fourthly, boundary conditions such as inlet liquid temperature and inlet liquid velocity were set by applying the measured data from the SNU experiment. And then rising bubble was simulated. However, the simulation was progressed initially without the application
of the CFD modeling for the bubble condensation. This is because it is difficult to set the initial bubble velocity as the measured bubble velocity in VOF model. The amount of condensation was affected by the bubble relative velocity. Therefore, the CFD modeling was applied after the bubble relative velocity reached to the terminal rise velocity.
Fig. 9 Procedure for the 3D bubble condensation simulation
B. CFD Modeling for the Bubble Condensation In this study, the bubble condensation phenomenon was
simulated using Kim’s condensation correlation [6] shown in Table I. Figure 10 shows the simulation results for the bubble condensation phenomenon in the subcooled boiling flow qualitatively. It is easily found that the CFD simulation results follow well the experimental results. As time goes by, vapor bubble rose up and was condensed. And the bubble deformed into the spherical shape. In addition to the bubble condensation, turbulent phenomenon was also observed. In side view, hot-water near the heater was mixed with cold-water in the center of channel as the rising bubble agitated the water.
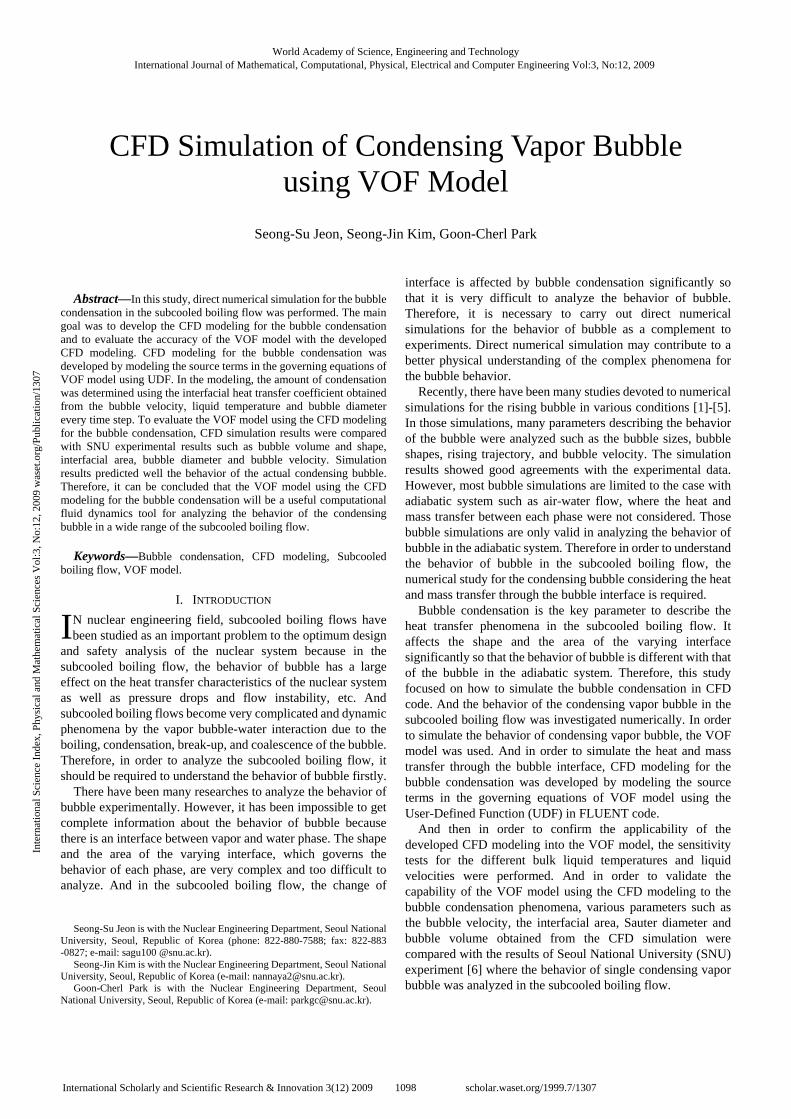
Fig. 10 Comparison of CFD simulation with experimental results In the bubble condensation simulation, emitted condensation
heat was also observed. Figure 11 shows the cross section of the condensing vapor bubble in the subcooled boiling flow. There are blue, green, red regions which indicate the subcooled water, bubble interface and vapor bubble region, respectively. In this figure, it should be noted that there is bright-blue region in the bottom of the bubble. This region implies that the condensation heat emitted from the interface heats the subcooled water near the bubble as the bubble was condensed in the subcooled boiling flow. Therefore, it can be concluded that energy source term works well in the VOF model.
World Academy of Science, Engineering and TechnologyInternational Journal of Mathematical, Computational, Physical, Electrical and Computer Engineering Vol:3, No:12, 2009
1102International Scholarly and Scientific Research & Innovation 3(12) 2009 scholar.waset.org/1999.7/1307
Inte
rnat
iona
l Sci
ence
Ind
ex, P
hysi
cal a
nd M
athe
mat
ical
Sci
ence
s V
ol:3
, No:
12, 2
009
was
et.o
rg/P
ublic
atio
n/13
07
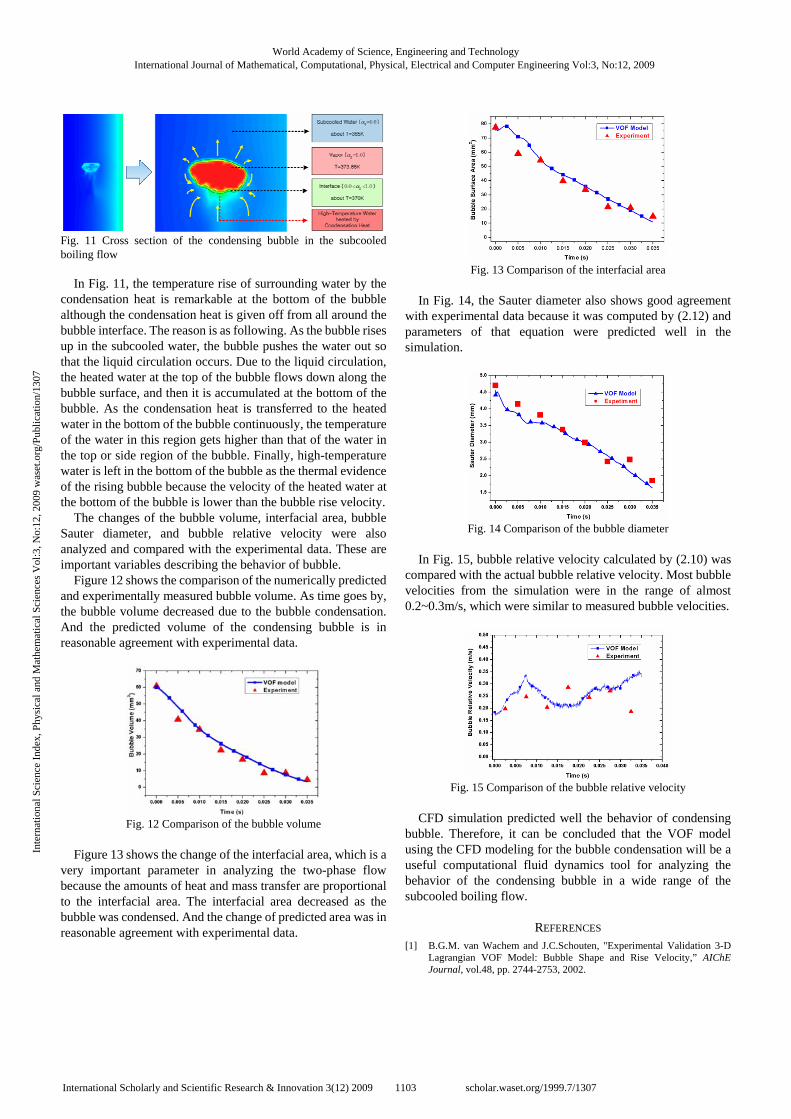
Fig. 11 Cross section of the condensing bubble in the subcooled boiling flow
In Fig. 11, the temperature rise of surrounding water by the condensation heat is remarkable at the bottom of the bubble although the condensation heat is given off from all around the bubble interface. The reason is as following. As the bubble rises up in the subcooled water, the bubble pushes the water out so that the liquid circulation occurs. Due to the liquid circulation, the heated water at the top of the bubble flows down along the bubble surface, and then it is accumulated at the bottom of the bubble. As the condensation heat is transferred to the heated water in the bottom of the bubble continuously, the temperature of the water in this region gets higher than that of the water in the top or side region of the bubble. Finally, high-temperature water is left in the bottom of the bubble as the thermal evidence of the rising bubble because the velocity of the heated water at the bottom of the bubble is lower than the bubble rise velocity.
The changes of the bubble volume, interfacial area, bubble Sauter diameter, and bubble relative velocity were also analyzed and compared with the experimental data. These are important variables describing the behavior of bubble.
Figure 12 shows the comparison of the numerically predicted and experimentally measured bubble volume. As time goes by, the bubble volume decreased due to the bubble condensation. And the predicted volume of the condensing bubble is in reasonable agreement with experimental data.
Fig. 12 Comparison of the bubble volume
Figure 13 shows the change of the interfacial area, which is a
very important parameter in analyzing the two-phase flow because the amounts of heat and mass transfer are proportional to the interfacial area. The interfacial area decreased as the bubble was condensed. And the change of predicted area was in reasonable agreement with experimental data.
Fig. 13 Comparison of the interfacial area
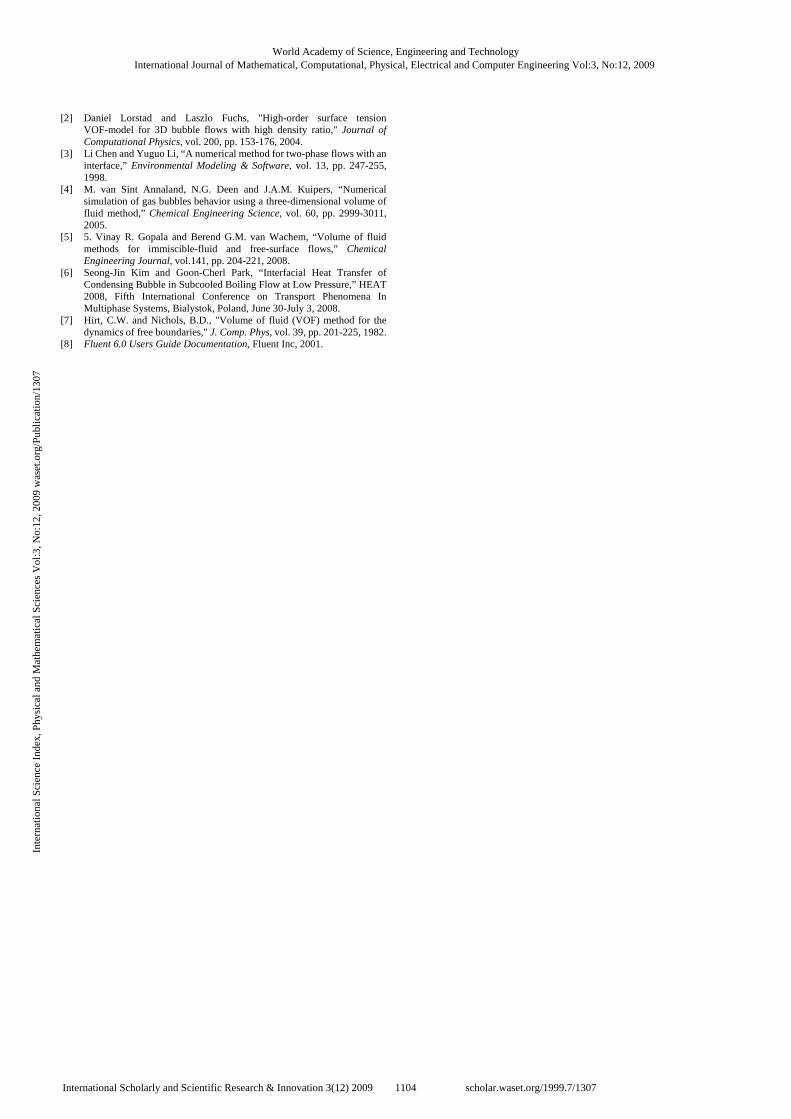
In Fig. 14, the Sauter diameter also shows good agreement
with experimental data because it was computed by (2.12) and parameters of that equation were predicted well in the simulation.
Fig. 14 Comparison of the bubble diameter
In Fig. 15, bubble relative velocity calculated by (2.10) was
compared with the actual bubble relative velocity. Most bubble velocities from the simulation were in the range of almost 0.2~0.3m/s, which were similar to measured bubble velocities.
Fig. 15 Comparison of the bubble relative velocity
CFD simulation predicted well the behavior of condensing
bubble. Therefore, it can be concluded that the VOF model using the CFD modeling for the bubble condensation will be a useful computational fluid dynamics tool for analyzing the behavior of the condensing bubble in a wide range of the subcooled boiling flow.
REFERENCES [1] B.G.M. van Wachem and J.C.Schouten, "Experimental Validation 3-D
Lagrangian VOF Model: Bubble Shape and Rise Velocity,” AIChE Journal, vol.48, pp. 2744-2753, 2002.
World Academy of Science, Engineering and TechnologyInternational Journal of Mathematical, Computational, Physical, Electrical and Computer Engineering Vol:3, No:12, 2009
1103International Scholarly and Scientific Research & Innovation 3(12) 2009 scholar.waset.org/1999.7/1307
Inte
rnat
iona
l Sci
ence
Ind
ex, P
hysi
cal a
nd M
athe
mat
ical
Sci
ence
s V
ol:3
, No:
12, 2
009
was
et.o
rg/P
ublic
atio
n/13
07
[2] Daniel Lorstad and Laszlo Fuchs, "High-order surface tension VOF-model for 3D bubble flows with high density ratio," Journal of Computational Physics, vol. 200, pp. 153-176, 2004.
[3] Li Chen and Yuguo Li, “A numerical method for two-phase flows with an interface,” Environmental Modeling & Software, vol. 13, pp. 247-255, 1998.
[4] M. van Sint Annaland, N.G. Deen and J.A.M. Kuipers, “Numerical simulation of gas bubbles behavior using a three-dimensional volume of fluid method,” Chemical Engineering Science, vol. 60, pp. 2999-3011, 2005.
[5] 5. Vinay R. Gopala and Berend G.M. van Wachem, “Volume of fluid methods for immiscible-fluid and free-surface flows,” Chemical Engineering Journal, vol.141, pp. 204-221, 2008.
[6] Seong-Jin Kim and Goon-Cherl Park, “Interfacial Heat Transfer of Condensing Bubble in Subcooled Boiling Flow at Low Pressure,” HEAT 2008, Fifth International Conference on Transport Phenomena In Multiphase Systems, Bialystok, Poland, June 30-July 3, 2008.
[7] Hirt, C.W. and Nichols, B.D., "Volume of fluid (VOF) method for the dynamics of free boundaries," J. Comp. Phys, vol. 39, pp. 201-225, 1982.
[8] Fluent 6.0 Users Guide Documentation, Fluent Inc, 2001.
World Academy of Science, Engineering and TechnologyInternational Journal of Mathematical, Computational, Physical, Electrical and Computer Engineering Vol:3, No:12, 2009
1104International Scholarly and Scientific Research & Innovation 3(12) 2009 scholar.waset.org/1999.7/1307
Inte
rnat
iona
l Sci
ence
Ind
ex, P
hysi
cal a
nd M
athe
mat
ical
Sci
ence
s V
ol:3
, No:
12, 2
009
was
et.o
rg/P
ublic
atio
n/13
07