certain frozen fish fillets from vietnam - usitc · pdf fileu.s. international trade...
TRANSCRIPT
U.S. International Trade CommissionPublication 4083 June 2009
Washington, DC 20436
Certain Frozen Fish Fillets from VietnamInvestigation No. 731-TA-1012 (Review)
U.S. International Trade Commission
COMMISSIONERS
Shara L. Aranoff, Chairman Daniel R. Pearson, Vice Chairman
Deanna Tanner Okun Charlotte R. Lane
Irving A. Williamson Dean A. Pinkert
Robert A. Rogowsky
Staff assigned
Address all communications to Secretary to the Commission
United States International Trade Commission Washington, DC 20436
Director of Operations
Elizabeth Haines, Investigator Joanna Bonarriva, Industry Analyst
Gerald Benedick, Economist David Boyland, Accountant
Michael Haldenstein, Attorney Steven Hudgens, Senior Statistician
Douglas Corkran, Supervisory Investigator
U.S. International Trade CommissionWashington, DC 20436
www.usitc.gov
Publication 4083 June 2009
Certain Frozen Fish Fillets from VietnamInvestigation No. 731-TA-1012 (Review)

i
CONTENTS
Page
Determination . . . . . . . . . . . . . . . . . . . . . . . . . . . . . . . . . . . . . . . . . . . . . . . . . . . . . . . . . . . . . . . . . . . 1Views of the Commission . . . . . . . . . . . . . . . . . . . . . . . . . . . . . . . . . . . . . . . . . . . . . . . . . . . . . . . . . 3
Part I: Introduction and overview
Background . . . . . . . . . . . . . . . . . . . . . . . . . . . . . . . . . . . . . . . . . . . . . . . . . . . . . . . . . . . . . . . . . . I-1The original investigation . . . . . . . . . . . . . . . . . . . . . . . . . . . . . . . . . . . . . . . . . . . . . . . . . . . . . . . I-2Subsequent proceedings . . . . . . . . . . . . . . . . . . . . . . . . . . . . . . . . . . . . . . . . . . . . . . . . . . . . . . . . I-2
Litigation and U.S. government findings . . . . . . . . . . . . . . . . . . . . . . . . . . . . . . . . . . . . . . . . I-2Legislative and regulatory actions . . . . . . . . . . . . . . . . . . . . . . . . . . . . . . . . . . . . . . . . . . . . . . I-3
Summary data . . . . . . . . . . . . . . . . . . . . . . . . . . . . . . . . . . . . . . . . . . . . . . . . . . . . . . . . . . . . . . . . I-3Related Title VII investigations . . . . . . . . . . . . . . . . . . . . . . . . . . . . . . . . . . . . . . . . . . . . . . . . . . I-7Statutory criteria and organization of the report . . . . . . . . . . . . . . . . . . . . . . . . . . . . . . . . . . . . . . I-8
Statutory criteria . . . . . . . . . . . . . . . . . . . . . . . . . . . . . . . . . . . . . . . . . . . . . . . . . . . . . . . . . . . I-8Organization of the report . . . . . . . . . . . . . . . . . . . . . . . . . . . . . . . . . . . . . . . . . . . . . . . . . . . . I-10
Commerce’s reviews . . . . . . . . . . . . . . . . . . . . . . . . . . . . . . . . . . . . . . . . . . . . . . . . . . . . . . . . . . . I-10Administrative reviews . . . . . . . . . . . . . . . . . . . . . . . . . . . . . . . . . . . . . . . . . . . . . . . . . . . . . . I-10New shipper reviews . . . . . . . . . . . . . . . . . . . . . . . . . . . . . . . . . . . . . . . . . . . . . . . . . . . . . . . . I-11Circumvention reviews . . . . . . . . . . . . . . . . . . . . . . . . . . . . . . . . . . . . . . . . . . . . . . . . . . . . . . I-11Changed circumstance reviews . . . . . . . . . . . . . . . . . . . . . . . . . . . . . . . . . . . . . . . . . . . . . . . . I-12Five-year review . . . . . . . . . . . . . . . . . . . . . . . . . . . . . . . . . . . . . . . . . . . . . . . . . . . . . . . . . . . I-12
Distribution of Continued Dumping and Subsidy Offset Act funds . . . . . . . . . . . . . . . . . . . . . . . I-13The subject merchandise . . . . . . . . . . . . . . . . . . . . . . . . . . . . . . . . . . . . . . . . . . . . . . . . . . . . . . . . I-15
Commerce’s scope . . . . . . . . . . . . . . . . . . . . . . . . . . . . . . . . . . . . . . . . . . . . . . . . . . . . . . . . . . I-15Tariff treatment . . . . . . . . . . . . . . . . . . . . . . . . . . . . . . . . . . . . . . . . . . . . . . . . . . . . . . . . . . . . I-15
The domestic like product . . . . . . . . . . . . . . . . . . . . . . . . . . . . . . . . . . . . . . . . . . . . . . . . . . . . . . . I-16Description . . . . . . . . . . . . . . . . . . . . . . . . . . . . . . . . . . . . . . . . . . . . . . . . . . . . . . . . . . . . . . . I-16
The production process . . . . . . . . . . . . . . . . . . . . . . . . . . . . . . . . . . . . . . . . . . . . . . . . . . . . . . I-16 Farming . . . . . . . . . . . . . . . . . . . . . . . . . . . . . . . . . . . . . . . . . . . . . . . . . . . . . . . . . . . . . . . I-16
Processing . . . . . . . . . . . . . . . . . . . . . . . . . . . . . . . . . . . . . . . . . . . . . . . . . . . . . . . . . . . . . . I-17U.S. market participants . . . . . . . . . . . . . . . . . . . . . . . . . . . . . . . . . . . . . . . . . . . . . . . . . . . . . . . . I-18
U.S. farmers . . . . . . . . . . . . . . . . . . . . . . . . . . . . . . . . . . . . . . . . . . . . . . . . . . . . . . . . . . . . . . . I-18U.S. processors . . . . . . . . . . . . . . . . . . . . . . . . . . . . . . . . . . . . . . . . . . . . . . . . . . . . . . . . . . . . I-19U.S. importers . . . . . . . . . . . . . . . . . . . . . . . . . . . . . . . . . . . . . . . . . . . . . . . . . . . . . . . . . . . . . I-22U.S. purchasers . . . . . . . . . . . . . . . . . . . . . . . . . . . . . . . . . . . . . . . . . . . . . . . . . . . . . . . . . . . . I-23
Apparent U.S. consumption and market shares . . . . . . . . . . . . . . . . . . . . . . . . . . . . . . . . . . . . . . I-23
Part II: Conditions of competition in the U.S. market
U.S. channels of distribution . . . . . . . . . . . . . . . . . . . . . . . . . . . . . . . . . . . . . . . . . . . . . . . . . . . . . II-1U.S. market characteristics . . . . . . . . . . . . . . . . . . . . . . . . . . . . . . . . . . . . . . . . . . . . . . . . . . . . . II-1
Information on suppliers of certain frozen fish fillets . . . . . . . . . . . . . . . . . . . . . . . . . . . . . . . II-4Supply and demand considerations . . . . . . . . . . . . . . . . . . . . . . . . . . . . . . . . . . . . . . . . . . . . . . . . II-5
U.S. supply . . . . . . . . . . . . . . . . . . . . . . . . . . . . . . . . . . . . . . . . . . . . . . . . . . . . . . . . . . . . . . . II-5U.S. demand . . . . . . . . . . . . . . . . . . . . . . . . . . . . . . . . . . . . . . . . . . . . . . . . . . . . . . . . . . . . . . II-10
ii
CONTENTS
Page
Part II: Conditions of competition in the U.S. market–ContinuedSubstitutability issues . . . . . . . . . . . . . . . . . . . . . . . . . . . . . . . . . . . . . . . . . . . . . . . . . . . . . . . . . . II-17
Factors affecting purchasing decisions . . . . . . . . . . . . . . . . . . . . . . . . . . . . . . . . . . . . . . . . . . II-20Comparisons of the domestic products, subject imports from Vietnam, and subject products from third countries . . . . . . . . . . . . . . . . . . . . . . . . . . . . . . . . . . . . . . . . . . . . . . . . II-22
Elasticity estimates . . . . . . . . . . . . . . . . . . . . . . . . . . . . . . . . . . . . . . . . . . . . . . . . . . . . . . . . . . . . II-27U.S. supply elasticity . . . . . . . . . . . . . . . . . . . . . . . . . . . . . . . . . . . . . . . . . . . . . . . . . . . . . . . . II-27U.S. demand elasticity . . . . . . . . . . . . . . . . . . . . . . . . . . . . . . . . . . . . . . . . . . . . . . . . . . . . . . . II-27Substitution elasticity . . . . . . . . . . . . . . . . . . . . . . . . . . . . . . . . . . . . . . . . . . . . . . . . . . . . . . . II-28
Part III: Condition of the U.S. industry
Overview . . . . . . . . . . . . . . . . . . . . . . . . . . . . . . . . . . . . . . . . . . . . . . . . . . . . . . . . . . . . . . . . . . . . III-1Background . . . . . . . . . . . . . . . . . . . . . . . . . . . . . . . . . . . . . . . . . . . . . . . . . . . . . . . . . . . . . . . III-1Changes experienced in operations . . . . . . . . . . . . . . . . . . . . . . . . . . . . . . . . . . . . . . . . . . . . . III-1Anticipated changes in existing operations . . . . . . . . . . . . . . . . . . . . . . . . . . . . . . . . . . . . . . . III-1
U.S. processors’ capacity, production, and capacity utilization . . . . . . . . . . . . . . . . . . . . . . . . . . III-2Constraints on capacity . . . . . . . . . . . . . . . . . . . . . . . . . . . . . . . . . . . . . . . . . . . . . . . . . . . . . . III-2Alternative products . . . . . . . . . . . . . . . . . . . . . . . . . . . . . . . . . . . . . . . . . . . . . . . . . . . . . . . . III-2
U.S. processors’ domestic shipments, company transfers, and export shipments . . . . . . . . . . . . III-3U.S. processors’ inventories . . . . . . . . . . . . . . . . . . . . . . . . . . . . . . . . . . . . . . . . . . . . . . . . . . . . III-5U.S. processors’ imports and purchases . . . . . . . . . . . . . . . . . . . . . . . . . . . . . . . . . . . . . . . . . . . . III-5U.S. processors’ employment, wages, and productivity . . . . . . . . . . . . . . . . . . . . . . . . . . . . . . . III-5Financial experience of the U.S. processors . . . . . . . . . . . . . . . . . . . . . . . . . . . . . . . . . . . . . . . . III-7
Background . . . . . . . . . . . . . . . . . . . . . . . . . . . . . . . . . . . . . . . . . . . . . . . . . . . . . . . . . . . . . . . III-7Processors’ operations on frozen catfish fillets . . . . . . . . . . . . . . . . . . . . . . . . . . . . . . . . . . . . III-7Research and development expenses, capital expenditures, assets, and return on investment III-15
Part IV: U.S. imports and the foreign industry
U.S. imports . . . . . . . . . . . . . . . . . . . . . . . . . . . . . . . . . . . . . . . . . . . . . . . . . . . . . . . . . . . . . . . . . IV-1Leading nonsubject sources of imports . . . . . . . . . . . . . . . . . . . . . . . . . . . . . . . . . . . . . . . . . . . . . IV-3U.S. importers’ inventories . . . . . . . . . . . . . . . . . . . . . . . . . . . . . . . . . . . . . . . . . . . . . . . . . . . . . . IV-3The industry in Vietnam . . . . . . . . . . . . . . . . . . . . . . . . . . . . . . . . . . . . . . . . . . . . . . . . . . . . . . . . IV-5
Overview . . . . . . . . . . . . . . . . . . . . . . . . . . . . . . . . . . . . . . . . . . . . . . . . . . . . . . . . . . . . . . . . . IV-5Basa and tra operations in Vietnam . . . . . . . . . . . . . . . . . . . . . . . . . . . . . . . . . . . . . . . . . . . . IV-6
Global market . . . . . . . . . . . . . . . . . . . . . . . . . . . . . . . . . . . . . . . . . . . . . . . . . . . . . . . . . . . . . . . . IV-9Supply considerations . . . . . . . . . . . . . . . . . . . . . . . . . . . . . . . . . . . . . . . . . . . . . . . . . . . . . . . IV-10Demand considerations . . . . . . . . . . . . . . . . . . . . . . . . . . . . . . . . . . . . . . . . . . . . . . . . . . . . . . IV-11Prices . . . . . . . . . . . . . . . . . . . . . . . . . . . . . . . . . . . . . . . . . . . . . . . . . . . . . . . . . . . . . . . . . . . . IV-13
iii
CONTENTS
Page
Part V: Pricing and related information
Factors affecting pricing . . . . . . . . . . . . . . . . . . . . . . . . . . . . . . . . . . . . . . . . . . . . . . . . . . . . . . . . V-1Raw material costs . . . . . . . . . . . . . . . . . . . . . . . . . . . . . . . . . . . . . . . . . . . . . . . . . . . . . . . . . V-1Tariff rates and transportation costs to the U.S. market . . . . . . . . . . . . . . . . . . . . . . . . . . . . . V-4U.S. inland transportation costs . . . . . . . . . . . . . . . . . . . . . . . . . . . . . . . . . . . . . . . . . . . . . . . . V-4Exchange rates . . . . . . . . . . . . . . . . . . . . . . . . . . . . . . . . . . . . . . . . . . . . . . . . . . . . . . . . . . . . . V-6
Pricing practices . . . . . . . . . . . . . . . . . . . . . . . . . . . . . . . . . . . . . . . . . . . . . . . . . . . . . . . . . . . . . . V-7Price data . . . . . . . . . . . . . . . . . . . . . . . . . . . . . . . . . . . . . . . . . . . . . . . . . . . . . . . . . . . . . . . . . . . V-10
Price trends . . . . . . . . . . . . . . . . . . . . . . . . . . . . . . . . . . . . . . . . . . . . . . . . . . . . . . . . . . . . . . . V-20Price comparisons . . . . . . . . . . . . . . . . . . . . . . . . . . . . . . . . . . . . . . . . . . . . . . . . . . . . . . . . . . V-22Unit sales values and quantities of U.S. frozen and fresh catfish fillets . . . . . . . . . . . . . . . . . V-23
Appendixes
A. Federal Register notices and statement on adequacy . . . . . . . . . . . . . . . . . . . . . . . . . . . . . . . . A-1B. Hearing witnesses . . . . . . . . . . . . . . . . . . . . . . . . . . . . . . . . . . . . . . . . . . . . . . . . . . . . . . . . . . . B-1C. Summary data . . . . . . . . . . . . . . . . . . . . . . . . . . . . . . . . . . . . . . . . . . . . . . . . . . . . . . . . . . . . . . . C-1D. Comments by U.S. producers, importers, purchasers, and foreign producers regarding the
effects of the orders and the likely effects of revocation . . . . . . . . . . . . . . . . . . . . . . . . . . . D-1E. Questionnaire responses of U.S. processors and purchasers discussing the effects of
changes in prices of raw materials and other factors on domestic processors . . . . . . . . . . . E-1F. Overview of variance calculation . . . . . . . . . . . . . . . . . . . . . . . . . . . . . . . . . . . . . . . . . . . . . . . . F-1
Note.–Information that would reveal confidential operations of individual concerns may not be publishedand therefore has been deleted from this report. Such deletions are indicated by asterisks.

1 The record is defined in sec. 207.2(f) of the Commission’s Rules of Practice and Procedure (19 CFR § 207.2(f)).
UNITED STATES INTERNATIONAL TRADE COMMISSION
Investigation No. 731-TA-1012 (Review)
CERTAIN FROZEN FISH FILLETS FROM VIETNAM
DETERMINATION
On the basis of the record1 developed in the subject five-year review, the United StatesInternational Trade Commission (Commission) determines, pursuant to section 751(c) of the Tariff Act of1930 (19 U.S.C. § 1675(c)), that revocation of the antidumping duty order on certain frozen fish filletsfrom Vietnam would be likely to lead to continuation or recurrence of material injury to an industry in theUnited States within a reasonably foreseeable time.
BACKGROUND
The Commission instituted this review on July 1, 2008 (73 F.R. 37487) and determined onOctober 6, 2008 that it would conduct a full review (73 F.R. 62318, October 20, 2008). Notice of thescheduling of the Commission’s review and of a public hearing to be held in connection therewith wasgiven by posting copies of the notice in the Office of the Secretary, U.S. International Trade Commission,Washington, DC, and by publishing the notice in the Federal Register on January 15, 2009 (74 F.R.2616). The hearing was held in Washington, DC, on May 6, 2009, and all persons who requested theopportunity were permitted to appear in person or by counsel.

1 Certain Frozen Fish Fillets, Inv. No. 731-TA-1012 (Final), USITC Pub. 3617 (August 2003) (“OriginalDetermination”) at 3. 2 Antidumping Duty Order: Certain Frozen Fish Fillets from Vietnam, 68 Fed. Reg. 47909 (Aug. 12, 2003). 3 Certain Frozen Fish Fillets From Vietnam, 73 Fed. Reg. 37487 (July 1, 2008). 4 See Explanation of Commission Determination on Adequacy. On February 5, 2009, the Domestic Parties askedthe Commission to reconsider its adequacy determination and decision to conduct a full review because of VASEP’swithdrawal as a party. On February 13, 2009, the Commission rejected the request for reconsideration. Letter fromthe Commission (Feb. 13, 2009). 5 Confidential Staff Report, INV-GG-046 (June 1, 2009), as amended by INV-GG-048 (June 8, 2009) (“CR”) atI-12, Table I-8; Public Report (“PR”) at I-10, Table I-8. Four U.S. processors ceased production during the periodexamined, two U.S. processors merged to form a new company, and one processor closed several plants. CR at I-25;PR at I-19. 6 CR at I-28, IV-1; PR at I-22, IV-1.
3
VIEWS OF THE COMMISSION
Based on the record in this five-year review, we determine under section 751(c) of the Tariff Actof 1930, as amended (“the Tariff Act”), that revocation of the antidumping duty order on imports ofcertain frozen fish fillets from Vietnam would be likely to lead to continuation or recurrence of materialinjury to an industry in the United States within a reasonably foreseeable time.
I. BACKGROUND
In August 2003, the Commission determined that an industry in the United States was materiallyinjured by reason of imports of certain frozen fish fillets sold at less than fair value from Vietnam.1 Commerce then issued an antidumping duty order on imports of certain frozen fish fillets from Vietnamon August 12, 2003.2
The Commission instituted this review on July 1, 2008; the Commission received twosubmissions in response to its notice of institution.3 The first response was filed on behalf of the CatfishFarmers of America and the following U.S. catfish processors: America’s Catch, Inc; ConsolidatedCatfish Companies, LLC, dba Country Select Catfish; Delta Pride Catfish, Inc.; Alabama Catfish Inc., dbaHarvest Select Catfish, Inc.; TT&W Farm Products, Inc., dba Heartland Catfish Co.; MagnoliaProcessing, Inc., dba Pride of the Pond; Simmons Farm Raised Catfish, Inc.; and Southern Pride CatfishCo. LLC (collectively referred to as “Domestic Parties”). The second response was filed on behalf of theVietnam Association of Seafood Exporters and Producers (“VASEP”) and 24 participating membercompanies that produce and/or export the subject merchandise.
On October 6, 2008, the Commission found the domestic interested party and respondentinterested party responses to the notice of institution to be adequate, and it determined that it wouldconduct a full review pursuant to section 751(c)(3) of the Tariff Act of 1930, as amended.4 Only theDomestic Parties, however, filed briefs with the Commission and appeared at the Commission's publichearing.
Fourteen of 20 active U.S. processors of frozen catfish fillets, accounting for 82.4 percent of U.S.shipments in 2008, provided usable financial information.5 The Commission received importers’questionnaires from 11 firms regarding imports of certain frozen fish fillets; these firms accounted for ***percent of subject imports in 2008.6 Although only one foreign producer accounting for a very smallportion of production in Vietnam provided a questionnaire response, the Commission received export
7 CR at IV-10; PR at IV-7; VASEP’s response to the notice of institution at 3; and VASEP’s submission of March9, 2009, “Introduction: About VASEP.” 8 CR at I-30; PR at I-23. 9 CR at V-13; PR at V-10. 10 19 U.S.C. § 1677(4)(A). 11 19 U.S.C. § 1677(10); see, e.g., Cleo, Inc. v. United States, 501 F.3d 1291, 1299 (Fed. Cir. 2007); NEC Corp.v. Department of Commerce, 36 F. Supp. 2d 380, 383 (Ct. Int’l Trade 1998); Nippon Steel Corp. v. United States, 19CIT 450, 455 (1995); Timken Co. v. United States, 913 F. Supp. 580, 584 (Ct. Int’l Trade 1996); Torrington Co. v.United States, 747 F. Supp. 744, 748-49 (Ct. Int’l Trade 1990), aff’d, 938 F.2d 1278 (Fed. Cir. 1991); see also S.Rep. No. 249, 96th Cong., 1st Sess. 90-91 (1979). 12 See, e.g., Internal Combustion Industrial Forklift Trucks From Japan, Inv. No. 731-TA-377 (Second Review),USITC Pub. 3831 at 8-9 (Dec. 2005); Crawfish Tail Meat From China, Inv. No. 731-TA-752 (Review), USITC Pub.3614 at 4 (Jul. 2003); Steel Concrete Reinforcing Bar From Turkey, Inv. No. 731-TA-745 (Review), USITC Pub.3577 at 4 (Feb. 2003).
4
data from VASEP representing a substantial share of Vietnamese production and exports.7 Twenty-sixpurchasers of the subject imports and/or frozen catfish fillets also provided questionnaire responses.8
U.S. processors provided pricing data accounting for 43.9 percent of U.S. commercial shipmentsof frozen catfish fillets, and importers provided data accounting for 27.3 percent of total subject importsfrom Vietnam during the period for which the Commission requested data (2003-2008).9
II. DOMESTIC LIKE PRODUCT
In making its determination under section 751(c) of the Tariff Act, the Commission defines “thedomestic like product” and the “industry.”10 The Tariff Act defines “domestic like product” as “a productwhich is like, or in the absence of like, most similar in characteristics and uses with, the article subject toan investigation under this subtitle.”11 The Commission’s practice in five-year reviews is to look to thelike product definition from the original determination and any previous reviews and consider whether therecord indicates any reason to revisit that definition.12
A. Product Description
In its expedited sunset determination, Commerce defined the subject merchandise as follows:
The product covered by this Order is frozen fish fillets, including regular, shank, and stripfillets and portions thereof, whether or not breaded or marinated, of the species PangasiusBocourti, Pangasius Hypophthalmus (also known as Pangasius Pangasius), and PangasiusMicronemus. Frozen fish fillets are lengthwise cuts of whole fish. The fillet productscovered by the scope include boneless fillets with the belly flap intact (“regular” fillets),boneless fillets with the belly flap removed (“shank” fillets), boneless shank fillets cutinto strips (“fillet strips/finger”), which include fillets cut into strips, chunks, blocks,skewers, or any other shape. Specifically excluded from the scope are frozen whole fish(whether or not dressed), frozen steaks, and frozen belly-flap nuggets. Frozen wholedressed fish are deheaded, skinned, and eviscerated. Steaks are bone-in, cross-sectioncuts of dressed fish. Nuggets are the belly-flaps. The subject merchandise will behereinafter referred to as frozen “basa” and “tra” fillets, which are the Vietnamesecommon names for these species of fish. These products are classifiable under tariffarticle codes 1604.19.4000, 1604.19.5000, 0305.59.4000, 0304.29.6033 (Frozen FishFillets of the species Pangasius including basa and tra) of the Harmonized TariffSchedule of the United States (“HTSUS”). This Order covers all frozen fish fillets
13 Certain Frozen Fish Fillets From the Socialist Republic of Vietnam: Notice of Final Results of ExpeditedSunset Review of Antidumping Duty Order, 74 Fed. Reg. 5819-20 (Feb. 2, 2009). 14 CR at IV-8; PR at IV-6. 15 CR at I-21; PR at I-17. 16 CR at I-19; PR at I-16. 17 CR at I-19; PR at I-16. 18 CR at IV-13; PR at IV-10. 19 Original Determination, USITC Pub. 3617 at 5. 20 Original Determination, USITC Pub. 3617 at 5. 21 Original Determination, USITC Pub. 3617 at 5. The Commission also noted that it had included catfish filletsthat were breaded and marinated in the definition of the domestic like product. The Commission found thatsimilarities in physical characteristics and uses, channels of distribution, production processes and employees, andprice all supported inclusion of breaded and marinated frozen fillets in the definition of the domestic like product. Original Determination, USITC Pub. 3617 at 6 n. 20. 22 Original Determination, USITC Pub. 3617 at 5. In the final phase of the investigation, the Commissioncollected information on competition among the subject imports, domestic frozen catfish fillets, and other types offrozen fish fillets, including tilapia. It found, however, that the additional information concerning other types offrozen fish fillets did not indicate that including such products in the definition of the domestic like product would beappropriate. In particular, it declined to expand the like product beyond the scope of the investigation to includetilapia, because tilapia was not sold as a frozen product. Original Determination, USITC Pub. 3617 at 6 n. 21.
5
meeting the above specification, regardless of tariff classification. Although the HTSUSsubheading is provided for convenience and customs purposes, our written description ofthe scope of the Order is dispositive.13
Commerce’s scope definition for the subject frozen fish fillets is essentially unchanged from itsoriginal scope determination. “Basa” and “tra,” the common names for the species Pangasius Bocourtiand Pangasius Hypophthalmus, respectively,14 are farm-raised in cages on the Mekong River in Vietnamand are transported downriver in cage boats to processing facilities for processing into the frozen filletsthat are the subject merchandise. They are deheaded, eviscerated, filleted, and frozen.15 A fillet is one oftwo sides of a fish with head, tail, bones, and entrails removed.16 Although basa, tra, and domestic catfishbelong to different families of freshwater fish, they are all considered mild-tasting white-fleshed fish ofcomparable size fillets.17 The species of catfish farm-raised in the United States, catfish of the familyIctaluridae, is not raised in Vietnam.18
B. Analysis and Conclusion
In the original investigation, the Commission found that there was no domestic product that was“like” the subject imports, so the Commission found a domestic like product that was “most similar” interms of physical characteristics and uses.19 The Commission found that the record indicated that basa, tra, and domestic catfish are all freshwater white fish, with similar 6-month shelf lives when frozen,similar texture, and a neutral/mild flavor.20 Further, it found that basa, tra, and domestic catfish are alltypically individually quick frozen, packaged in 15-pound boxes, and sold in the same size increments,primarily to the food service industry and secondarily to restaurants. As additional support, theCommission noted that during the original investigation frozen basa and tra fillets from Vietnam werewidely marketed, sold, and even labeled in the United States as “catfish” under product names similar toU.S. catfish producers’ products or that implied domestic origin.21 For these reasons, the Commissionconcluded that frozen catfish fillets were the product most similar to the subject imports of frozen basaand tra fillets.22
23 Domestic Parties’ Prehearing Brief at 8. 24 Purchasers indicated that tilapia is considered a substitute for frozen fish fillets. CR at II-3, II-22; PR at I-2, II-15. There is reportedly no U.S. production, however, of frozen tilapia fillets. See Public Hearing Transcript (“Tr.”)at 121 (trout reported to be the only other farm-raised freshwater fish processed into frozen fillets). This isconsistent with the information obtained in the original investigation. Original Determination, USITC Pub. 3617 at6 n.21 (indicating tilapia is farm-raised in the United States, but not processed into frozen fillets). 25 19 U.S.C. § 1677(4)(A). The definitions in 19 U.S.C. § 1677 are applicable to the entire subtitle containing theantidumping and countervailing duty laws, including 19 U.S.C. §§ 1675 and 1675a. See 19 U.S.C. § 1677. Thereare no related party issues in this review. The related party provision provides that producers that are related to anexporter or importer of subject merchandise or which are themselves importers may be excluded in appropriatecircumstances. 19 U.S.C. § 1677(4)(B). 26 In the original investigation, the Commission considered whether to include catfish farmers in the domesticindustry, along with the processors, pursuant to the processed agricultural product provision. 19 U.S.C.§1677(4)(E)(i). The Commission, however, determined that the first prong of the statute, the “continuous line ofproduction” test, was not satisfied because the raw agricultural product was not “substantially or completely devotedto the production of the processed agricultural product.” 19 U.S.C. § 1677(4)(E)(ii). The Commission noted that thelegislative history indicated that the “substantially or completely” language of the statute defining a continuous lineof production should be interpreted to mean “all or almost all.” Original Determination, USITC Pub. 3617 at 8 n. 30(citing H.R. Rep. 40, Part I, 100th Cong. 1st Sess. (1987) at 121). The Commission found that only about one-halfof the fresh raw catfish was devoted to frozen catfish fillets, with the remaining portion devoted to products such asfresh fillets, fresh and frozen steaks, and nuggets. 27 The information collected in this review indicates that 23 percent of the weight of the U.S. farm-raised livecatfish that processors used was processed into frozen fillets, 29 percent was processed into other products, and 48percent was offal (unused parts of the fish that were mostly sold for use in fish meal, fertilizer, and oil). CR at I-21;PR at I-17. Thus, less than half (or much less if the offal is considered a product) of the raw catfish is used forfrozen catfish fillets.
6
In this review, the Domestic Parties have indicated that they agree with the Commission’sdefinition of the domestic like product in the original investigation.23 Moreover, there is no newinformation obtained during this review that would suggest any reason to revisit the Commission’sdomestic like product definition from the original investigation.24 Consistent with our domestic likeproduct definition in the original investigation, we define the domestic like product as frozen catfishfillets, whether plain, breaded, or marinated.
III. DOMESTIC INDUSTRY
Section 771(4)(A) of the Tariff Act defines the relevant industry as the domestic “producers as a{w}hole of a domestic like product, or those producers whose collective output of a domestic like productconstitutes a major proportion of the total domestic production of the product.”25 In defining the domesticindustry, the Commission’s general practice has been to include in the industry producers of all domesticproduction of the like product, whether toll-produced, captively consumed, or sold in the domesticmerchant market. Based on our finding that the domestic like product is frozen catfish fillets, whetherbreaded or marinated, we define a single domestic industry consisting of all domestic producers of thedomestic like product.
As we did in the original investigation, we have also considered whether to include catfishfarmers in the domestic industry pursuant to the processed agricultural product provision of the statute.26 The information collected in this review again indicates that the statutory test is not satisfied.27 We do,however, consider the relationship and interdependence of catfish farmers and processors to be animportant condition of competition, and we address this point further in our discussion of the conditionsof competition.
28 19 U.S.C. § 1675a(a). 29 SAA at 883-84. The SAA states that “{t}he likelihood of injury standard applies regardless of the nature of theCommission’s original determination (material injury, threat of material injury, or material retardation of anindustry). Likewise, the standard applies to suspended investigations that were never completed.” Id. at 883. 30 Although the SAA states that “a separate determination regarding current material injury is not necessary,” itindicates that “the Commission may consider relevant factors such as current and likely continued depressedshipment levels and current and likely continued {sic} prices for the domestic like product in the U.S. market inmaking its determination of the likelihood of continuation or recurrence of material injury if the order is revoked.” SAA at 884. 31 See NMB Singapore Ltd. v. United States, 288 F. Supp. 2d 1306, 1352 (Ct. Int’l Trade 2003) (“‘likely’ meansprobable within the context of 19 U.S.C. § 1675(c) and 19 U.S.C. § 1675a(a)”), aff’d mem., 140 Fed. Appx. 268(Fed. Cir. 2005); Nippon Steel Corp. v. United States, 26 CIT 1416, 1419 (2002) (same); Usinor Industeel, S.A. v.United States, 26 CIT 1402, 1404 nn.3, 6 (2002) (“more likely than not” standard is “consistent with the court’sopinion”; “the court has not interpreted ‘likely’ to imply any particular degree of ‘certainty’”); Indorama Chemicals(Thailand) Ltd. v. United States, Slip Op. 02-105 at 20 (Ct. Int’l Trade Sept. 4, 2002) (“standard is based on alikelihood of continuation or recurrence of injury, not a certainty”); Usinor v. United States, 26 CIT 767, 794 (2002)(“‘likely’ is tantamount to ‘probable,’ not merely ‘possible’”). 32 For a complete statement of Commissioner Okun’s interpretation of the likely standard, see Additional Viewsof Vice Chairman Deanna Tanner Okun Concerning the “Likely” Standard in Certain Seamless Carbon and AlloySteel Standard, Line and Pressure Pipe From Argentina, Brazil, Germany, and Italy, Invs. Nos. 701-TA-362(Review) and 731-TA-707 to 710 (Review) (Remand), USITC Pub. 3754 (Feb. 2005). 33 Commissioner Lane notes that, consistent with her views in Pressure Sensitive Plastic Tape From Italy, Inv.No. AA1921-167 (Second Review), USITC Pub. 3698 (June 2004), she does not concur with the U.S. Court ofInternational Trade’s interpretation of “likely,” but she will apply the Court’s standard in these reviews and allsubsequent reviews until either Congress clarifies the meaning or the U.S. Court of Appeals for the Federal Circuitaddresses this issue.
7
IV. LIKELIHOOD OF CONTINUATION OR RECURRENCE OF MATERIAL INJURY IFTHE ANTIDUMPING DUTY ORDER ON CERTAIN FROZEN FISH FILLETS FROMVIETNAM WERE REVOKED
For the reasons stated below, we determine that revocation of the antidumping duty order onsubject imports from Vietnam would be likely to lead to continuation or recurrence of material injury tothe domestic industry producing frozen catfish fillets within a reasonably foreseeable time.
A. Legal Standards
In five-year reviews conducted under section 751(c) of the Tariff Act, Commerce will revoke anantidumping or countervailing duty order unless (1) it makes a determination that dumping orsubsidization is likely to continue or recur and (2) the Commission makes a determination that revocationof the antidumping or countervailing duty order “would be likely to lead to continuation or recurrence ofmaterial injury within a reasonably foreseeable time.”28 The Statement of Administrative Actionaccompanying the Uruguay Round Agreements Act, H.R. Rep. No. 103-316 (1994) (“SAA”) states that“under the likelihood standard, the Commission will engage in a counterfactual analysis; it must decidethe likely impact in the reasonably foreseeable future of an important change in the status quo – therevocation or termination of a proceeding and the elimination of its restraining effects on volumes andprices of imports.”29 Thus, the likelihood standard is prospective in nature.30 The U.S. Court ofInternational Trade has found that “likely,” as used in the five-year review provisions of the Tariff Act,means “probable,” and the Commission applies that standard in five-year reviews.31 32 33
34 19 U.S.C. § 1675a(a)(5). 35 SAA at 887. Among the factors that the Commission should consider in this regard are “the fungibility ordifferentiation within the product in question, the level of substitutability between the imported and domesticproducts, the channels of distribution used, the methods of contracting (such as spot sales or long-term contracts),and lead times for delivery of goods, as well as other factors that may only manifest themselves in the longer term,such as planned investment and the shifting of production facilities.” Id. 36 19 U.S.C. § 1675a(a)(1). 37 19 U.S.C. § 1675a(a)(1). 38 19 U.S.C. § 1675a(a)(5). Although the Commission must consider all factors, no one factor is necessarilydispositive. SAA at 886. 39 19 U.S.C. § 1677e(a) authorizes the Commission to “use the facts otherwise available” in reaching adetermination when (1) necessary information is not available on the record or (2) an interested party or any otherperson withholds information requested by the agency, fails to provide such information in the time or in the form ormanner requested, significantly impedes a proceeding, or provides information that cannot be verified pursuant to19 U.S.C. § 1677m(i). The verification requirements in 19 U.S.C. § 1677m(i) are applicable only to Commerce. SeeTitanium Metals Corp. v. United States, 155 F. Supp. 2d 750, 765 (Ct. Int’l Trade 2002) (“the ITC correctlyresponds that Congress has not required the Commission to conduct verification procedures for the evidence beforeit, or provided a minimum standard by which to measure the thoroughness of Commission investigations.”). 40 Commissioner Okun notes that the statute authorizes the Commission to take adverse inferences in five-yearreviews, but such authorization does not relieve the Commission of its obligation to consider the record evidence asa whole in making its determination. See 19 U.S.C. § 1677e. She generally gives credence to the facts supplied bythe participating parties and certified by them as true, but bases her decision on the evidence as a whole, and doesnot automatically accept participating parties’ suggested interpretations of the record evidence. Regardless of thelevel of participation, the Commission is obligated to consider all evidence relating to each of the statutory factorsand may not draw adverse inferences that render such analysis superfluous. “In general, the Commission makesdeterminations by weighing all of the available evidence regarding a multiplicity of factors relating to the domesticindustry as a whole and by drawing reasonable inferences from the evidence it finds most persuasive.” SAA at 869.
8
The statute states that “the Commission shall consider that the effects of revocation or terminationmay not be imminent, but may manifest themselves only over a longer period of time.”34 According tothe SAA, a “‘reasonably foreseeable time’ will vary from case-to-case, but normally will exceed the‘imminent’ timeframe applicable in a threat of injury analysis in original investigations.”35
Although the standard in a five-year review is not the same as the standard applied in originalantidumping and countervailing duty investigations, it contains some of the same fundamental elements. The statute provides that the Commission is to “consider the likely volume, price effect, and impact ofimports of the subject merchandise on the industry if the orders are revoked or the suspendedinvestigation is terminated.”36 It directs the Commission to take into account its prior injurydetermination, whether any improvement in the state of the industry is related to the order or thesuspension agreement under review, whether the industry is vulnerable to material injury if the order isrevoked or the suspension agreement is terminated, and any findings by Commerce regarding dutyabsorption pursuant to 19 U.S.C. § 1675(a)(4).37 The statute further provides that the presence or absenceof any factor that the Commission is required to consider shall not necessarily give decisive guidancewith respect to the Commission’s determination.38
Because we have limited information concerning the Vietnamese basa/tra industry, we have reliedon the facts otherwise available when appropriate in this review, which consist primarily of informationfrom the original investigation, information submitted in this five-year review (which includes export datafrom VASEP), and information available from published sources.39 40
41 19 U.S.C. § 1675a(a)(4). 42 Original Determination, USITC Pub. 3617 at 10. 43 Original Determination, USITC Pub. 3617 at 11. 44 Original Determination, USITC Pub. 3617 at 11. 45 Original Determination, USITC Pub. 3617 at 11. 46 Original Determination, USITC Pub. 3617 at 11. 47 Original Determination, USITC Pub. 3617 at 11. 48 Original Determination, USITC Pub. 3617 at 11. 49 Original Determination, USITC Pub. 3617 at 12.
9
B. Conditions of Competition and the Business Cycle
In evaluating the likely impact of the subject imports on the domestic industry, the statute directsthe Commission to consider all relevant economic factors “within the context of the business cycle andconditions of competition that are distinctive to the affected industry.”41
1. Original Investigation
In the original investigation, which covered the full years 2000-2002 and interim period January-March 2003, the Commission found the following conditions of competition relevant to its material injuryanalysis.
The Commission noted that demand for frozen fillets of catfish, basa, and tra had expandedgreatly and this long-term trend had continued during the period examined. Subject imports were largelyabsent from the U.S. market prior to 1999, but were an increasingly significant source of supply.Nonsubject sources were consistently less than one percent of apparent U.S. consumption.42
The Commission found that, although they were not identical, basa, tra, and catfish generallywere similar in appearance, texture, and taste when processed into fillets. Domestic catfish fillets and thesubject imports were in the two- to nine-ounce range and were sold frozen in 15-pound boxes.43 Individual importers and domestic producers reported that the subject imports and the domestic likeproduct were used interchangeably. In addition, many purchasers reported that the domestic like productand the subject imports were substitutable.44
The Commission found that frozen basa and tra fillets from Vietnam were marketed and sold inthe United States as “catfish,” and even labeled as such, until legislation curbed, but did not eliminate,this practice.45 The domestic producers and catfish farmers had campaigned at the state and federal levelsfor changes in the labeling requirements for catfish in order to ensure that basa and tra from Vietnam werenot labeled as catfish. The Commission noted that section 755 of the Agriculture, Rural Development,Food and Drug Administration, and Related Agencies Appropriations Act for 2002 provided thateffective November 28, 2001, “[n]one of the funds appropriated or otherwise made available by this Actto the Food and Drug Administration shall be used to allow admission of fish or fish products labeledwholly or in part as ‘catfish’ unless the products are taxonomically from the family Ictaluridae.”46 Thelabeling law was subsequently broadened to encompass all marketing and sales of other fish as catfish. State labeling laws also were enacted in Mississippi, Louisiana, and Arkansas.47
The Commission concluded that the marketing of frozen fillets of basa and tra had changed tosome extent as a result of the labeling law, but the record indicated that the subject imports and thedomestic product still competed because consumers viewed basa and tra as comparable to domesticcatfish fillets.48 Further, the Commission found that frozen catfish fillets and basa and tra fillets competedfor sales at the same accounts and that large purchasers switched from domestic catfish to the subjectimports.49 The Commission observed that even if the labeling laws addressed marketing practices, theydid not reverse the commercial ties that existed in a market that responded to price.
50 Original Determination, USITC Pub. 3617 at 12. 51 Original Determination, USITC Pub. 3617 at 12. 52 Original Determination, USITC Pub. 3617 at 10. 53 CR at II-3; PR at II-2. 54 CR at II-22; PR at II-15. 55 CR at II-22; PR at II-15. 56 CR/PR at Table I-11. 57 CR at II-20; PR at II-15. 58 CR at II-19; PR at II-13. Firms expecting increased demand cited reasons that included the concern that wildwhitefish may not be sustainable, the continuing growth of aquaculture throughout the world, healthier eating habits,better food safety, and the maturing of the Baby Boom generation. CR at II-20; PR at II-14. 59 CR at II-16; PR at II-10.
10
The Commission also found that a substantial share of subject imports were sold in the South, theprincipal market for the domestic product. The record indicated that frozen catfish fillets were primarilyconsumed in restaurants that feature southern fare.50 Subject imports and domestic frozen catfish filletswere also competing in the same channels of distribution, as 62 percent of domestic frozen catfish filletswere sold to food service distributors, while *** percent of importers’ shipments were destined for foodservice distributors.51
The Commission found that U.S. processors were able to lower their costs to some extent bypaying the farmers lower prices for catfish, but several of the processors were owned by catfish farms,thereby limiting the extent to which lower revenue from depressed prices could be passed down to thefarmers.52
2. Current Review
The current five-year review covers the period 2003 through 2008. We have considered anumber of conditions of competition in the U.S. market that inform our analysis of the likely impact onthe domestic industry if the antidumping duty order were revoked.
a. Demand Characteristics
Demand for certain frozen fish fillets is driven largely by consumer preferences. Frozen fillets ofother whitefish may be both substitutes for and complements to certain frozen fish fillets (they arecomplements as there is some consumer preference for variety).53 Tilapia, cod, and pollock are allreported to be substitutes for certain frozen fish fillets, as they are mild-tasting whitefish fillets.54 Processors and purchasers indicated that tilapia, especially from China, is low-priced and competesaggressively for sales to food service companies.55
Demand was strong in the U.S. market for certain frozen fish fillets during the period examined. Apparent U.S. consumption increased irregularly, from 161 million pounds in 2003 to 212 million poundsin 2008, representing an increase of more than 30 percent.56 With regard to historical demand for certainfrozen fish fillets, firms that indicated increased demand cited a number of reasons, including the desirefor healthier food, an increase in availability, affordability, and the mild taste of the product.57 Theoutlook for future demand is reportedly strong as well, with the great majority of purchasers, processorsand importers anticipating increased demand or no change in demand.58 Demand exhibits some seasonalvariation; demand is high during the Lenten pre-Easter season and low during the holiday months ofNovember and December.59
60 See Original Determination, USITC Pub. 3617 at 11. As discussed above, the Farm Security and RuralInvestment Act of 2002 included a provision that limits the use of the name “catfish” in food product labeling to fishof the Ictaluridae family, which is the species of catfish raised in the United States. In addition, the 2002 farm billincluded catfish in country-of-origin (“COOL”) labeling requirements that apply to retail sales, but specificallyexempted restaurants. Six states have laws regarding catfish labeling, but only Mississippi, Arkansas, and Louisianahave laws that regulate the use of the term “catfish” on restaurant menus. CR at II-3 to II-4 n.10; PR at II-3, II-3n.10. See also Domestic Parties’ Prehearing Brief at Exh. 8. 61 CR at II-23; PR at II-16. 62 CR at II-26; PR at II-18. 63 CR at I-22; PR at I-18. See also Tr. at 20, 25-26 (Rhodes, Walker). 64 CR at I-22; PR at I-18. 65 CR at II-26; PR at II-18. 66 CR at I-25; PR at I-19. 67 CR at III-27 n.30, III-32 n.53; PR at III-13 n.30, III-15 n.53. 68 CR at I-25; PR at I-19. 69 CR/PR at Table III-10.
11
The level of substitutability between frozen catfish fillets and frozen basa and tra fillets fromVietnam may have decreased somewhat in the U.S. market as a result of the stricter labeling requirementsat the federal and state levels noted by the Commission in the original investigation.60 Twenty of 26responding purchasers indicated that the subject imports and frozen catfish fillets are not substitutable,although most cited laws requiring accurate labeling and identification of the products rather thandifferences in physical characteristics or market positioning.61 State labeling laws and communitypressure in catfish producing regions may deter the substitution of the subject imports for catfish in thoselocations. Moreover, 15 of the 26 responding purchasers indicated that buying the domestic productrather than imports is important.62
On the other hand, distributors, sellers, and restaurant owners still appear to be marketing thesubject imports as a substitute for catfish in oral communications, price lists, and menus.63 Basa and trareportedly are sold to customers in restaurants in generic terms such as “southern fried fish.”64 We notealso that the market share of subject imports increased during the period of review while the market shareof domestic catfish declined. Given the record as a whole, including the similarities in physicalcharacteristics of the products, and the contrasting trends in market share, there appears to be at leastmoderate substitutability between domestic frozen catfish fillets and frozen basa and tra fillets fromVietnam.65
b. Supply Characteristics
Despite the growth in apparent U.S. consumption during the period examined, the U.S. industryhas contracted as processors have consolidated or gone out of business. Four domestic catfish processors(Aquafarms, Arkansas Catfish Growers LLC dba SEACAT, Prairie Lands, and Pride of the South CatfishCompany) have ceased operations, and one other domestic processor, Southern Pride Catfish Co. LLC,has closed several plants.66
There is a high degree of interdependence between U.S. processors and catfish farmers, and mostU.S. processors are farmer-owned. U.S. processors report that being vertically integrated helps ensure aconsistent supply of live catfish.67 Only two responding firms reported that all of their live catfishpurchases were from unrelated farms.68 Because one of these firms was a major processor of live catfish,over half of U.S. processors’ purchases of live catfish were from unrelated farmers.69
70 CR at V-2 to V-3; PR at V-2 to V-3. Feed costs typically account for *** percent of catfish farmers’production costs. CR at V-3 n.7; PR at V-2 n.7. 71 CR at V-3 to V-4; PR at V-2 to V-3. 72 CR at II-9, Fig. II-1; PR at II-6, Fig. II-1. 73 Processors’ average cost to obtain live fish rose from $1.38 per pound in 2003 to $1.94 per pound in 2008. CR/PR at Table III-8. 74 CR at II-8; PR at II-5. 75 CR at II-3 n.6, II-5 to II-6; PR at II-2 n.6, II-4. 76 Ten food service distributors accounted for 74.5 percent of the quantity of total purchases of certain frozen fishfillets reported during the period examined, and 5 restaurant chains accounted for 12.1 percent of the quantityreported. One food service company, ***, alone accounted for approximately *** of all purchases during the period. CR at I-30; PR at I-23. 77 CR at I-30 n.63; PR at I-23 n.63. 78 CR at V-9; PR at V-7. 79 CR at IV-13; PR at IV-10. In 2008, three-quarters of U.S. imports of certain frozen fish fillets from Chinaconsisted of catfish, with the remaining one-quarter consisting of basa and tra. CR at IV-5; PR at IV-3. 80 CR/PR at Table IV-1. In referring to nonsubject imports, we use the term “certain frozen fish fillets” to refer tothe subject merchandise as well as frozen fillets of catfish. 81 CR/PR at Tables I-11 and IV-1.
12
U.S. processors faced increasing purchase prices for catfish during the period examined, as U.S.catfish farmers’ feed costs increased due to higher prices for corn and soybeans.70 Moreover, somecatfish farmers have not been able to increase the selling price of their live catfish sufficiently to covertheir increased costs and, as a result, have reduced operations or stopped raising live catfish.71 Totalacreage dedicated to ponds for raising catfish fell steadily during the period of review, and it has declinedby over 25 percent since its peak in 2002.72 Thus, the supply of live farm-raised catfish available to U.S.processors consistently fell during the period examined. The reduced supply of live fish creates cost-sidepressures for processors due to the higher prices they must pay for the fish.73 Supply also tends to belower during the summer months when the number of food-size fish in the ponds is lower and feeding isthe heaviest.74 Although the domestic product has a six-month shelf life, food service companies tend toconcentrate their purchases during periods of peak supply.75
U.S. processors and importers sell to food service distributors, grocery chains, warehouse clubs,and directly to restaurants.76 Food service distributors in turn generally sell to restaurants, whereconsumers purchase the vast majority of certain frozen fish fillets. Food service distributors also reportedselling to hotels, school systems, healthcare facilities, nursing homes, the military, and casinos.77 MostU.S. sales of the domestic product and the subject merchandise are made on a spot basis, with some salesarranged on a short-term basis either by contract or oral agreement.78
A major change in the conditions of competition since the original investigation is the growth innonsubject imports, and in particular frozen catfish fillets from China. The same species of catfish that isfarm-raised in the United States is now being farm-raised in China.79 Since the imposition of theantidumping duty order, China has become the second largest source of imports of certain frozen fishfillets, including catfish, basa, and tra.80 Nonsubject imports from China accounted for over one-quarterof total imports of certain frozen fish fillets by quantity, but only 13 percent of apparent U.S.consumption.81
82 19 U.S.C. § 1675a(a)(2). 83 19 U.S.C. § 1675a(a)(2). 84 Original Determination, USITC Pub. 3617 at 13. 85 Original Determination, USITC Pub. 3617 at 14. 86 Original Determination, USITC Pub. 3617 at 14. 87 CR/PR at Table IV-1. 88 CR/PR at Table I-1. 89 CR/PR at Table I-11. In contrast, the domestic industry lost 10.6 percentage points of market share from 2000to 2002. See CR/PR at Table I-1. 90 CR/PR at Table I-11.
13
C. Revocation of the Antidumping Duty Order on Subject Imports Is Likely to Lead toContinuation or Recurrence of Material Injury
1. Likely Volume of Subject Imports
In evaluating the likely volume of imports of subject merchandise if the order under review isrevoked, the Commission is directed to consider whether the likely volume of imports would besignificant either in absolute terms or relative to production or consumption in the United States.82 Indoing so, the Commission must consider “all relevant economic factors,” including four enumeratedfactors: (1) any likely increase in production capacity or existing unused production capacity in theexporting country; (2) existing inventories of the subject merchandise, or likely increases in inventories;(3) the existence of barriers to the importation of the subject merchandise into countries other than theUnited States; and (4) the potential for product shifting if production facilities in the foreign country,which can be used to produce the subject merchandise, are currently being used to produce otherproducts.83
In the original investigation, the Commission found that the quantity of subject imports rose from12.5 million pounds in 2000 to 26.0 million pounds in 2001 and 36.0 million pounds in 2002, an increaseof 187.4 percent from 2000 to 2002.84 The Commission noted that although apparent U.S. consumptiongrew between 2000 and 2002, the volume of subject imports grew significantly faster and captured anincreasing share of the U.S. market. Moreover, the Commission found that the subject imports’ increasein market share came largely at the expense of the domestic industry, as nonsubject import volumes wereinsignificant throughout the period. Subject imports increased relative to domestic production as well;they were equivalent to 11.6 percent of domestic production in 2000 but rose to 33.2 percent by 2002.85 The Commission concluded that the increased volumes of subject imports were significant both inabsolute terms and relative to production and apparent consumption in the United States.86
During the period examined in this review, subject imports maintained a growing and significantpresence in the U.S. market, even with the order in place. Subject imports increased from 19.7 millionpounds in 2003 to 53.3 million pounds in 2008, an increase of 171 percent.87 By quantity, subject importsincreased their U.S. market share from 12.2 percent in 2003 to 25.1 percent in 2008.88
The domestic industry lost more market share during the period examined than it did in theoriginal investigation; its market share fell from 87.1 percent in 2003 to 54.1 percent in 2008.89 With theorder in place, nonsubject imports gained an even greater portion of the domestic industry’s lost marketshare than the subject imports, increasing from 0.7 percent in 2003 to 20.8 percent in 2008, but continuedto hold a smaller share of the U.S. market than subject imports.90
In assessing the likely volume of subject imports if the order is revoked, we consider whether thesubject producers’ planned additions to capacity or existing unused production capacity would likely be asignificant source of increased exports to the United States within a reasonably foreseeable time. We alsoconsider whether subject exporters are likely to shift exports away from existing markets to the UnitedStates.
91 CR at IV-10; PR at IV-7. A questionnaire response was received from one producer in Vietnam, ***. 92 See CR/PR at Tables IV-4 and IV-5. 93 CR/PR at Table IV-4. Vietnamese production of whole basa and tra has increased from 359 million pounds in2003 to 1.9 billion pounds in 2007. Id. 94 Original Determination, USITC Pub. 3617 at Table VII-1. 95 While the Vietnamese industry’s total capacity is unknown, we note that, based on 2008 export figures fromVietnam, 14.5 percent of those exports, or 205 million pounds, would have been equivalent to 97 percent of apparentU.S. consumption for that year. See CR/PR at Tables I-1 and IV-5. 96 CR at IV-9; PR at IV-7. 97 See CR/PR at Table I-1. 98 Original Determination, USITC Pub. 3617 at VII-1. 99 See CR/PR at Table IV-5. 100 CR/PR at Table IV-5. 101 See CR/PR at Table IV-5. For comparison’s sake, based on USDA data, the U.S. industry’s total shipments in2008 were 115 million pounds. CR/PR at Table I-1. 102 CR at IV-10; PR at IV-7 to IV-8. It appears that one of the Vietnamese industry’s main export markets isbecoming less favorable to exports of the subject merchandise. In December 2008, Russia banned all basa and traimports from Vietnam following the discovery of some contaminated products. Although the ban was recentlypartially lifted, only 10 Vietnamese processing plants are currently authorized to export to Russia. There arereportedly 80 processors in the Mekong delta region of Vietnam. CR at IV-9, IV-12; PR at IV-7, IV-9. The Russian
(continued...)
14
Information concerning the basa and tra industry in Vietnam is limited due to the failure of theVietnamese industry to respond to Commission questionnaires. As noted above, only one producer inVietnam submitted a questionnaire response in this review.91 VASEP, however, provided informationconcerning its members’ production and exports of the subject merchandise.92 That information indicatesthat the industry in Vietnam is much larger than it was at the time of the original investigation andremains export-oriented. Production of basa and tra in Vietnam was reported to be over six times greaterin 2007 than it was in 2002.93
The record also indicates that there is significant excess capacity in Vietnam for the production ofthe subject merchandise. During 2002, the final year of the original investigation, the Vietnameseindustry had excess capacity equivalent to 14.5 percent of its total capacity.94 Given the greatly increasedcapacity of the Vietnamese industry since imposition of the order, we find that it likely still hassignificant excess capacity that could be the source of increased exports to the United States should theorder be revoked.95
The industry in Vietnam plans to grow even larger. Four Vietnamese processing plants haveannounced capacity expansion plans in 2009 totaling 656 million pounds.96 These significant additions tocapacity would, in and of themselves, be more than triple the size of apparent U.S. consumption in 2008,and we determine that, given the export orientation of the Vietnamese industry, Vietnam is likely to be asource of significantly increased exports to the United States in the reasonably foreseeable future.97
While the record does not contain updated information as to the amount of basa and tra sold inthe Vietnamese home market, during the original investigation, the Vietnamese industry exported84 percent of its production.98 The Vietnamese industry remains export-oriented, as demonstrated by itssurging exports.99 Data on the Vietnamese industry’s exports demonstrate the remarkable, export-basedgrowth of the Vietnamese basa/tra industry.100 Although total Vietnamese exports of basa and tra were73 million pounds in 2003, exports surged to 1.4 billion pounds in 2008, an increase of over 18-foldduring the period examined.101
This rapid increase in exports, destined for the European Union and other markets such asAustralia, Russia, and Ukraine, indicates a likely increase in shipments to the United States should theorder be revoked. The European Union was the largest export market for Vietnamese basa and tra during2004-07, but Russia and Ukraine have recently become the largest export markets.102 The Vietnamese
102 (...continued)Government’s actions therefore make it likely that the subject exporters will seek to shift their exports to othermarkets. 103 CR/PR at Table IV-5. 104 CR/PR at Table IV-5. 105 CR/PR at Table IV-5. See also Domestic Parties’ Posthearing Brief at Exh.13. 106 We have also considered inventories of the subject merchandise and the potential for product-shifting. Importers’ inventories of subject imports were relatively steady at a low level relative to apparent U.S. consumptionin the last two years of the period examined, and they are not likely to be a significant source of subject imports. CR/PR at Table IV-3. There is no indication that Vietnamese processors can shift from the processing of other fishto basa and tra production. 107 See CR/PR at Table IV-5. 108 In 2006, the Department of Commerce found that two related Vietnamese firms circumvented the antidumpingorder by importing whole, live basa and tra into Cambodia and processing them into frozen fish fillets for export tothe United States. CR at I-3; PR at I-2. Furthermore, basa and tra from Vietnam has been mislabeled as otherspecies of fish in order to avoid paying antidumping duties. Prosecutions of this activity have resulted inimprisonment and fines. CR at I-3; PR at I-2. 109 See 19 U.S.C. § 1675a(a)(3). The SAA states that “{c}onsistent with its practice in investigations, inconsidering the likely price effects of imports in the event of revocation and termination, the Commission may rely
(continued...)
15
industry increased its exports to the European Union from 272 million pounds in 2006 to 495 millionpounds in 2008.103 The Vietnamese industry also rapidly increased its exports to other markets, includingAustralia, Russia, and Ukraine, from 205 million pounds in 2006 to 749 million pounds in 2008.104 Theincrease was accompanied by declining unit values for the merchandise shipped, indicating a desire toincrease exports even in the face of lower prices.105 Given the ease and speed with which the Vietnameseindustry has expanded its exports, the United States would likely be a market to which the Vietnameseindustry would increase exports significantly upon revocation of the order.106
The record indicates that the Vietnamese industry continues to be interested in the U.S. market. The subject imports maintained a significant and growing U.S. presence throughout the period examined,even with the antidumping duty order in place. In addition, the unit values of the Vietnamese exporters’shipments of frozen fish fillets to the United States are higher than those of their shipments to othermarkets such as the European Union, suggesting that market prices in the United States are relativelyattractive.107 Therefore, the Vietnamese industry has an incentive to shift exports from third countries tothe United States. The fact that the Commerce Department has found that exporters have circumventedthe antidumping duty order by shipping through third countries and mislabeling the subject merchandiseas other species of fish further demonstrates the attractiveness of the U.S. market.108
We find that the Vietnamese industry has significant excess capacity, significant plannedadditions to its capacity, and a large volume of current production that can be shifted to the United States.The record also indicates that the U.S. market is attractive to Vietnamese exporters and that theVietnamese industry has a pattern of rapidly increasing its exports at ever lower prices. We thereforeconclude that the likely volume of subject imports, both in absolute terms and relative to production andconsumption in the United States, would be significant if the antidumping duty order is revoked.
2. Likely Price Effects of Subject Imports
In evaluating the likely price effects of subject imports if the order under review were revoked,the Commission is directed to consider whether there is likely to be significant underselling by the subjectimports as compared to the domestic like product and whether the subject imports are likely to enter theUnited States at prices that otherwise would have a significant depressing or suppressing effect on theprice of the domestic like product.109
109 (...continued)on circumstantial, as well as direct, evidence of the adverse effects of unfairly traded imports on domestic prices.” SAA at 886. 110 Original Determination, USITC Pub. 3617 at 14. 111 Original Determination, USITC Pub. 3617 at 14. 112 Original Determination, USITC Pub. 3617 at 15. 113 Original Determination, USITC Pub. 3617 at 15. 114 U.S. processors and importers generally reported that the subject imports and the domestic product are alwaysor frequently interchangeable, while purchasers reported that they are never or sometimes interchangeable. CR/PRat Table II-3a. However, *** provided somewhat contradictory responses. Although they both reported that theU.S. and subject frozen fish fillets were, at best, sometimes interchangeable, *** indicated that the physicalcharacteristics of basa and tra lend themselves to be substituted for catfish, and *** indicated that there was norestriction against substituting catfish for basa and tra. Id. at n.1. 115 CR/PR at Table II-2. All 25 purchasers indicated that price is either “very important” or “somewhatimportant.” Id. 116 The pricing products were two to three ounce frozen fillets (Product 1), three to five ounce frozen fillets(Product 2), five to seven ounce frozen fillets (Product 3), and seven to nine ounce frozen fillets (Product 4), allpacked in 15 to 22 pound boxes. CR at V-13; PR at V-10. 117 CR at V-13; PR at V-10. 118 CR/PR at Table V-6. 119 Compare CR/PR at Table V-6 with Table V-7. 120 CR at V-24; PR at V-10; CR/PR at Figs. V-4, V-5, V-6, V-7. 121 CR at V-24; PR at V-20; CR/PR at Figs. V-4, V-5, V-6, V-7.
16
In the original investigation, the Commission found that the domestic like product and subjectimports were interchangeable and were used in the same applications and that many purchasersconsidered basa and tra and the domestic product to be substitutable.110 Moreover, basa and tra competedwith catfish for sales not only in the same U.S. regions and through the same channels of distribution, butat the same customer accounts.111
The Commission found that subject imports of basa and tra undersold the domestic product in all139 monthly price comparisons, by margins ranging from 9.2 percent to 38.6 percent, and concluded thatthe underselling was significant.112
The Commission also found that significant price depression occurred during the periodexamined. Despite increasing demand, average prices for the domestic like product declined from a highof $2.88 per pound in March and April 2000 to a low of $2.37 per pound in March and April 2002, beforestabilizing at significantly lower levels.113
The evidence in this review indicates, as it did in the original investigation, that once acceptablelevels of quality are met, the domestic like product and subject imports can be used interchangeably114 andthat price is an important factor in purchasing decisions.115
The pricing information on the record indicates that the subject imports are still consistentlyunderselling domestic product even with the order in place. The Commission collected pricing data onthe same four pricing products that were used in the original investigation.116 These products accountedfor 43.9 percent of U.S. shipments and 27.3 percent of subject imports between 2003 and 2008.117 Thedata indicate that, despite the discipline of the order, the subject imports undersold the domestic likeproduct in all 74 comparisons at margins of underselling that ranged from 17.5 to 50.7 percent.118 Thus,under the antidumping duty order the margins of underselling were greater than during the originalinvestigation.119
Quarterly prices for domestic frozen catfish fillets fluctuated, but generally increased from 2003to 2008.120 Quarterly prices for the subject imports also fluctuated and increased over the 2003 to 2008period, but generally decreased from their peak prices in 2006 through the last quarter of 2008.121
122 CR/PR at Table C-1. 123 CR/PR at Table C-1. 124 CR/PR at Table C-1. Production declined from 106.6 million pounds in 2003 to 97.1 million pounds in 2008. CR/PR at Table C-1. Thus, the increase in costs was also spread over a reduced production over the course of theperiod. 125 CR at III-24; PR at III-12; CR/PR at Table III-8. The ratio of cost of goods sold to the value of net salesgenerally rose during the period, except for 2008 when this ratio declined slightly. See CR/PR at Table I-1. 126 CR at V-1; PR at V-1. 127 See CR/PR at Table IV-5. 128 See CR/PR at Table IV-5. 129 The majority of Vietnamese exports are shipped to markets at unit values that are only 62 percent of the unitvalues for export shipments to the United States. See CR/PR at Table IV-5. 130 Commerce made an affirmative finding of duty absorption with respect to one Vietnamese exporter and itsU.S. affiliate. CR at I-13 n.20; PR at I-10 n.20; Certain Frozen Fish Fillets from the Socialist Republic of Vietnam:Final Results of the Antidumping Duty Administrative Review and New Shipper Reviews, 74 Fed. Reg. 11349(March 17, 2009). The SAA, at 886, indicates that duty absorption “may indicate that the producer or exporter
(continued...)
17
We have also considered whether subject imports from Vietnam suppressed prices of thedomestic like product to a significant degree. As explained above, the cost of live catfish increasedsubstantially over the period. Although prices also increased, they were not sufficient to cover thisincreasing cost. The domestic industry’s average unit cost of goods sold (“COGS”) increased from $2.02in 2003 to $2.59 in 2008, an increase of $0.57.122 The domestic industry’s average unit sales valueincreased from $2.41 in 2003 to $2.91 in 2008, an increase of $0.50.123 Consequently, the industryexperienced a cost-price squeeze through 2008 as is also shown by trends in the ratio of COGS to netsales, which increased overall from 83.7 percent in 2003 to 90.4 percent in 2007, before declining slightlyto 89.0 percent in 2008.124 Significantly, these trends occurred while apparent U.S. consumptionincreased by 31.4 percent from 2003 to 2008. In light of such strong demand, the domestic industryshould have been able to pass these cost increases to purchasers by way of higher prices, but was unableto do so.
Although domestic producers were able to increase their prices somewhat during the period tooffset their increasing cost of goods sold, which was primarily attributable to the rising prices for livecatfish, their net sales values did not keep pace with rising unit costs, leading to lower profit margins forthe domestic producers.125 Given that raw material costs account for approximately 72 percent of the costof production, it was difficult for processors to lower their costs in order to compete with low-pricedimports.126 If the order were revoked and domestic producers were forced to compete against greatervolumes of low-priced imports from Vietnam, it would be even more difficult for the domestic producersto raise prices to cover their increasing costs, which would likely lead to even greater price suppressingeffects.
We find that the subject exporters are likely to price their product even more aggressively if theorder is revoked in order to export large volumes of subject merchandise to the United States and increasetheir share of the U.S. market. Frozen basa and tra fillets from Vietnam have competed aggressively atlow prices in order to sell large volumes in Europe and other markets. The unit values of the Vietnameseexporters’ shipments of the subject merchandise fell in the European Union and other markets such asAustralia, Russia, and Ukraine as the subject exporters substantially increased their exports to thosemarkets.127 In contrast, with the antidumping duty order in effect, the unit values of the subject exporters’shipments to the United States increased.128 Absent the antidumping duty order, the subject exporters arelikely to price their product lower, as they have in their other export markets, in order to increase theirmarket share in the United States.129 The experience of Vietnamese exporters in other markets and theirconsistent underselling in the U.S. market during the period examined, even under the discipline of theorder, indicate that underselling is likely to be significant if the order is revoked.130
130 (...continued)would be able to market more aggressively should the order be revoked as a result of a sunset review.” 131 19 U.S.C. § 1675a(a)(4). 132 19 U.S.C. § 1675a(a)(4). Section 752(a)(6) of the Tariff Act states that “the Commission may consider themagnitude of the margin of dumping or the magnitude of the net countervailable subsidy” in making itsdetermination in a five-year review. 19 U.S.C. § 1675a(a)(6). The statute defines the “magnitude of the margin ofdumping” to be used by the Commission in five-year reviews as “the dumping margin or margins determined by theadministering authority under section 1675a(c)(3) of this title.” 19 U.S.C. § 1677(35)(C)(iv). See also SAA at 887.
Commerce expedited its determination in its review of frozen fish fillets from Vietnam and found thatrevocation of the antidumping duty order would be likely to lead to continuation or recurrence of dumping at thefollowing margins: An Giang Fisheries Import and Export Joint Stock Company (47.05 percent); Vinh HoanCompany Limited (36.84 percent), Nam Viet Company Limited (53.68 percent); Can Tho Agricultural and AnimalProducts Import Export Company (45.81 percent); An Giang Agriculture and Food Import Export Company, CanTho Animal Fishery Products Processing Export Enterprise, Da Nang Seaproducts Import-Export Corporation,Mekongfish Company, QVD Food Company Limited, Viet Hai Seafood Company Limited, and Vinh LongImport-Export Company (45.55 percent); and all others (63.88 percent). Certain Frozen Fish Fillets From theSocialist Republic of Vietnam: Notice of Final Results of Expedited Sunset Review of Antidumping Duty Order, 74Fed. Reg. 5819-20 (Feb. 2, 2009). 133 The SAA states that in assessing whether the domestic industry is vulnerable to injury if the order is revoked,the Commission “considers, in addition to imports, other factors that may be contributing to overall injury. Whilethese factors, in some cases, may account for the injury to the domestic industry, they may also demonstrate that anindustry is facing difficulties from a variety of sources and is vulnerable to dumped or subsidized imports.” SAA at885. 134 Original Determination, USITC Pub. 3617 at 17. 135 Original Determination, USITC Pub. 3617 at 18.
18
In light of the above, were the antidumping duty order revoked, we find that significantly largerquantities of low-priced subject imports would likely be priced aggressively in order to gain market share. This underselling likely would significantly suppress and/or depress U.S. prices for frozen catfish fillets. For the foregoing reasons, we conclude that subject imports from Vietnam are likely to have significantadverse price effects in the event that the order is revoked.
3. Likely Impact of Subject Imports
In evaluating the likely impact of imports of subject merchandise if the order is revoked, theCommission is directed to consider all relevant economic factors that are likely to have a bearing on thestate of the industry in the United States, including but not limited to the following: (1) likely declines inoutput, sales, market share, profits, productivity, return on investments, and utilization of capacity;(2) likely negative effects on cash flow, inventories, employment, wages, growth, ability to raise capital,and investment; and (3) likely negative effects on the existing development and production efforts of theindustry, including efforts to develop a derivative or more advanced version of the domestic likeproduct.131 All relevant economic factors are to be considered within the context of the business cycleand the conditions of competition that are distinctive to the industry.132 As instructed by the statute, wehave considered the extent to which any improvement in the state of the domestic industry is related tothe order at issue and whether the industry is vulnerable to material injury if the order were revoked.133
In the original investigation, the Commission noted that the domestic industry expanded itscapacity between 2000 and 2002, but by an amount that was less than the increase in apparent U.S.consumption.134 The Commission found that as the volume of subject imports increased significantlyduring this period, the domestic industry’s capacity utilization decreased by 8.1 percentage points.135
136 Original Determination, USITC Pub. 3617 at 18. 137 Original Determination, USITC Pub. 3617 at 19. 138 Original Determination, USITC Pub. 3617 at 19. 139 Original Determination, USITC Pub. 3617 at 19. 140 Original Determination, USITC Pub. 3617 at 19. 141 CR/PR at Table C-1. 142 CR/PR at Table C-1. 143 CR/PR at Table C-1. 144 CR/PR at Table C-1. 145 CR/PR at Table C-1. The domestic industry’s inventories also increased during the period, from 7.5 millionpounds in 2003 to 11.8 million pounds in 2008. Id. 146 CR/PR at Table C-1. 147 CR/PR at Table III-7. 148 CR/PR at Table III-7. 149 CR/PR at Table III-7. 150 CR/PR at Table C-1.
19
The Commission also observed that the domestic industry’s sales, like its output, weresignificantly constrained despite the growth in demand. Due to the significant growth in subject importvolume, the domestic industry’s share of the U.S. market declined by 10.6 percentage points from 2000 to2002 despite increased shipments by U.S. processors.136
Notwithstanding a 24.1 percent growth in apparent U.S. consumption from 2000 to 2002, thedomestic industry’s profitability declined.137 By 2002, the domestic industry was unable to lower costssufficiently to compensate for declining prices.138 The domestic industry’s operating income as a ratio tonet sales was 2.3 percent in 2000, 2.6 percent in 2001, and just 0.1 percent in 2002.139 The domesticindustry’s employment levels also decreased between 2000 and 2002.140 Based on significant declines inmany of the performance indicators of the domestic industry, the Commission found that the increasingvolumes of subject imports had a significant adverse impact on the domestic industry.
During the period examined in this review, the great majority of the domestic industry’sperformance indicators declined despite relatively strong demand for certain frozen fish fillets. Theindustry’s capacity declined by over 6.1 percent, falling from 146 million pounds in 2003 to 137 millionpounds in 2008,141 and its production fell by 8.9 percent, dropping from 107 million pounds in 2003 to97 million pounds in 2008.142 The domestic industry’s capacity utilization fell from 73.0 percent in 2003to 70.8 percent in 2008.143 Its market share also declined by 33.0 percentage points, from 87.1 percent in2003 to 54.1 percent in 2008.144 U.S. shipments of the domestic like product increased from 2003 to2006, rising from 106 million pounds in 2003 to 116 million pounds in 2006, only to decline to 96 millionpounds in 2007 and 95 million pounds in 2008.145 The value of the domestic industry’s sales, however,increased from $258.9 million in 2003 to $289.0 million in 2008 as domestic prices increased.146
The domestic industry’s employment-related indicators also declined. The industry’s productionand related workers (PRWs) and hours worked fluctuated, but decreased overall during the periodexamined.147 The number of workers declined from 2,612 in 2003 to 2,589 in 2008;148 the number ofPRW hours worked dropped from 5,338 in 2003 to 4,684 in 2008.149 Worker productivity, however,increased slightly from 20.0 pounds per hour in 2003 to 20.7 pounds per hour in 2008.150
151 See CR/PR at Table III-8. 152 CR/PR at Table III-8. 153 CR/PR at Table III-8. 154 CR/PR at Table C-1. 155 CR/PR at Table C-1. 156 CR at V-2 to V-3; PR at V-2 to V-3. 157 CR/PR at Table I-11. 158 See CR/PR at Table IV-2. 159 CR at IV-13; PR at IV-10. 160 CR at IV-5; PR at IV-3. 161 CR/PR at Table IV-1. For instance, in 2008, the AUVs of nonsubject imports were $1.76 per pound comparedto $1.47 per pound for subject imports. CR/PR at Tables IV-1 and IV-2.
20
The domestic industry’s profitability also suffered during the period.151 The industry reported itsgreatest operating income of $16.1 million in 2003, the first year of the period examined. In 2007 and2008, the industry reported operating income of just $574,000 and $3.6 million, respectively.152 Themajority of the domestic producers reported losses in those two years.153 The domestic industry’soperating income as a ratio to net sales was 6.2 percent in 2003, 3.0 percent in 2004, 3.1 percent in 2005,3.0 percent in 2006, 0.2 percent in 2007, and 1.2 percent in 2008.154 The industry’s capital expendituresfell during the period examined as well, from $5.3 million in 2003 to $2.2 million in 2008.155
The domestic industry’s financial and trade indicators reflect a shrinking and less profitableindustry. Raw material costs increased during the period examined, as the industry’s primary input, livecatfish, increased in price due to higher feed costs.156 The industry had difficulty reducing its costsbecause raw materials are such a large cost component. Further, despite the antidumping duty order, theindustry’s ability to raise its prices was constrained due to price pressure from increasing volumes of low-priced subject imports.
Catfish farmers are reducing their catfish production due to low prices for catfish relative toproduction costs. This reduces the supply of live catfish available to processors. This trend is likely tocontinue in the foreseeable future because it is unprofitable for U.S. processors to pay more for livecatfish. Given the decline in the industry’s financial and trade indicators as well as the other difficultiesfacing the industry, we find that the industry is vulnerable to the effects of the subject imports if the orderwere to be revoked.
We also have considered the growing presence of nonsubject imports in the U.S. market. TheUnited States is an attractive market for imports. Nonsubject imports increased to 20.8 percent ofapparent U.S. consumption in 2008.157 China is by far the largest source of nonsubject imports.158 TheChinese industry is not, however, currently focused on export-led growth as is the Vietnamese industry. Less than 5 percent of Chinese aquaculture production is exported.159 Moreover, the Chinese catfishindustry produced 265 million pounds of catfish in 2006 and, therefore, is significantly smaller than the1.9 billion pound Vietnamese industry.160 We also note that the average unit values (“AUVs”) ofnonsubject imports were substantially higher than the AUVs for subject imports during all years of theperiod examined, indicating that subject imports would likely be priced more aggressively thannonsubject imports if the order were revoked.161 Thus, we find that subject imports are likely to have asignificant adverse impact upon the domestic industry if the order were revoked, notwithstanding thegrowing presence of nonsubject imports in the U.S. market.
As noted above, the volume of subject imports is likely to be significant if the order wererevoked. Subject imports increased even with the order in place, and subject producers possesssubstantial excess capacity, plan further additions to capacity, and are highly export-oriented. Subjectimports undersold the domestic industry during the period examined, and underselling is likely tocontinue in the future in order to increase market share. Given that subject imports and the domestic like

21
product are moderately substitutable, we find that, in the event of revocation, low-priced subject importswould likely increase in absolute terms and would gain market share at the expense of the domesticindustry, would undersell significantly the domestic like product, and would depress and/or suppressprices for the domestic like product. Accordingly, we find that revocation of the order would likely havea significant adverse impact on the domestic industry with respect to the industry’s production,shipments, sales, market share, employment, and profits.
CONCLUSION
For the reasons stated above, we determine that revocation of the antidumping duty order onsubject imports from Vietnam would be likely to lead to continuation or recurrence of material injury tothe domestic industry within a reasonably foreseeable time.

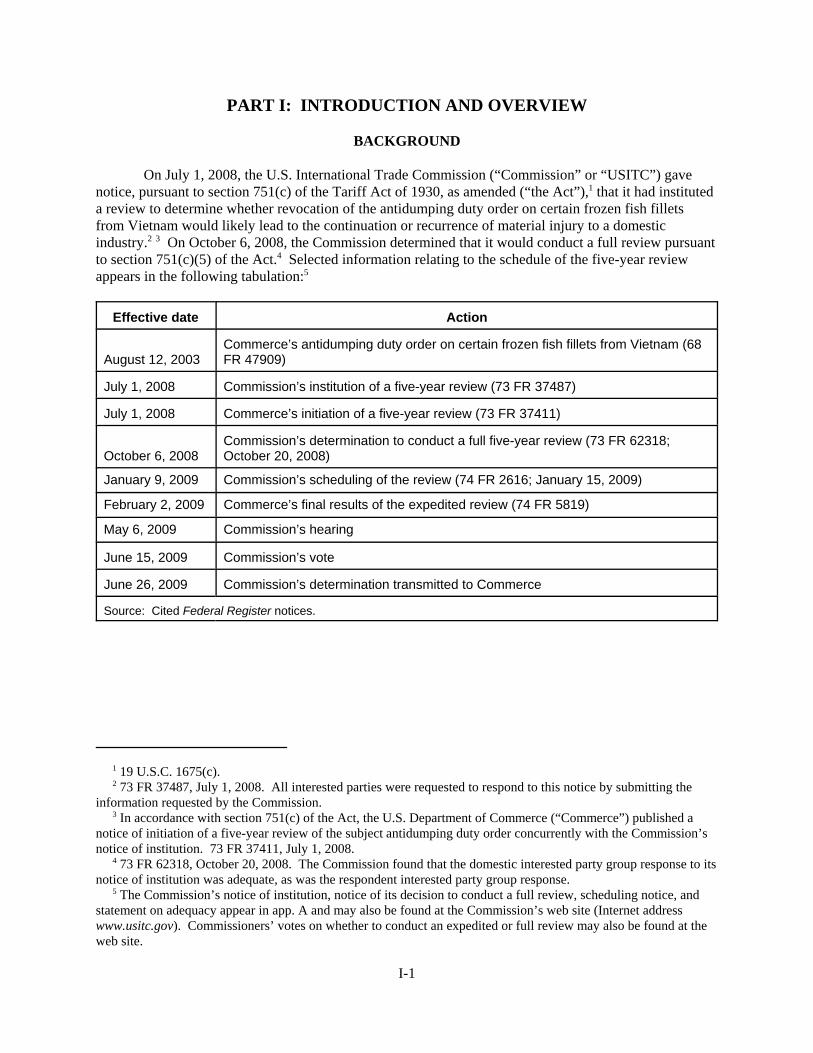
1 19 U.S.C. 1675(c). 2 73 FR 37487, July 1, 2008. All interested parties were requested to respond to this notice by submitting theinformation requested by the Commission. 3 In accordance with section 751(c) of the Act, the U.S. Department of Commerce (“Commerce”) published anotice of initiation of a five-year review of the subject antidumping duty order concurrently with the Commission’snotice of institution. 73 FR 37411, July 1, 2008. 4 73 FR 62318, October 20, 2008. The Commission found that the domestic interested party group response to itsnotice of institution was adequate, as was the respondent interested party group response. 5 The Commission’s notice of institution, notice of its decision to conduct a full review, scheduling notice, andstatement on adequacy appear in app. A and may also be found at the Commission’s web site (Internet addresswww.usitc.gov). Commissioners’ votes on whether to conduct an expedited or full review may also be found at theweb site.
I-1
PART I: INTRODUCTION AND OVERVIEW
BACKGROUND
On July 1, 2008, the U.S. International Trade Commission (“Commission” or “USITC”) gavenotice, pursuant to section 751(c) of the Tariff Act of 1930, as amended (“the Act”),1 that it had instituteda review to determine whether revocation of the antidumping duty order on certain frozen fish fillets from Vietnam would likely lead to the continuation or recurrence of material injury to a domestic industry.2 3 On October 6, 2008, the Commission determined that it would conduct a full review pursuantto section 751(c)(5) of the Act.4 Selected information relating to the schedule of the five-year reviewappears in the following tabulation:5
Effective date Action
August 12, 2003Commerce’s antidumping duty order on certain frozen fish fillets from Vietnam (68FR 47909)
July 1, 2008 Commission’s institution of a five-year review (73 FR 37487)
July 1, 2008 Commerce’s initiation of a five-year review (73 FR 37411)
October 6, 2008Commission’s determination to conduct a full five-year review (73 FR 62318;October 20, 2008)
January 9, 2009 Commission’s scheduling of the review (74 FR 2616; January 15, 2009)
February 2, 2009 Commerce’s final results of the expedited review (74 FR 5819)
May 6, 2009 Commission’s hearing
June 15, 2009 Commission’s vote
June 26, 2009 Commission’s determination transmitted to Commerce
Source: Cited Federal Register notices.
6 Commerce’s final determination, 68 FR 37116, June 23, 2003. Commerce issued an amended finaldetermination in July 2003. 68 FR 43713, July 24, 2003. 7 Certain Frozen Fish Fillets from Vietnam, Inv. No. 731-TA-1012 (Final), USITC Publication 3617, August2003. 8 U.S. Department of Justice, “Illinois Corporation Pleads Guilty to Illegally Dealing in Falsely Labeled Fishfrom Vietnam,” Press Release, March 12, 2008. 9 National Oceanic and Atmospheric Administration, “Seafood Importer and Associated Corporations ReceiveImprisonment and Fines,” Press Release, January 8, 2007. 10 Department of Justice, “President of Company That Illegally Imported Catfish Sentenced to More Than FiveYears in Federal Prison,” Press Release, May 19, 2009. The other conspirators also received major sentences. 11 Commerce clarified the scope of the order to include frozen fish fillets processed in Cambodia by Lian Hengfrom Vietnamese-origin whole live fish for export to the United States. 71 FR 38608 (July 7, 2006).
I-2
THE ORIGINAL INVESTIGATION
The original investigation resulted from a petition filed on June 28, 2002, on behalf of the CatfishFarmers of America--a trade association of U.S. catfish farmers and processors--and by individual U.S.catfish processors, alleging that an industry in the United States was materially injured and threatenedwith material injury by reason of less-than-fair-value imports of frozen fish fillets from Vietnam. In June2003, Commerce made a final affirmative determination.6 In August 2003, the Commission made anaffirmative final determination.7
SUBSEQUENT PROCEEDINGS
Litigation and U.S. Government Findings
Since the original investigation there have been several actions taken by the U.S. Governmentwith regard to certain frozen fish fillets. In 2007, the Department of Justice, Immigration and CustomsEnforcement, the National Marine Fisheries Service, and the Food and Drug Administration participatedin several investigations and eventual indictments of various firms and several of their employees in ascheme to import, distribute, and sell falsely labeled frozen fish fillets between 2004 and 2005.8 Theseactions were in violation of the Lacey Act, which prohibits, among other things, the receipt, acquisition orpurchase of fish that was taken, possessed, transported, or sold in violation of U.S. laws or regulations.The indictment alleged that the defendants conspired to deceive customs agents in order to avoid theantidumping duty imposed on frozen basa and tra fillets from Vietnam in 2003. In a separateinvestigation, a seafood importer and related corporations received imprisonment and fines for a multi-year scheme that involved smuggling and distributing mislabeled frozen basa and tra fillets from Vietnamin the United States and Canada and laundering the illegal proceeds between 2002 and 2005 to avoidpaying antidumping duties.9 In addition, two seafood dealers were indicted in Florida on 42 counts ofidentifying U.S. imports of farmed swai or tra from Vietnam as wild grouper between May 2002 andApril 2005. On May 18, 2009, the president of Virginia Star Seafood Corp. was sentenced to 63 monthsin prison and fined more than $12 million for antidumping duty avoidance for participating in aconspiracy in which more than 10 million pounds of frozen fish fillets were imported from Vietnam, butfraudulently labeled and sold as sole, grouper and other species.10
In 2004-06, the U.S. Department of Commerce found that two related Vietnamese firmscircumvented the antidumping order by importing whole, live basa and tra into Cambodia and processingthem into frozen fish fillets for export to the United States.11 In 2007, the Department of Commercedirected U.S. Customs to impose a per unit antidumping duty on frozen basa and tra fillets from Vietnam,
12 72 FR 13242 (March 21, 2007). 13 COOL regulations for fish and seafood became effective on September 30, 2004, while Congress passedmeasures subsequent to the 2002 farm bill delaying implementation of COOL regulations for other commodities. 14 Domestic interested parties’ prehearing brief, exhibit 8. 15 USDA, FAS, “USDA Grants Assistance to Catfish Producers in 18 States under Trade Adjustment AssistanceProgram,” Press Release, November 13, 2003. 16 The 2008 farm bill stipulated that the final catfish inspection rule be implemented 18 months after theenactment of the legislation in May 2008. FSIS intends to publish a proposed rule during 2009. William P. Milton,Jr. Assistant Administrator, Office of Catfish Inspection Programs, “Developing Rule of Catfish Inspection,”presented at the USDA Agricultural Outlook Forum, February 27, 2009. 17 Since the issuance of the prehearing report, Staff has incorporated two additional questionnaire responses(those of ***) as well as modest revisions to previously- submitted questionnaires. The changes have increased thecoverage of the trade, financial, and price data presented in this report.
I-3
rather than an ad valorem rate, as a result of certain importers undervaluing shipments to reduce theburden of the antidumping duty.12
Legislative and Regulatory Actions
During and following the original investigation there have been several legislative and regulatoryactions taken by the U.S. government regarding certain frozen fish fillets. The Farm Security and RuralInvestment Act of 2002 (the 2002 farm bill) included a provision that limits the use of the name ‘catfish’in food product labeling to fish of the Ictaluriadae family, which is the species of catfish grown in theUnited States, commonly known as channel catfish. In addition, the 2002 farm bill included catfish incountry-of-origin (COOL) labeling requirements that apply to retail sales, but specifically exempt foodservice sales (including restaurants).13 Six states also have passed legislation regarding catfish labeling;the laws in three of those states (Mississippi, Arkansas, and Louisiana) apply to labeling catfish on menusat the restaurant level.14 In addition, for the period January-December 2002, U.S. catfish producersqualified for assistance under the U.S. Trade Adjustment Assistance program, through which USDAprovides technical assistance and cash benefits to producers if an increase in imports of a like commodityhas contributed importantly to a decline in price and a loss of income.15 More recently, the Food,Conservation and Energy Act of 2008 (the 2008 farm bill) amended the inspection regulations for catfishin the United States, requiring domestic and imported catfish to be subject to a continuous inspectionprogram by the USDA’s Food Safety and Inspection Service (FSIS), rather than it had previously underthe Food and Drug Administration. The proposed final inspection regulation will include the Food Safetyand Inspection Service (FSIS) definition of “catfish,” details regarding country of origin labelingrequirements, equivalency of foreign inspection systems, and provide for detention, seizure,condemnation of adulterated or misbranded product.16
SUMMARY DATA
Table I-1 presents summary data from the original investigation and the current review. The datafor the domestic product include frozen catfish fillets. Data for the subject Vietnamese merchandiseinclude frozen basa or tra fillets. Data for nonsubject fillets include frozen catfish, basa, or tra fillets.As shown below, the market share of subject imports from Vietnam diminished in 2003, the year theantidumping duty order was issued; recovered in 2004-05; and was higher in 2006-08. The largest sourceof nonsubject imports is China, with a 13.0 percent share of the total U.S. market in 2008.17
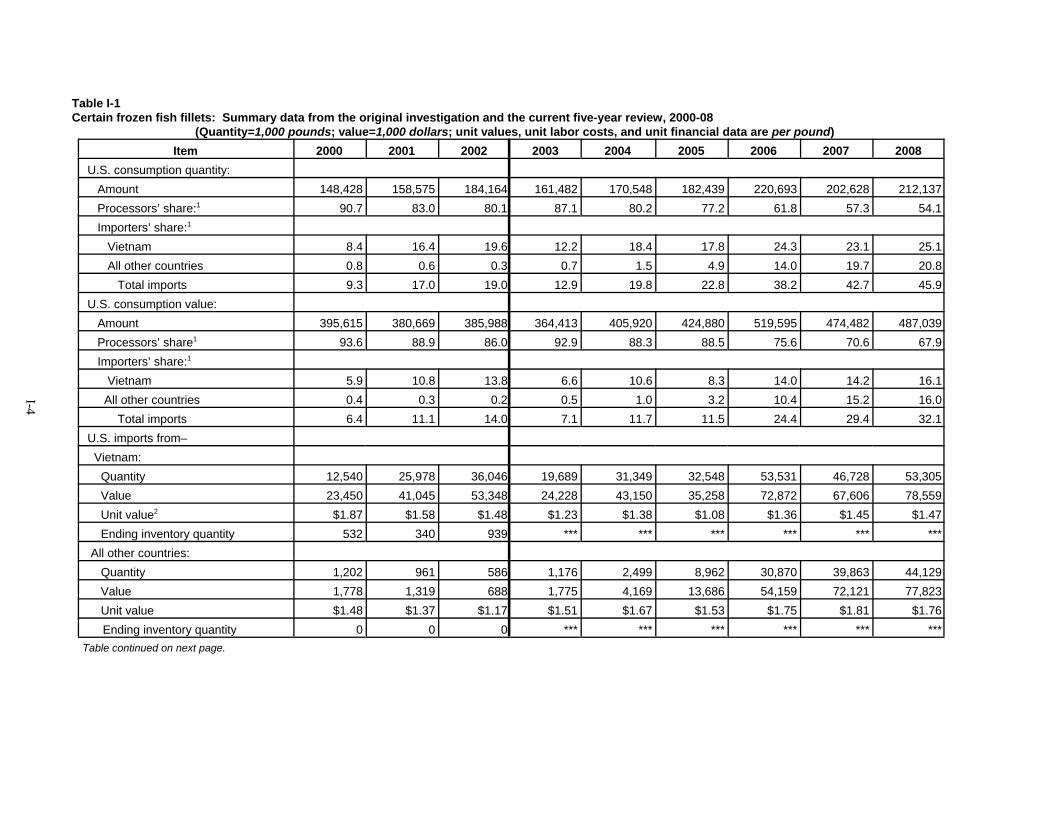
I-4
Table I-1Certain frozen fish fillets: Summary data from the original investigation and the current five-year review, 2000-08
(Quantity=1,000 pounds; value=1,000 dollars; unit values, unit labor costs, and unit financial data are per pound)Item 2000 2001 2002 2003 2004 2005 2006 2007 2008
U.S. consumption quantity: Amount 148,428 158,575 184,164 161,482 170,548 182,439 220,693 202,628 212,137 Processors’ share:1 90.7 83.0 80.1 87.1 80.2 77.2 61.8 57.3 54.1 Importers’ share:1
Vietnam 8.4 16.4 19.6 12.2 18.4 17.8 24.3 23.1 25.1 All other countries 0.8 0.6 0.3 0.7 1.5 4.9 14.0 19.7 20.8 Total imports 9.3 17.0 19.0 12.9 19.8 22.8 38.2 42.7 45.9U.S. consumption value: Amount 395,615 380,669 385,988 364,413 405,920 424,880 519,595 474,482 487,039 Processors’ share1 93.6 88.9 86.0 92.9 88.3 88.5 75.6 70.6 67.9 Importers’ share:1 Vietnam 5.9 10.8 13.8 6.6 10.6 8.3 14.0 14.2 16.1 All other countries 0.4 0.3 0.2 0.5 1.0 3.2 10.4 15.2 16.0 Total imports 6.4 11.1 14.0 7.1 11.7 11.5 24.4 29.4 32.1U.S. imports from– Vietnam: Quantity 12,540 25,978 36,046 19,689 31,349 32,548 53,531 46,728 53,305 Value 23,450 41,045 53,348 24,228 43,150 35,258 72,872 67,606 78,559 Unit value2 $1.87 $1.58 $1.48 $1.23 $1.38 $1.08 $1.36 $1.45 $1.47 Ending inventory quantity 532 340 939 *** *** *** *** *** *** All other countries: Quantity 1,202 961 586 1,176 2,499 8,962 30,870 39,863 44,129 Value 1,778 1,319 688 1,775 4,169 13,686 54,159 72,121 77,823 Unit value $1.48 $1.37 $1.17 $1.51 $1.67 $1.53 $1.75 $1.81 $1.76
Ending inventory quantity 0 0 0 *** *** *** *** *** ***Table continued on next page.
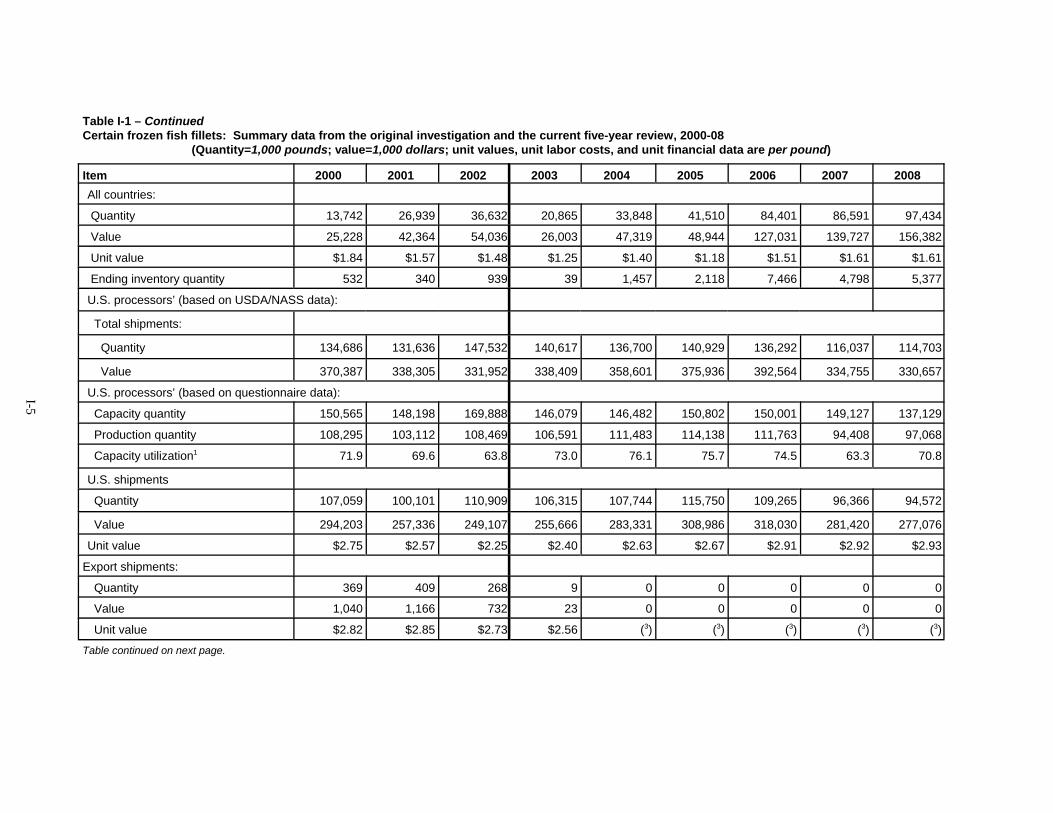
I-5
Table I-1 – ContinuedCertain frozen fish fillets: Summary data from the original investigation and the current five-year review, 2000-08
(Quantity=1,000 pounds; value=1,000 dollars; unit values, unit labor costs, and unit financial data are per pound)
Item 2000 2001 2002 2003 2004 2005 2006 2007 2008All countries:
Quantity 13,742 26,939 36,632 20,865 33,848 41,510 84,401 86,591 97,434
Value 25,228 42,364 54,036 26,003 47,319 48,944 127,031 139,727 156,382
Unit value $1.84 $1.57 $1.48 $1.25 $1.40 $1.18 $1.51 $1.61 $1.61
Ending inventory quantity 532 340 939 39 1,457 2,118 7,466 4,798 5,377
U.S. processors’ (based on USDA/NASS data):
Total shipments:
Quantity 134,686 131,636 147,532 140,617 136,700 140,929 136,292 116,037 114,703
Value 370,387 338,305 331,952 338,409 358,601 375,936 392,564 334,755 330,657
U.S. processors’ (based on questionnaire data):
Capacity quantity 150,565 148,198 169,888 146,079 146,482 150,802 150,001 149,127 137,129
Production quantity 108,295 103,112 108,469 106,591 111,483 114,138 111,763 94,408 97,068
Capacity utilization1 71.9 69.6 63.8 73.0 76.1 75.7 74.5 63.3 70.8
U.S. shipments
Quantity 107,059 100,101 110,909 106,315 107,744 115,750 109,265 96,366 94,572
Value 294,203 257,336 249,107 255,666 283,331 308,986 318,030 281,420 277,076
Unit value $2.75 $2.57 $2.25 $2.40 $2.63 $2.67 $2.91 $2.92 $2.93
Export shipments:
Quantity 369 409 268 9 0 0 0 0 0
Value 1,040 1,166 732 23 0 0 0 0 0
Unit value $2.82 $2.85 $2.73 $2.56 (3) (3) (3) (3) (3)
Table continued on next page.
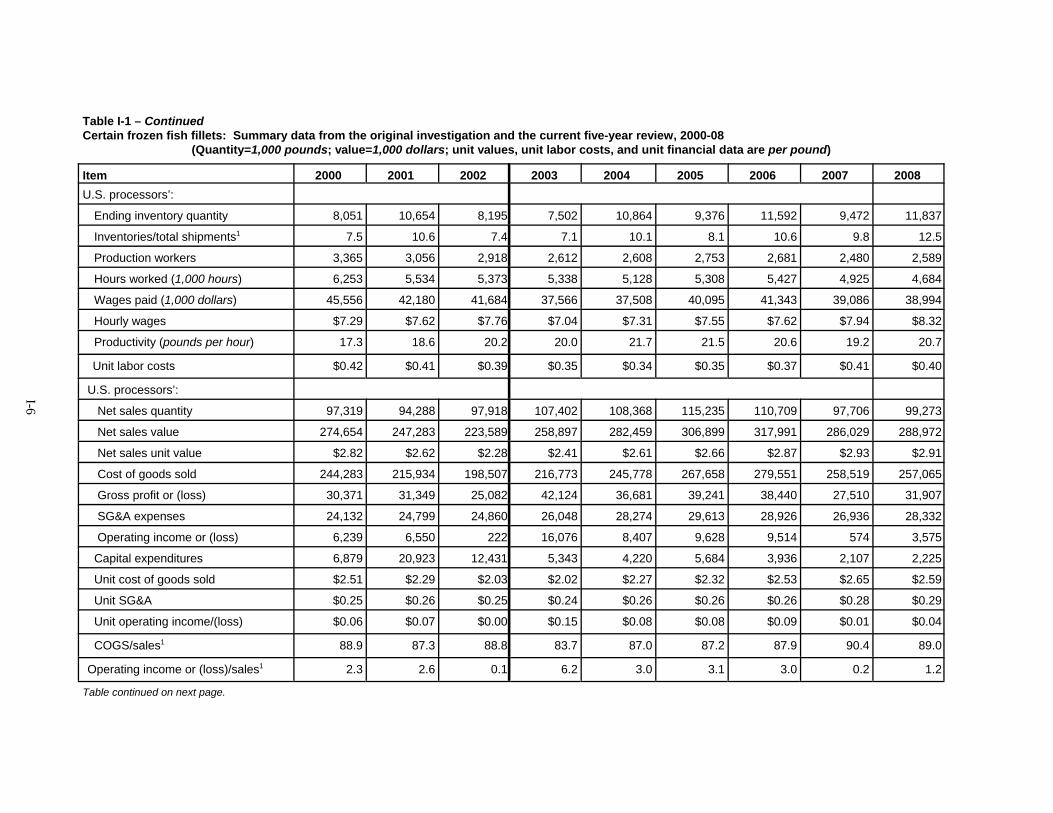
I-6
Table I-1 – ContinuedCertain frozen fish fillets: Summary data from the original investigation and the current five-year review, 2000-08
(Quantity=1,000 pounds; value=1,000 dollars; unit values, unit labor costs, and unit financial data are per pound)
Item 2000 2001 2002 2003 2004 2005 2006 2007 2008U.S. processors’:
Ending inventory quantity 8,051 10,654 8,195 7,502 10,864 9,376 11,592 9,472 11,837
Inventories/total shipments1 7.5 10.6 7.4 7.1 10.1 8.1 10.6 9.8 12.5
Production workers 3,365 3,056 2,918 2,612 2,608 2,753 2,681 2,480 2,589
Hours worked (1,000 hours) 6,253 5,534 5,373 5,338 5,128 5,308 5,427 4,925 4,684
Wages paid (1,000 dollars) 45,556 42,180 41,684 37,566 37,508 40,095 41,343 39,086 38,994
Hourly wages $7.29 $7.62 $7.76 $7.04 $7.31 $7.55 $7.62 $7.94 $8.32
Productivity (pounds per hour) 17.3 18.6 20.2 20.0 21.7 21.5 20.6 19.2 20.7
Unit labor costs $0.42 $0.41 $0.39 $0.35 $0.34 $0.35 $0.37 $0.41 $0.40
U.S. processors’:
Net sales quantity 97,319 94,288 97,918 107,402 108,368 115,235 110,709 97,706 99,273
Net sales value 274,654 247,283 223,589 258,897 282,459 306,899 317,991 286,029 288,972
Net sales unit value $2.82 $2.62 $2.28 $2.41 $2.61 $2.66 $2.87 $2.93 $2.91
Cost of goods sold 244,283 215,934 198,507 216,773 245,778 267,658 279,551 258,519 257,065
Gross profit or (loss) 30,371 31,349 25,082 42,124 36,681 39,241 38,440 27,510 31,907
SG&A expenses 24,132 24,799 24,860 26,048 28,274 29,613 28,926 26,936 28,332
Operating income or (loss) 6,239 6,550 222 16,076 8,407 9,628 9,514 574 3,575
Capital expenditures 6,879 20,923 12,431 5,343 4,220 5,684 3,936 2,107 2,225
Unit cost of goods sold $2.51 $2.29 $2.03 $2.02 $2.27 $2.32 $2.53 $2.65 $2.59
Unit SG&A $0.25 $0.26 $0.25 $0.24 $0.26 $0.26 $0.26 $0.28 $0.29
Unit operating income/(loss) $0.06 $0.07 $0.00 $0.15 $0.08 $0.08 $0.09 $0.01 $0.04
COGS/sales1 88.9 87.3 88.8 83.7 87.0 87.2 87.9 90.4 89.0
Operating income or (loss)/sales1 2.3 2.6 0.1 6.2 3.0 3.1 3.0 0.2 1.2
Table continued on next page.
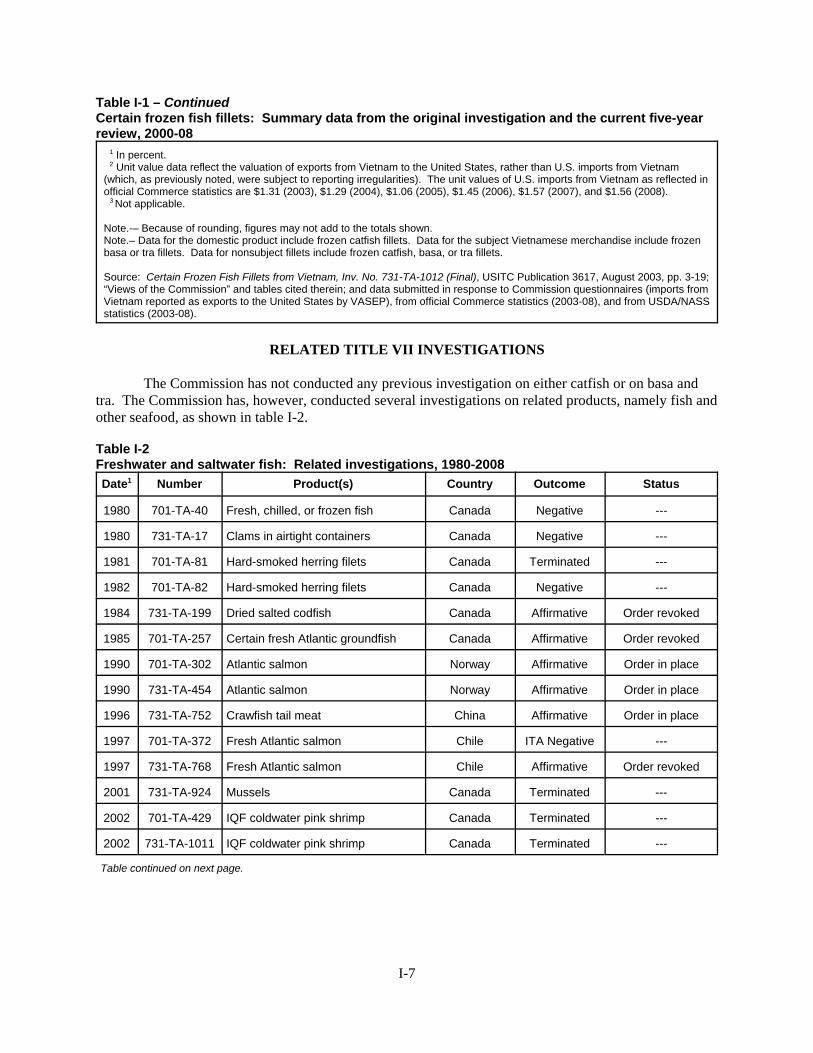
I-7
Table I-1 – ContinuedCertain frozen fish fillets: Summary data from the original investigation and the current five-yearreview, 2000-08
1 In percent. 2 Unit value data reflect the valuation of exports from Vietnam to the United States, rather than U.S. imports from Vietnam(which, as previously noted, were subject to reporting irregularities). The unit values of U.S. imports from Vietnam as reflected inofficial Commerce statistics are $1.31 (2003), $1.29 (2004), $1.06 (2005), $1.45 (2006), $1.57 (2007), and $1.56 (2008). 3 Not applicable.
Note.-– Because of rounding, figures may not add to the totals shown.Note.– Data for the domestic product include frozen catfish fillets. Data for the subject Vietnamese merchandise include frozenbasa or tra fillets. Data for nonsubject fillets include frozen catfish, basa, or tra fillets.
Source: Certain Frozen Fish Fillets from Vietnam, Inv. No. 731-TA-1012 (Final), USITC Publication 3617, August 2003, pp. 3-19;“Views of the Commission” and tables cited therein; and data submitted in response to Commission questionnaires (imports fromVietnam reported as exports to the United States by VASEP), from official Commerce statistics (2003-08), and from USDA/NASSstatistics (2003-08).
RELATED TITLE VII INVESTIGATIONS
The Commission has not conducted any previous investigation on either catfish or on basa andtra. The Commission has, however, conducted several investigations on related products, namely fish andother seafood, as shown in table I-2.
Table I-2 Freshwater and saltwater fish: Related investigations, 1980-2008Date1 Number Product(s) Country Outcome Status
1980 701-TA-40 Fresh, chilled, or frozen fish Canada Negative ---
1980 731-TA-17 Clams in airtight containers Canada Negative ---
1981 701-TA-81 Hard-smoked herring filets Canada Terminated ---
1982 701-TA-82 Hard-smoked herring filets Canada Negative ---
1984 731-TA-199 Dried salted codfish Canada Affirmative Order revoked
1985 701-TA-257 Certain fresh Atlantic groundfish Canada Affirmative Order revoked
1990 701-TA-302 Atlantic salmon Norway Affirmative Order in place
1990 731-TA-454 Atlantic salmon Norway Affirmative Order in place
1996 731-TA-752 Crawfish tail meat China Affirmative Order in place
1997 701-TA-372 Fresh Atlantic salmon Chile ITA Negative ---
1997 731-TA-768 Fresh Atlantic salmon Chile Affirmative Order revoked
2001 731-TA-924 Mussels Canada Terminated ---
2002 701-TA-429 IQF coldwater pink shrimp Canada Terminated ---
2002 731-TA-1011 IQF coldwater pink shrimp Canada Terminated ---
Table continued on next page.
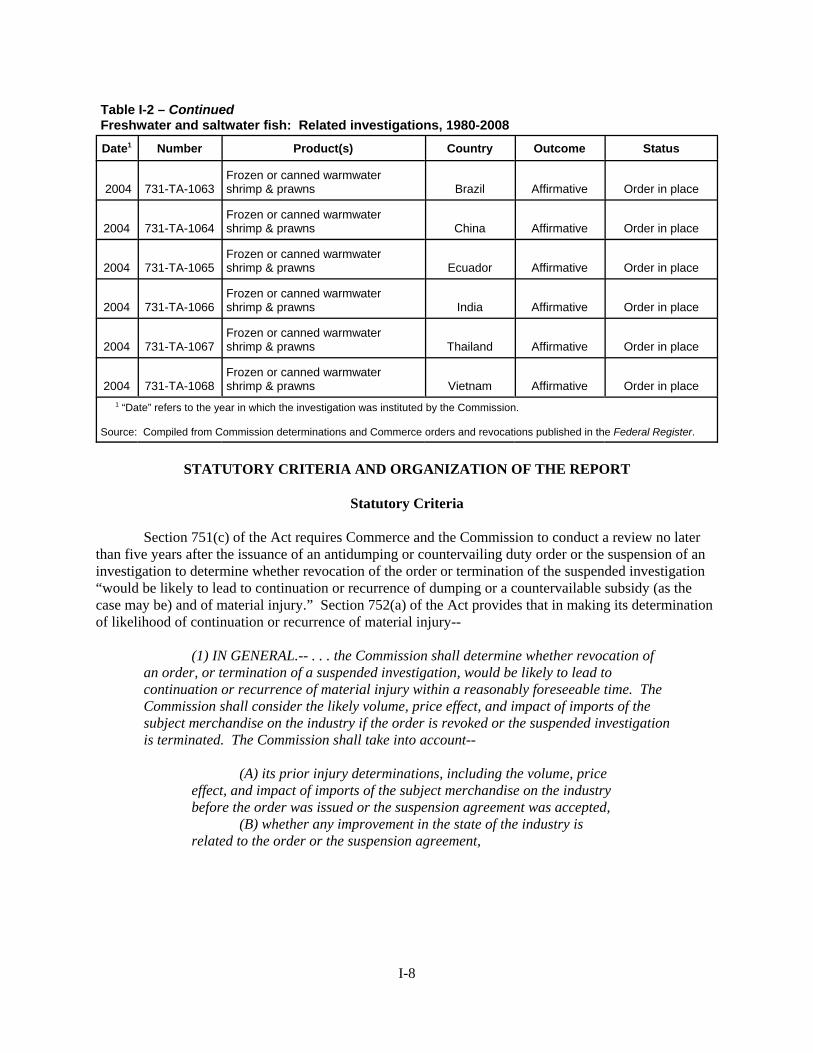
I-8
Table I-2 – Continued Freshwater and saltwater fish: Related investigations, 1980-2008Date1 Number Product(s) Country Outcome Status
2004 731-TA-1063Frozen or canned warmwatershrimp & prawns Brazil Affirmative Order in place
2004 731-TA-1064Frozen or canned warmwatershrimp & prawns China Affirmative Order in place
2004 731-TA-1065Frozen or canned warmwatershrimp & prawns Ecuador Affirmative Order in place
2004 731-TA-1066Frozen or canned warmwatershrimp & prawns India Affirmative Order in place
2004 731-TA-1067Frozen or canned warmwatershrimp & prawns Thailand Affirmative Order in place
2004 731-TA-1068Frozen or canned warmwatershrimp & prawns Vietnam Affirmative Order in place
1 “Date” refers to the year in which the investigation was instituted by the Commission.
Source: Compiled from Commission determinations and Commerce orders and revocations published in the Federal Register.
STATUTORY CRITERIA AND ORGANIZATION OF THE REPORT
Statutory Criteria
Section 751(c) of the Act requires Commerce and the Commission to conduct a review no laterthan five years after the issuance of an antidumping or countervailing duty order or the suspension of aninvestigation to determine whether revocation of the order or termination of the suspended investigation“would be likely to lead to continuation or recurrence of dumping or a countervailable subsidy (as thecase may be) and of material injury.” Section 752(a) of the Act provides that in making its determinationof likelihood of continuation or recurrence of material injury--
(1) IN GENERAL.-- . . . the Commission shall determine whether revocation ofan order, or termination of a suspended investigation, would be likely to lead tocontinuation or recurrence of material injury within a reasonably foreseeable time. TheCommission shall consider the likely volume, price effect, and impact of imports of thesubject merchandise on the industry if the order is revoked or the suspended investigationis terminated. The Commission shall take into account--
(A) its prior injury determinations, including the volume, priceeffect, and impact of imports of the subject merchandise on the industrybefore the order was issued or the suspension agreement was accepted,
(B) whether any improvement in the state of the industry isrelated to the order or the suspension agreement,
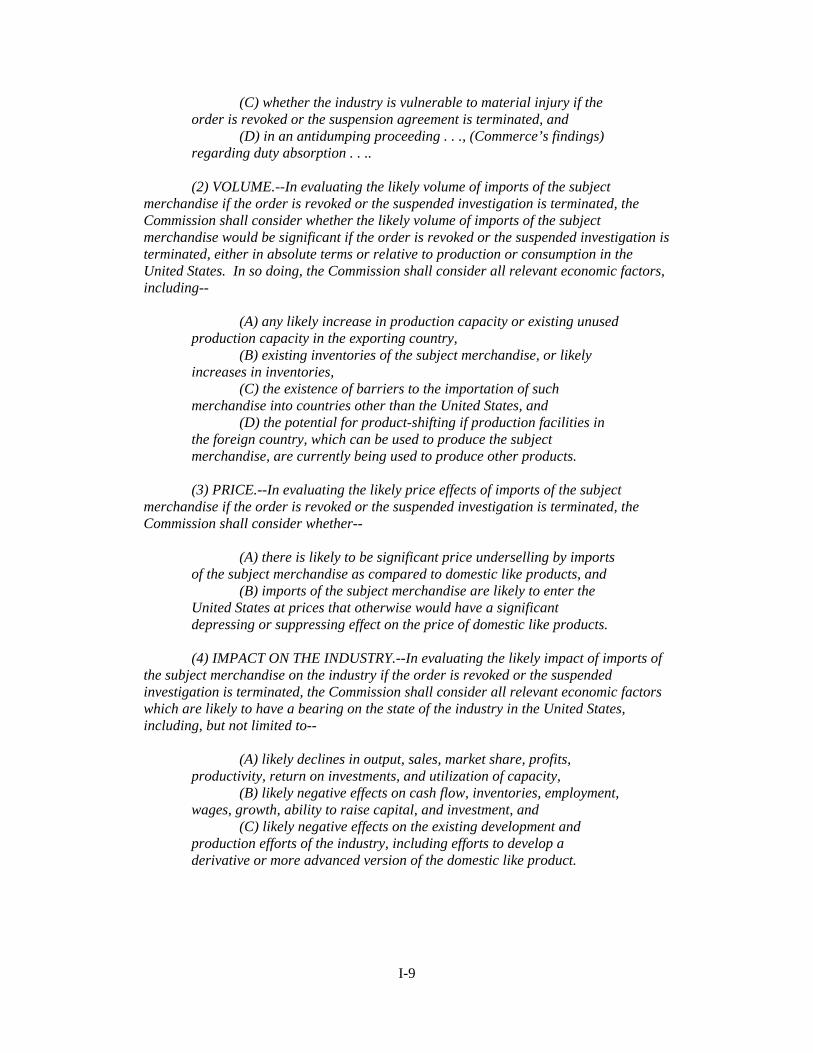
I-9
(C) whether the industry is vulnerable to material injury if theorder is revoked or the suspension agreement is terminated, and
(D) in an antidumping proceeding . . ., (Commerce’s findings)regarding duty absorption . . ..
(2) VOLUME.--In evaluating the likely volume of imports of the subjectmerchandise if the order is revoked or the suspended investigation is terminated, theCommission shall consider whether the likely volume of imports of the subjectmerchandise would be significant if the order is revoked or the suspended investigation isterminated, either in absolute terms or relative to production or consumption in theUnited States. In so doing, the Commission shall consider all relevant economic factors,including--
(A) any likely increase in production capacity or existing unusedproduction capacity in the exporting country,
(B) existing inventories of the subject merchandise, or likelyincreases in inventories,
(C) the existence of barriers to the importation of suchmerchandise into countries other than the United States, and
(D) the potential for product-shifting if production facilities inthe foreign country, which can be used to produce the subjectmerchandise, are currently being used to produce other products.
(3) PRICE.--In evaluating the likely price effects of imports of the subjectmerchandise if the order is revoked or the suspended investigation is terminated, theCommission shall consider whether--
(A) there is likely to be significant price underselling by importsof the subject merchandise as compared to domestic like products, and
(B) imports of the subject merchandise are likely to enter theUnited States at prices that otherwise would have a significantdepressing or suppressing effect on the price of domestic like products.
(4) IMPACT ON THE INDUSTRY.--In evaluating the likely impact of imports ofthe subject merchandise on the industry if the order is revoked or the suspendedinvestigation is terminated, the Commission shall consider all relevant economic factorswhich are likely to have a bearing on the state of the industry in the United States,including, but not limited to--
(A) likely declines in output, sales, market share, profits,productivity, return on investments, and utilization of capacity,
(B) likely negative effects on cash flow, inventories, employment,wages, growth, ability to raise capital, and investment, and
(C) likely negative effects on the existing development andproduction efforts of the industry, including efforts to develop aderivative or more advanced version of the domestic like product.
18 Certain industry-wide data are published by the U.S. Department of Agriculture, and where appropriate, areused and reported herein. 19 In the first administrative review, Commerce found that CATACO, a major Vietnamese exporter of certainfrozen fish fillets, had agreed to reimburse the antidumping duties paid by certain U.S. importers. Certain FrozenFish Fillets from the Socialist Republic of Vietnam: Final Results of the First Administrative Review, 71 FR 14172,March 21, 2006. 20 Certain Frozen Fish Fillets from the Socialist Republic of Vietnam: Final Results of the Antidumping DutyAdministrative Review and New Shipper Reviews, 74 FR 11349, March 17, 2009, Decision Memorandum, pp. 16-17.
I-10
The Commission shall evaluate all such relevant economic factors . . . within the contextof the business cycle and the conditions of competition that are distinctive to the affectedindustry.
Section 752(a)(6) of the Act states further that in making its determination, “the Commission mayconsider the magnitude of the margin of dumping or the magnitude of the net countervailable subsidy. Ifa countervailable subsidy is involved, the Commission shall consider information regarding the nature ofthe countervailable subsidy and whether the subsidy is a subsidy described in Article 3 or 6.1 of theSubsidies Agreement.”
Organization of the Report
Information obtained during the course of this review that relates to the above-discussed statutorycriteria is presented throughout this report. A summary of trade and financial data for frozen fish filletsmarket, as collected in this review, is presented in appendix C. U.S. industry data are based on thequestionnaire responses of 14 U.S. processors of certain frozen fish fillets that account for 82.4 percent oftotal U.S. production (by weight) of the domestic like product in 2008.18 U.S. import data and relatedinformation are based on data provided by the Vietnamese Association of Seafood Exporters andProducers (VASEP), official statistics of Commerce, and questionnaire responses, as noted. TheCommission received 11 responses from U.S. importers of certain frozen fish fillets that are believed tohave accounted for *** percent of U.S. imports from Vietnam in 2008, and *** percent of total U.S.imports. Foreign industry data and related information are based on the questionnaire responses ofVASEP. Responses by U.S. processors, importers, purchasers, and foreign producers of certain frozenfish fillets to a series of questions concerning the significance of the existing antidumping duty order andthe likely effects of revocation are presented in appendix D, while discussions of raw material prices andvariance calculations appear in appendixes E and F.
COMMERCE’S REVIEWS
Administrative Reviews
Table I-3 presents information on Commerce’s administrative reviews of the subject antidumpingduty order on the subject frozen fish fillets from Vietnam. Commerce has completed four administrativereviews and has a fifth ongoing review.19 In the fourth administrative review, Commerce made anaffirmative finding of duty absorption with respect to QVD Food and its U.S. affiliate QVD USA.20
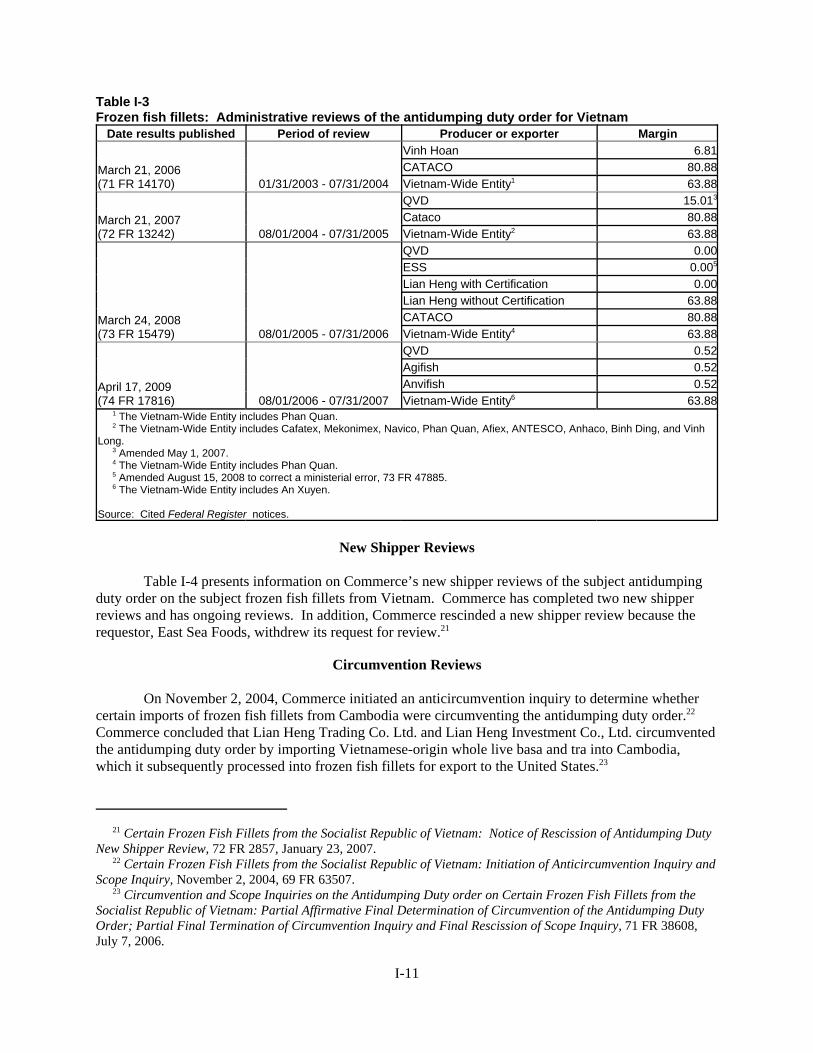
21 Certain Frozen Fish Fillets from the Socialist Republic of Vietnam: Notice of Rescission of Antidumping DutyNew Shipper Review, 72 FR 2857, January 23, 2007. 22 Certain Frozen Fish Fillets from the Socialist Republic of Vietnam: Initiation of Anticircumvention Inquiry andScope Inquiry, November 2, 2004, 69 FR 63507. 23 Circumvention and Scope Inquiries on the Antidumping Duty order on Certain Frozen Fish Fillets from theSocialist Republic of Vietnam: Partial Affirmative Final Determination of Circumvention of the Antidumping DutyOrder; Partial Final Termination of Circumvention Inquiry and Final Rescission of Scope Inquiry, 71 FR 38608,July 7, 2006.
I-11
Table I-3Frozen fish fillets: Administrative reviews of the antidumping duty order for Vietnam
Date results published Period of review Producer or exporter Margin
March 21, 2006(71 FR 14170) 01/31/2003 - 07/31/2004
Vinh Hoan 6.81CATACO 80.88Vietnam-Wide Entity1 63.88
March 21, 2007(72 FR 13242) 08/01/2004 - 07/31/2005
QVD 15.013
Cataco 80.88Vietnam-Wide Entity2 63.88
March 24, 2008(73 FR 15479) 08/01/2005 - 07/31/2006
QVD 0.00ESS 0.005
Lian Heng with Certification 0.00Lian Heng without Certification 63.88CATACO 80.88Vietnam-Wide Entity4 63.88
April 17, 2009(74 FR 17816) 08/01/2006 - 07/31/2007
QVD 0.52Agifish 0.52Anvifish 0.52Vietnam-Wide Entity6 63.88
1 The Vietnam-Wide Entity includes Phan Quan. 2 The Vietnam-Wide Entity includes Cafatex, Mekonimex, Navico, Phan Quan, Afiex, ANTESCO, Anhaco, Binh Ding, and VinhLong. 3 Amended May 1, 2007. 4 The Vietnam-Wide Entity includes Phan Quan. 5 Amended August 15, 2008 to correct a ministerial error, 73 FR 47885. 6 The Vietnam-Wide Entity includes An Xuyen.
Source: Cited Federal Register notices.
New Shipper Reviews
Table I-4 presents information on Commerce’s new shipper reviews of the subject antidumpingduty order on the subject frozen fish fillets from Vietnam. Commerce has completed two new shipperreviews and has ongoing reviews. In addition, Commerce rescinded a new shipper review because therequestor, East Sea Foods, withdrew its request for review.21
Circumvention Reviews
On November 2, 2004, Commerce initiated an anticircumvention inquiry to determine whethercertain imports of frozen fish fillets from Cambodia were circumventing the antidumping duty order.22 Commerce concluded that Lian Heng Trading Co. Ltd. and Lian Heng Investment Co., Ltd. circumventedthe antidumping duty order by importing Vietnamese-origin whole live basa and tra into Cambodia,which it subsequently processed into frozen fish fillets for export to the United States.23
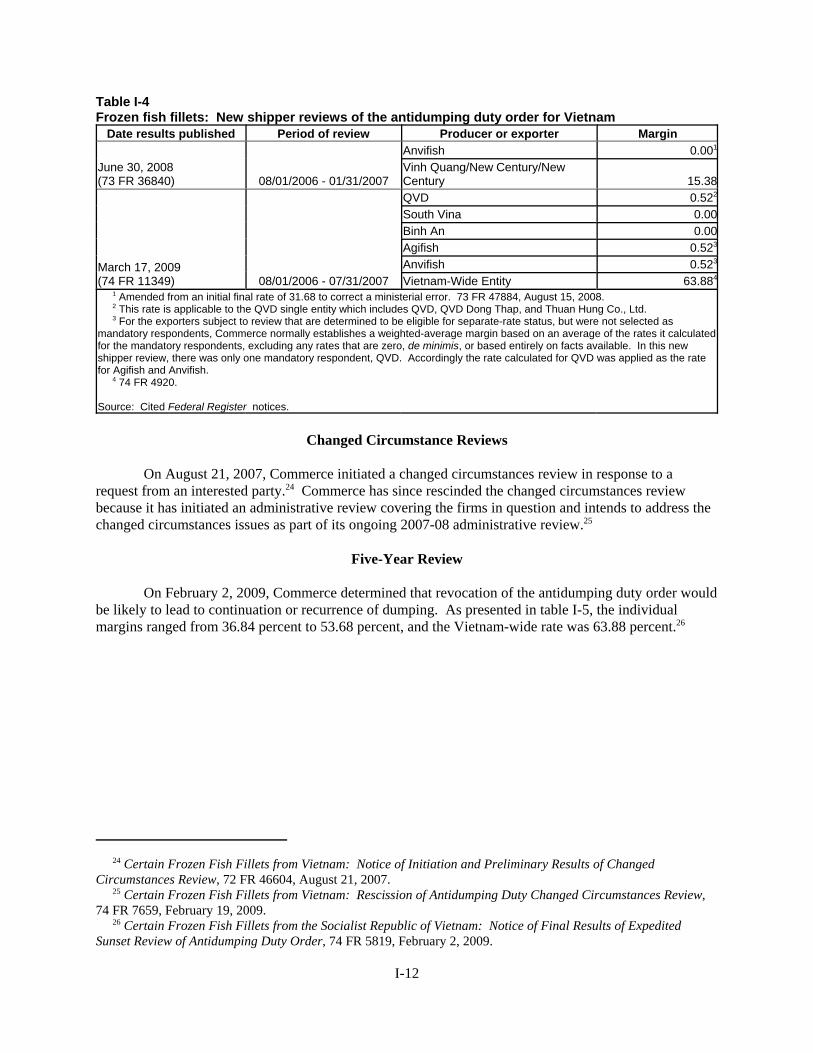
24 Certain Frozen Fish Fillets from Vietnam: Notice of Initiation and Preliminary Results of ChangedCircumstances Review, 72 FR 46604, August 21, 2007. 25 Certain Frozen Fish Fillets from Vietnam: Rescission of Antidumping Duty Changed Circumstances Review, 74 FR 7659, February 19, 2009. 26 Certain Frozen Fish Fillets from the Socialist Republic of Vietnam: Notice of Final Results of ExpeditedSunset Review of Antidumping Duty Order, 74 FR 5819, February 2, 2009.
I-12
Table I-4Frozen fish fillets: New shipper reviews of the antidumping duty order for Vietnam
Date results published Period of review Producer or exporter Margin
June 30, 2008(73 FR 36840) 08/01/2006 - 01/31/2007
Anvifish 0.001
Vinh Quang/New Century/NewCentury 15.38
March 17, 2009(74 FR 11349) 08/01/2006 - 07/31/2007
QVD 0.522
South Vina 0.00Binh An 0.00Agifish 0.523
Anvifish 0.523
Vietnam-Wide Entity 63.884
1 Amended from an initial final rate of 31.68 to correct a ministerial error. 73 FR 47884, August 15, 2008. 2 This rate is applicable to the QVD single entity which includes QVD, QVD Dong Thap, and Thuan Hung Co., Ltd. 3 For the exporters subject to review that are determined to be eligible for separate-rate status, but were not selected asmandatory respondents, Commerce normally establishes a weighted-average margin based on an average of the rates it calculatedfor the mandatory respondents, excluding any rates that are zero, de minimis, or based entirely on facts available. In this newshipper review, there was only one mandatory respondent, QVD. Accordingly the rate calculated for QVD was applied as the ratefor Agifish and Anvifish. 4 74 FR 4920.
Source: Cited Federal Register notices.
Changed Circumstance Reviews
On August 21, 2007, Commerce initiated a changed circumstances review in response to arequest from an interested party.24 Commerce has since rescinded the changed circumstances reviewbecause it has initiated an administrative review covering the firms in question and intends to address thechanged circumstances issues as part of its ongoing 2007-08 administrative review.25
Five-Year Review
On February 2, 2009, Commerce determined that revocation of the antidumping duty order wouldbe likely to lead to continuation or recurrence of dumping. As presented in table I-5, the individualmargins ranged from 36.84 percent to 53.68 percent, and the Vietnam-wide rate was 63.88 percent.26
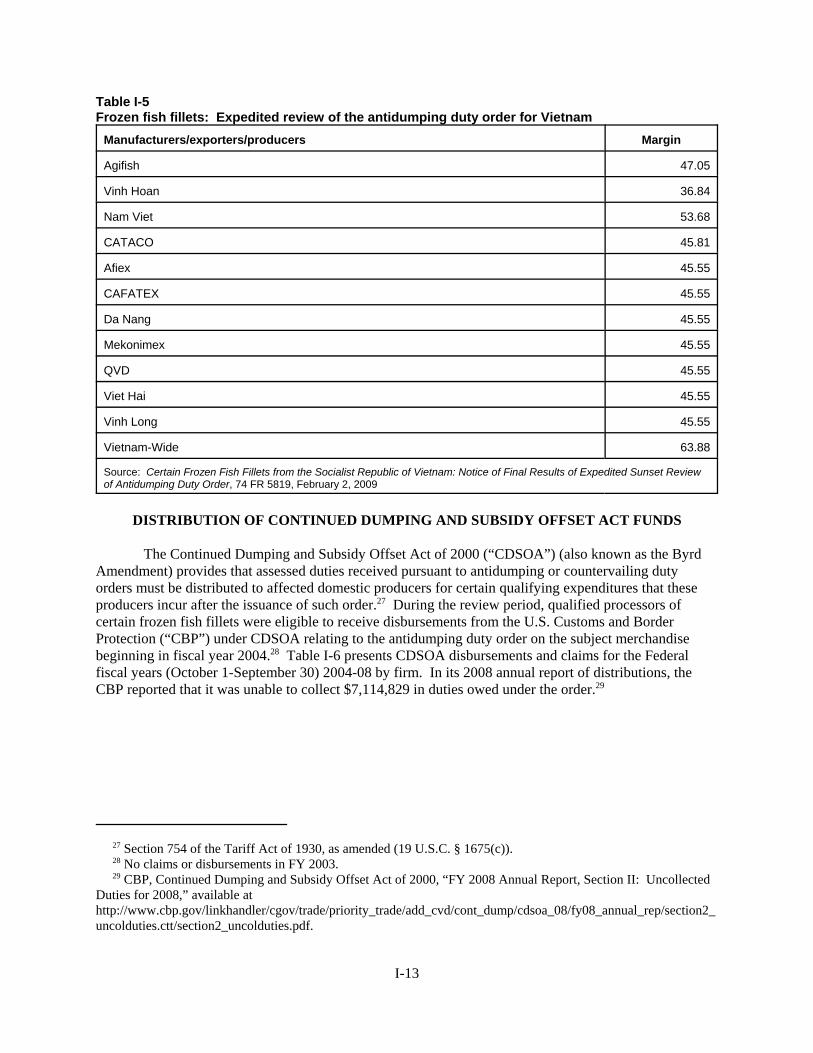
27 Section 754 of the Tariff Act of 1930, as amended (19 U.S.C. § 1675(c)). 28 No claims or disbursements in FY 2003. 29 CBP, Continued Dumping and Subsidy Offset Act of 2000, “FY 2008 Annual Report, Section II: UncollectedDuties for 2008,” available athttp://www.cbp.gov/linkhandler/cgov/trade/priority_trade/add_cvd/cont_dump/cdsoa_08/fy08_annual_rep/section2_uncolduties.ctt/section2_uncolduties.pdf.
I-13
Table I-5Frozen fish fillets: Expedited review of the antidumping duty order for Vietnam
Manufacturers/exporters/producers Margin
Agifish 47.05
Vinh Hoan 36.84
Nam Viet 53.68
CATACO 45.81
Afiex 45.55
CAFATEX 45.55
Da Nang 45.55
Mekonimex 45.55
QVD 45.55
Viet Hai 45.55
Vinh Long 45.55
Vietnam-Wide 63.88
Source: Certain Frozen Fish Fillets from the Socialist Republic of Vietnam: Notice of Final Results of Expedited Sunset Reviewof Antidumping Duty Order, 74 FR 5819, February 2, 2009
DISTRIBUTION OF CONTINUED DUMPING AND SUBSIDY OFFSET ACT FUNDS
The Continued Dumping and Subsidy Offset Act of 2000 (“CDSOA”) (also known as the ByrdAmendment) provides that assessed duties received pursuant to antidumping or countervailing dutyorders must be distributed to affected domestic producers for certain qualifying expenditures that theseproducers incur after the issuance of such order.27 During the review period, qualified processors ofcertain frozen fish fillets were eligible to receive disbursements from the U.S. Customs and BorderProtection (“CBP”) under CDSOA relating to the antidumping duty order on the subject merchandisebeginning in fiscal year 2004.28 Table I-6 presents CDSOA disbursements and claims for the Federalfiscal years (October 1-September 30) 2004-08 by firm. In its 2008 annual report of distributions, theCBP reported that it was unable to collect $7,114,829 in duties owed under the order.29
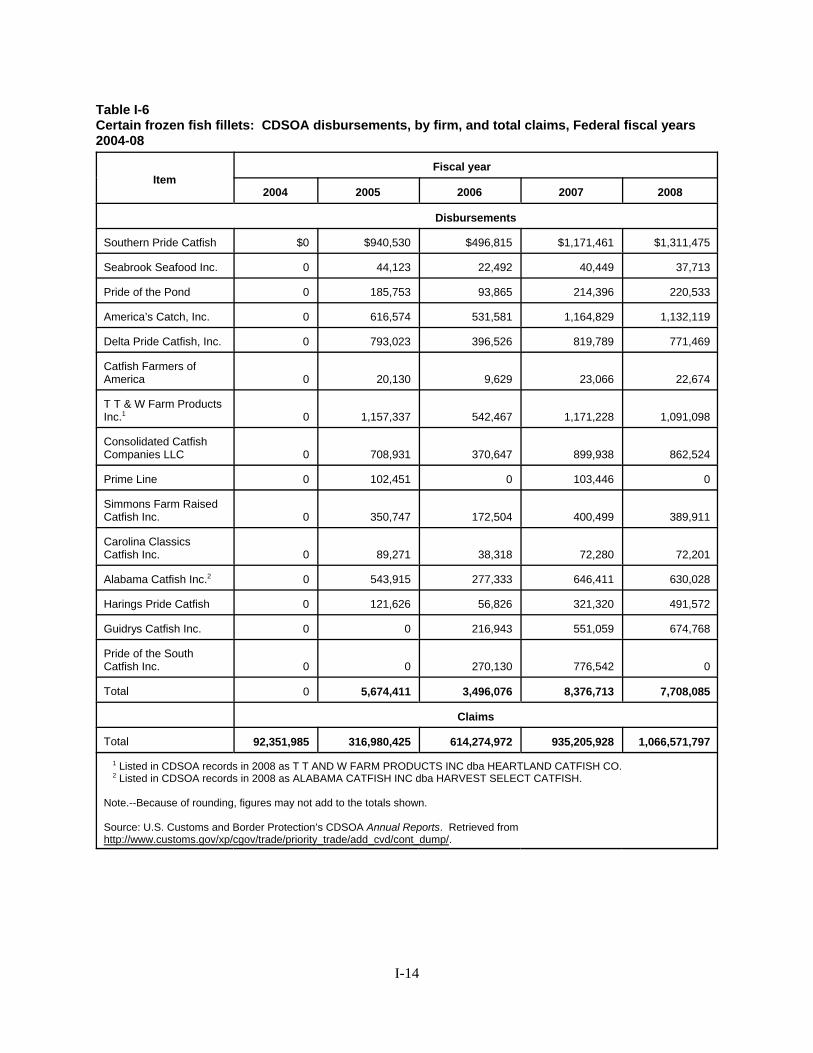
I-14
Table I-6Certain frozen fish fillets: CDSOA disbursements, by firm, and total claims, Federal fiscal years2004-08
ItemFiscal year
2004 2005 2006 2007 2008
Disbursements
Southern Pride Catfish $0 $940,530 $496,815 $1,171,461 $1,311,475
Seabrook Seafood Inc. 0 44,123 22,492 40,449 37,713
Pride of the Pond 0 185,753 93,865 214,396 220,533
America’s Catch, Inc. 0 616,574 531,581 1,164,829 1,132,119
Delta Pride Catfish, Inc. 0 793,023 396,526 819,789 771,469
Catfish Farmers ofAmerica 0 20,130 9,629 23,066 22,674
T T & W Farm ProductsInc.1 0 1,157,337 542,467 1,171,228 1,091,098
Consolidated CatfishCompanies LLC 0 708,931 370,647 899,938 862,524
Prime Line 0 102,451 0 103,446 0
Simmons Farm RaisedCatfish Inc. 0 350,747 172,504 400,499 389,911
Carolina ClassicsCatfish Inc. 0 89,271 38,318 72,280 72,201
Alabama Catfish Inc.2 0 543,915 277,333 646,411 630,028
Harings Pride Catfish 0 121,626 56,826 321,320 491,572
Guidrys Catfish Inc. 0 0 216,943 551,059 674,768
Pride of the SouthCatfish Inc. 0 0 270,130 776,542 0
Total 0 5,674,411 3,496,076 8,376,713 7,708,085
Claims
Total 92,351,985 316,980,425 614,274,972 935,205,928 1,066,571,797
1 Listed in CDSOA records in 2008 as T T AND W FARM PRODUCTS INC dba HEARTLAND CATFISH CO. 2 Listed in CDSOA records in 2008 as ALABAMA CATFISH INC dba HARVEST SELECT CATFISH.
Note.--Because of rounding, figures may not add to the totals shown.
Source: U.S. Customs and Border Protection’s CDSOA Annual Reports. Retrieved fromhttp://www.customs.gov/xp/cgov/trade/priority_trade/add_cvd/cont_dump/.
30 Notice of Antidumping Duty Order: Certain Frozen Fish Fillets from the Socialist Republic of Vietnam, 68 FR47909, August 12, 2003. 31 There have been several changes to the HTS classifications for reporting U.S. imports of frozen fish fillets. The following are the relevant statistical reporting numbers for subject frozen fish fillets during previous periods:
Until July 1, 2004: 0304.20.6030, 0304.20.6096, 0304.20.6043, and 0304.20.6057.Until February 1, 2007: 0304.20.6033.After February 1, 2007: 1604.19.4000, 1604.19.5000, 0305.59.4000, 0304.29.6033.
32 Other statistical reporting numbers of broader fish categories can include frozen basa and tra fillets. The tariffrate on breaded frozen fish fillets, classified under subheadings 1604.19.4000 and 1604.19.5000, are 10 percent and7.5 percent, respectively. The tariff rate on dried fish fillets, classified under 0305.59.4000, is free.
I-15
THE SUBJECT MERCHANDISE
Commerce’s Scope
The imported product subject to the andidumpting duty order under review, as defined byCommerce in its original orders, is as follows,
The product covered by this order is frozen fish fillets, including regular, shank, and stripfillets and portions thereof, whether or not breaded or marinated, of the speciesPangasius Bocourti, Pangasius Hypophthalmus (also known as Pangasius Pangasius),and Pangasius Micronemus. Frozen fish fillets are lengthwise cuts of whole fish. Thefillet products covered by the scope include boneless fillets with the belly flap intact(“regular” fillets), boneless fillets with the belly flap removed (“shank” fillets), bonelessshank fillets cut into strips (“fillets strips/finger”), which include fillets cut into strips,chunks, blocks, skewers, or any other shape. Specifically excluded from the scope arefrozen whole fish (whether or not dressed), frozen steaks, and frozen belly-flap nuggets.Frozen whole dressed fish are deheaded, skinned, and eviscerated. Steaks are bone-in,cross-section cuts of dressed fish. Nuggets are the belly-flaps. The subject merchandisewill be hereinafter referred to as frozen “basa” and “tra” fillets, which are the Vietnamesecommon names for these species of fish.30
Tariff Treatment
Certain frozen fish fillets are imported under the following statistical reporting numbers of theHarmonized Tariff Schedule of the United States (“HTS”): 1604.19.4000, 1604.19.5000, 0305.59.4000,and 0304.29.6033.31 At the time of the original investigation the tariff rate on frozen fish fillets fromVietnam and all general duty rate countries was free (prior to December 1, 2001, the tariff rate applicableto Vietnam was the column 2 rate of 5.5 cents per kilogram). The 2009 general rate of duty on the bulkof certain frozen fish fillet imports is free.32
33 Certain Frozen Fish Fillets from Vietnam, Inv. No. 731-TA-1012 (Final), USITC Publication 3617, August2003, pp. 6-9. 34 Domestic interested parties’ response to notice of institution, p. 24. The domestic like parties believe theCommission must continue, as it did in the original investigation, to recognize the interdependence of the processorsand catfish farmers and to consider this relationship and the role of farms as a condition of competition. Domesticinterested parties’ prehearing brief, p. 8. 35 VASEP’s response to the notice of institution, pp. 1-4; Catfish Farmers of America & Individual Processors’response to the notice of institution, p. 24. 36 Catfish Farmers of America & Individual Processors’ comments on draft questionnaires (January 28, 2009). VASEP provided no comments on the draft questionnaires. 37 Domestic interested parties’ prehearing brief, p. 8. 38 Information in this section is largely drawn from the final staff report in the original investigation. 39 Some farmers raise fingerlings only, selling these as feedstock to the other farmers.
I-16
THE DOMESTIC LIKE PRODUCT
In the original investigation, the Commission faced a situation in which there was no domesticproduct that was “like” the subject imports, and therefore found the domestic product that was “mostsimilar” in terms of physical characteristics and uses to frozen basa and tra fillets to be frozen catfishfillets.33 In response to the Commission’s notice of institution, the domestic interested parties indicatedthat they agreed with this definition of the domestic like product,34 while VASEP remained silent on theissue.35 After reviewing the draft questionnaires issued by the Commission, no party requested thecollection of additional information on the issue of the domestic like product.36 The domestic interestedparties subsequently confirmed their agreement with the Commission’s original definition.37
Description38
Basa/tra and catfish each belong to wholly separate families of freshwater fish with distinctphysical characteristics, but they are both regarded in the food industry as mild-tasting, white meat,freshwater fish, and when processed into frozen fillets are considered generally similar in appearance,price, texture, and taste. A fillet is one of two sides of a fish with head, tail, bones, and entrails removed.“Regular” fillets include the belly flap, or “nugget;” “shank” fillets have the flap removed; and “strip” (or“finger”) fillets are finger-sized strips cut from regular or shank fillets. Each fillet ranges in size from2 ounces to over 12 ounces frozen.
The Production Process
Virtually all of the basa/tra and catfish from which the subject fillets are made are commerciallyraised on farms, which may or may not be related to the processing plants that produce the subjectproduct. Regardless of any joint ownership, farming and processing generally take place at separatelocations and are discussed separately below.
Farming
In the United States catfish are raised in man-made, earthen ponds, 10 to 20 acres in size and 3 to6 feet deep on over 1,000 farms, located mainly in the Southeast (particularly in Mississippi, Alabama,Arkansas, and Texas) where climate and topography favor the process. The ponds are stocked withfingerlings 2 to 3 inches in length39 that receive a daily feeding until they reach a foodsize of at least 0.75
40 Yields drop significantly after the fish reaches 2-3 pounds and additional costs are incurred per pound to raisethe fish. Staff field trip notes, May 1, 2009. 41 Off-flavors are generally caused by blooms of certain algae, and such blooms are usually short-lived. If aspecific pond’s fish are rejected for flavor several times in a row, the farmer may remove the fish to another pondwith less algae or apply an algaecide to kill all the algae in the pond. The latter is detrimental to the pond as algaeaid in the pond’s oxygenation. 42 VASEP questionnaire response. 43 The heads, tails, skin, and viscera of the fish are saleable byproducts, usually sold to rendering plants for use inthe production of fish meal and oil. 44 In the United States the fillets are treated with a tripolyphosphate solution prior to freezing to prevent excessivewater loss.
I-17
pound and usually not over 3 pounds, which is generally the range that can be processed efficiently.40 Fingerlings reach foodsize in about 10 weeks, and harvesting is year-round, although individual farmsmay only harvest 2 or 3 times annually. Because several sizes of catfish are in a pond at any one time,harvesting generally takes place using nets that allow fish smaller than foodsize to escape. Processorsgenerally are very particular about the size and flavor of the fish they purchase, often testing the fish inspecific ponds for flavor and sometimes rejecting a pond’s fish on the basis of flavor alone.41 Afterharvesting, the fish are placed into tank trucks and are transported live to the processing plant. Catfishfarmers in the United States raise no other kinds of fish, and the vast bulk of the fish they raise is sold toprocessors. The remainder is sold fresh to local markets.
In Vietnam the fish are raised in cages in the Mekong River, mostly in the delta region, and atharvest are transported live downriver in cage boats to processors. The number of individual farms inVietnam is unknown. Processing
To produce frozen fish fillets, U.S. and Vietnamese processing plants perform the same steps,either automatically or manually depending on the individual processor, although most Vietnameseprocessors are not automated. Currently, 19 processing plants operate in the United States, and more than80 are known to operate in Vietnam.42 The fish, held live in pre-processing tanks, are first deheaded,eviscerated, skinned, and filleted, and then, after chilling and sorting by weight, are quick-frozen andglazed.43 Any breading or marinating is done before freezing. Quick freezing, by which the fillets arereduced from 32 degrees Fahrenheit to 15 degrees Fahrenheit in 30 minutes or less, enables the fish toretain more of its original (fresh) quality.44 Upon leaving the freezer, a sprayer or water bath coats thefillets with a thin layer of ice (glaze). Finally, the fillets are packaged according to size in 15-poundcardboard shipping cartons lined with polyethylene bags and warehoused at 0 degrees Fahrenheit orbelow until shipment. The Vietnamese product is packaged in 10-pound cartons.
Most processors in the United States process catfish exclusively, but into many commercialproducts other than frozen fillets, including fresh (or “iced”) fillets, fresh and frozen whole fish, fresh andfrozen dressed fish (deheaded, eviscerated, and skinned), and fresh and frozen steaks (cross sections oflarge fish). The nuggets of shank fillets are also sold separately, both fresh and frozen. Based onquestionnaire responses, in 2008, 23 percent of the weight of the U.S.-grown live catfish that processorsused was processed into frozen fillets, 29 percent was processed into other products (especially wholefresh fish, fresh fish fillets, and frozen belly-flap nuggets), and 48 percent was offal-unused parts of thefish that were mostly sold for use in fish meal, fertilizer, and oil. Unlike U.S. processors, the Vietnameseprocessors also process water animals other than the subject product, including various types of mollusks,crustaceans, and other types of fish.
45 According to the response of *** in its purchaser questionnaire, “in the past year or two...a distinction in themarketplace...(has been created) between Basa (Pangasius bocourti) and Swai (Pangasius hypophthalamus). Swaiis the cheaper and lower quality version of the two Pangasius species readily available.” In addition, in its purchaserquestionnaire, *** reports that, “When Vietnamese fish farmers started farming catfish, most of the production wasbasa, which was raised in floating cages in the vast Mekong River Delta. However, in recent years, almost allVietnamese fish farmers have switched to tra, which now accounts for more than *** percent of Vietnam’s farmedcatfish production and a reported *** percent of exports. In addition to being hardier, tra are faster growing. Whilebasa take 12 months to reach a marketable size of about 3.5-4 pounds, tra can be grown to that size in just 6 months. This allows farmers to grow two crops of tra a year, making it a more economically attractive fish to farm. Inaddition to being raised in cages, tra are farmed in earthen ponds. Although basa are considered to have a bettertexture and flavor, both tra and basa are mild tasting, white-fleshed fish that have quickly found favor in marketsaround the world.” 46 Domestic interested parties’ prehearing brief at 18; hearing transcript, p. 26 (Walker). 47 Hearing transcript, pp. 32-34 (Renfroe). 48 Hearing transcript, p. 33 (Renfroe). 49 Texas is one of the largest catfish consuming states. There are two known U.S. processors in Texas, however,the two processors are relatively small compared to the rest of the industry, and they purchase much of their freshfish from other states. Hearing transcript, pp. 32-33 (Renfroe) and pp. 121-122 (Rhodes). 50 Catfish Processing, USDA, NASS, March 2009.
I-18
Vietnamese basa and tra were originally widely marketed, sold, and labeled in the UnitedStates as catfish; however, Congressional legislation prohibited this practice at all levels of U.S. salesbeginning January 2002 (the legislation was signed into law on May 13, 2002, but was retroactive toJanuary 1, 2002). Some other names have been used in the marketing and labeling of Vietnamese basaand tra, including “basa/tra,” “swai/sutchi,” and “Pangasius.”45 Distributors, sellers, or restaurant ownersmay still be offering basa and tra as a substitute for catfish whether in oral communications, price lists, ormenus.46 Reportedly, basa and tra does not have its own identity at the restaurant level and is known tohave been marketed to customers as “southern fried fish.”47 Hearing testimony indicates that state levellabeling laws and community pressure in catfish producing regions may be a deterrent of such practices inthe major producing states.48
U.S. MARKET PARTICIPANTS
U.S. Farmers
Domestic catfish farming has generally contracted since the original investigation. At the farmerlevel, U.S. total catfish water acres decreased by 13 percent during 2003-08, falling by 17 percent,13 percent, and 8 percent in Mississippi, Alabama, and Arkansas, respectively, but increasing in Texas,by more than 300 percent (table I-7).49 The value of grower sales fell 4 percent over the period. Thenumber of farming operations fluctuated upward, with a 12 percent increase over the period January 2003to January 2009. The number of farming operations reached a peak in January 2008 of 1,617 beforefalling by January 2009 to 1,306. Overall catfish pounds processed decreased from a historical high of661,504 million pounds in 2003 to 509,597 million pounds in 2008.50
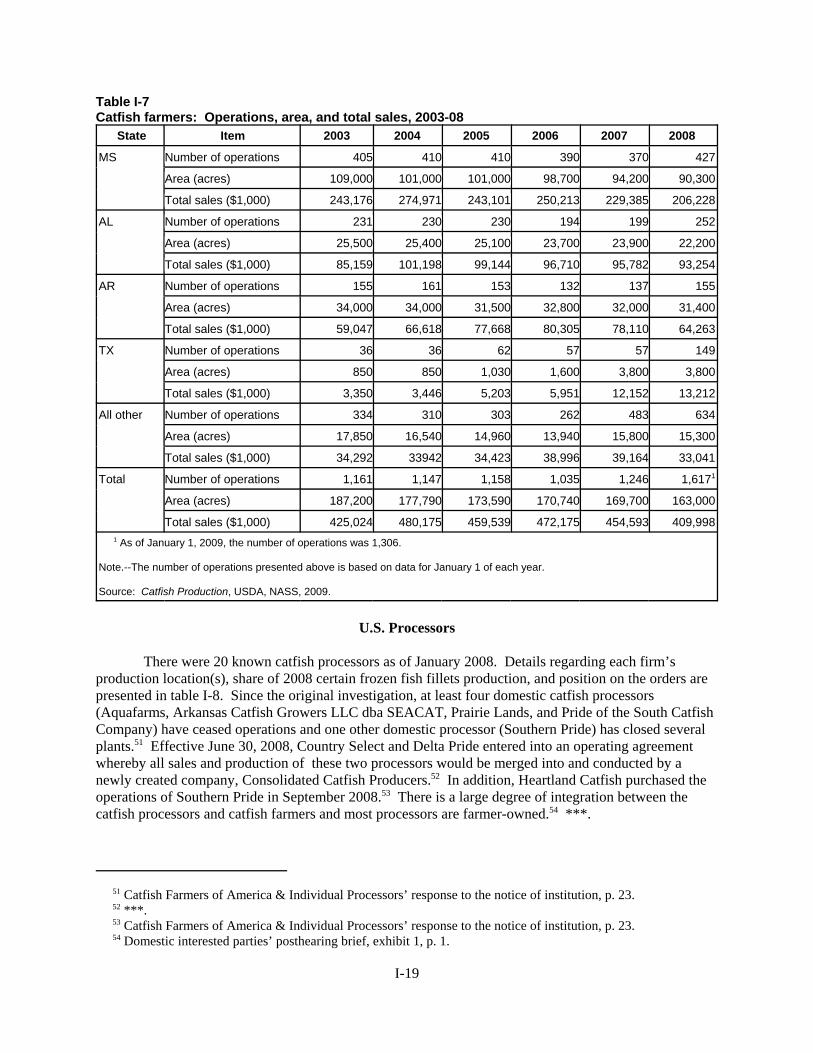
51 Catfish Farmers of America & Individual Processors’ response to the notice of institution, p. 23. 52 ***. 53 Catfish Farmers of America & Individual Processors’ response to the notice of institution, p. 23. 54 Domestic interested parties’ posthearing brief, exhibit 1, p. 1.
I-19
Table I-7Catfish farmers: Operations, area, and total sales, 2003-08
State Item 2003 2004 2005 2006 2007 2008
MS Number of operations 405 410 410 390 370 427
Area (acres) 109,000 101,000 101,000 98,700 94,200 90,300
Total sales ($1,000) 243,176 274,971 243,101 250,213 229,385 206,228
AL Number of operations 231 230 230 194 199 252
Area (acres) 25,500 25,400 25,100 23,700 23,900 22,200
Total sales ($1,000) 85,159 101,198 99,144 96,710 95,782 93,254
AR Number of operations 155 161 153 132 137 155
Area (acres) 34,000 34,000 31,500 32,800 32,000 31,400
Total sales ($1,000) 59,047 66,618 77,668 80,305 78,110 64,263
TX Number of operations 36 36 62 57 57 149
Area (acres) 850 850 1,030 1,600 3,800 3,800
Total sales ($1,000) 3,350 3,446 5,203 5,951 12,152 13,212
All other Number of operations 334 310 303 262 483 634
Area (acres) 17,850 16,540 14,960 13,940 15,800 15,300
Total sales ($1,000) 34,292 33942 34,423 38,996 39,164 33,041
Total Number of operations 1,161 1,147 1,158 1,035 1,246 1,6171
Area (acres) 187,200 177,790 173,590 170,740 169,700 163,000
Total sales ($1,000) 425,024 480,175 459,539 472,175 454,593 409,998
1 As of January 1, 2009, the number of operations was 1,306.
Note.--The number of operations presented above is based on data for January 1 of each year.
Source: Catfish Production, USDA, NASS, 2009.
U.S. Processors
There were 20 known catfish processors as of January 2008. Details regarding each firm’sproduction location(s), share of 2008 certain frozen fish fillets production, and position on the orders arepresented in table I-8. Since the original investigation, at least four domestic catfish processors(Aquafarms, Arkansas Catfish Growers LLC dba SEACAT, Prairie Lands, and Pride of the South CatfishCompany) have ceased operations and one other domestic processor (Southern Pride) has closed severalplants.51 Effective June 30, 2008, Country Select and Delta Pride entered into an operating agreementwhereby all sales and production of these two processors would be merged into and conducted by anewly created company, Consolidated Catfish Producers.52 In addition, Heartland Catfish purchased theoperations of Southern Pride in September 2008.53 There is a large degree of integration between thecatfish processors and catfish farmers and most processors are farmer-owned.54 ***.
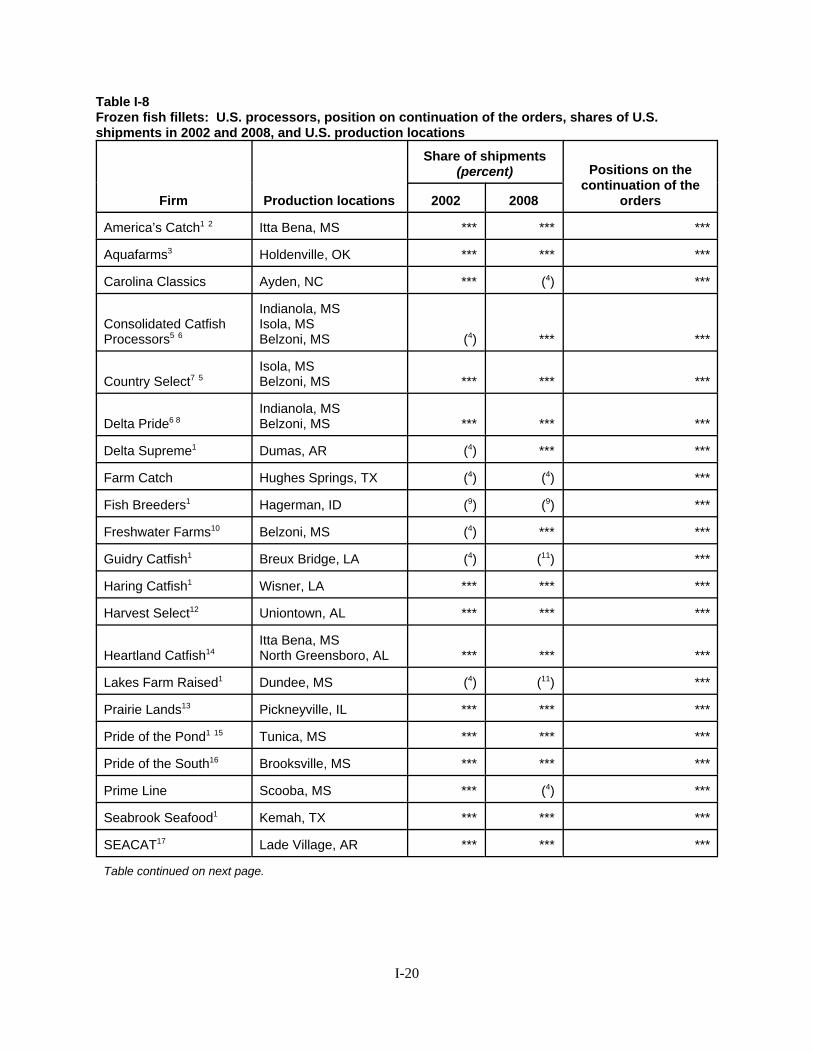
I-20
Table I-8Frozen fish fillets: U.S. processors, position on continuation of the orders, shares of U.S.shipments in 2002 and 2008, and U.S. production locations
Firm Production locations
Share of shipments(percent) Positions on the
continuation of theorders2002 2008
America’s Catch1 2 Itta Bena, MS *** *** ***
Aquafarms3 Holdenville, OK *** *** ***
Carolina Classics Ayden, NC *** (4) ***
Consolidated CatfishProcessors5 6
Indianola, MSIsola, MSBelzoni, MS (4) *** ***
Country Select7 5Isola, MSBelzoni, MS *** *** ***
Delta Pride6 8 Indianola, MSBelzoni, MS *** *** ***
Delta Supreme1 Dumas, AR (4) *** ***
Farm Catch Hughes Springs, TX (4) (4) ***
Fish Breeders1 Hagerman, ID (9) (9) ***
Freshwater Farms10 Belzoni, MS (4) *** ***
Guidry Catfish1 Breux Bridge, LA (4) (11) ***
Haring Catfish1 Wisner, LA *** *** ***
Harvest Select12 Uniontown, AL *** *** ***
Heartland Catfish14Itta Bena, MSNorth Greensboro, AL *** *** ***
Lakes Farm Raised1 Dundee, MS (4) (11) ***
Prairie Lands13 Pickneyville, IL *** *** ***
Pride of the Pond1 15 Tunica, MS *** *** ***
Pride of the South16 Brooksville, MS *** *** ***
Prime Line Scooba, MS *** (4) ***
Seabrook Seafood1 Kemah, TX *** *** ***
SEACAT17 Lade Village, AR *** *** ***
Table continued on next page.
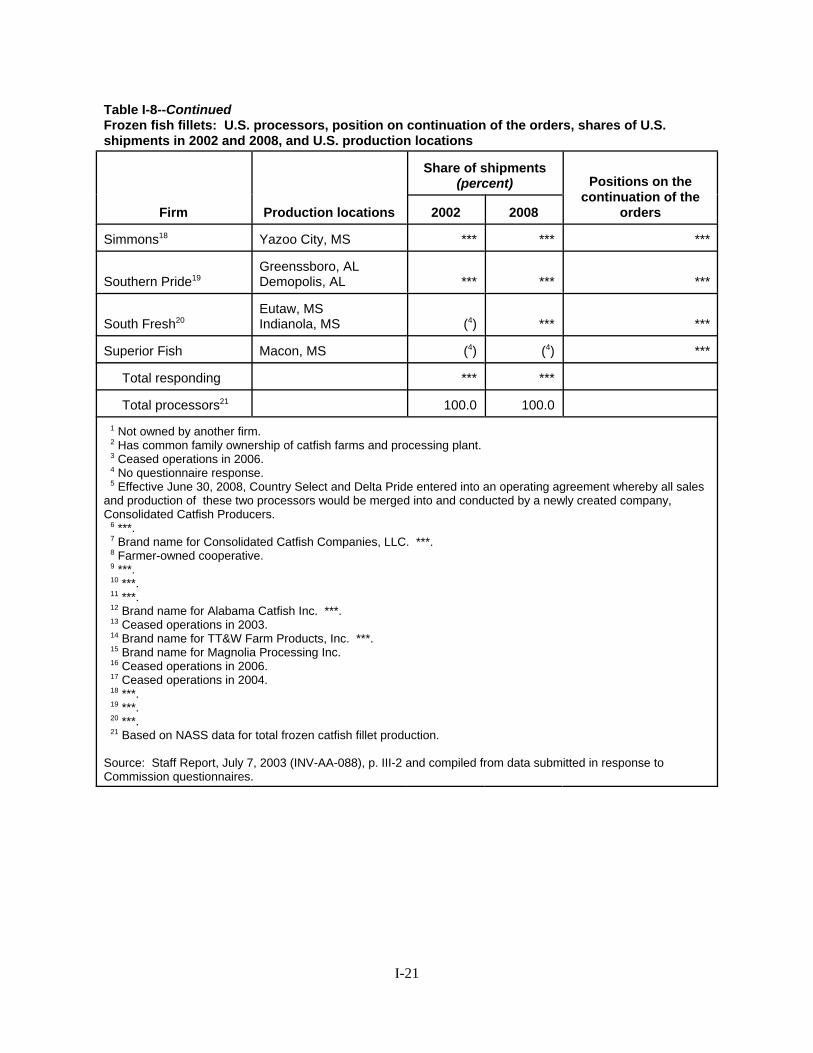
I-21
Table I-8--ContinuedFrozen fish fillets: U.S. processors, position on continuation of the orders, shares of U.S.shipments in 2002 and 2008, and U.S. production locations
Firm Production locations
Share of shipments(percent) Positions on the
continuation of theorders2002 2008
Simmons18 Yazoo City, MS *** *** ***
Southern Pride19Greenssboro, ALDemopolis, AL *** *** ***
South Fresh20 Eutaw, MSIndianola, MS (4) *** ***
Superior Fish Macon, MS (4) (4) ***
Total responding *** ***
Total processors21 100.0 100.0
1 Not owned by another firm. 2 Has common family ownership of catfish farms and processing plant. 3 Ceased operations in 2006. 4 No questionnaire response. 5 Effective June 30, 2008, Country Select and Delta Pride entered into an operating agreement whereby all salesand production of these two processors would be merged into and conducted by a newly created company,Consolidated Catfish Producers. 6 ***. 7 Brand name for Consolidated Catfish Companies, LLC. ***. 8 Farmer-owned cooperative. 9 ***. 10 ***. 11 ***. 12 Brand name for Alabama Catfish Inc. ***. 13 Ceased operations in 2003. 14 Brand name for TT&W Farm Products, Inc. ***. 15 Brand name for Magnolia Processing Inc. 16 Ceased operations in 2006. 17 Ceased operations in 2004. 18 ***. 19 ***. 20 ***. 21 Based on NASS data for total frozen catfish fillet production.
Source: Staff Report, July 7, 2003 (INV-AA-088), p. III-2 and compiled from data submitted in response toCommission questionnaires.
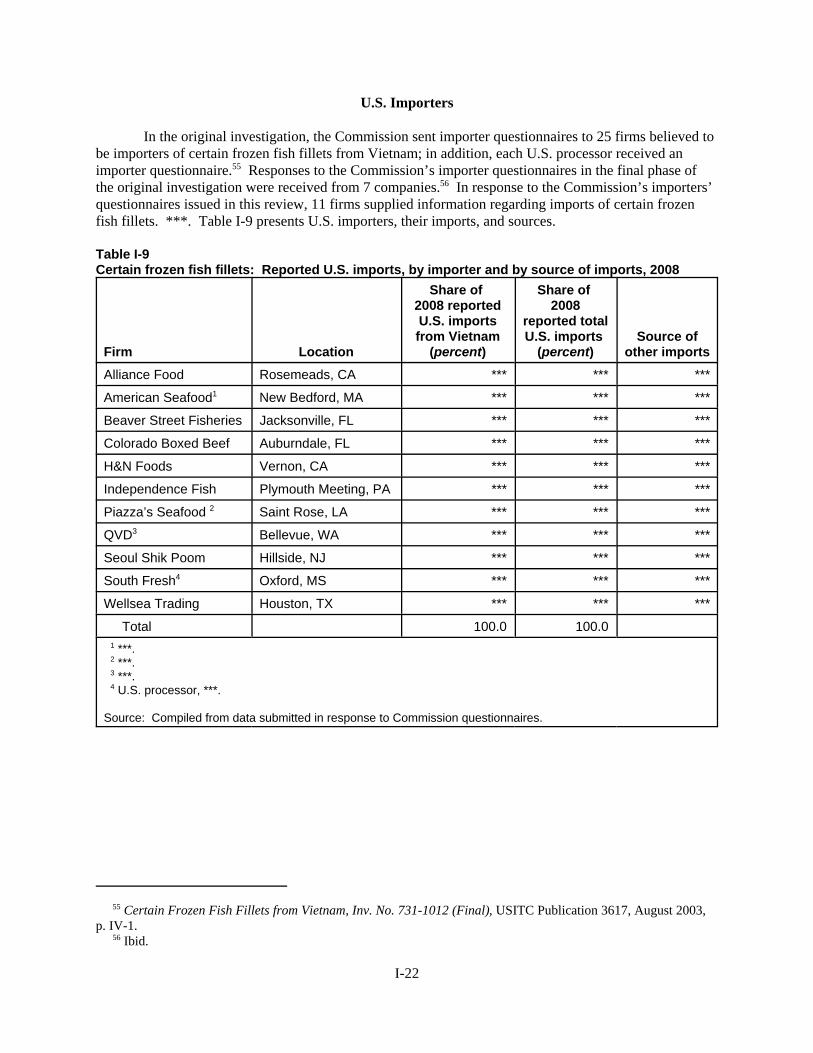
55 Certain Frozen Fish Fillets from Vietnam, Inv. No. 731-1012 (Final), USITC Publication 3617, August 2003,p. IV-1. 56 Ibid.
I-22
U.S. Importers
In the original investigation, the Commission sent importer questionnaires to 25 firms believed tobe importers of certain frozen fish fillets from Vietnam; in addition, each U.S. processor received animporter questionnaire.55 Responses to the Commission’s importer questionnaires in the final phase ofthe original investigation were received from 7 companies.56 In response to the Commission’s importers’questionnaires issued in this review, 11 firms supplied information regarding imports of certain frozenfish fillets. ***. Table I-9 presents U.S. importers, their imports, and sources.
Table I-9Certain frozen fish fillets: Reported U.S. imports, by importer and by source of imports, 2008
Firm Location
Share of 2008 reportedU.S. importsfrom Vietnam
(percent)
Share of 2008
reported totalU.S. imports
(percent)Source of
other importsAlliance Food Rosemeads, CA *** *** ***
American Seafood1 New Bedford, MA *** *** ***
Beaver Street Fisheries Jacksonville, FL *** *** ***
Colorado Boxed Beef Auburndale, FL *** *** ***
H&N Foods Vernon, CA *** *** ***
Independence Fish Plymouth Meeting, PA *** *** ***
Piazza’s Seafood 2 Saint Rose, LA *** *** ***
QVD3 Bellevue, WA *** *** ***
Seoul Shik Poom Hillside, NJ *** *** ***
South Fresh4 Oxford, MS *** *** ***
Wellsea Trading Houston, TX *** *** ***
Total 100.0 100.0 1 ***. 2 ***. 3 ***. 4 U.S. processor, ***.
Source: Compiled from data submitted in response to Commission questionnaires.
57 Of the 26 responding purchasers, 17 purchased the domestic frozen catfish fillets and a combination of thefrozen basa and tra fillets from Vietnam and/or the subject products from third countries, 5 purchased only thedomestic frozen catfish fillets, 2 purchased only the frozen basa and tra fillets from Vietnam, and 2 purchased thesubject products only from third countries. Of the total purchases reported during 2003-08, the domestic frozencatfish fillets accounted for 61.9 percent, the frozen basa and tra fillets from Vietnam accounted for 15.9 percent, thesubject products from third countries accounted for 8.2 percent, and an unspecified mix of domestic and importedsubject products from Vietnam and third countries accounted for 14.0 percent. 58 These 12 firms are ***. 59 These 5 firms are ***. 60 These firms are ***. 61 These firms are ***. ***. 62 U.S. purchaser questionnaire responses, section III-2. 63 The responding food service distributors reported selling the certain frozen fish fillets primarily to restaurants,but also to hotels, school systems, healthcare facilities, nursing homes, the military, and casinos; two of these firmsalso reported selling the subject products to grocery chains, club stores, convenience stores, and delis. U.S.purchaser questionnaire responses, section III-4. 64 The responding wholesale distributors reported selling the certain frozen fish fillets primarily to grocery storesand warehouses of retail supermarkets, but also to food service distributors and to the military. Ibid.
I-23
U.S. Purchasers
The Commission received 26 useable purchaser questionnaire responses from firms that bought frozen fillets of basa, tra, and/or catfish during 2003-08.57 Twelve responding purchasers are food servicedistributors,58 6 are restaurants,59 5 are wholesale distributors,60 and 5 are grocery chains;61 one of the foodservice distributors reported it was also a wholesale distributor and one of the restaurants reported that itwas also a food service distributor.62 Reported purchases from these 26 purchasers totaled almost363.3 million pounds of certain frozen fish fillets during 2003-08 (involves some double counting), whichis 31.6 percent of the quantity of total U.S. consumption of these products during this period. The largestpurchaser based on the total reported quantity of certain frozen fish fillets purchased during 2003-08 byall 26 responding firms was ***, followed by ***, ***, and ***.
The 10 firms that were solely food service distributors accounted for 74.5 percent of the quantityof total purchases of certain frozen fish fillets reported during 2003-08.63 The 5 firms that were solelyrestaurants accounted for 12.1 percent of the quantity reported; the 4 firms that were solely wholesaledistributors accounted for 11.4 percent of the quantity reported;64 and the 5 firms that were grocery chainsaccounted for 1.2 percent of the quantity reported. The combined purchases of the purchaser that was afood service and wholesale distributor, and the purchaser that was both a restaurant and food servicedistributor accounted for the remaining 0.8 percent of the quantity reported.
APPARENT U.S. CONSUMPTION AND MARKET SHARES
Table I-10 presents U.S. shipments, imports, and apparent U.S. consumption of certain frozenfish fillets for 2003-08. Table I-11 presents total U.S. consumption and market shares for the sameperiod. Apparent U.S. consumption increased between 2003 and 2006, decreased in 2007, and thenincreased in 2008 (but remained below the 2006 peak level of apparent consumption). The U.S.processors’ market share decreased throughout the period 2003-08. The market share of imports ofcertain frozen fish fillets from Vietnam increased overall from 2003 to 2008, with slight declines in 2005and 2007. Imports from other sources increased markedly from 2003 to 2008 and accounted for agrowing share of the U.S. market, while U.S. processors’ shipments decreased overall and accounted for adiminishing share of the U.S. market.
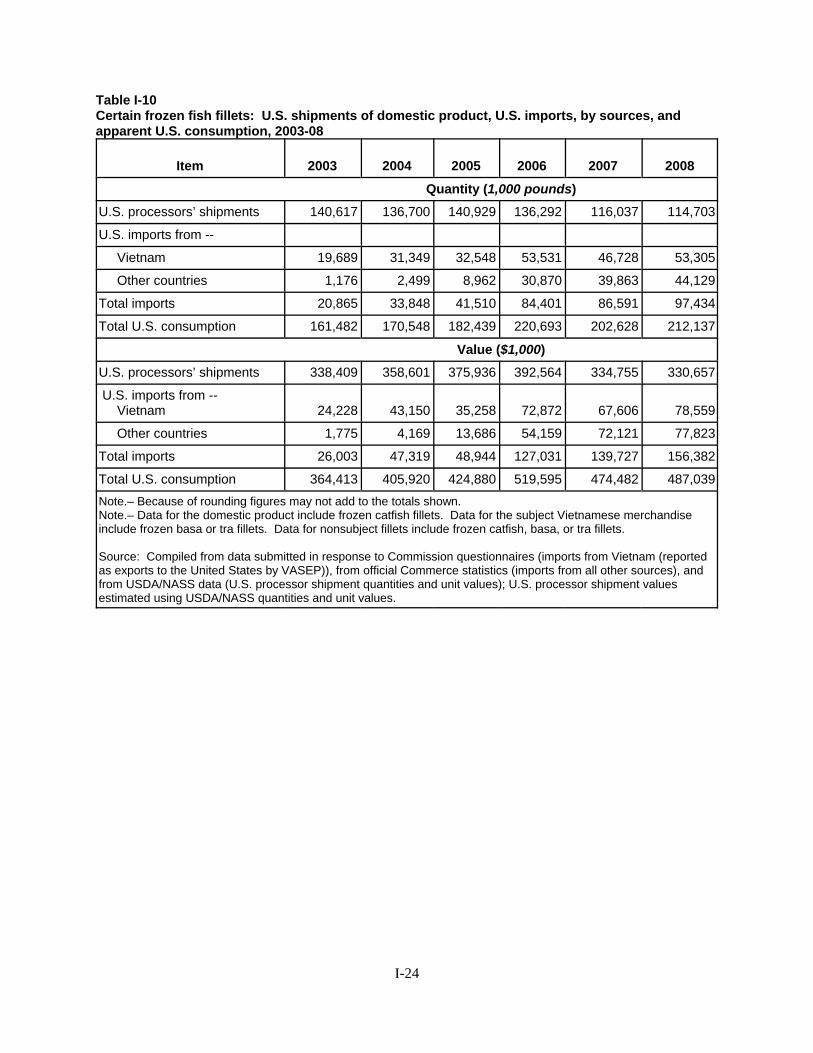
I-24
Table I-10Certain frozen fish fillets: U.S. shipments of domestic product, U.S. imports, by sources, andapparent U.S. consumption, 2003-08
Item 2003 2004 2005 2006 2007 2008
Quantity (1,000 pounds)U.S. processors’ shipments 140,617 136,700 140,929 136,292 116,037 114,703
U.S. imports from --
Vietnam 19,689 31,349 32,548 53,531 46,728 53,305
Other countries 1,176 2,499 8,962 30,870 39,863 44,129
Total imports 20,865 33,848 41,510 84,401 86,591 97,434
Total U.S. consumption 161,482 170,548 182,439 220,693 202,628 212,137
Value ($1,000)U.S. processors’ shipments 338,409 358,601 375,936 392,564 334,755 330,657
U.S. imports from -- Vietnam 24,228 43,150 35,258 72,872 67,606 78,559
Other countries 1,775 4,169 13,686 54,159 72,121 77,823
Total imports 26,003 47,319 48,944 127,031 139,727 156,382
Total U.S. consumption 364,413 405,920 424,880 519,595 474,482 487,039Note.– Because of rounding figures may not add to the totals shown.Note.– Data for the domestic product include frozen catfish fillets. Data for the subject Vietnamese merchandiseinclude frozen basa or tra fillets. Data for nonsubject fillets include frozen catfish, basa, or tra fillets.
Source: Compiled from data submitted in response to Commission questionnaires (imports from Vietnam (reportedas exports to the United States by VASEP)), from official Commerce statistics (imports from all other sources), andfrom USDA/NASS data (U.S. processor shipment quantities and unit values); U.S. processor shipment valuesestimated using USDA/NASS quantities and unit values.
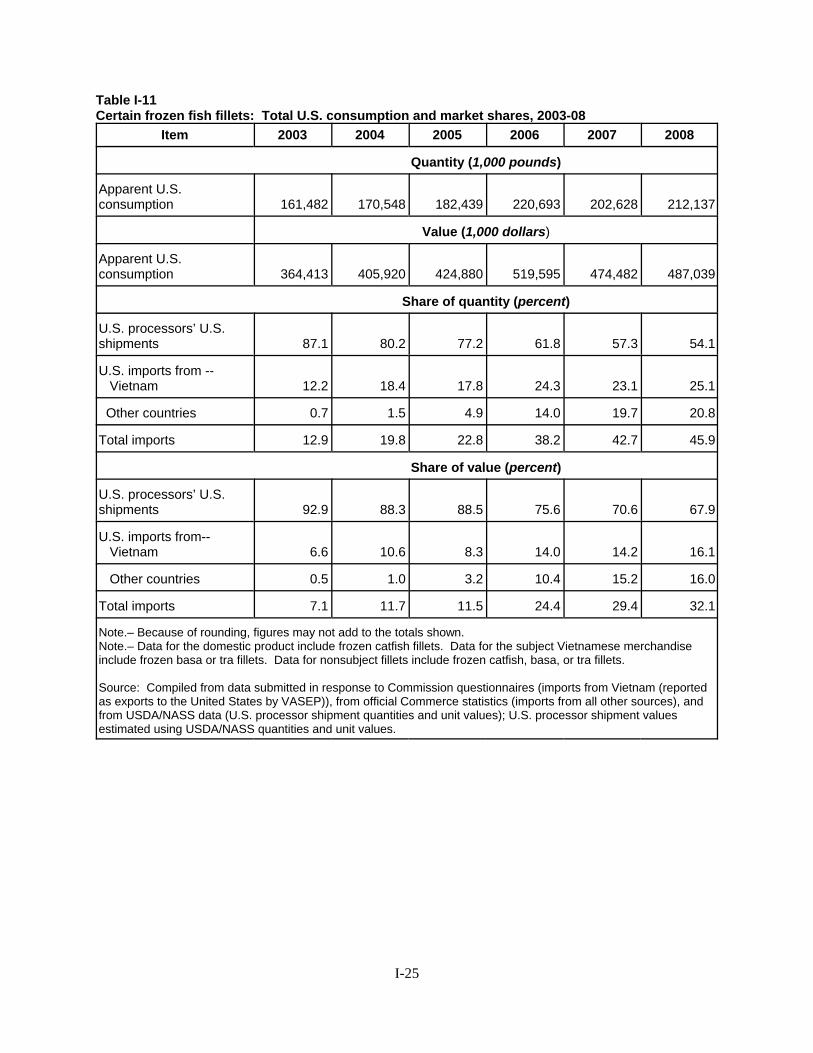
I-25
Table I-11Certain frozen fish fillets: Total U.S. consumption and market shares, 2003-08
Item 2003 2004 2005 2006 2007 2008
Quantity (1,000 pounds)
Apparent U.S.consumption 161,482 170,548 182,439 220,693 202,628 212,137
Value (1,000 dollars)
Apparent U.S.consumption 364,413 405,920 424,880 519,595 474,482 487,039
Share of quantity (percent)
U.S. processors’ U.S.shipments 87.1 80.2 77.2 61.8 57.3 54.1
U.S. imports from -- Vietnam 12.2 18.4 17.8 24.3 23.1 25.1
Other countries 0.7 1.5 4.9 14.0 19.7 20.8
Total imports 12.9 19.8 22.8 38.2 42.7 45.9
Share of value (percent)
U.S. processors’ U.S.shipments 92.9 88.3 88.5 75.6 70.6 67.9
U.S. imports from-- Vietnam 6.6 10.6 8.3 14.0 14.2 16.1
Other countries 0.5 1.0 3.2 10.4 15.2 16.0
Total imports 7.1 11.7 11.5 24.4 29.4 32.1
Note.– Because of rounding, figures may not add to the totals shown.Note.– Data for the domestic product include frozen catfish fillets. Data for the subject Vietnamese merchandiseinclude frozen basa or tra fillets. Data for nonsubject fillets include frozen catfish, basa, or tra fillets.
Source: Compiled from data submitted in response to Commission questionnaires (imports from Vietnam (reportedas exports to the United States by VASEP)), from official Commerce statistics (imports from all other sources), andfrom USDA/NASS data (U.S. processor shipment quantities and unit values); U.S. processor shipment valuesestimated using USDA/NASS quantities and unit values.

1 U.S. producer and importer questionnaire responses, sections II-11 and II-8, respectively. 2 These “other” customers were described by U.S. processors and importers as grocery chains, retail stores, andwarehouse clubs. Ibid. 3 This distribution is similar to that reported during the original investigation. Original staff report, p. II-1. 4 Domestic interested parties asserted that certain frozen fish fillets are sold primarily to food service (e.g.,restaurants) and the remainder to grocery stores. Hearing transcript, p. 85 (Rhodes and Renfroe). 5 U.S. producer questionnaire responses, section IV-22, and USDA data for live farm-raised catfish discussed inPart V.
II-1
PART II: CONDITIONS OF COMPETITION IN THE U.S. MARKET
U.S. CHANNELS OF DISTRIBUTION
The reporting U.S. processors of frozen catfish fillets, U.S. importers of frozen basa and tra filletsfrom Vietnam, and U.S. importers of certain frozen fish fillets from nonsubject countries reported theirannual U.S. shipment quantities of the subject products to three specified categories of customers during2003-08.1 The shares of the reported shipment quantities to total reported shipments are shown bycountry and customer category in table II-1.
As seen in table II-1, the largest customer category by far was food service distributors for alldirect shipments from U.S. processors and importers of the domestic and imported certain frozen fishfillets during 2003-08, followed by direct shipments to “other” customers,2 and lastly, by only U.S.processors, direct shipments to restaurants.3 As noted in Part I, food service distributors generally sell to restaurants, where consumers purchase the vast majority of the certain frozen fish fillets.4
U.S. MARKET CHARACTERISTICS
Supply of certain frozen fish fillets to the U.S. market during 2003-08 was provided primarily byU.S. processors of the domestic frozen catfish fillets and by imported frozen basa and tra fillets fromVietnam and frozen catfish, basa, and tra fillets from China. U.S. processors’ domestic shipmentsfluctuated but decreased, beginning in 2006 and through the rest of the period, while U.S. imports of thefrozen basa, tra, and catfish fillets, including that from Vietnam and China, increased during 2003-08. Some imports of the frozen basa and tra fillets were mislabeled as other types of whitefish for periodsduring 2003-08, but as discussed in Part I the firms responsible were prosecuted.
A close relationship exists between the catfish farmers and processors of frozen catfish fillets; thefarmers sell most of their live catfish to the processors and many farmers and processors are related byownership or other arrangements. As a result, U.S. seasonal supply and demand factors affecting livecatfish and frozen catfish fillets, respectively, and changes in economy-wide and sectoral activity affectboth the U.S. farmer and processor.
U.S. processors, which use exclusively live U.S. farm-raised catfish as their major input, havefaced increasing purchase prices of such catfish during 2003-08, as catfish farmers’ costs, especially forfeed, increased during 2003-08, particularly during 2007-08. Some catfish farmers have not been able toincrease the selling price of their live catfish sufficiently to cover the increased costs and have reduced orstopped producing live catfish. This reduced the supply of live farm-raised catfish to the processorsduring much of 2003-08.5 In addition, U.S. processors of frozen catfish fillets have been mergingrecently, such that the industry has become more concentrated with fewer suppliers.
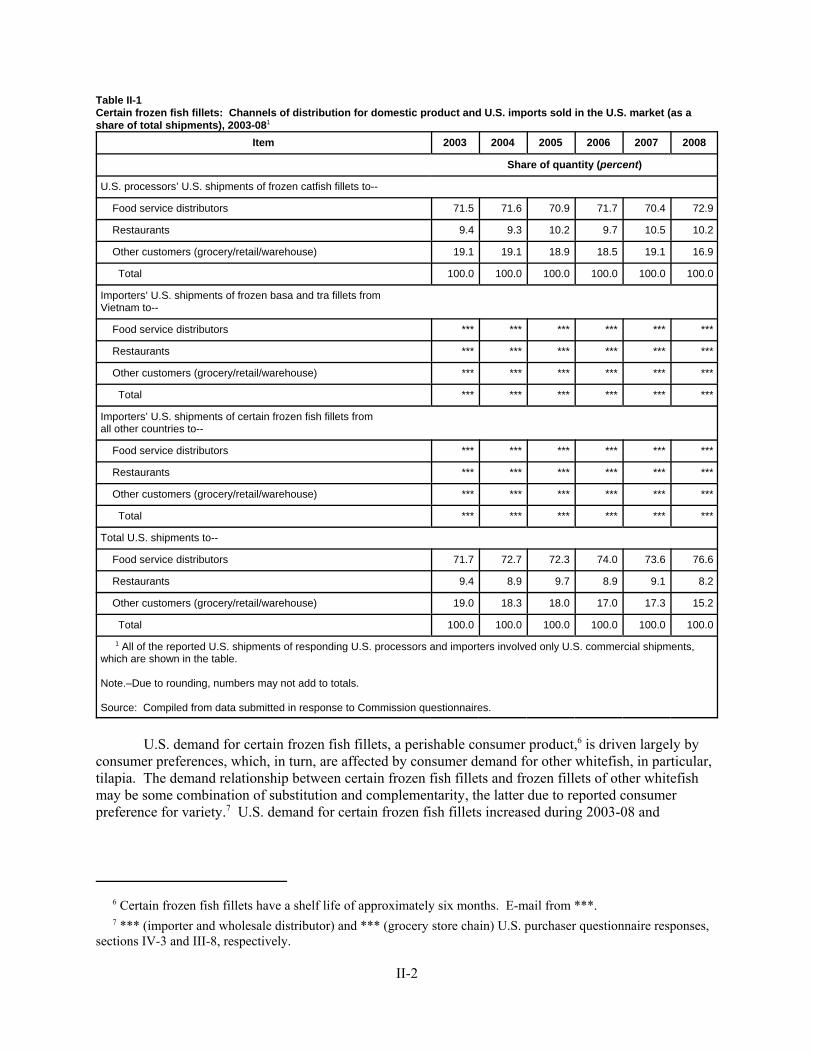
6 Certain frozen fish fillets have a shelf life of approximately six months. E-mail from ***. 7 *** (importer and wholesale distributor) and *** (grocery store chain) U.S. purchaser questionnaire responses,sections IV-3 and III-8, respectively.
II-2
Table II-1Certain frozen fish fillets: Channels of distribution for domestic product and U.S. imports sold in the U.S. market (as ashare of total shipments), 2003-081
Item 2003 2004 2005 2006 2007 2008
Share of quantity (percent)
U.S. processors’ U.S. shipments of frozen catfish fillets to--
Food service distributors 71.5 71.6 70.9 71.7 70.4 72.9
Restaurants 9.4 9.3 10.2 9.7 10.5 10.2
Other customers (grocery/retail/warehouse) 19.1 19.1 18.9 18.5 19.1 16.9
Total 100.0 100.0 100.0 100.0 100.0 100.0
Importers’ U.S. shipments of frozen basa and tra fillets fromVietnam to--
Food service distributors *** *** *** *** *** ***
Restaurants *** *** *** *** *** ***
Other customers (grocery/retail/warehouse) *** *** *** *** *** ***
Total *** *** *** *** *** ***
Importers’ U.S. shipments of certain frozen fish fillets fromall other countries to--
Food service distributors *** *** *** *** *** ***
Restaurants *** *** *** *** *** ***
Other customers (grocery/retail/warehouse) *** *** *** *** *** ***
Total *** *** *** *** *** ***
Total U.S. shipments to--
Food service distributors 71.7 72.7 72.3 74.0 73.6 76.6
Restaurants 9.4 8.9 9.7 8.9 9.1 8.2
Other customers (grocery/retail/warehouse) 19.0 18.3 18.0 17.0 17.3 15.2
Total 100.0 100.0 100.0 100.0 100.0 100.0
1 All of the reported U.S. shipments of responding U.S. processors and importers involved only U.S. commercial shipments,which are shown in the table.
Note.–Due to rounding, numbers may not add to totals.
Source: Compiled from data submitted in response to Commission questionnaires.
U.S. demand for certain frozen fish fillets, a perishable consumer product,6 is driven largely byconsumer preferences, which, in turn, are affected by consumer demand for other whitefish, in particular,tilapia. The demand relationship between certain frozen fish fillets and frozen fillets of other whitefishmay be some combination of substitution and complementarity, the latter due to reported consumerpreference for variety.7 U.S. demand for certain frozen fish fillets increased during 2003-08 and
8 U.S. producer, importer, and purchaser questionnaire responses, sections IV-15a/IV-16a, III-20a/III-21a, andIII-11a/III-12a, respectively. 9 U.S. producer questionnaire responses, section IV-11. 10 The Farm Security and Rural investment Act of 2002 established catfish labeling rules and country-of-originlabeling (COOL) requirements; the latter, which also requires the fish to be labeled wild or farm-raised, applies toproducts sold in retail stores, but exempts food service establishments. Arkansas, Louisiana, and Mississippi haveinstituted state labeling laws that are enforced at the restaurant level. Hearing transcript, p. 33 (Renfroe) anddomestic interested parties’ prehearing brief, exhibit 8. 11 *** purchaser questionnaire response, section III-9 and *** and *** purchaser questionnaire responses,sections III-36 and IV-4. 12 In the spring of 2007, the U.S. Food and Drug Administration blocked shipments of several types of seafoodfrom China, including catfish, following laboratory tests indicating the presence of drug residues, mostly cancer-causing antimicrobials and certain banned antibiotics. In addition, Alabama, Louisiana, and Mississippi previously banned sales of Chinese catfish in these states after antibiotic traces were found in specimens in 2006 and 2007. The2007 Farm Bill: Policy Options and Consequences–Catfish Policy, Terrill Hanson and J. Corey Miller, MississippiState University, February 2007. 13 U.S. purchaser questionnaire responses, section II-3. 14 One of these five firms, ***, provided additional comments. According to the firm, it sells ***, but itspurchases of the Vietnamese product have declined because the availability of the Vietnamese basa has declined as ithas been increasingly replaced by swai (tra).
II-3
generally is expected to increase in the future, but a number of firms expect demand to remain unchangedin the future.8
Substitution in demand between domestic frozen catfish fillets and frozen basa and tra fillets,including those from Vietnam may have decreased somewhat in the U.S. market during the past fewyears. U.S. processors asserted that the domestic and imported certain frozen fish fillets from Vietnamare substitutable.9 On the other hand, there has been an increased emphasis on labeling requirements10
and an asserted increase in consumer awareness of differences in taste and texture between these domesticand imported products.11 U.S. demand in parts of the southern United States reportedly exhibit strongregional preference for the domestic frozen catfish fillets. In addition, “Buy America” laws (military) andpreferences may enhance demand for the domestic frozen catfish. On the other hand, imports of frozencatfish fillets, particularly from China, are the same species as domestic frozen catfish fillets and may bethe most similar import product to the domestic product. However, health concerns about the Chinesecatfish may affect, at least somewhat, the degree to which these two sources of frozen catfish filletscompete in the U.S. market.12
Twelve of the 26 responding U.S. purchasers of certain frozen fish fillets reported purchasing theimported frozen basa and/or tra from Vietnam prior to the August 2003 application of antidumping dutyorders on the subject product from Vietnam.13 Three of these 12 firms indicated that they have notchanged their purchase patterns since August 2003, 4 firms indicated that they discontinued or reducedtheir purchases due to the antidumping duty order, and 5 firms indicated that they changed their purchasepattern for other reasons.14
15 U.S. purchaser questionnaire responses, section III-21. 16 U.S. purchaser questionnaire responses, section III-22a. 17 Domestic interested parties’ prehearing brief, p. 61, fn. 249. These prices are gathered on a survey basis andconsidered a reliable indicator of price trends, although price levels of specific sales transactions may differ from theprice levels reported. Staff telephone interview with ***. 18 U.S. purchaser questionnaire responses, section III-22b. 19 U.S. purchaser questionnaire responses, section III-23. 20 U.S. purchaser questionnaire responses, section III-24.
II-4
Information on Suppliers of Certain Frozen Fish Fillets
U.S. purchasers were requested to provide information on their suppliers of certain frozen fishfillets during 2003-08. Their responses are summarized in the following discussion.
Purchasers were requested to identify the number of suppliers that they contact in making apurchase of certain frozen fish fillets.15 Of the 26 purchasers responding, the food service distributorsreported contacting from 1 to 10 or more suppliers; the wholesale distributors reported contacting from 1to 20 suppliers; the restaurants reported contacting 1 to 4 suppliers; and the grocery stores reportedcontacting 1 to 6 suppliers.
Purchasers were requested to indicate if their purchases of certain frozen fish fillets involvednegotiations with their suppliers.16 Of the 26 purchasers responding, 10 indicated no and the remaining16 indicated that they negotiate with their suppliers. Negotiations include factors such as price, quantity,delivery schedules, timeliness, and product specifications; several of the firms specifically indicated thatthey do not share competing prices while none of the responding purchasers reported quoting competingprices. U.S. market prices of domestic frozen catfish fillets, imported frozen basa and tra fillets fromVietnam, and imported certain frozen fish fillets from third countries are available daily by subscriptionfrom Urner Barry.17
Purchasers were requested to indicate if they vary purchases of certain frozen fish fillets from agiven supplier within a specific time period based on the price offered during that period.18 Of the 26purchasers responding, 18 indicated no and 8 indicated yes. One of the latter eight purchasers, ***, alsoprovided the following explanation: “The imported products are not as subject to seasonal fluctuations,whereas, for domestic products, we will buy more aggressively during periods of high supply.”
Purchasers were asked if they changed suppliers of certain frozen fish fillets since 2003.19 Of the26 firms responding, 18 indicated no and 8 indicated yes. The latter eight purchasers reported dropping atotal of five suppliers and adding a total of four suppliers. Purchasers reported dropping suppliersbecause the suppliers no longer carried the certain frozen fish fillets or the suppliers went out of business. Purchasers reported adding suppliers to obtain additional product lines or for risk management purposes.
Purchasers were asked if they were aware of any new suppliers of certain frozen fish fillets, eitherdomestic or foreign, since 2003, and whether they expected new suppliers to enter the market in thefuture.20 On the question of any new suppliers since 2003, 18 of the 25 responding purchasers reportedno and 7 reported yes. The new suppliers cited by the latter seven purchasers were typically new to theresponding firm, not necessarily new in the market, or the suppliers began selling additionalproducts (specifically cited were frozen tra fillets from Vietnam and Chinese certain frozen fish fillets). On the question of expected new suppliers in the future, 19 of the 24 responding purchasers reported noneand 5 reported that they expected new suppliers in the market as a consequence of the natural “supplierchurn” in the market. In addition, one of the latter five purchasers, ***, asserted that, as tra gainsrecognition, more suppliers will pick up this item.
21 U.S. purchaser questionnaire responses, section III-25. 22 Hazard Analysis and Critical Control Point systems were developed by the U.S. FDA and the U.S. AgricultureDepartment in 1997 to ensure food safety. U.S. FDA monitors the application of this system for seafood, whichinvolves seafood processors, repackers, and warehouses, both domestic and foreign exporters to this country. Critical Steps Toward Safer Seafood, U.S. FDA, February 1999, http://www.cfsan.fda.gov/~dms/fdsafe3.html,retrieved April 14, 2009. 23 U.S. purchaser questionnaire responses, section III-27. 24 Short-run effects discussed in the supply and demand sections refer to changes that could occur within 12months, unless otherwise indicated. 25 Data on U.S. frozen catfish fillet production, production capacity, capacity utilization, inventories, and exportsare shown in detail in Part III. 26 E-mail from ***.
II-5
Purchasers were requested to indicate whether they required their suppliers of certain frozen fishfillets to become certified or prequalified.21 Six of the 26 purchasers responded no and 20 firmsresponded yes. These latter 20 firms reported that they require one or more of the following from theirsuppliers to be certified: (1) adherence to purchaser specifications, (2) independent product and plantinspections, (3) a valid HACCP plan,22 (4) adherence to all federal and local guidelines regarding weights,measure, and food safety, and (5) passing microbiological testing. The reported time period forcertification ranged from two days/several orders to one year and the factors considered were productquality, service, reliability, availability, product consistently meets purchaser specifications, and pricecompetitiveness.
Purchasers were also requested to report if they had decertified any suppliers of certain frozenfish fillets or any suppliers failed to become certified since 2003.23 Twenty-three of the 25 respondingpurchasers responded no and 2 (both food service distributors) responded yes and provided additionalcomments. *** reported that “when the FDA established the auto detention list regarding products fromChina, any plants producing Ictalurus catfish in that country were decertified for sales to ***.” ***reported that “*** were decertified because they mislabeled Vietnamese swai as the more expensive basa. In addition, *** was decertified because its imported certain frozen fish fillets from Vietnam testedpositive for fluroquinolones; any time this type of incident occurs, the supplier is decertified until suchtime as they can verify corrective actions and procedural changes to avoid the problem in the future.”
SUPPLY AND DEMAND CONSIDERATIONS24
U.S. Supply25
U.S. Production
Based on available information, U.S. processors may have had the ability to respond to changesin U.S. demand with substantial changes in the quantity of shipments of U.S.-processed certain frozencatfish fillets to the U.S. market during 2003-08. Factors contributing to this degree of responsiveness ofsupply are discussed later in this section. Due to some seasonal supply factors, this ability to increaseshipments may be reduced somewhat in the summer; U.S. live farm-raised catfish supply tends to be thelowest during the summer months when the amount of food-size fish in the ponds is lower and feeding isthe heaviest; in addition, the fish can be off-flavor during the summer due to various factors such as algaegrowth, which delays the fish harvest until the fish flavor improves.26 Any processing shortfall during thesummer months may be offset by the availability of U.S. processors’ inventories of domestic frozen

27 Domestic interested parties’ prehearing brief, p. 60, fn. 242. 28 U.S. producer questionnaire responses, sections IV-14, IV-21, and IV-22. 29 U.S. purchaser questionnaire responses, section III-14. 30 Fourteen other U.S. purchasers indicated that there were no changes in factors affecting supply of domesticfrozen catfish fillets since 2003. 31 The specific comments of the responding firms are shown in appendix E. 32 Hearing transcript, pp. 77-78 (Lowery and Rhodes) and pp. 104-105 (Lowery). 33 Hearing transcript, p. 105 (Lowery).
II-6
catfish fillets;27 in addition, customers’ inventories may also mitigate somewhat any processing shortfallduring the summer.
A key factor hindering the U.S. processors’ ability to increase shipments has been a decreasingsupply of U.S. live farm-raised catfish during 2003-08. U.S. processors were requested to comment intheir questionnaire responses on the effects of price changes in raw materials and other factors on theprice and quantity of their frozen catfish fillets during 2003-08 and anticipated in the future.28 U.S.purchasers were also requested to identify factors affecting supply of domestic frozen catfish fillets during2003-08.29 Fifteen U.S. processors and 9 U.S. purchasers provided useable comments.30 The respondingfirms generally cited increased costs of U.S. catfish farmers and processors of the frozen catfish filletsthat have largely led to higher prices of both the live and processed catfish, but has led to a decrease inquantity supplied of both. The U.S. processors also generally asserted that the supply of domestic frozencatfish fillets will decrease in the future.31
U.S. processors testified that catfish ponds have a useful life of 10-15 years. Rebuilding theponds entails a substantial cost, reportedly similar to the cost of converting the ponds to row crops, suchthat catfish farmers have a long-term commitment when they rebuild their ponds.32 The witnesses alsoindicated that if the outlook for profits for catfish were bleak for the next two or three years, the catfishfarmers would convert to row crops such as soybeans; this conversion reportedly already has taken placein the Mississippi delta.33
Water-surface acres of U.S. catfish ponds during 1993-2008, and projected for 2009, are shownin figure II-I. As shown in the figure, U.S. pond acreage generally increased from 152,140 acres in 1993to a peak of 196,760 acres in 2002, and since then has declined steadily to a projected period low of146,900 acres in 2009, or a decrease of 25.3 percent from the peak. At least some of this decline in pondacreage likely occurred as catfish ponds that had reached the end of their life cycle were switched to rowcrops.
Industry capacity
Based on responses of the U.S. processors of domestic frozen catfish fillets, total reported annualcapacity utilization for frozen catfish fillets fluctuated but decreased during 2003-08, by a total of 2.2percentage points. The 7.5 percentage point improvement in capacity utilization during 2008 from that in2007 occurred as production increased somewhat, but capacity fell by 8.0 percent from the level in 2007and ended at a period low of 137.1 million pounds in 2008. The reported annual levels of capacityutilization between 63.3 and 76.1 percent indicate that U.S. processors of frozen catfish fillets had asubstantial amount of available capacity to increase production of frozen catfish fillets in the short run inthe event of a price change during 2003-08, provided that the supply of U.S. live farm-raised catfish wereavailable.
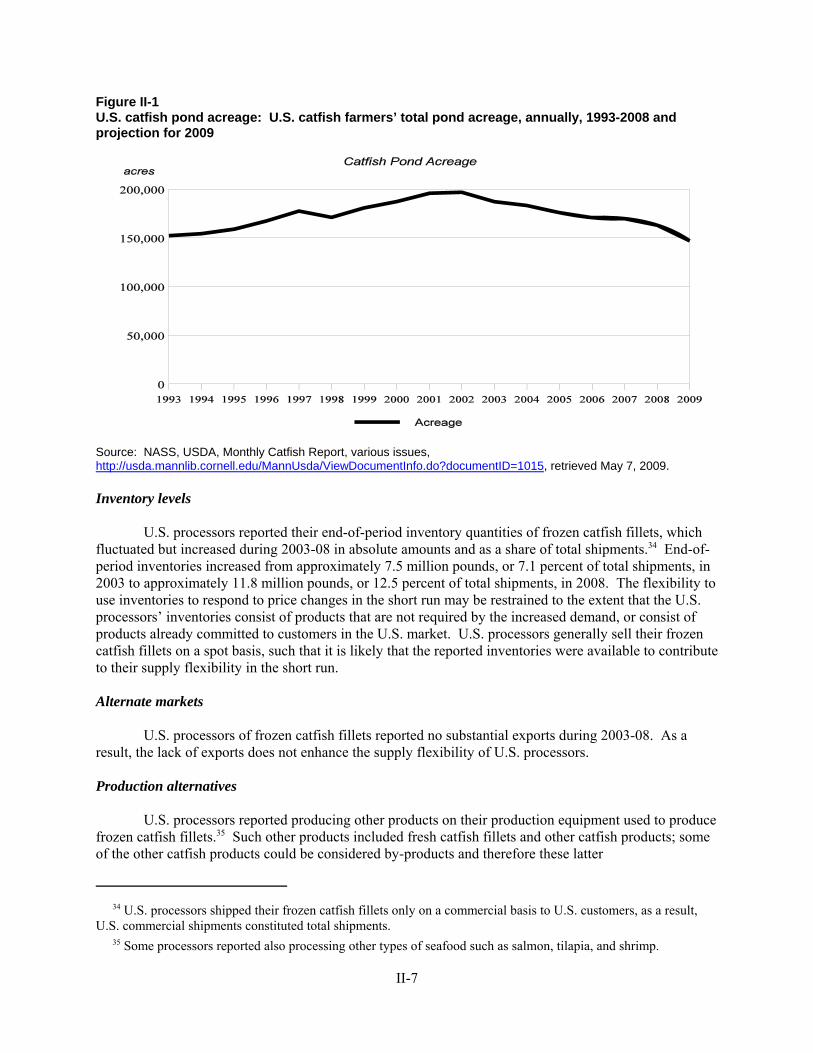
34 U.S. processors shipped their frozen catfish fillets only on a commercial basis to U.S. customers, as a result,U.S. commercial shipments constituted total shipments. 35 Some processors reported also processing other types of seafood such as salmon, tilapia, and shrimp.
II-7
Figure II-1U.S. catfish pond acreage: U.S. catfish farmers’ total pond acreage, annually, 1993-2008 andprojection for 2009
Source: NASS, USDA, Monthly Catfish Report, various issues,http://usda.mannlib.cornell.edu/MannUsda/ViewDocumentInfo.do?documentID=1015, retrieved May 7, 2009.
Inventory levels
U.S. processors reported their end-of-period inventory quantities of frozen catfish fillets, whichfluctuated but increased during 2003-08 in absolute amounts and as a share of total shipments.34 End-of-period inventories increased from approximately 7.5 million pounds, or 7.1 percent of total shipments, in2003 to approximately 11.8 million pounds, or 12.5 percent of total shipments, in 2008. The flexibility touse inventories to respond to price changes in the short run may be restrained to the extent that the U.S.processors’ inventories consist of products that are not required by the increased demand, or consist ofproducts already committed to customers in the U.S. market. U.S. processors generally sell their frozencatfish fillets on a spot basis, such that it is likely that the reported inventories were available to contributeto their supply flexibility in the short run.
Alternate markets
U.S. processors of frozen catfish fillets reported no substantial exports during 2003-08. As aresult, the lack of exports does not enhance the supply flexibility of U.S. processors.
Production alternatives
U.S. processors reported producing other products on their production equipment used to producefrozen catfish fillets.35 Such other products included fresh catfish fillets and other catfish products; someof the other catfish products could be considered by-products and therefore these latter
36 U.S. imports of frozen basa and tra fillets from Vietnam increased steadily from 19.7 million pounds in 2003 toa period high of 53.5 million pounds by 2006, for a total increase of 171.9 percent, before fluctuating and ending at53.3 million pounds in 2008. 37 A U.S. purchaser, ***, reported that harvest cycles for imported Pangasius and catfish affect availability andthe market several times a year; the duration would be more than two and less than four months beginning aroundearly April to mid August. U.S. purchaser questionnaire response, III-16. 38 U.S. importer questionnaire responses, section III-16. 39 ***, were among the three importers expecting an increase in U.S. imports of frozen basa and tra fillets fromVietnam in the future.
II-8
products would not involve switching production between frozen catfish fillets and these products. U.S.processors produce approximately twice as much frozen catfish fillets as fresh catfish fillets. The abilityof the U.S. processors to shift production between frozen catfish fillets and fresh catfish fillets, as well asother types of fish, enhances their supply responsiveness in the short run in response to relative pricechanges between frozen catfish fillets and some combination of fresh catfish fillets and other types offish.
Imports from Vietnam
U.S. imports of frozen basa and tra fillets from Vietnam increased by a total of 170.7 percent inquantity during 2003-08.36 However, based on publically available information, staff believes thatVietnamese processors have the capability to respond to changes in demand with relatively large changesin shipments of the Vietnamese frozen basa and tra fillets to the U.S. market.37 Because only oneVietnamese producer provided a questionnaire response to the Commission, discussion of the specificfactors that contribute to the responsiveness of supply would not be meaningful.
U.S. importers of certain frozen fish fillets were requested to discuss the future availability of theVietnamese certain frozen fish fillets in the U.S. market.38 Eleven U.S. importers responded, with 3indicating an increase,39 2 indicating a decrease, 5 indicating no change, and 1 indicating that it did notknow. Four of the five firms reporting a change in the future availability provided the followingcomments. The *** reporting importer of frozen basa and tra fillets from Vietnam asserting an increase,***, stated that--
“Our company anticipates an “increase” in supply in the U.S. market of certain frozenfish fillets imported from Vietnam. The reason for increase is that the fish fillets havebecome well known as a whitefish fillet item to the seafood commodity trade. Becauseof its flavor profile and ease of cooking methods, many consumers and restaurants arefinding interest in the fillets. In addition, wild whitefish species have been drasticallyreduced, therefore aquaculture species are filling the void.”
Another importer asserting an increase, ***, stated that “with the number of shipper reviews achievingzero recently, we have seen a significant increase in product availability and downward price pressure.” The remaining importer asserting an increase, *** ***, stated that “within 2-3 years U.S. consumption ofthe frozen basa and tra fillets will increase at least 10 percent.” One of the importers asserting a decrease,***, stated that--
“The U.S.D.A. has signaled its intent to include the Pangasius species in its definition of“catfish,” which is contrary to the definition established in the 2002 Farm Bill.”
40 U.S. producer and importer questionnaire responses, sections IV-23a and III-17a, respectively. 41 One of these four importers, ***, asserted that “the increase in transshipped product from Vietnam via Thailandto avoid duty has put price pressure on the “real” Vietnam duty-paid products. Vietnam may be the only real sourcefor the product, because other countries do not have production capacity to meet in-country demand.” 42 U.S. producer and importer questionnaire responses, sections IV-23b and III-17b, respectively. 43 U.S. producer and importer questionnaire responses, sections IV-23c and III-17c, respectively. 44 One of the importers indicating increased future availability of certain frozen fish fillets from nonsubjectcountries, ***, asserted that transshipped product will continue to increase until action is taken to halt such trade.
II-9
The remaining importer reporting a future decrease, ***, cited market conditions and the economy asreasons.
Imports from Nonsubject Countries
U.S. imports of certain frozen fish fillets from countries other than Vietnam increased markedlyfrom less than 1.2 million pounds in 2003 to more than 44.1 million pounds in 2008, or by 3,651.6percent. China was the leading nonsubject import source by far during 2003-08, followed by 16 othercountries, including, in descending order, Thailand, Cambodia, and Indonesia as the next largestnonsubject country suppliers of certain frozen fish fillets.
U.S. processors of frozen catfish fillets and U.S. importers of the frozen catfish, basa, and/or trafillets were requested to discuss how the availability in the U.S. market of certain frozen fish fillets fromnonsubject countries changed during 2003-08.40 Eleven of the 15 responding U.S. processors and 7 of the11 responding importers indicated that the availability of certain frozen fish fillets from nonsubjectcountries increased in the U.S. market during 2003-08. Two U.S. processors and the remaining 4 U.S.importers indicated that such availability had not increased,41 and the 2 remaining U.S. processors did notknow how such imports changed in the U.S. market. Of the 18 responding firms that indicated anincrease, a total of 10 firms identified frozen catfish fillets from China, whereas the remaining firms didnot identify specific countries with types of certain frozen fish fillets.
U.S. processors of frozen catfish fillets and U.S. importers of certain frozen fish fillets were alsoasked to identify the top three nonsubject country sources of certain frozen fish fillets to the U.S. marketduring 2003-08.42 As seen in the tabulation of responses on the following page, China was identifiedmost frequently as the largest nonsubject country supplier of certain frozen fish fillets to the U.S. marketduring 2003-08, followed in descending order by Thailand and Cambodia.
U.S. processors of frozen catfish fillets and U.S. importers of certain frozen fish fillets were alsoasked to comment on any anticipated changes in the future in the availability of imported certain frozenfish fillets from nonsubject countries to the U.S. market.43 Nine U.S. importers responded, but no U.S.processors responded. Four of the nine responding U.S. importers reported no expected future changes,whereas the remaining five U.S. importers reported that they expected changes in the future, eitherincreased availability from non-Vietnamese sources (such as Thailand, Philippines and Cambodia)44 ordecreased availability as a result of changes in the U.S. inspection regime.
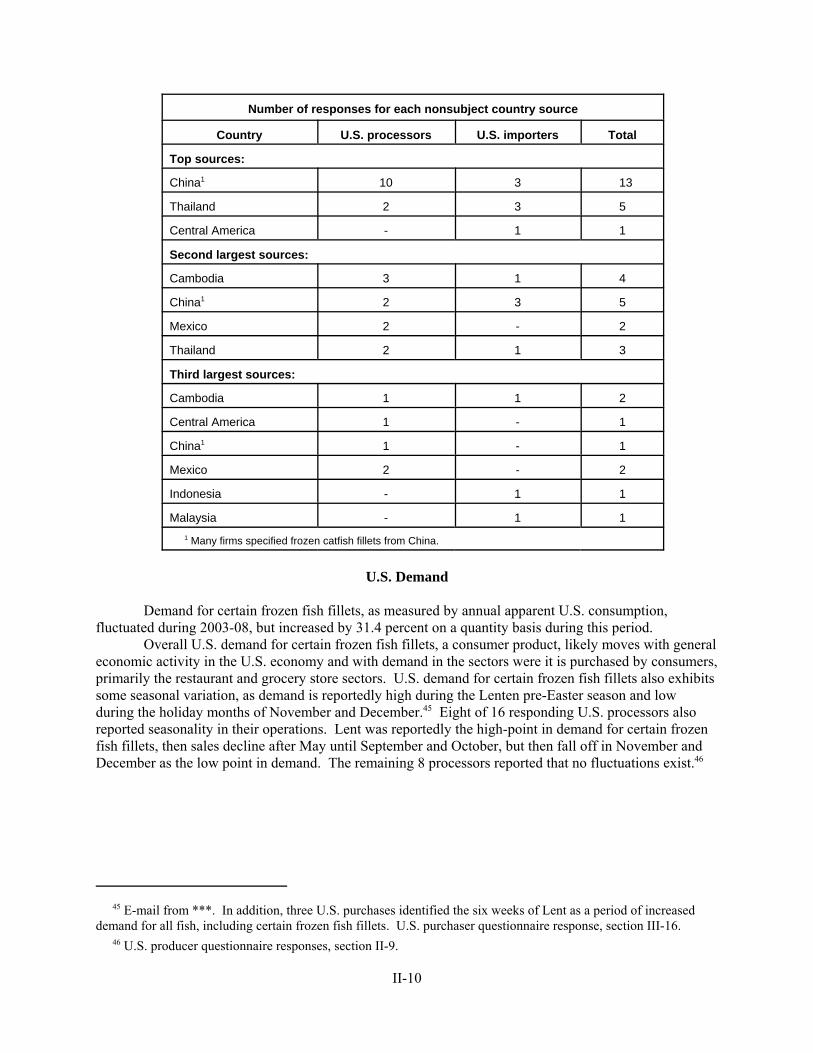
45 E-mail from ***. In addition, three U.S. purchases identified the six weeks of Lent as a period of increaseddemand for all fish, including certain frozen fish fillets. U.S. purchaser questionnaire response, section III-16. 46 U.S. producer questionnaire responses, section II-9.
II-10
Number of responses for each nonsubject country source
Country U.S. processors U.S. importers Total
Top sources:
China1 10 3 13
Thailand 2 3 5
Central America - 1 1
Second largest sources:
Cambodia 3 1 4
China1 2 3 5
Mexico 2 - 2
Thailand 2 1 3
Third largest sources:
Cambodia 1 1 2
Central America 1 - 1
China1 1 - 1
Mexico 2 - 2
Indonesia - 1 1
Malaysia - 1 1
1 Many firms specified frozen catfish fillets from China.
U.S. Demand
Demand for certain frozen fish fillets, as measured by annual apparent U.S. consumption,fluctuated during 2003-08, but increased by 31.4 percent on a quantity basis during this period.
Overall U.S. demand for certain frozen fish fillets, a consumer product, likely moves with generaleconomic activity in the U.S. economy and with demand in the sectors were it is purchased by consumers,primarily the restaurant and grocery store sectors. U.S. demand for certain frozen fish fillets also exhibitssome seasonal variation, as demand is reportedly high during the Lenten pre-Easter season and lowduring the holiday months of November and December.45 Eight of 16 responding U.S. processors alsoreported seasonality in their operations. Lent was reportedly the high-point in demand for certain frozenfish fillets, then sales decline after May until September and October, but then fall off in November andDecember as the low point in demand. The remaining 8 processors reported that no fluctuations exist.46

47 U.S. purchasers were requested to comment whether the market for certain frozen fish fillets was subject tobusiness cycles. Twenty-two firms provided useable responses regarding demand; 19 firms reported no and theremaining three firms provided comments regarding seasonality that were discussed above. U.S. purchaserquestionnaire responses, section III-16. 48 For 2003-07, Economic Report of the President, U.S. Government Printing Office, Table B-13, p. 300; and for2008, Blue Chip Economic Indicators, Aspen Publishers, Inc., Vol. 34, No. 5, May 10, 2009, p. 2. Real GDP grewat annual rates in the first two quarters of 2008, but declined in the final two quarters; in 2008, real GDP changed atthe following annual rates from the previous quarter: 0.9 percent increase in the first quarter, 2.8 percent increase inthe second quarter, -0.5 percent decrease in the third quarter, and -6.3 percent decrease in the fourth quarter (BlueChip Economic Indicators, Aspen Publishers, Inc., Vol. 34, No. 5, May 10, 2009, p. 5). Real GDP decreased -5.7percent (annual rate) in the first quarter of 2009 from the prior quarter (http://www.bea.gov/newsreleases/national,retrieved May, 29, 2009). 49 Blue Chip Economic Indicators, Aspen Publishers, Inc., Vol. 34, No. 5, May 10, 2009, pp. 2-3. 50 Nominal values were deflated by the quarterly price index for the component of Gross Domestic Productinvolving personal consumption expenditures for food in the nondurable goods category reported by the U.S. Bureauof Economic Analysis (BEA). The base year for the price index was 2000=100; as a result, real quarterly values arein 2000 dollars, with the impact of inflation removed or minimized from the food retailers’ sales figures. Quarterlynominal sales values were calculated as simple averages of monthly nominal sales values reported by BEA. 51 Comparing same-quarter real sales values of full-service restaurants during 2007-08 showed decreases from2007 to 2008 in each quarter. 52 At least part of this decline may have been due to seasonal demand factors. 53 Hearing transcript, pp. 75-76 (Rhodes and Walker).
II-11
Business Cycles47
U.S. real gross domestic product (GDP) increased by 2.5 percent in 2003, by 3.6 percent in 2004,3.1 percent in 2005, 2.9 percent in 2006, 2.2 percent in 2007, and 1.1 percent in 2008.48 Real GDP isforecast to decrease by 2.8 percent in 2009 and increase by 1.9 percent in 2010.49
Nominal and real quarterly values of U.S. sales at full-service restaurants and grocery storesduring January 2003-December 2008 are shown in figure II-2.50 Quarterly sales values for both types ofretailers fluctuated but generally increased during 2003-08, but the nominal sales figures for both types ofretailers increased more than the comparable real sales figures during this period.
Nominal sales values at full-service restaurants increased from $12.1 billion during January-March 2003 to $16.5 billion during October-December 2008, or by a total of 36.7 percent; real salesvalues, however, increased by a total of only 12.0 percent during this period. Quarterly real sales valuesat the restaurants reached a period high of $13.7 billion during April-June 2007 and then fluctuated butgenerally decreased to end at $12.8 billion during October-December 2008, or a decrease of a total of 6.9percent from the period high during this period.51 Domestic interested parties asserted that, beginning inNovember 2008 and through the middle of January 2009, sales of their domestic frozen catfish fillets torestaurant chains declined sharply.52 In addition, domestic interested parties indicated that the NationalRestaurant Association reported restaurant sales were off by about 20 percent. Domestic interestedparties also asserted that since mid-January 2009 their sales to restaurants are back to normal.53
Nominal sales values at grocery stores increased from $34.4 billion during January-March 2003to $44.6 billion during October-December 2008, or by a total of 29.5 percent; real sales values, however,increased by a total of only 6.1 percent during this period. Quarterly real sales values at grocery storesreached a period high of $35.7 billion during October-December 2007 and then fluctuated but generally

II-12
Figure II-2Sectoral U.S. sales values: Nominal and real U.S. sales values of full-service restaurants andgrocery stores, by quarters, during January 2003-December 2008
Note.--Real values based on 2000=100.
Source: Monthly Retail Trade Survey, Census Bureau, DOC, http://www.census.gov/mrts/www/data/excel/mrtssales92-09.xls, retrieved March 24, 2009; and Price Indexes forGross Domestic Product, Expanded Detail, Bureau of Economic Analysis, DOC, http://www.bea.gov/national/nipaweb,retrieved April 2, 2009.

54 Comparing same-quarter real sales values of grocery stores during 2007-08 showed a decrease from 2007 to2008 in only the fourth quarter, when real GDP contracted at an annual rate of 6.3 percent from the previous quarter. 55 U.S. producer, importer, and purchaser questionnaire responses, sections IV-15a/IV-16a, III-20a/III-21a, andIII-11a/III-12a, respectively. 56 A number of U.S. processors responded only for the domestic frozen catfish fillets, which were not shown,because the question was referring to all certain frozen fish fillets and not just a particular species.
II-13
decreased to end at $34.5 billion during October-December 2008, 3.3 percent lower than the periodhigh.54
Questionnaire Responses Concerning Changes in U.S. Demand
U.S. processors, importers, and purchasers were requested to indicate whether U.S. demand forcertain frozen fish fillets increased, decreased, fluctuated, or did not change since January 2003 and howthey anticipate this demand will change in the future.55 Responses were mixed regarding U.S. demand. Useable responses are summarized in the following tabulation.56
U.S. demand changes for certain frozen fish fillets
Types of firms
Number of firms responding
Increase Decrease Fluctuate No change
U.S. demand changes since January 2003
U.S. processors1 3 2 1 1
U.S. importers 6 - 5 1
U.S. purchasers 12 3 4 5
Total 21 5 10 7
U.S. demand changes anticipated in the future
U.S. processors2 1 - - 3
U.S. importers3 6 - 2 1
U.S. purchasers 9 2 3 10
Total 16 2 5 14
1 In addition, one other U.S. processor reported that it did not know how U.S. demand changed. 2 In addition, two other U.S. processors reported that they did not know how U.S. demand wouldchange in the future. 3 In addition, one other U.S. importer reported that it did not know how U.S. demand would change inthe future.
The majority of all questionnaire responses, led principally by purchasers, indicate that U.S.demand for certain frozen fish fillets has increased since January 2003, but the majority of responses foranticipated future U.S. demand, again led principally by purchasers, indicate a split between increasedfuture demand and no change in future demand.
With regard to historical U.S. demand for certain frozen fish fillets, the responding firms thatindicated increased demand cited a number of reasons, including a healthier food choice, increase in
57 One of the firms that reported that it anticipated future demand, ***, a food service distributor, provided thefollowing comment: “Demand for Pangasius will grow as it becomes known as a stand-alone product with its ownpositive characteristics. Likewise, the demand for Chinese-grown catfish will increase as consumers discover it as acompetitive alternative to domestic catfish. Domestic catfish growth is constrained by the limits of the aquaculturebase and by the current economic crisis.” 58 U.S. processor *** gave the following explanation for its anticipation of fluctuating demand: “The recessioncan affect future demand in ways we do not know at this time. Customers can reduce the frequency of dining out,and large buyers can go bankrupt. As a result, the market could be more volatile.” 59 One U.S. processor that cited no future change in demand, ***, indicated that if live fish prices and otherexpenses increase too much, people will opt for other fish and/or for meat.
II-14
availability, affordability, mild tasting product continues to gain consumer acceptance, higherprices/tighter quotas for wild whitefish, increased marketing of the imported frozen basa and tra fromVietnam, and increased demand in the food service sector due to value pricing. The responding firms thatindicated decreased demand cited lower pricing of substitutes, such as tilapia, selling price andavailability, and low customer demand. The responding firms that indicated fluctuating demand cited reasons as price, availability, trade barriers, aquaculture cycles, regulatory compliance, and food safetyscares. The responding firms that indicated no change in demand typically did not cite reasons except for importer ***, which stated “the dumping duty created hurdles to get the fish to the United States, soinitially sales slowed, but naming guidelines changed the appeal of the fish.”
Concerning future U.S. demand for certain frozen fish fillets, the responding firms that anticipateincreased future demand cited a number of reasons, including the concern that wild whitefish may not beas sustainable, the continuing growth of aquaculture throughout the world, healthier eating habits, betterfood safety, the economy will continue to drive consumers to lower cost items, and maturing of the baby-boom generation.57 The responding firms that anticipate decreased future demand cited lower pricing ofsubstitutes and legislative impediments of imported products via the 2008 Farm Bill will increase pricesof all certain frozen fish fillets. The responding firms that anticipate fluctuating future demand citedseveral reasons including, perceived value of other products, availability of substitutes, populationchange, economic conditions, FDA regulations, price, and availability.58 The responding firms thatanticipate no change in demand typically did not cite reasons other than to note that flat sales wereexpected due to the economy.59
Substitute Products
Based on available information, U.S. distributors, restaurants, grocery stores, and consumers arelikely to respond to changes in the price of certain frozen fish fillets with small to moderate changes intheir purchases of certain frozen fish fillets, such that U.S. demand may be somewhat price inelastic orprice elastic. The main contributing factor to this level of responsiveness of demand is the existence ofsubstitutes for certain frozen fish fillets, but also contributing may be the moderate cost share in that partof consumer food budgets where items are purchased with protein content in mind and/or the main courseof a meal is considered. On the other hand, consumer preferences and “Buy America” policies/practicesmay tend to reduce the price elasticity of demand. In addition, because consumers reportedly like varietyin their consumption of whitefish fillets, it is possible that the alternatives may also be complements tocertain frozen catfish fillets.
Substitutes for certain frozen fish fillets
U.S. processors, importers, and purchasers were requested to comment on substitutes for certainfrozen fish fillets in the U.S. market during 2003-08, and on any changes in substitutes during this

60 U.S. producer, importer, and purchaser questionnaire responses, sections IV-11-12, III-11-12, and III-5-6,respectively. 61 U.S. processors, U.S. importers, and U.S. purchasers were also asked whether there were changes in substitutesfor certain frozen fish fillets in the U.S. market during 2003-08 (U.S. producer, importer, and purchaserquestionnaire responses, sections IV-12, III-12, and III-6, respectively). Ten U.S. processors, eight importers, and23 purchasers provided useable responses. Six of the 10 responding processors and all of the responding importersand purchasers reported no changes. The four remaining U.S. processors cited increased volumes of tilapia, fromChina and South America, during 2003-08. One of these four U.S. processors, ***, reported that, as sales of tilapiaincreased, sales of domestic frozen catfish fillets have trended downward.
II-15
period.60 Fourteen U.S. processors, six U.S. importers, and 23 U.S. purchasers provided useableresponses for substitutes during 2003-08. Five of the responding U.S. processors, five respondingimporters, and 17 of the responding purchasers reported that no substitutes exist. The remaining nineU.S. processors, one importer, and six purchasers identified substitute products. The alternative productsand the number of responses identifying the products are shown in the following tabulation.
Substitutes/alternatives for certain frozen fish fillets(Number of responses)
Type of fishU.S.
processorsU.S.
importerU.S.
purchasers Total
Tilapia 9 1 6 16
Cod 1 - 3 4
Pollock 2 - 2 4
Flounder - - 2 2
Sole 1 - 1 2
Hoki - - 1 1
Orange roughy - - 1 1
Ponga - - 1 1
Whiting - - 1 1
Total 13 1 18 32
Note.–Some responding firms reported more than one alternative product.
Tilapia was by far the most frequently cited alternative to certain frozen fish fillets, followed by cod, pollock, flounder, sole, and then the other whitefish identified above.61 Eight U.S. processors andtwo U.S. purchasers provided follow-up comments on the alternatives, especially concerning tilapia. These firms generally asserted that (1) tilapia, especially from China, is high-volume and low-priced, and(2) competition with the alternative whitefish can be intense, especially for sales to food serviceestablishments.
U.S. purchasers were also requested to discuss to what extent prices of other types of frozenwhitefish are relevant or used as leverage when negotiating prices and volumes of certain frozen fish
62 U.S. purchaser questionnaire responses, section III-8. 63 The remaining 3 responding purchasers provided the following responses. ***, a wholesale distributor,reported that “market demand factors of price, quality, and regional preferences determine sales.” ***, a grocerychain, stated that “we have never utilized the market price of these items when negotiating price. Although the enduse is similar, they are distinct products. In most cases, the expectation of variety on the part of the customer forcesyou to carry most of the products. If you were selecting only one or two to use, the leverage would be there. Sincemost are offering several of the products, the price of each is maximized against itself.” ***, a wholesale distributor,stated that “fish in the same price range (tilapia and pollock) affect negotiations.” 64 U.S. producer, importer, and purchaser questionnaire responses, sections IV-13, III-13, and III-7, respectively. 65 U.S. purchaser questionnaire responses, sections III-9 and III-10. 66 U.S. producer and importer questionnaire responses, sections IV-11-13 and III-11-13, respectively. 67 Two of the four purchasers asserting that these products are substitutes for each other made the followingcomments. ***, a restaurant, asserted that “the basa and tra fillets are similar to the catfish fillets when fried; it ishard to tell them apart.” ***, a grocery chain, asserted that “they are as substitutable as any other mild, whitefishfillet. For the end use in mind-–frozen or refreshed fillets to the customer or for processor use in making valueadded items-–catfish fillets are just as easily used as any other whitefish. The price of catfish also keeps it in linewith basa or tra versus a product such as cod or haddock, which will be much more expensive.”
*** also indicated that, in recent years, Vietnamese production and exports have shifted from basa, which isconsidered to have better texture and flavor, to tra (swai), a faster growing alternative. According to ***, labelingand marketplace distinctions between basa and tra are the “biggest improvements” that have occurred in the U.S.market in recent years. *** purchaser questionnaire responses, sections I-7, III-36, and IV-6. 68 One of these 20 responding purchasers, ***, a food service distributor, provided the following detailedcomments.
“Basa and tra are milder than channel catfish. Catfish has an inherent “earthy” flavor that thecatfish customer expects and is used to. The forced name change by the FDA to basa/swai hasbeen a blessing. Basa is now a recognized name in the marketplace, and salesmen are able to sellbasa on its own merits and attributes. The consumer no longer confuses it with domestic catfishand recognizes the value of this mild tasting, tender whitefish.”
II-16
fillets.62 Of the 14 responding purchasers, 11 asserted that prices of these other whitefish are not used asleverage.63
Six U.S. processors, 8 U.S. importers, and 24 U.S. purchasers provided useable responsesconcerning any anticipated changes in substitutes for certain frozen fish fillets in the future.64 All of theresponding firms reported that they anticipate no changes in substitutes in the future.
Substitution among various species/types of certain frozen fish fillets
U.S. purchasers were requested to discuss substitution among various species/types of certainfrozen fish fillets.65 U.S. processors and importers also commented on such substitutions in theirresponses to requests to discuss substitution between certain frozen fish fillets and alternative fish;66 theselatter comments also will be discussed here.
Frozen fillets of basa and tra versus frozen fillets of catfish.–Of the 24 responding purchasers,20 asserted that these products were not substitutable for each other, whereas the 4 remaining purchasersasserted that they were substitutable.67 Most of the 20 firms reporting no substitution cited labeling laws,but some also noted differences in taste and texture and differences in consumer preferences.68
69 U.S. producer and importer questionnaire responses, sections IV-11 and III-11, respectively. 70 *** purchaser questionnaire response, section IV-9. 71 U.S. purchaser questionnaire responses, section III-10. 72 Ibid.
II-17
Eight U.S. processors and two U.S. importers asserted that frozen fillets of basa and tra weresubstitutes for domestic frozen catfish fillets in the U.S. market.69 Many of these firms reported thatfrozen fillets of basa and tra were priced lower than the domestic frozen catfish fillets and this putdownward pressure on prices of the domestic product. Some reported that prices of the imported productswere 35-40 percent less than prices of the domestic products and some indicated a $1.00 per pounddifference. On the other hand, ***, a U.S. purchaser stated that domestic frozen catfish fillets are pricedlower than the imported frozen basa fillets from Vietnam, but the domestic fish are priced higher than theimported frozen tra fillets from Vietnam.70
Frozen fillets of catfish from China versus frozen fillets of domestic catfish.–Although notspecifically asked about this comparison, five U.S. processors, three U.S. importers, and two U.S.purchasers commented on the substitutability between these two different sources of catfish in the U.S.market during 2003-08. All of the responding firms asserted that the domestic frozen catfish fillets weresubstitutable for the imported frozen catfish fillets from China, although one of the respondingpurchasers, ***, a food service distributor, asserted that the domestic product is used and not substitutablewhen customer preferences, law, food safety concerns, or “Buy America” concerns dominate.
Frozen fillets of wild-caught catfish versus frozen fillets from farm-raised basa and tra.–All 23responding purchasers indicated that these two products are not substitutable.71 Many of the firms citedlimited quantities of wild-caught catfish. One of the responding purchasers, ***, a grocery chain,provided the following additional comment: “Flavor, texture, and quality characteristics are tooinconsistent in this particular wild fish. The nature of this fish’s eating habits leads to off flavor (muddy)and soft texture. It is not a suitable substitute.”
Frozen fillets of wild-caught catfish versus frozen fillets from farm-raised catfish.–The same 23purchasers responded, as above, and indicated that these two products were not substitutable, citing thesame reasons as discussed above.72
Cost Share
The cost share of certain frozen fish fillets relative to the overall consumer budget for food islikely low, but is larger based on that part of the food budget where protein content and the main courseof a meal are considered.
SUBSTITUTABILITY ISSUES
The degree of substitution in demand between frozen catfish fillets produced in the United Statesand frozen basa and tra fillets imported from Vietnam depends upon such factors as relative prices,conditions of sales (order lead times, payment terms etc.), purchaser supply requirements, qualified statusof supplier, and product differentiation. Product differentiation depends on factors such as the range ofproducts (size and type of frozen fillets), quality (grade standards, defect rates, product consistency, etc.),consumer preference, taste and texture, availability, reliability of supply, product services, and the market
73 U.S. purchaser questionnaire responses, section III-15. 74 Two of these four responding firms, ***, were unable to report their purchase shares for “Buy America”purposes; as a result the purchase share for this category is likely understated. Domestic interested parties estimatedthat approximately 3 percent of their total sales of frozen catfish fillets are based on “Buy America” policies. Domestic interested parties’ posthearing brief, exhibit 1, p. 11. 75 Likely double counting may affect these combined purchase shares (all three preference categories), but it isnot known by how much or in which direction. On the other hand, ***, which responded for the “Buy America”provisions and for customer preferences, were unable to report their affected purchase shares. As a result, thecombined purchase shares favoring the domestic frozen catfish fillets are likely understated. 76 U.S. purchaser questionnaire responses, section III-16. 77 U.S. producer and importer questionnaire responses, sections IV-17/18 and III-18/19, respectively.
II-18
perception of these factors. Based on the reported information in this review, there appears to be at leastmoderate substitution in demand between domestic frozen catfish fillets and the frozen basa and tra filletsfrom Vietnam.
U.S. purchasers of certain frozen fish fillets were requested to indicate and explain if buying thedomestic frozen catfish fillets is important to their firm.73 Of the 26 responding purchasers, 15 indicatedthat buying the domestic product was important, whereas the remaining 11 purchasers indicated that thiswas not important. Four purchasers reported that purchases of the domestic products were required bylaw or regulation and, for the two firms reporting their affected purchase shares, ranged from 15 to 33percent of their purchases of certain frozen fish fillets for this reason.74 Seven purchasers plus two of thefour purchasers cited in the previous sentence reported that purchases of the domestic product was not amatter of law or regulation but was preferred by their customers; based on the seven firms reportingpurchase shares, purchases of the domestic product for this reason ranged from 49-100 percent of thesefirms’ purchases of certain frozen fish fillets. Four other purchasers reported buying the domestic frozencatfish fillets for logistical purposes and to support the domestic industry; such purchases of the domesticproduct ranged from 61-100 percent of the total purchases of certain frozen fish fillets of the three firmsreporting purchase shares. The total reported shares of domestic frozen catfish fillets that were purchasedbased on “Buy America” laws or practices, customer preferences, and for other reasons accounted forapproximately 31.0 percent of total reported purchases of the domestic product and 19.2 percent of totalreported purchases of all certain frozen fish fillets during 2003-08.75
U.S. purchasers were also requested to comment on the emergence of new markets for certainfrozen fish fillets and whether this has changed conditions of competition for this product in the U.S.market since 2003.76 Of the 25 responding purchasers, 16 responded that there were no new markets,whereas the remaining 9 purchasers reported that new markets had developed. New U.S. marketsincluded catfish from China and an increased demand for frozen basa and tra fillets from Vietnam, due tothe affordable price and overall quality of these latter products.
U.S. processors of frozen catfish fillets and U.S. importers of the subject certain frozen fish filletswere requested to describe any significant changes in the product range or marketing of their products inthe United States since January 2003 and any changes they anticipate in the future.77 Sixteen U.S.processors and 11 U.S. importers responded, but not necessarily for both the historical period and futureperiod. For any product/marketing changes since January 2003, 10 U.S. processors identified changeswhile 6 indicated no changes or did not know, whereas four U.S. importers identified changes and sevenindicated no changes. For any product/marketing changes anticipated in the future, eight U.S. processorsidentified future changes and eight U.S. processors indicated no future changes, whereas two U.S.importers identified future changes and eight U.S. importers indicated no future changes.
78 Three U.S. processors, ***, noted that the value-added market is much smaller than the commodity fish market. 79 This website may be recent; none of the responding purchasers reported purchasing certain frozen fish filletsover the internet during 2003-08. 80 U.S. purchaser questionnaire responses, section III-36. 81 ***, a grocery chain, asserted that over the years basa and tra (the latter also known as swai and sutchi) havebecome separate items in the U.S. market. 82 ***, a food service distributor, asserted that the parties who lobbied successfully to have Pangasius re-named inorder to segregate it from their domestic product are now seeking to include it in the regulatory scope of the USDAas a “catfish like” or “whiskered fish” species. “If their effort is successful, there will certainly be a sizablereduction of imports until those overseas resource areas are certified compliant to USDA standards. However, we donot expect this trade disruption to be any more successful than the previous attempts have been. Certainly, we seeno short-term impact of these moves, as the domestic catfish industry faces a major challenge to raise its ownpractices to meet USDA standards.”
II-19
Changes since January 2003 identified by U.S. processors involved the following: (1) sellingmore fresh fillets and higher value-added fillets, such as traypack, breaded, and par-fried;78 (2) fillets arebeing cut into strips more often; (3) quantity of the U.S. processed 2-3 ounce fillet, which reportedly ismore desirable than the large fillets, has dropped considerably due to lower price of this size fillet fromVietnam; (4) increased marketing of domestic frozen catfish fillets as U.S. processed farm-raisedproducts; and one U.S. processor, ***, reported that it had established a website for internet sales.79 Three of the four U.S. importers commenting on changes since 2003 asserted that (1) the availability ofcertain frozen fish fillets has increased to meet market demand, (2) U.S. processors are offering productsover the internet, and (3) transshipment of frozen basa and tra fillets. The remaining importercommenting on historical changes, *** provided the following discussion:
“There have been significant changes in the product range and mix of certain frozen fishfillets since 2003. The product range change is most of the imports are PangasiusHypopthalmus (market name referred to as Swai or Striped Pangasius) rather thanPangasius Bocourti (market name is Basa). Most purchasers were familiar with Basa, butBasa production from Vietnam became very limited, therefore *** of imports cominginto the United States is Swai (Striped Pangasius).”
Both U.S. processors and importers that commented on product/marketing changes anticipated in thefuture indicated that the historical changes identified above would continue in the future.
Ten U.S. purchasers of certain frozen fish fillets provided comments describingimprovements/changes in the U.S. certain frozen fish fillet market since January 2003 and anyimprovements/changes they anticipate in the future; not all responding firms commented on bothhistorical and anticipated improvements/changes.80 Purchaser comments of changes/improvements since2003 included (1) disappearance of basa, (2) HACCP certification, (3) more consistent price due to theorder, (4) correct labeling and distinction between basa and swai,81 (5) proof that catfish are U.S. farmraised, (6) higher quality of certain frozen fish fillets, (7) overseas producers sought other markets(particularly Europe), (8) opened the door in the United States for channel catfish grown in China, and (9)Pangasius increased U.S. market share by embracing its differences from the domestic frozen catfishfillets. Purchaser comments of changes/improvements that are anticipated in the future included (1)economy will keep the market flat, (2) change in sustainability and environmental impact of domesticindustry, (3) expanded use of value-added products such as breaded, battered, marinated, etc., (4) moregovernment inspections, and (5) USDA will regulate the catfish industry, reducing imported catfish fromChina and Pangasius as well.82
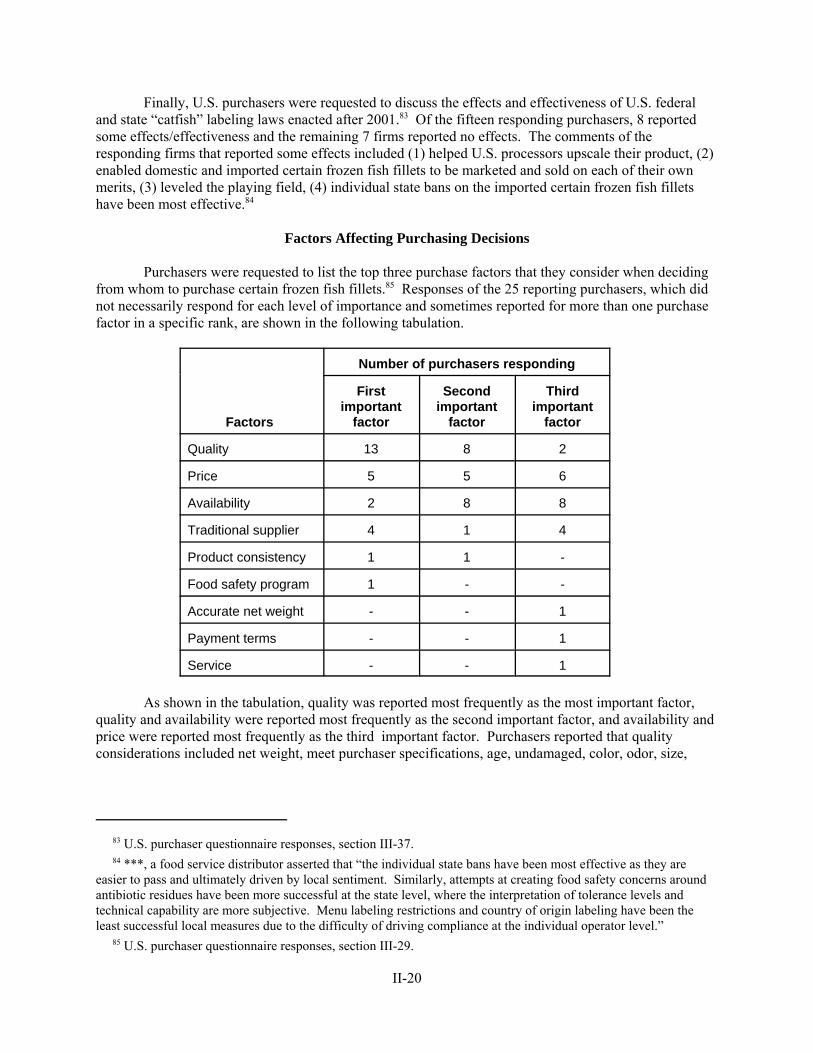
83 U.S. purchaser questionnaire responses, section III-37. 84 ***, a food service distributor asserted that “the individual state bans have been most effective as they areeasier to pass and ultimately driven by local sentiment. Similarly, attempts at creating food safety concerns aroundantibiotic residues have been more successful at the state level, where the interpretation of tolerance levels andtechnical capability are more subjective. Menu labeling restrictions and country of origin labeling have been theleast successful local measures due to the difficulty of driving compliance at the individual operator level.” 85 U.S. purchaser questionnaire responses, section III-29.
II-20
Finally, U.S. purchasers were requested to discuss the effects and effectiveness of U.S. federaland state “catfish” labeling laws enacted after 2001.83 Of the fifteen responding purchasers, 8 reportedsome effects/effectiveness and the remaining 7 firms reported no effects. The comments of theresponding firms that reported some effects included (1) helped U.S. processors upscale their product, (2)enabled domestic and imported certain frozen fish fillets to be marketed and sold on each of their ownmerits, (3) leveled the playing field, (4) individual state bans on the imported certain frozen fish filletshave been most effective.84
Factors Affecting Purchasing Decisions
Purchasers were requested to list the top three purchase factors that they consider when decidingfrom whom to purchase certain frozen fish fillets.85 Responses of the 25 reporting purchasers, which didnot necessarily respond for each level of importance and sometimes reported for more than one purchasefactor in a specific rank, are shown in the following tabulation.
Factors
Number of purchasers responding
Firstimportant
factor
Secondimportant
factor
Thirdimportant
factor
Quality 13 8 2
Price 5 5 6
Availability 2 8 8
Traditional supplier 4 1 4
Product consistency 1 1 -
Food safety program 1 - -
Accurate net weight - - 1
Payment terms - - 1
Service - - 1
As shown in the tabulation, quality was reported most frequently as the most important factor,quality and availability were reported most frequently as the second important factor, and availability andprice were reported most frequently as the third important factor. Purchasers reported that qualityconsiderations included net weight, meet purchaser specifications, age, undamaged, color, odor, size,
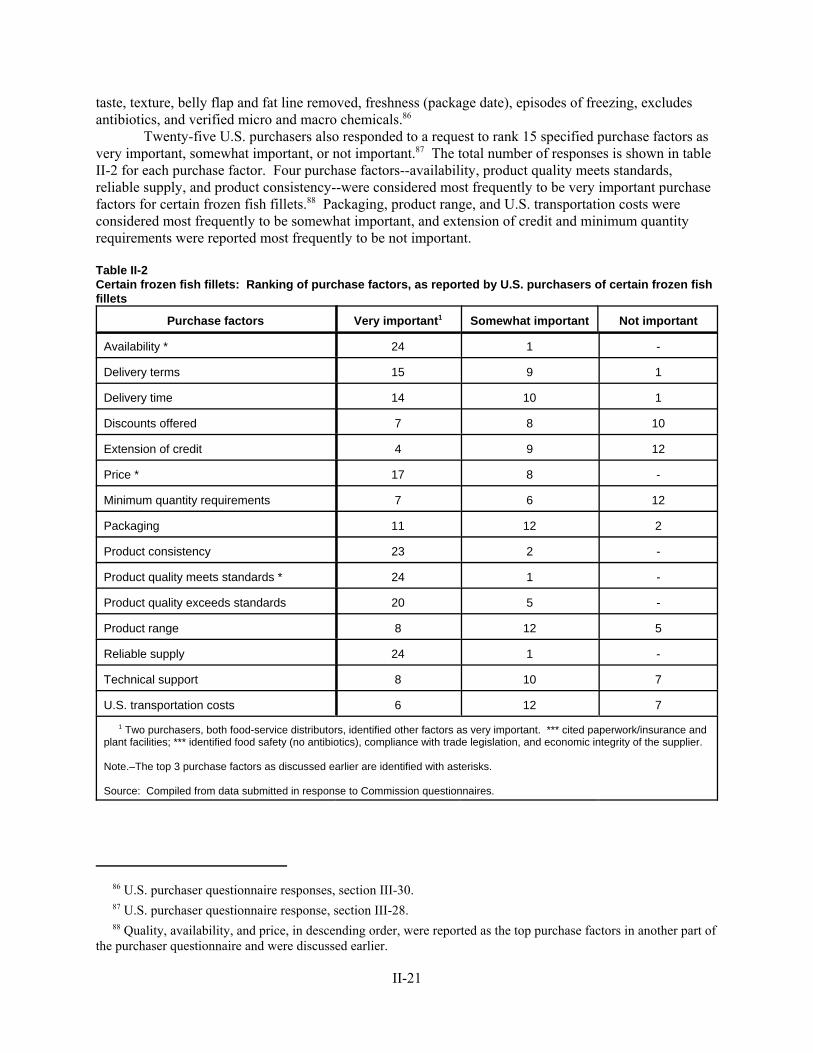
86 U.S. purchaser questionnaire responses, section III-30. 87 U.S. purchaser questionnaire response, section III-28. 88 Quality, availability, and price, in descending order, were reported as the top purchase factors in another part ofthe purchaser questionnaire and were discussed earlier.
II-21
taste, texture, belly flap and fat line removed, freshness (package date), episodes of freezing, excludesantibiotics, and verified micro and macro chemicals.86
Twenty-five U.S. purchasers also responded to a request to rank 15 specified purchase factors asvery important, somewhat important, or not important.87 The total number of responses is shown in tableII-2 for each purchase factor. Four purchase factors--availability, product quality meets standards,reliable supply, and product consistency--were considered most frequently to be very important purchasefactors for certain frozen fish fillets.88 Packaging, product range, and U.S. transportation costs wereconsidered most frequently to be somewhat important, and extension of credit and minimum quantityrequirements were reported most frequently to be not important.
Table II-2Certain frozen fish fillets: Ranking of purchase factors, as reported by U.S. purchasers of certain frozen fishfillets
Purchase factors Very important1 Somewhat important Not important
Availability * 24 1 -
Delivery terms 15 9 1
Delivery time 14 10 1
Discounts offered 7 8 10
Extension of credit 4 9 12
Price * 17 8 -
Minimum quantity requirements 7 6 12
Packaging 11 12 2
Product consistency 23 2 -
Product quality meets standards * 24 1 -
Product quality exceeds standards 20 5 -
Product range 8 12 5
Reliable supply 24 1 -
Technical support 8 10 7
U.S. transportation costs 6 12 7
1 Two purchasers, both food-service distributors, identified other factors as very important. *** cited paperwork/insurance andplant facilities; *** identified food safety (no antibiotics), compliance with trade legislation, and economic integrity of the supplier.
Note.–The top 3 purchase factors as discussed earlier are identified with asterisks.
Source: Compiled from data submitted in response to Commission questionnaires.
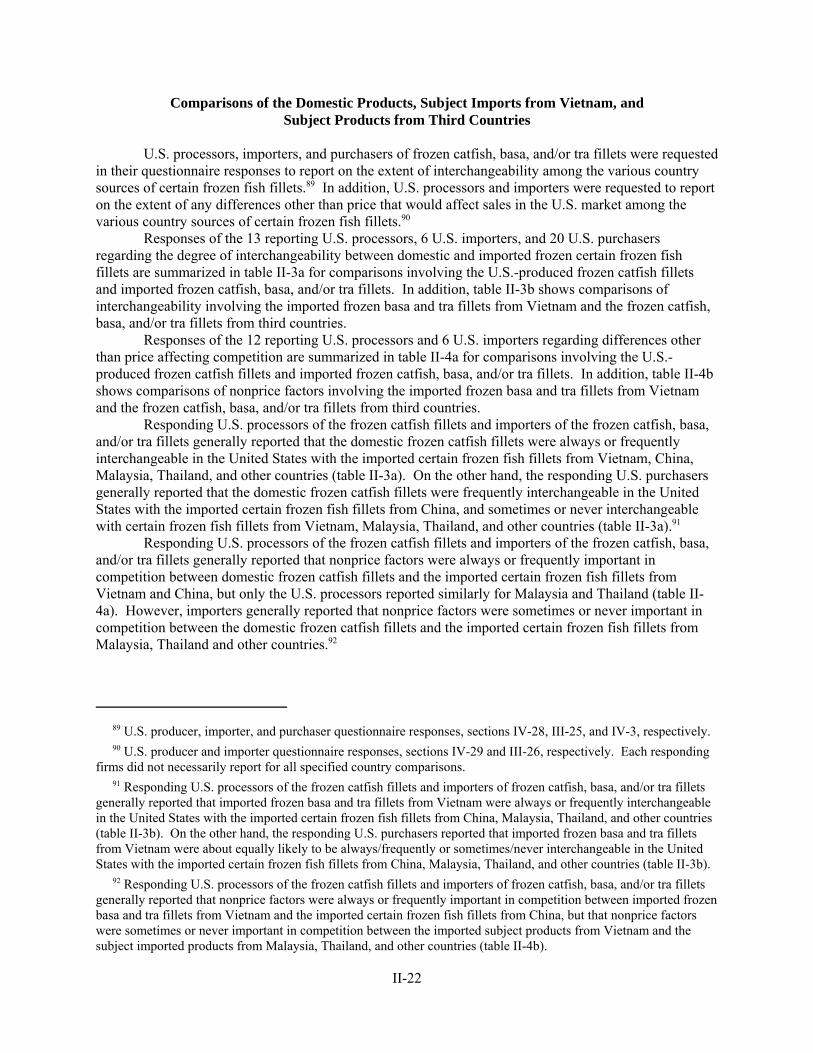
89 U.S. producer, importer, and purchaser questionnaire responses, sections IV-28, III-25, and IV-3, respectively. 90 U.S. producer and importer questionnaire responses, sections IV-29 and III-26, respectively. Each respondingfirms did not necessarily report for all specified country comparisons. 91 Responding U.S. processors of the frozen catfish fillets and importers of frozen catfish, basa, and/or tra filletsgenerally reported that imported frozen basa and tra fillets from Vietnam were always or frequently interchangeablein the United States with the imported certain frozen fish fillets from China, Malaysia, Thailand, and other countries(table II-3b). On the other hand, the responding U.S. purchasers reported that imported frozen basa and tra filletsfrom Vietnam were about equally likely to be always/frequently or sometimes/never interchangeable in the UnitedStates with the imported certain frozen fish fillets from China, Malaysia, Thailand, and other countries (table II-3b). 92 Responding U.S. processors of the frozen catfish fillets and importers of frozen catfish, basa, and/or tra filletsgenerally reported that nonprice factors were always or frequently important in competition between imported frozenbasa and tra fillets from Vietnam and the imported certain frozen fish fillets from China, but that nonprice factorswere sometimes or never important in competition between the imported subject products from Vietnam and thesubject imported products from Malaysia, Thailand, and other countries (table II-4b).
II-22
Comparisons of the Domestic Products, Subject Imports from Vietnam, andSubject Products from Third Countries
U.S. processors, importers, and purchasers of frozen catfish, basa, and/or tra fillets were requestedin their questionnaire responses to report on the extent of interchangeability among the various countrysources of certain frozen fish fillets.89 In addition, U.S. processors and importers were requested to reporton the extent of any differences other than price that would affect sales in the U.S. market among thevarious country sources of certain frozen fish fillets.90
Responses of the 13 reporting U.S. processors, 6 U.S. importers, and 20 U.S. purchasersregarding the degree of interchangeability between domestic and imported frozen certain frozen fishfillets are summarized in table II-3a for comparisons involving the U.S.-produced frozen catfish filletsand imported frozen catfish, basa, and/or tra fillets. In addition, table II-3b shows comparisons ofinterchangeability involving the imported frozen basa and tra fillets from Vietnam and the frozen catfish,basa, and/or tra fillets from third countries.
Responses of the 12 reporting U.S. processors and 6 U.S. importers regarding differences otherthan price affecting competition are summarized in table II-4a for comparisons involving the U.S.-produced frozen catfish fillets and imported frozen catfish, basa, and/or tra fillets. In addition, table II-4bshows comparisons of nonprice factors involving the imported frozen basa and tra fillets from Vietnamand the frozen catfish, basa, and/or tra fillets from third countries.
Responding U.S. processors of the frozen catfish fillets and importers of the frozen catfish, basa,and/or tra fillets generally reported that the domestic frozen catfish fillets were always or frequentlyinterchangeable in the United States with the imported certain frozen fish fillets from Vietnam, China,Malaysia, Thailand, and other countries (table II-3a). On the other hand, the responding U.S. purchasersgenerally reported that the domestic frozen catfish fillets were frequently interchangeable in the UnitedStates with the imported certain frozen fish fillets from China, and sometimes or never interchangeablewith certain frozen fish fillets from Vietnam, Malaysia, Thailand, and other countries (table II-3a).91
Responding U.S. processors of the frozen catfish fillets and importers of the frozen catfish, basa,and/or tra fillets generally reported that nonprice factors were always or frequently important incompetition between domestic frozen catfish fillets and the imported certain frozen fish fillets fromVietnam and China, but only the U.S. processors reported similarly for Malaysia and Thailand (table II-4a). However, importers generally reported that nonprice factors were sometimes or never important incompetition between the domestic frozen catfish fillets and the imported certain frozen fish fillets fromMalaysia, Thailand and other countries.92

II-23
Table II-3aCertain frozen fish fillets: Perceived degree of interchangeability of U.S.-produced frozen catfishfillets vis-a-vis (1) imported frozen basa and tra from Vietnam, and (2) imported frozen catfish,basa, and/or tra from third countries, based on sales in the U.S. market during 2003-08
Country pair
Number of U.S.processors’ responses
Number of U.S.importers’ responses
Number of U.S.purchasers’ responses1
A F S N A F S N A F S N
United States vs.--
Vietnam 10 2 - 1 1 2 1 1 - 4 4 8
China 9 2 - 1 2 3 1 - 2 8 3 6
Malaysia 1 1 2 1 1 2 - - - 1 6 -
Thailand 2 3 - 1 2 1 - - - 1 5 6
Other countries2 - 1 1 1 1 1 - - - 2 2 3
1 The two largest reporting purchasers, ***, reported that the U.S. and imported Vietnamese certain frozen fishfillets were respectively sometimes and never interchangeable. *** also reported the following: (1) *** reportedthat the nature of basa and tra lend themselves to be substituted for catfish, and (2) *** reported that there was norestriction against substituting catfish for basa and tra. U.S. purchaser questionnaire responses, section III-9. 2 None of the responding firms identified specific other countries.
Note.--A = Always, F = Frequently, S = Sometimes, N = Never.
Source: Compiled from data submitted in response to Commission questionnaires.
Table II-3bCertain frozen fish fillets: Perceived degree of interchangeability of imported frozen basa and trafrom Vietnam vis-a-vis imported frozen catfish, basa, and/or tra from third countries, based onsales in the U.S. market during 2003-08
Country pair
Number of U.S.processors’ responses
Number of U.S.importers’ responses
Number of U.S.purchasers’ responses
A F S N A F S N A F S N
Vietnam vs.--
China 8 2 - - - 2 2 - 4 3 4 5
Malaysia 2 1 1 - - 3 - - 2 1 - 3
Thailand 2 2 - - 1 2 - - 2 2 4 2
Other countries1 1 1 - - - 2 - - 1 3 1 2
1 None of the responding firms identified specific other countries.
Note.--A = Always, F = Frequently, S = Sometimes, N = Never.
Source: Compiled from data submitted in response to Commission questionnaires.
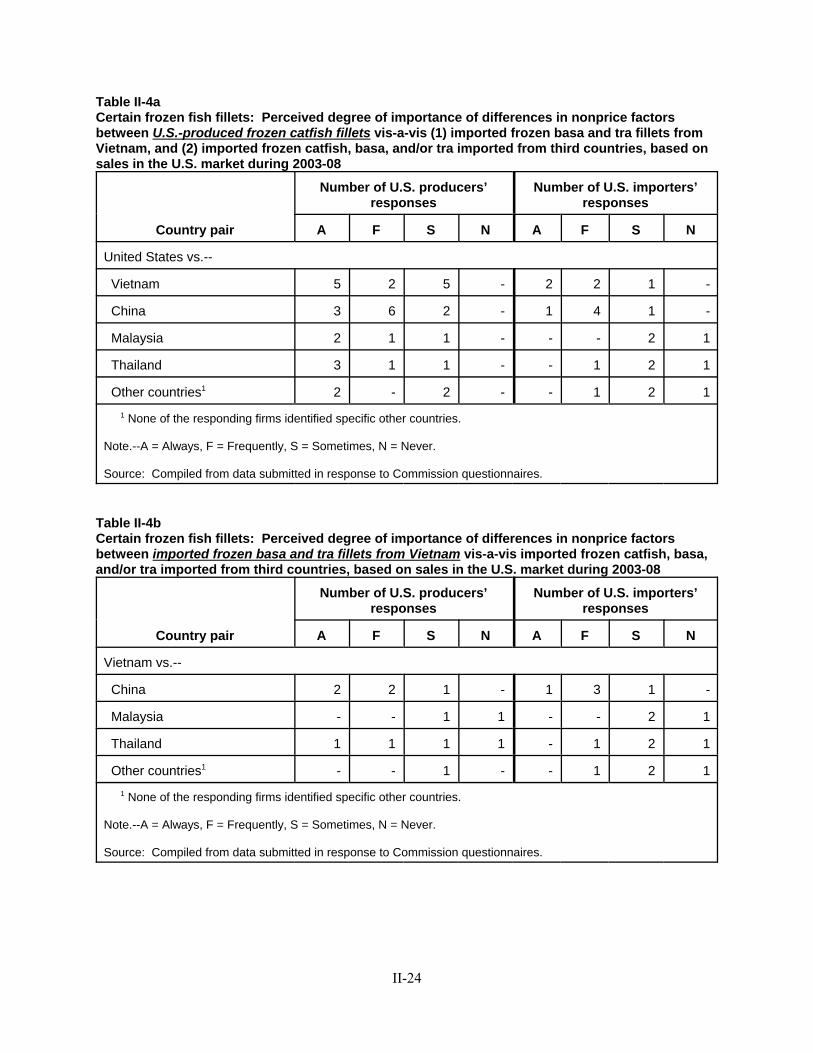
II-24
Table II-4aCertain frozen fish fillets: Perceived degree of importance of differences in nonprice factorsbetween U.S.-produced frozen catfish fillets vis-a-vis (1) imported frozen basa and tra fillets fromVietnam, and (2) imported frozen catfish, basa, and/or tra imported from third countries, based onsales in the U.S. market during 2003-08
Country pair
Number of U.S. producers’responses
Number of U.S. importers’responses
A F S N A F S N
United States vs.--
Vietnam 5 2 5 - 2 2 1 -
China 3 6 2 - 1 4 1 -
Malaysia 2 1 1 - - - 2 1
Thailand 3 1 1 - - 1 2 1
Other countries1 2 - 2 - - 1 2 1
1 None of the responding firms identified specific other countries.
Note.--A = Always, F = Frequently, S = Sometimes, N = Never.
Source: Compiled from data submitted in response to Commission questionnaires.
Table II-4bCertain frozen fish fillets: Perceived degree of importance of differences in nonprice factorsbetween imported frozen basa and tra fillets from Vietnam vis-a-vis imported frozen catfish, basa,and/or tra imported from third countries, based on sales in the U.S. market during 2003-08
Country pair
Number of U.S. producers’responses
Number of U.S. importers’responses
A F S N A F S N
Vietnam vs.--
China 2 2 1 - 1 3 1 -
Malaysia - - 1 1 - - 2 1
Thailand 1 1 1 1 - 1 2 1
Other countries1 - - 1 - - 1 2 1
1 None of the responding firms identified specific other countries.
Note.--A = Always, F = Frequently, S = Sometimes, N = Never.
Source: Compiled from data submitted in response to Commission questionnaires.
93 U.S. producer, importer, and purchaser questionnaire responses, sections IV-28/29, III-25/26, and IV-3,respectively. 94 U.S. purchaser questionnaire responses, section III-18. 95 U.S. purchaser questionnaire responses, section III-19. 96 U.S. purchaser questionnaire responses, section IV-4. 97 Four purchasers, ***, reported that a portion of the customer base, particularly in the South, have a historicalpreference for domestic product, which is based on cultural norms and loyalty to the domestic industry. *** alsoasserted that some U.S. customers, e.g., the military and government, are required to serve the domestic product. 98 Three of the 16 purchasers, ***, reported that customers prefer the imported frozen basa and/or tra fillets fromVietnam due to quality and freshness of the Vietnamese product, and one other purchaser, ***, cited familiarity andrelationships with the Vietnamese processors. Another purchaser, ***, asserted that Pangasius from Vietnam hasfound favor in the U.S. market, not as a substitute for the domestic frozen catfish fillets, but as a distinct product inits own right. Two purchasers, ***, cited customer preference for the imported frozen basa fillets from Vietnam. 99 Two U.S. purchasers, ***, indicated that some of their customers preferred the price and taste of the importedfrozen catfish fillets from China. 100 U.S. purchaser questionnaire response, section IV-7.
II-25
Some of the responding U.S. processors, importers, and purchasers of the certain frozen fishfillets provided useable narrative explanations, as requested, in their questionnaire responses regardingthe degree/importance of interchangeability and nonprice factors.93 Responses provided by the 16 firmscommenting (included U.S. processors, importers, and purchasers) included (1) availability and technicalsupport are occasionally factors, (2) taste and smell differences between the domestic and importedVietnamese products, (3) flavor differences between the domestic and imported Chinese products, (4)quality issues with some imports from China, (5) some customers prefer domestic catfish and some preferbasa, (6) Pangasius, due to higher fat content, is not as firm as the domestic product, (7) product generallyis accepted or rejected based on its merits, not country of origin, (8) fresher and higher quality domesticproduct, and (9) U.S. processors can more easily replace off-flavor fillets.
Country of origin and producer identity appear to be important for U.S. purchasers of frozencatfish, basa, and tra fillets. Fifteen of 26 responding purchasers reported that the country of origin of thecertain frozen fish fillets was always or usually important in their purchases of such products, whereas theremaining 11 firms reported that the country of origin was sometimes or never important.94 Seventeen ofthe 26 responding purchasers reported that the identity of the producer of the certain frozen fish filletswas always or usually important in their purchases of such products, whereas the remaining 9 firmsreported that the identity of the producer was sometimes or never important.95
Purchasers were also requested to explain whether they purchase frozen fish fillets from onecountry in particular over other possible sources of supply.96 Sixteen of the 26 responding U.S.purchasers reported ordering certain frozen fish fillets from a particular country over other sources ofsupply, whereas the 10 remaining firms reported not ordering from a single country in particular. The 16firms reported purchasing from a particular country for the following reasons: (1) customerpreference/requirement for domestic frozen catfish fillets,97 customer preference for imported frozen basaand/or tra from Vietnam,98 or imported frozen catfish fillets from China,99 and (2) purchase from severalregions for risk management purposes.
Purchasers were requested to make country-of-origin comparisons among the domestic frozencatfish fillets, the imported frozen basa and tra fillets from Vietnam, and the imported frozen catfish, basa,and/or tra fillets from third countries based on the 15 specified purchase factors discussed earlier,indicating for each factor whether product from one country was superior, comparable, or inferior toproduct from another country.100 Fifteen purchasers responded, but not for every country comparison;purchaser responses are summarized in table II-5.
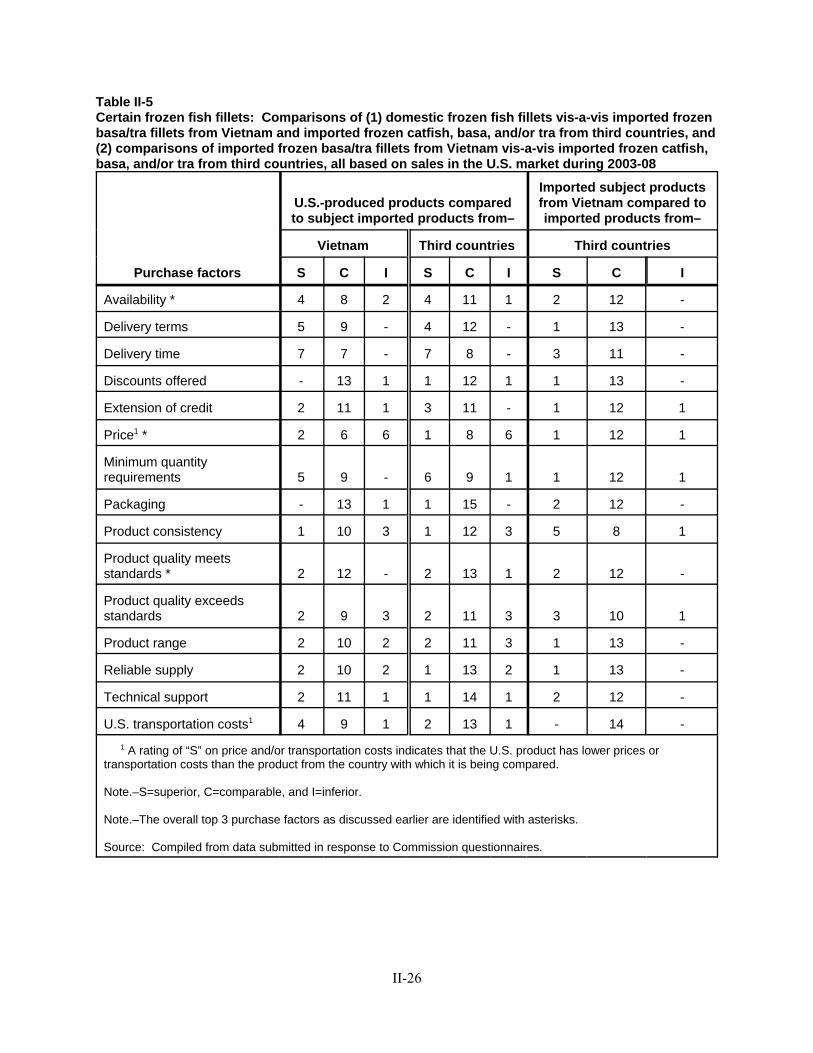
II-26
Table II-5Certain frozen fish fillets: Comparisons of (1) domestic frozen fish fillets vis-a-vis imported frozenbasa/tra fillets from Vietnam and imported frozen catfish, basa, and/or tra from third countries, and(2) comparisons of imported frozen basa/tra fillets from Vietnam vis-a-vis imported frozen catfish,basa, and/or tra from third countries, all based on sales in the U.S. market during 2003-08
Purchase factors
U.S.-produced products comparedto subject imported products from–
Imported subject productsfrom Vietnam compared toimported products from–
Vietnam Third countries Third countries
S C I S C I S C I
Availability * 4 8 2 4 11 1 2 12 -
Delivery terms 5 9 - 4 12 - 1 13 -
Delivery time 7 7 - 7 8 - 3 11 -
Discounts offered - 13 1 1 12 1 1 13 -
Extension of credit 2 11 1 3 11 - 1 12 1
Price1 * 2 6 6 1 8 6 1 12 1
Minimum quantityrequirements 5 9 - 6 9 1 1 12 1
Packaging - 13 1 1 15 - 2 12 -
Product consistency 1 10 3 1 12 3 5 8 1
Product quality meetsstandards * 2 12 - 2 13 1 2 12 -
Product quality exceedsstandards 2 9 3 2 11 3 3 10 1
Product range 2 10 2 2 11 3 1 13 -
Reliable supply 2 10 2 1 13 2 1 13 -
Technical support 2 11 1 1 14 1 2 12 -
U.S. transportation costs1 4 9 1 2 13 1 - 14 -
1 A rating of “S” on price and/or transportation costs indicates that the U.S. product has lower prices ortransportation costs than the product from the country with which it is being compared.
Note.–S=superior, C=comparable, and I=inferior.
Note.–The overall top 3 purchase factors as discussed earlier are identified with asterisks.
Source: Compiled from data submitted in response to Commission questionnaires.
101 Two purchasers, ***, identified additional purchase factors that are not shown. *** reported that the domesticfrozen catfish fillets were inferior to imported certain frozen fish fillets from Vietnam and third countries for theadditional factor “correct net weight;” the firm asserted that U.S. processors do not produce and ship 100 percent netweight, which the firm requires of the foreign producers. *** reported that the domestic frozen catfish fillets weresuperior to imported certain frozen fish fillets from Vietnam and third countries based on the additional purchasefactors of “safety antibiotics and compliance with trade laws,” and comparable based on the additional purchasefactor “economic integrity.” 102 The suggested ranges for the various elasticities were presented in the prehearing report for purposes ofdiscussion in the prehearing briefs, hearing testimony, and/or posthearing briefs; no comments were reported. Theelasticity responses in this section refer to changes that could occur within 12 months, unless otherwise indicated. 103 Domestic supply response is generally assumed to be symmetrical for both an increase and a decrease indemand for the domestic product. Exceptions to this assumption occur when the supply response is restricted whendemand increases (e.g., the domestic firm(s) operate near or at full capacity and any likely expansion in capacitywould take more than 12 months to complete), or when demand decreases (e.g., the domestic firm(s) must operate ator near full capacity due to very high fixed costs). 104 The higher end of the range for supply elasticity for domestic frozen catfish fillets, however, depends on therequired increase in prices necessary for increased production of farm-raised catfish; the higher the price increaserequired the lower the supply elasticity of domestic frozen catfish fillets. 105 The greater the effect of substitutes for certain frozen fish fillets, the closer the elasticity is to the higher end ofthe range, and the greater the effect of alternatives as complements to certain frozen fish fillets, the closer theelasticity is to the lower end of the range.
II-27
The U.S.-produced frozen catfish fillets were generally comparable to the imported frozen basaand tra fillets from Vietnam and to the imported frozen catfish, basa, and/or tra fillets from thirdcountries.101 The single exception involved delivery times for both sets of comparisons; the domesticfrozen catfish fillets were rated superior in nearly half of all comparisons.
ELASTICITY ESTIMATES102
U.S. Supply Elasticity
The domestic supply elasticity for U.S.-processed frozen catfish fillets measures the sensitivity ofthe quantity supplied by the U.S. producers to a change in the U.S. market price of these products. Theelasticity of domestic supply depends on several factors including the U.S. producers’ level of excesscapacity, the ease with which the U.S. producers can alter their productive capacity, the existence ofinventories, and the availability of alternate markets for domestic frozen catfish fillets.103 Analysis ofthese factors indicates that, overall, the U.S. processors had flexibility in the short run to alter their supplyof frozen catfish fillets to the U.S. market in response to relative changes in the demand for their products. The domestic elasticity of supply for frozen catfish fillets is estimated to be in the range of 2-4.104
U.S. Demand Elasticity
The U.S. price elasticity of demand for certain frozen fish fillets measures the sensitivity of theoverall quantity demanded for certain frozen fish fillets to changes in the U.S. market price of certainfrozen fish fillets. The price elasticity of demand depends on factors discussed earlier such as theexistence and availability of substitute products for certain frozen fish fillets. Based on availableinformation, the demand elasticity for certain frozen fish fillets is estimated to be in the range of negative0.5 to negative 1.5.105
106 The substitution elasticity measures the responsiveness of the relative U.S. consumption levels of the importsand the U.S. domestic like product to changes in their relative prices. This reflects how easily purchasers switchfrom the U.S. product to the imported product (or vice versa) when prices change. 107 Some purchasers asserted that the labeling requirements have led, to at least some degree, to differentiatedmarkets for the domestic frozen catfish fillets and imported frozen basa and tra fillets from Vietnam. 108 The more modest the impact of differentiating factors between the domestic and subject imported products,such as regional consumer preferences for the domestic product, differences in taste and texture, “Buy America”policies and laws, concern about health factors regarding the subject imported products, etc., the closer thesubstitution elasticity is to the upper end of the range. The more pronounced these differentiating factors, the closerthe substitution elasticity is to the lower end of the range.
II-28
Substitution Elasticity106
The elasticity of substitution largely depends upon the degree to which there is an overlap ofcompetition between domestic frozen catfish fillets and imported frozen basa and tra fillets from Vietnam,and the extent of product differentiation.107 Product differentiation, in turn, depends on such factors asphysical characteristics (e.g., sizes (weights), types (regular, shank, or strip fillets), taste, smell, texture,and other quality factors), consumer preferences, and conditions of sale (e.g., delivery lead times,reliability of supply, technical service, etc.). Based on available information discussed earlier, theelasticity of substitution between domestic frozen fish fillets and imported frozen basa and tra fillets fromVietnam is estimated to be in the range of 2-4.108
1 Staff’s coverage estimate is based on a comparison of data compiled from Commission questionnaires to officialUSDA/NASS statistics. ***.
III-1
PART III: CONDITION OF THE U.S. INDUSTRY
OVERVIEW
Background
Information in this section is based on the questionnaire responses of 14 processors thataccounted for 82.4 percent of U.S. shipments during 2008.1
Changes Experienced in Operations
Domestic processors were asked to indicate whether their firm had experienced any plantopenings, relocations, expansions, acquisitions, consolidation, closures, or prolonged shutdowns becauseof strikes or equipment failure; curtailment of production because of shortages of materials or otherreasons including revision of labor agreements (including pension or health care obligations of retirees orcurrent employees); or any other change in the character of their operations or organization relating to theproduction of frozen fish fillets since 2003. Thirteen processors indicated that they had experiencedsome change in the character of their operations since 2003. The domestic processors’ responses to thisquestion are detailed in table III-1.
Table III-1Certain frozen fish fillets: Changes in the character of U.S. operations
* * * * * * *
Anticipated Changes in Existing Operations
The Commission requested that domestic processors discuss anticipated changes to their U.S.operations. Table III-2 presents U.S. processors’ anticipated changes to their U.S. operations.
Table III-2Certain frozen fish fillets: Anticipated changes in U.S. operations
* * * * * * *
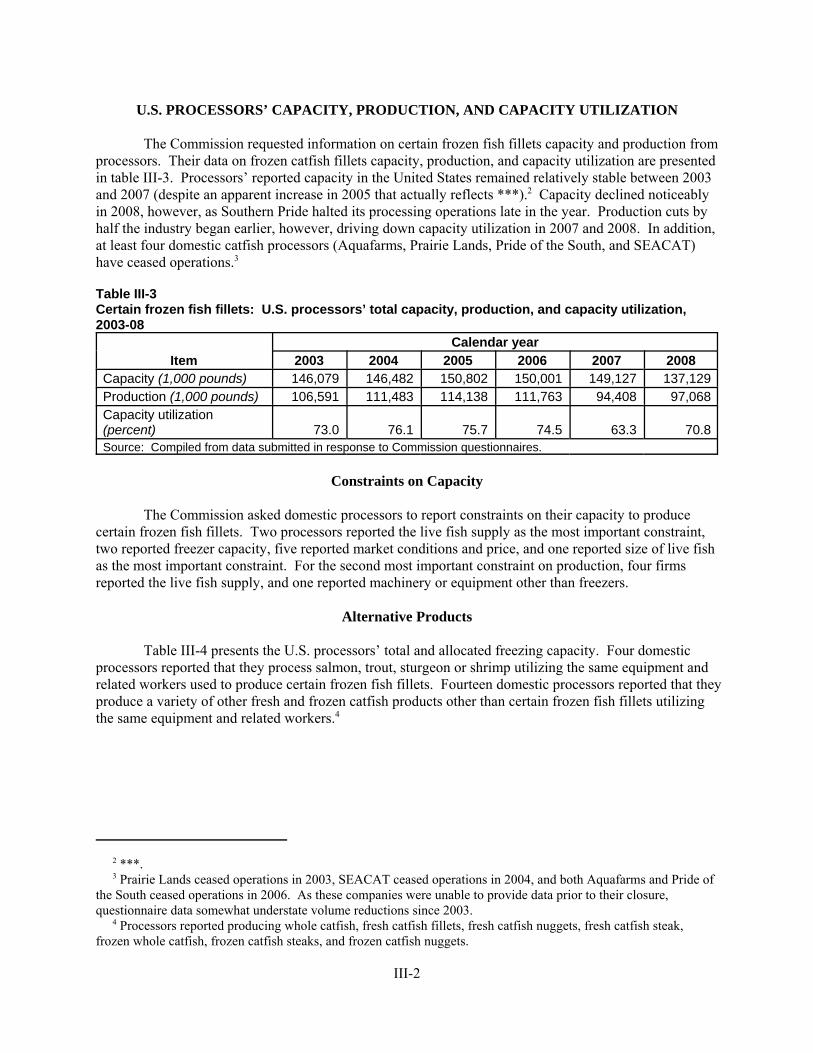
2 ***. 3 Prairie Lands ceased operations in 2003, SEACAT ceased operations in 2004, and both Aquafarms and Pride ofthe South ceased operations in 2006. As these companies were unable to provide data prior to their closure,questionnaire data somewhat understate volume reductions since 2003. 4 Processors reported producing whole catfish, fresh catfish fillets, fresh catfish nuggets, fresh catfish steak,frozen whole catfish, frozen catfish steaks, and frozen catfish nuggets.
III-2
U.S. PROCESSORS’ CAPACITY, PRODUCTION, AND CAPACITY UTILIZATION
The Commission requested information on certain frozen fish fillets capacity and production fromprocessors. Their data on frozen catfish fillets capacity, production, and capacity utilization are presentedin table III-3. Processors’ reported capacity in the United States remained relatively stable between 2003and 2007 (despite an apparent increase in 2005 that actually reflects ***).2 Capacity declined noticeablyin 2008, however, as Southern Pride halted its processing operations late in the year. Production cuts byhalf the industry began earlier, however, driving down capacity utilization in 2007 and 2008. In addition,at least four domestic catfish processors (Aquafarms, Prairie Lands, Pride of the South, and SEACAT)have ceased operations.3
Table III-3Certain frozen fish fillets: U.S. processors’ total capacity, production, and capacity utilization,2003-08
ItemCalendar year
2003 2004 2005 2006 2007 2008Capacity (1,000 pounds) 146,079 146,482 150,802 150,001 149,127 137,129Production (1,000 pounds) 106,591 111,483 114,138 111,763 94,408 97,068Capacity utilization(percent) 73.0 76.1 75.7 74.5 63.3 70.8Source: Compiled from data submitted in response to Commission questionnaires.
Constraints on Capacity
The Commission asked domestic processors to report constraints on their capacity to producecertain frozen fish fillets. Two processors reported the live fish supply as the most important constraint,two reported freezer capacity, five reported market conditions and price, and one reported size of live fishas the most important constraint. For the second most important constraint on production, four firmsreported the live fish supply, and one reported machinery or equipment other than freezers.
Alternative Products
Table III-4 presents the U.S. processors’ total and allocated freezing capacity. Four domesticprocessors reported that they process salmon, trout, sturgeon or shrimp utilizing the same equipment andrelated workers used to produce certain frozen fish fillets. Fourteen domestic processors reported that theyproduce a variety of other fresh and frozen catfish products other than certain frozen fish fillets utilizingthe same equipment and related workers.4
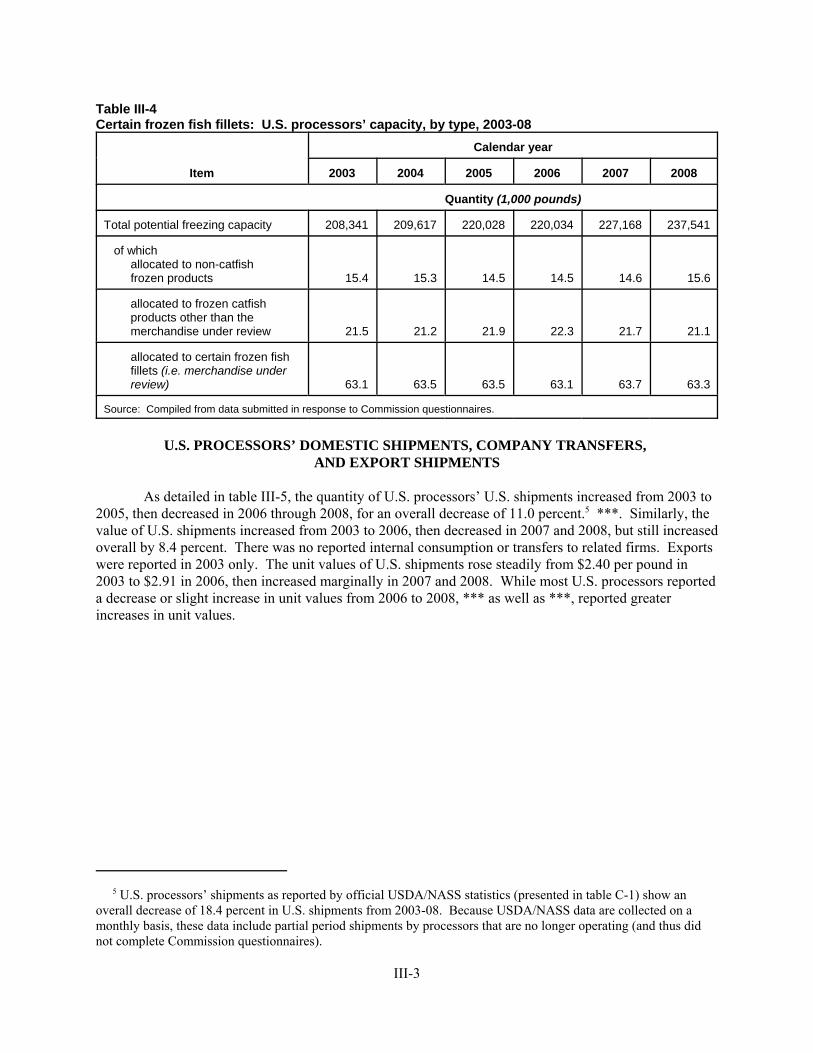
5 U.S. processors’ shipments as reported by official USDA/NASS statistics (presented in table C-1) show anoverall decrease of 18.4 percent in U.S. shipments from 2003-08. Because USDA/NASS data are collected on amonthly basis, these data include partial period shipments by processors that are no longer operating (and thus didnot complete Commission questionnaires).
III-3
Table III-4Certain frozen fish fillets: U.S. processors’ capacity, by type, 2003-08
Item
Calendar year
2003 2004 2005 2006 2007 2008
Quantity (1,000 pounds)
Total potential freezing capacity 208,341 209,617 220,028 220,034 227,168 237,541
of which allocated to non-catfish frozen products 15.4 15.3 14.5 14.5 14.6 15.6
allocated to frozen catfish products other than the merchandise under review 21.5 21.2 21.9 22.3 21.7 21.1
allocated to certain frozen fish fillets (i.e. merchandise under review) 63.1 63.5 63.5 63.1 63.7 63.3
Source: Compiled from data submitted in response to Commission questionnaires.
U.S. PROCESSORS’ DOMESTIC SHIPMENTS, COMPANY TRANSFERS, AND EXPORT SHIPMENTS
As detailed in table III-5, the quantity of U.S. processors’ U.S. shipments increased from 2003 to2005, then decreased in 2006 through 2008, for an overall decrease of 11.0 percent.5 ***. Similarly, thevalue of U.S. shipments increased from 2003 to 2006, then decreased in 2007 and 2008, but still increasedoverall by 8.4 percent. There was no reported internal consumption or transfers to related firms. Exportswere reported in 2003 only. The unit values of U.S. shipments rose steadily from $2.40 per pound in2003 to $2.91 in 2006, then increased marginally in 2007 and 2008. While most U.S. processors reporteda decrease or slight increase in unit values from 2006 to 2008, *** as well as ***, reported greaterincreases in unit values.
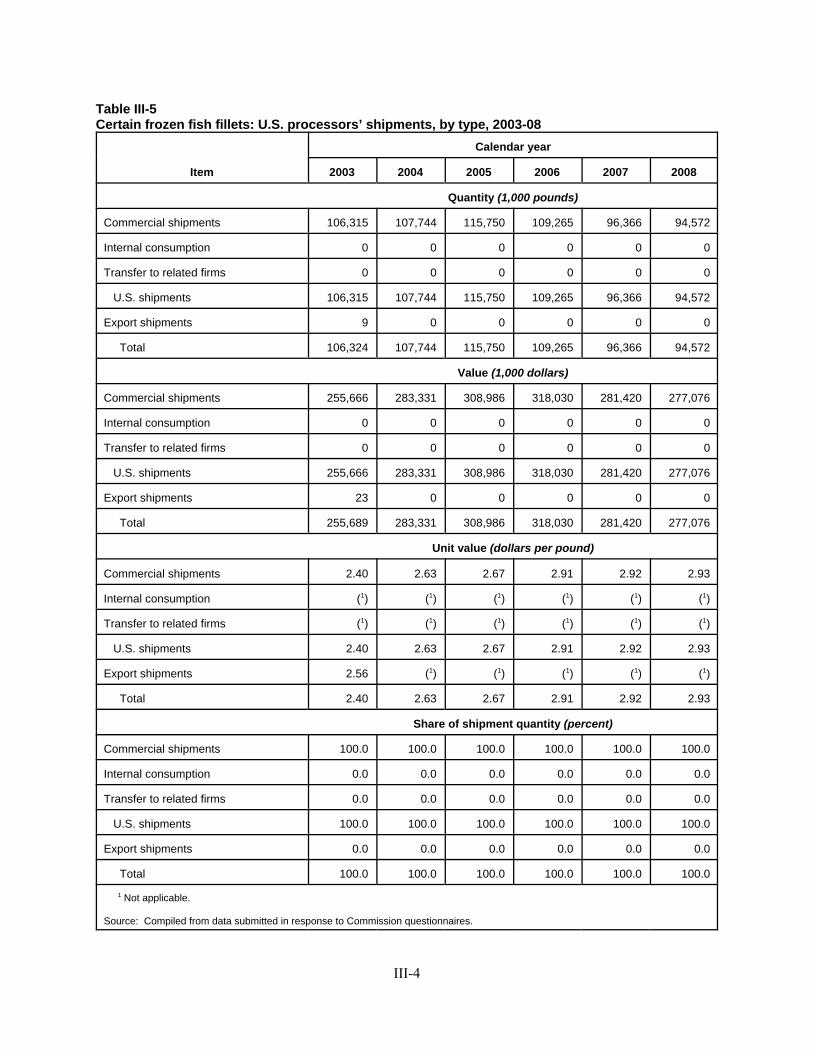
III-4
Table III-5Certain frozen fish fillets: U.S. processors’ shipments, by type, 2003-08
Item
Calendar year
2003 2004 2005 2006 2007 2008
Quantity (1,000 pounds)
Commercial shipments 106,315 107,744 115,750 109,265 96,366 94,572
Internal consumption 0 0 0 0 0 0
Transfer to related firms 0 0 0 0 0 0
U.S. shipments 106,315 107,744 115,750 109,265 96,366 94,572
Export shipments 9 0 0 0 0 0
Total 106,324 107,744 115,750 109,265 96,366 94,572
Value (1,000 dollars)
Commercial shipments 255,666 283,331 308,986 318,030 281,420 277,076
Internal consumption 0 0 0 0 0 0
Transfer to related firms 0 0 0 0 0 0
U.S. shipments 255,666 283,331 308,986 318,030 281,420 277,076
Export shipments 23 0 0 0 0 0
Total 255,689 283,331 308,986 318,030 281,420 277,076
Unit value (dollars per pound)
Commercial shipments 2.40 2.63 2.67 2.91 2.92 2.93
Internal consumption (1) (1) (1) (1) (1) (1)
Transfer to related firms (1) (1) (1) (1) (1) (1)
U.S. shipments 2.40 2.63 2.67 2.91 2.92 2.93
Export shipments 2.56 (1) (1) (1) (1) (1)
Total 2.40 2.63 2.67 2.91 2.92 2.93
Share of shipment quantity (percent)
Commercial shipments 100.0 100.0 100.0 100.0 100.0 100.0
Internal consumption 0.0 0.0 0.0 0.0 0.0 0.0
Transfer to related firms 0.0 0.0 0.0 0.0 0.0 0.0
U.S. shipments 100.0 100.0 100.0 100.0 100.0 100.0
Export shipments 0.0 0.0 0.0 0.0 0.0 0.0
Total 100.0 100.0 100.0 100.0 100.0 100.0
1 Not applicable.
Source: Compiled from data submitted in response to Commission questionnaires.
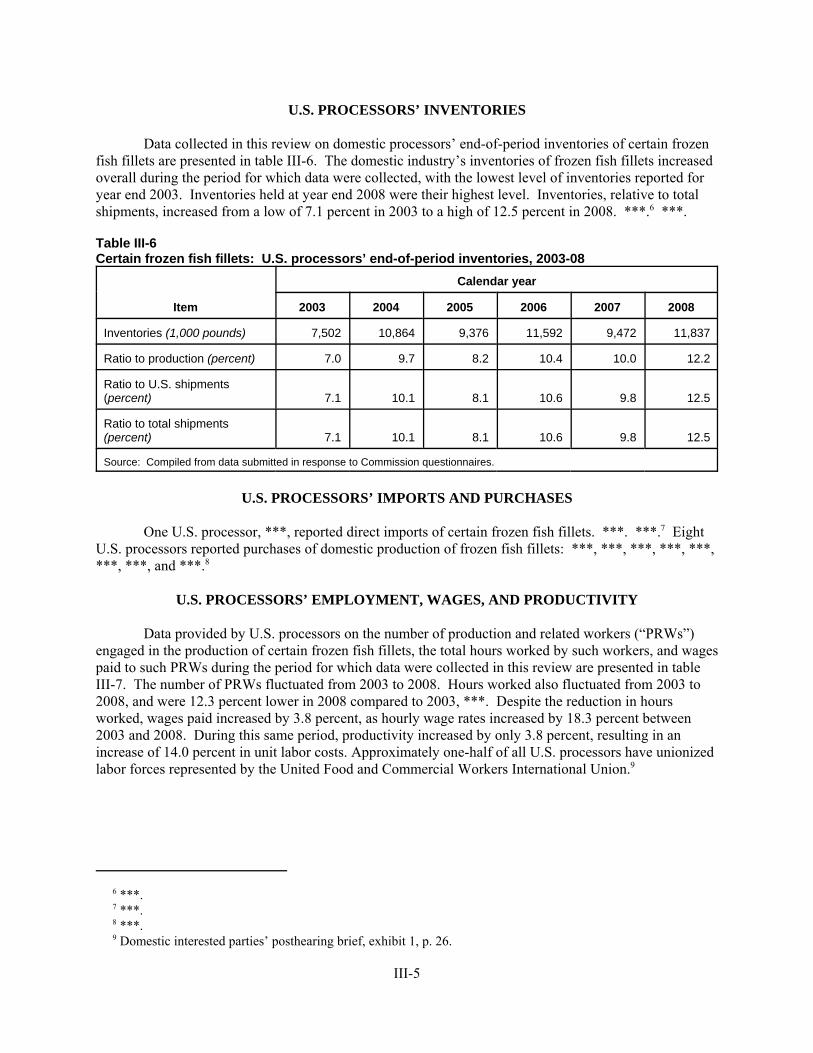
6 ***. 7 ***. 8 ***. 9 Domestic interested parties’ posthearing brief, exhibit 1, p. 26.
III-5
U.S. PROCESSORS’ INVENTORIES
Data collected in this review on domestic processors’ end-of-period inventories of certain frozenfish fillets are presented in table III-6. The domestic industry’s inventories of frozen fish fillets increasedoverall during the period for which data were collected, with the lowest level of inventories reported foryear end 2003. Inventories held at year end 2008 were their highest level. Inventories, relative to totalshipments, increased from a low of 7.1 percent in 2003 to a high of 12.5 percent in 2008. ***.6 ***.
Table III-6Certain frozen fish fillets: U.S. processors’ end-of-period inventories, 2003-08
Item
Calendar year
2003 2004 2005 2006 2007 2008
Inventories (1,000 pounds) 7,502 10,864 9,376 11,592 9,472 11,837
Ratio to production (percent) 7.0 9.7 8.2 10.4 10.0 12.2
Ratio to U.S. shipments(percent) 7.1 10.1 8.1 10.6 9.8 12.5
Ratio to total shipments(percent) 7.1 10.1 8.1 10.6 9.8 12.5
Source: Compiled from data submitted in response to Commission questionnaires.
U.S. PROCESSORS’ IMPORTS AND PURCHASES
One U.S. processor, ***, reported direct imports of certain frozen fish fillets. ***. ***.7 EightU.S. processors reported purchases of domestic production of frozen fish fillets: ***, ***, ***, ***, ***,***, ***, and ***.8
U.S. PROCESSORS’ EMPLOYMENT, WAGES, AND PRODUCTIVITY
Data provided by U.S. processors on the number of production and related workers (“PRWs”)engaged in the production of certain frozen fish fillets, the total hours worked by such workers, and wagespaid to such PRWs during the period for which data were collected in this review are presented in tableIII-7. The number of PRWs fluctuated from 2003 to 2008. Hours worked also fluctuated from 2003 to2008, and were 12.3 percent lower in 2008 compared to 2003, ***. Despite the reduction in hoursworked, wages paid increased by 3.8 percent, as hourly wage rates increased by 18.3 percent between2003 and 2008. During this same period, productivity increased by only 3.8 percent, resulting in anincrease of 14.0 percent in unit labor costs. Approximately one-half of all U.S. processors have unionizedlabor forces represented by the United Food and Commercial Workers International Union.9
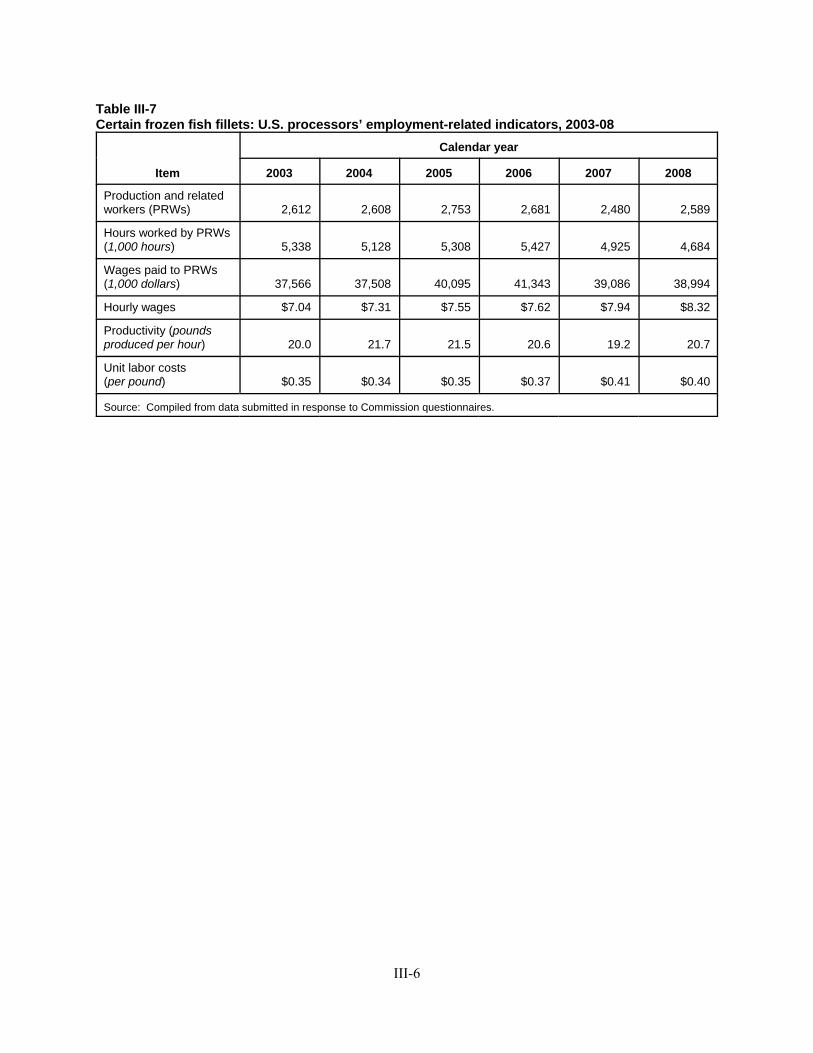
III-6
Table III-7Certain frozen fish fillets: U.S. processors’ employment-related indicators, 2003-08
Item
Calendar year
2003 2004 2005 2006 2007 2008
Production and relatedworkers (PRWs) 2,612 2,608 2,753 2,681 2,480 2,589
Hours worked by PRWs(1,000 hours) 5,338 5,128 5,308 5,427 4,925 4,684
Wages paid to PRWs(1,000 dollars) 37,566 37,508 40,095 41,343 39,086 38,994
Hourly wages $7.04 $7.31 $7.55 $7.62 $7.94 $8.32
Productivity (poundsproduced per hour) 20.0 21.7 21.5 20.6 19.2 20.7
Unit labor costs (per pound) $0.35 $0.34 $0.35 $0.37 $0.41 $0.40
Source: Compiled from data submitted in response to Commission questionnaires.
10 *** 11 *** 12 ***. Auditor prehearing notes (EDIS document ID number 401361). 13 See appendix F for a description of the components which make up the variance analysis. The absence of 2003and 2004 data for *** limits the accuracy of the variance analysis. *** represents a *** processor accounting for*** percent to *** percent of the industry’s total sales volume between 2005 and 2008. Additionally and withrespect to the industry’s financial results as a whole, profitability is likely somewhat overstated in 2003 and 2004 bythe absence of ***. Ibid. 14 ***. 15 Table C-1. 16 E-mail with attachments from ***, March 13, 2009. 17 Auditor prehearing notes.
III-7
FINANCIAL EXPERIENCE OF THE U.S. PROCESSORS
Background
The financial results of 14 U.S. processors of frozen catfish fillets are presented in this section ofthe report.10 The majority of processors reported their financial results on the basis of U.S. generallyaccepted accounting principles (“GAAP”) for calendar and fiscal year periods.11
Revenue represents commercial sales with no transfers or internal consumption reported. Whilesome U.S. processors maintained essentially the same frozen catfish fillet operations throughout theperiod, *** reported changes in the nature of their operations which impacted their respective financialresults.12
Processors’ Operations on Frozen Catfish Fillets
Table III-8 presents the financial results of the U.S. industry’s processing operations on frozencatfish fillets. Selected financial information by processor is presented in table III-9. For each processorthe relative share of live catfish purchased from related and unrelated growers, respectively, is presentedin table III-10. Table III-11 presents a variance analysis of the U.S. processors financial results.13
Sales Quantity and Value
When considering those processors and successor entities reporting operations throughout theperiod, overall sales volume declined *** percent between 2003 and 2008.14 For the same periodNASS/USDA information indicates that frozen fish fillet sales volume declined by around 18.4 percent.15
While the majority of processors reported lower sales volume at the end of the period comparedto the beginning, the magnitude of company-specific declines was not uniform. Of the medium-to-largevolume processors (i.e., over several million pounds in sales volume) with operations throughout theentire period, *** reported the most substantial overall decline in sales volume at *** percent. Corresponding with this decline, *** eliminated a portion of its processing capacity in 2006.16 Similarly,the overall decline in *** sales volume during the period corresponds with the elimination of thatcompany’s ***.17
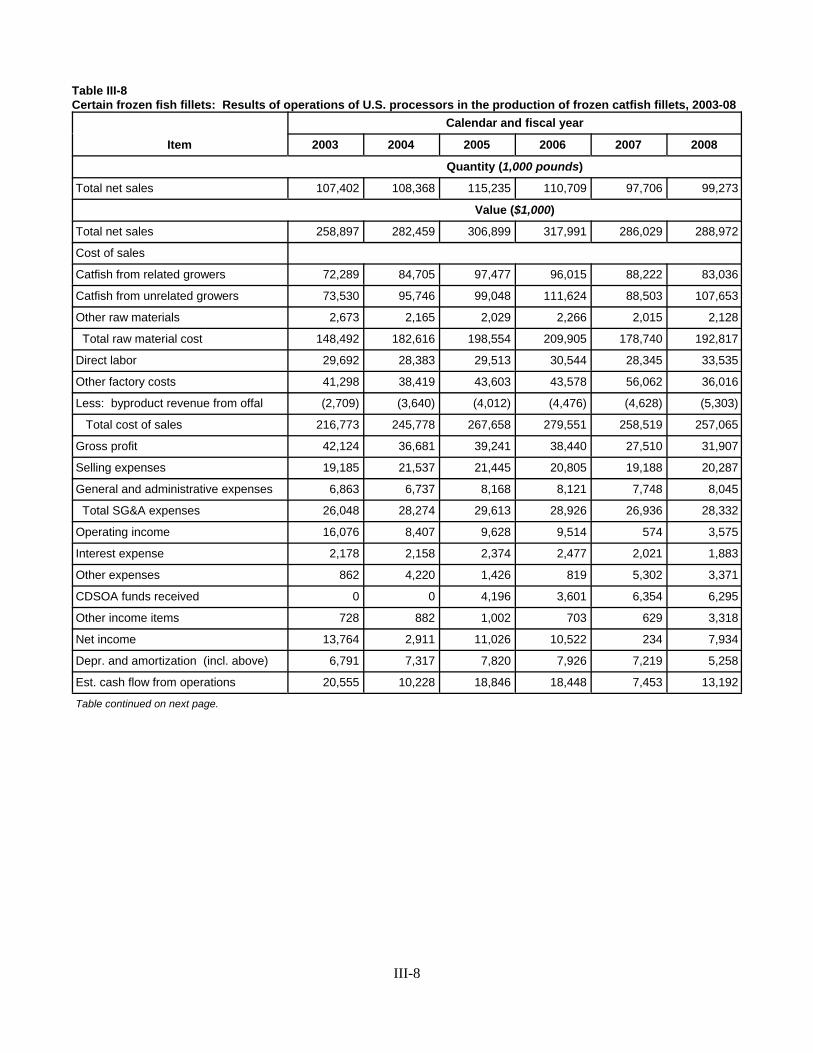
III-8
Table III-8Certain frozen fish fillets: Results of operations of U.S. processors in the production of frozen catfish fillets, 2003-08
Item
Calendar and fiscal year
2003 2004 2005 2006 2007 2008
Quantity (1,000 pounds)
Total net sales 107,402 108,368 115,235 110,709 97,706 99,273
Value ($1,000)
Total net sales 258,897 282,459 306,899 317,991 286,029 288,972
Cost of sales
Catfish from related growers 72,289 84,705 97,477 96,015 88,222 83,036
Catfish from unrelated growers 73,530 95,746 99,048 111,624 88,503 107,653
Other raw materials 2,673 2,165 2,029 2,266 2,015 2,128
Total raw material cost 148,492 182,616 198,554 209,905 178,740 192,817
Direct labor 29,692 28,383 29,513 30,544 28,345 33,535
Other factory costs 41,298 38,419 43,603 43,578 56,062 36,016
Less: byproduct revenue from offal (2,709) (3,640) (4,012) (4,476) (4,628) (5,303)
Total cost of sales 216,773 245,778 267,658 279,551 258,519 257,065
Gross profit 42,124 36,681 39,241 38,440 27,510 31,907
Selling expenses 19,185 21,537 21,445 20,805 19,188 20,287
General and administrative expenses 6,863 6,737 8,168 8,121 7,748 8,045
Total SG&A expenses 26,048 28,274 29,613 28,926 26,936 28,332
Operating income 16,076 8,407 9,628 9,514 574 3,575
Interest expense 2,178 2,158 2,374 2,477 2,021 1,883
Other expenses 862 4,220 1,426 819 5,302 3,371
CDSOA funds received 0 0 4,196 3,601 6,354 6,295
Other income items 728 882 1,002 703 629 3,318
Net income 13,764 2,911 11,026 10,522 234 7,934
Depr. and amortization (incl. above) 6,791 7,317 7,820 7,926 7,219 5,258
Est. cash flow from operations 20,555 10,228 18,846 18,448 7,453 13,192
Table continued on next page.
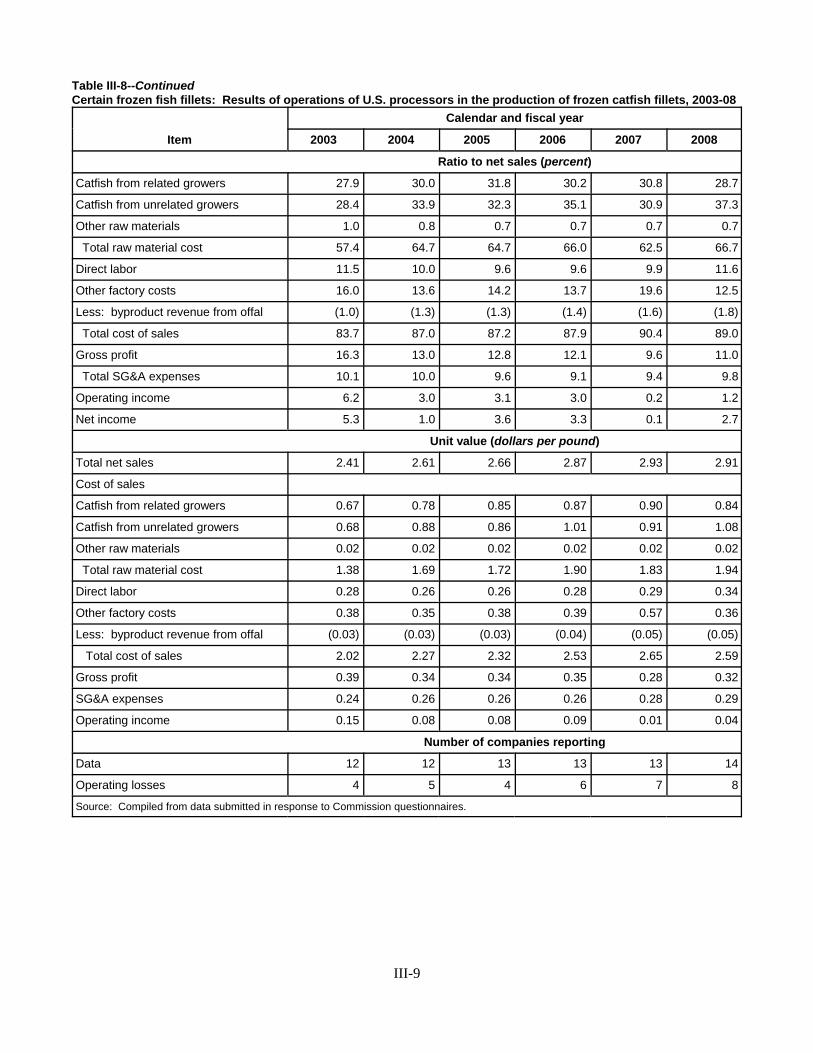
III-9
Table III-8--ContinuedCertain frozen fish fillets: Results of operations of U.S. processors in the production of frozen catfish fillets, 2003-08
Item
Calendar and fiscal year
2003 2004 2005 2006 2007 2008
Ratio to net sales (percent)
Catfish from related growers 27.9 30.0 31.8 30.2 30.8 28.7
Catfish from unrelated growers 28.4 33.9 32.3 35.1 30.9 37.3
Other raw materials 1.0 0.8 0.7 0.7 0.7 0.7
Total raw material cost 57.4 64.7 64.7 66.0 62.5 66.7
Direct labor 11.5 10.0 9.6 9.6 9.9 11.6
Other factory costs 16.0 13.6 14.2 13.7 19.6 12.5
Less: byproduct revenue from offal (1.0) (1.3) (1.3) (1.4) (1.6) (1.8)
Total cost of sales 83.7 87.0 87.2 87.9 90.4 89.0
Gross profit 16.3 13.0 12.8 12.1 9.6 11.0
Total SG&A expenses 10.1 10.0 9.6 9.1 9.4 9.8
Operating income 6.2 3.0 3.1 3.0 0.2 1.2
Net income 5.3 1.0 3.6 3.3 0.1 2.7
Unit value (dollars per pound)
Total net sales 2.41 2.61 2.66 2.87 2.93 2.91
Cost of sales
Catfish from related growers 0.67 0.78 0.85 0.87 0.90 0.84
Catfish from unrelated growers 0.68 0.88 0.86 1.01 0.91 1.08
Other raw materials 0.02 0.02 0.02 0.02 0.02 0.02
Total raw material cost 1.38 1.69 1.72 1.90 1.83 1.94
Direct labor 0.28 0.26 0.26 0.28 0.29 0.34
Other factory costs 0.38 0.35 0.38 0.39 0.57 0.36
Less: byproduct revenue from offal (0.03) (0.03) (0.03) (0.04) (0.05) (0.05)
Total cost of sales 2.02 2.27 2.32 2.53 2.65 2.59
Gross profit 0.39 0.34 0.34 0.35 0.28 0.32
SG&A expenses 0.24 0.26 0.26 0.26 0.28 0.29
Operating income 0.15 0.08 0.08 0.09 0.01 0.04
Number of companies reporting
Data 12 12 13 13 13 14
Operating losses 4 5 4 6 7 8
Source: Compiled from data submitted in response to Commission questionnaires.
18 ***. 19 ***. Auditor prehearing notes. 20 See table C-1. 21 This pattern is generally consistent with NASS/USDA data compiled from Catfish Processing reports(presented below). The 6.2 percent increase in average raw material costs in 2008 compared to 2007 reflected intable III-9, however, is notably higher compared to the 1.2 percent increase in the average price received by growersas reported by NASS/USDA. As discussed below, the reason for this divergence appears to be primarily due to themanner in which ***.
2003 2004 2005 2006 2007 2008
Farm-raised catfish prices (dollars per pound) 0.58 0.70 0.72 0.80 0.77 0.78
III-10
Table III-9Certain frozen fish fillets: Results of operations of U.S. processors in the production of frozen catfish fillets,by firm, 2003-08
* * * * * * *
Table III-10Certain frozen fish fillets: U.S. processors’ cost of live catfish purchased from related and unrelatedgrowers, respectively, as a share of total cost of live catfish, 2003-08
* * * * * * *
In contrast with the majority of processors with operations throughout the period, *** reportedoverall increases in sales volume of *** percent and *** percent, respectively, from 2003 through 2008. Similarly, while *** reported somewhat lower sales volume in 2008 compared to 2003, its sales volumefor 2004 through 2007 was consistently above the 2003 level. As discussed below, these companies,along with ***, are also notable because they are the *** medium-to-large size processors that reportedoperating profit on their certain frozen fish fillet operations throughout the period for which data werecollected.18
Consistent with the decline in overall sales volume, the table III-11 variance analysis shows thatthe overall increase in certain frozen fish fillet revenue was due entirely to higher average sales value. With some exceptions, table III-9 shows that company-specific average sales values for certain frozen fishfillets were in the same basic range and generally followed similar patterns of change.19 When taken as awhole the average per pound sales value presented in table III-8 are within several cents of the per poundsales values reported by NASS/USDA.20 As noted below with respect to differences in financial results,company-specific average sales values in part reflect variations in the level of further processing andchannels of trade.
Table III-8 shows that higher average sales values generally correspond with increases in averageraw material costs. The exceptions to this pattern were in 2007 when the overall average sales value ofcertain frozen fish fillets increased and average raw material costs declined, and in 2008 when overallaverage sales value of certain frozen fish fillets declined and average raw material costs increased.21
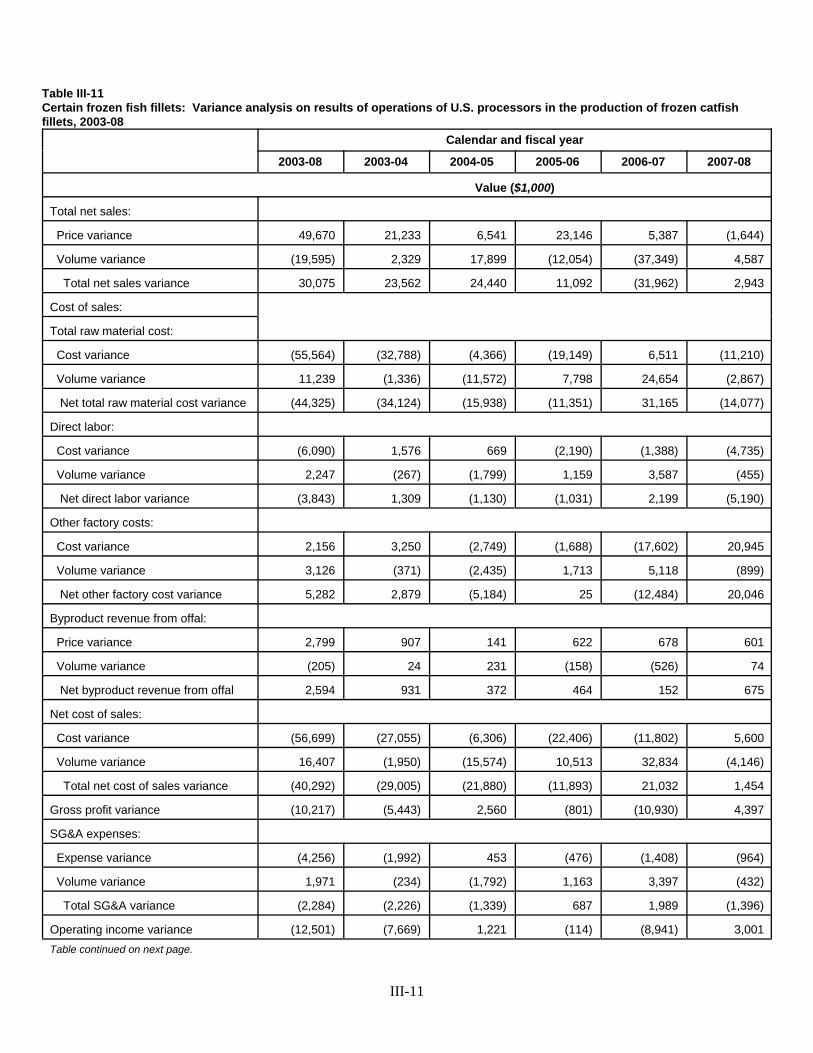
III-11
Table III-11Certain frozen fish fillets: Variance analysis on results of operations of U.S. processors in the production of frozen catfishfillets, 2003-08
Calendar and fiscal year
2003-08 2003-04 2004-05 2005-06 2006-07 2007-08
Value ($1,000)
Total net sales:
Price variance 49,670 21,233 6,541 23,146 5,387 (1,644)
Volume variance (19,595) 2,329 17,899 (12,054) (37,349) 4,587
Total net sales variance 30,075 23,562 24,440 11,092 (31,962) 2,943
Cost of sales:
Total raw material cost:
Cost variance (55,564) (32,788) (4,366) (19,149) 6,511 (11,210)
Volume variance 11,239 (1,336) (11,572) 7,798 24,654 (2,867)
Net total raw material cost variance (44,325) (34,124) (15,938) (11,351) 31,165 (14,077)
Direct labor:
Cost variance (6,090) 1,576 669 (2,190) (1,388) (4,735)
Volume variance 2,247 (267) (1,799) 1,159 3,587 (455)
Net direct labor variance (3,843) 1,309 (1,130) (1,031) 2,199 (5,190)
Other factory costs:
Cost variance 2,156 3,250 (2,749) (1,688) (17,602) 20,945
Volume variance 3,126 (371) (2,435) 1,713 5,118 (899)
Net other factory cost variance 5,282 2,879 (5,184) 25 (12,484) 20,046
Byproduct revenue from offal:
Price variance 2,799 907 141 622 678 601
Volume variance (205) 24 231 (158) (526) 74
Net byproduct revenue from offal 2,594 931 372 464 152 675
Net cost of sales:
Cost variance (56,699) (27,055) (6,306) (22,406) (11,802) 5,600
Volume variance 16,407 (1,950) (15,574) 10,513 32,834 (4,146)
Total net cost of sales variance (40,292) (29,005) (21,880) (11,893) 21,032 1,454
Gross profit variance (10,217) (5,443) 2,560 (801) (10,930) 4,397
SG&A expenses:
Expense variance (4,256) (1,992) 453 (476) (1,408) (964)
Volume variance 1,971 (234) (1,792) 1,163 3,397 (432)
Total SG&A variance (2,284) (2,226) (1,339) 687 1,989 (1,396)
Operating income variance (12,501) (7,669) 1,221 (114) (8,941) 3,001Table continued on next page.
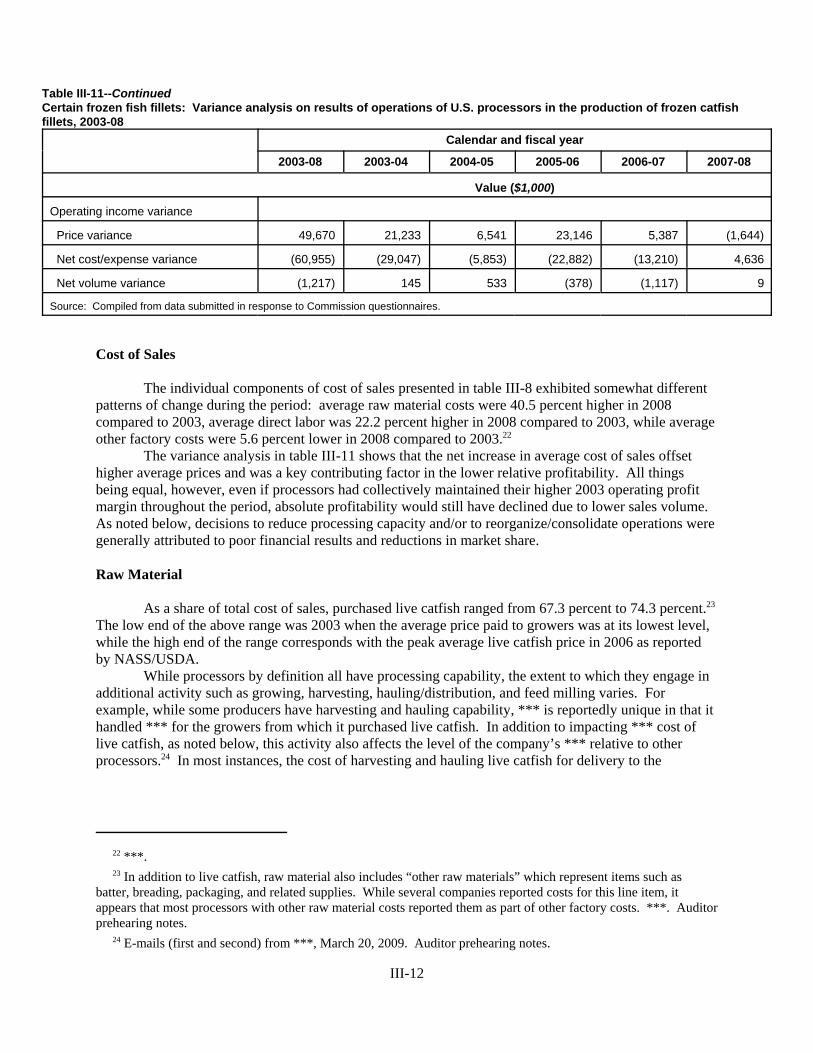
22 ***. 23 In addition to live catfish, raw material also includes “other raw materials” which represent items such asbatter, breading, packaging, and related supplies. While several companies reported costs for this line item, itappears that most processors with other raw material costs reported them as part of other factory costs. ***. Auditorprehearing notes. 24 E-mails (first and second) from ***, March 20, 2009. Auditor prehearing notes.
III-12
Table III-11--ContinuedCertain frozen fish fillets: Variance analysis on results of operations of U.S. processors in the production of frozen catfishfillets, 2003-08
Calendar and fiscal year
2003-08 2003-04 2004-05 2005-06 2006-07 2007-08
Value ($1,000)
Operating income variance
Price variance 49,670 21,233 6,541 23,146 5,387 (1,644)
Net cost/expense variance (60,955) (29,047) (5,853) (22,882) (13,210) 4,636
Net volume variance (1,217) 145 533 (378) (1,117) 9
Source: Compiled from data submitted in response to Commission questionnaires.
Cost of Sales
The individual components of cost of sales presented in table III-8 exhibited somewhat differentpatterns of change during the period: average raw material costs were 40.5 percent higher in 2008compared to 2003, average direct labor was 22.2 percent higher in 2008 compared to 2003, while averageother factory costs were 5.6 percent lower in 2008 compared to 2003.22
The variance analysis in table III-11 shows that the net increase in average cost of sales offsethigher average prices and was a key contributing factor in the lower relative profitability. All thingsbeing equal, however, even if processors had collectively maintained their higher 2003 operating profitmargin throughout the period, absolute profitability would still have declined due to lower sales volume.As noted below, decisions to reduce processing capacity and/or to reorganize/consolidate operations weregenerally attributed to poor financial results and reductions in market share. Raw Material
As a share of total cost of sales, purchased live catfish ranged from 67.3 percent to 74.3 percent.23 The low end of the above range was 2003 when the average price paid to growers was at its lowest level,while the high end of the range corresponds with the peak average live catfish price in 2006 as reportedby NASS/USDA.
While processors by definition all have processing capability, the extent to which they engage inadditional activity such as growing, harvesting, hauling/distribution, and feed milling varies. Forexample, while some producers have harvesting and hauling capability, *** is reportedly unique in that ithandled *** for the growers from which it purchased live catfish. In addition to impacting *** cost oflive catfish, as noted below, this activity also affects the level of the company’s *** relative to otherprocessors.24 In most instances, the cost of harvesting and hauling live catfish for delivery to the
25 ***. Ibid. 26 ***. E-mail with attachment from Akin Gump on behalf of ***, March 23, 2009. Auditor prehearing notes. 27 ***. E-mail with attachment from Akin Gump on behalf of ***, March 17, 2009. ***. Auditor prehearingnotes. ***. E-mail with attachments from ***, March 11, 2009. ***. E-mail with attachments from Akin Gump onbehalf of ***, March 13, 2009. ***. E-mail with attachment from Akin Gump on behalf of ***, March 16, 2009.
28 ***. E-mail with attachments from Akin Gump on behalf of ***, March 17, 2009. ***. E-mail withattachments from ***, March 13, 2009. ***. Auditor prehearing notes. ***. Ibid. 29 ***. Ibid. 30 As shown in table III-10, some processors reported relatively large changes in the share of live catfishpurchased from related and unrelated growers. ***. E-mail with attachment from Akin Gump on behalf of ***,March 23, 2009. 31 ***. Auditor prehearing notes. ***. Auditor prehearing notes. 32 ***. E-mail with attachment from Akin Gump on behalf of ***, March 31, 2009. E-mail with attachment fromAkin Gump on behalf of ***, April 2, 2009. 33 ***. Auditor prehearing notes. 34 The relative share of purchases from related and unrelated growers does not generally explain differences incompany-specific financial results. ***. 35 Size here generally refers to the range of live catfish weight which maximizes processing efficiencies.
III-13
processor appears to be the responsibility of the grower and is therefore not directly reflected as a cost intable III-8.25
In some cases, the comparability of company-specific raw material costs shown in table III-9 islimited. In particular, ***. As explained by the company, notable changes in *** average raw materialcosts in 2007 and 2008, as shown in table III-9, reflect large swings in ***.26
Live Catfish Purchased from Related and Unrelated Growers
The term “related grower” covers a number of relationships including primary ownership in theprocessing facility as a grower/owner, as well as growers with processing rights.27 In several cases,“related grower” also refers to the captive growing operations of divisions or companies related to theprocessor.28 Table III-10 shows that purchases of live catfish from unrelated growers represented themajority of overall purchases during the period.29 30
While most processors stated that the price paid to related and unrelated growers for live catfishwas the same and at fair market value, *** indicated that its related growers have occasionally received asomewhat higher price compared to unrelated growers.31 When asked to clarify whether payments torelated growers included a distribution of profit, most processors stated that the reported cost of livecatfish from related growers does not include a distribution of profit.32 While the net price paid for livecatfish by processors varies, fair market value at any given time appears to be based in part on what largerprocessors are understood to be currently paying.33 34
Adjustments to Net Prices Paid to Growers
While processors generally characterized the price paid for live catfish as fair market value, theredoes not appear to be a single method for adjusting prices for the actual size delivered by growers.35 In atleast one case, the processor does not retroactively adjust the price for under or over-sized fish, but doesreduce the price paid to growers by several cents below market to account for the absence of a sizepenalty. Another processor only implements a size-based price structure when supply is abundant. Otherprocessors indicated that within the last several years they have adopted price structures in which only
36 Auditor prehearing notes. ***. Ibid. 37 Ibid. ***. Ibid. 38 Ibid. ***. Ibid. 39 ***. Ibid. 40 ***. Ibid. 41 Ibid. 42 Ibid. Approximately half of all U.S. processors are unionized. Petitioners’ posthearing brief, exhibit 1, p. 26.***. Auditor prehearing notes. 43 As shown in table III-9, the average direct labor cost reported by ***. Ibid. 44 E-mail with attachment from Akin Gump on behalf of ***, March 17, 2009. 45 Auditor prehearing notes.
III-14
fish falling within the desired size range receive full price; i.e., the net price paid for fish falling outsidethis range reflects a deduction. In instances where the price is not adjusted for size directly, at least oneprocessor indicated that it has implemented a system to track the size of live fish delivered by specificgrowers. This in turn allows the processor to direct purchases to growers consistently supplying moredesirable size ranges.36 Despite differences in price structure, processors generally indicated thatadjustments to net price are applied equally to both related and unrelated growers.37
Consistent with generally higher prices paid to growers during the period, table III-8 shows thattotal average raw material cost generally increased throughout the period. In addition to higher prices,most processors reported that the average yield of usable catfish meat declined during the latter part of theperiod. This decline was generally attributed to higher feed costs which in turn reduced feeding bygrowers. In an attempt to mitigate higher feed prices, there were reportedly changes in feed formulationwhich may have also adversely affected yield.38 Notwithstanding a general shift by a number ofprocessors to adjust the net price of live catfish for delivered size, most processors indicated that they donot routinely adjust net price for actual yield.39 While several processors acknowledged the practicalbenefit of adjusting net price for yield, ***.40
Direct Labor
As described by several processors, catfish processing is highly labor intensive. For example,***.41
With respect to changes in direct labor costs in general, most processors cited increased minimumwages as being a primary factor.42 In the case of ***, higher average direct labor cost, as compared to***, was due primarily to the reconfiguration of operations.43 In contrast, the consistently higher averagedirect labor cost reported by *** compared to other processors appears to be primarily due to ***.44
Other Factory Costs
With respect to changes in other factory costs, a number of processors indicated that packagingand energy costs increased in the latter part of the period. One processor also noted that the cost oftripolyphosphates used to extend shelf life increased in 2008.45 While these factors likely impacted all or
46 ***. Ibid. ***. Ibid. E-mails (first and second) from ***, March 20, 2009. 47 ***. Auditor prehearing notes. 48 ***. E-mail with attachment from Akin Gump on behalf of ***, March 23, 2009. 49 E-mail with attachment from Akin Gump on behalf of ***, March 17, 2009. 50 E-mail with attachment from Akin Gump on behalf of ***, March 17, 2009. 51 E-mail with attachment from Akin Gump on behalf of ***, March 23, 2009. 52 E-mail with attachment from Akin Gump on behalf of ***, March 13, 2009. 53 ***. E-mail with attachment from Akin Gump on behalf of ***, March 16, 2009. 54 ***. Auditor prehearing notes. ***. E-mail with attachment from Akin Gump on behalf of ***, March 23, 2009. ***. E-mail with attachment from Akin Gump on behalf of ***, March 17, 2009. 55 *** both eliminated capacity during the period. ***. E-mail with attachments from ***, March 13, 2009. ***. Auditor prehearing notes. 56 ***. Auditor prehearing notes. 57 ***. *** U.S. producer questionnaire response, III-13. ***. E-mail with attachment from Akin Gump onbehalf of ***, March 16, 2009.
III-15
the majority of processors, average other factory costs for some processors also reflect underlyingchanges in their operations, as well as the accounting method used to report cost of sales.46 47
Financial Results
While general trends such as changes in average sales value and raw material cost were commonto most processors, there are a number of factors which make each processor unique and in turn help toexplain differences in company-specific financial results (see table III-9).
***.48 ***.49 ***.50 ***.51 ***.52 Notwithstanding the generally positive financial performance of the above processors, table III-9
shows that the majority of processors reported consecutive losses interspersed with sporadic operatingincome. This pattern of poor financial results in turn motivated capacity reductions, reorganization,consolidation, as well as one processor’s complete exit from the market.53 54 55
While the impact of capacity reductions and reorganization/consolidation is directly reflected inchanges in sales volume and the exit and entry of processors, non-recurring charges related to theseoperational changes are not reflected in table III-8 operating results; i.e., affected processors either did notreport such restructuring charges to the Commission or reported them as “other expenses.”56
Research and Development Expenses, Capital Expenditures, Assets, and Return on Investment
Data on company-specific research and development (“R&D”) expenses, capital expenditures,total assets, and return on investment (“ROI”) are presented in table III-12.
As shown in table III-12, *** processors reporting R&D expenses during the period.57
Consistent with a period during which overall capacity was reduced and some processingoperations reorganized/consolidated, the U.S. industry’s annual capital expenditures were consistentlylower than corresponding depreciation expense. As described by processors, capital expenditures
58 With the exception of ***, the following narrative statements are based on company-specific responses toquestion III-13 of the U.S. producer questionnaire response. ***. Auditor prehearing notes.
III-16
Table III-12Certain frozen fish fillets: Value of research and development expenses, capital expenditures, total assets,and return on investment of U.S. processors of frozen catfish fillets, 2003-08
* * * * * * *
generally fell into the following categories: capitalized maintenance and repair, equipment purchases toimprove quality and efficiency, and truck/trailer purchases.58
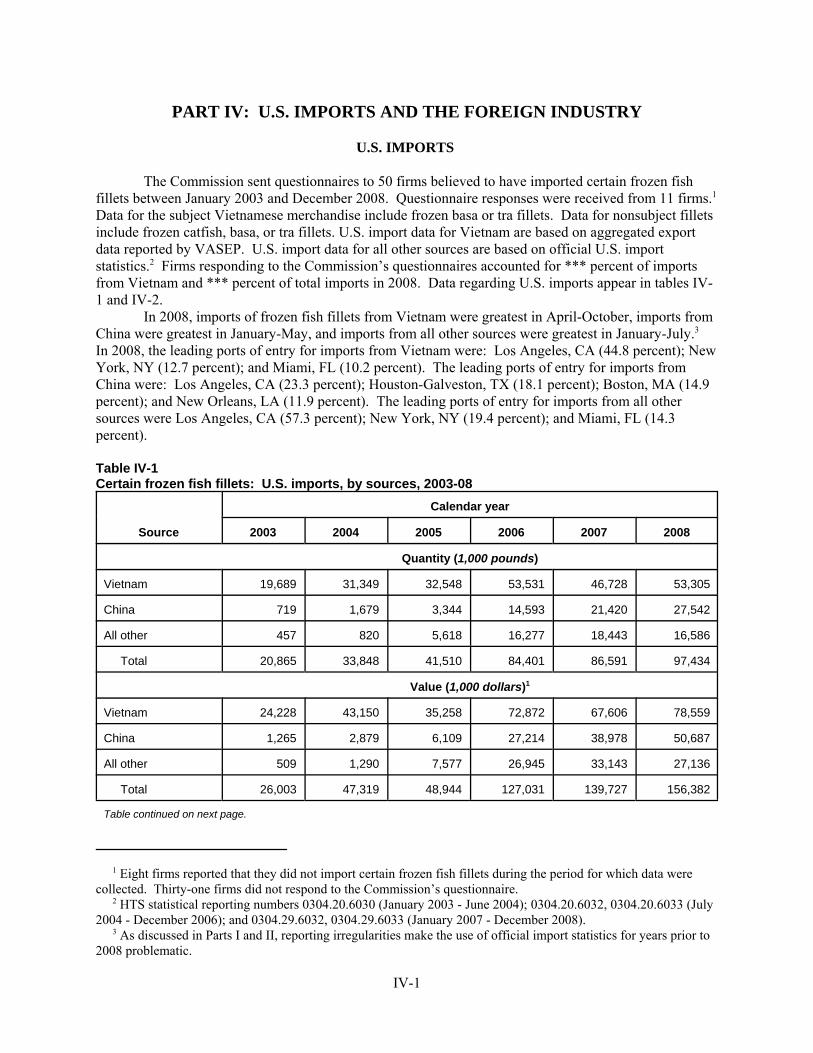
1 Eight firms reported that they did not import certain frozen fish fillets during the period for which data werecollected. Thirty-one firms did not respond to the Commission’s questionnaire. 2 HTS statistical reporting numbers 0304.20.6030 (January 2003 - June 2004); 0304.20.6032, 0304.20.6033 (July2004 - December 2006); and 0304.29.6032, 0304.29.6033 (January 2007 - December 2008). 3 As discussed in Parts I and II, reporting irregularities make the use of official import statistics for years prior to2008 problematic.
IV-1
PART IV: U.S. IMPORTS AND THE FOREIGN INDUSTRY
U.S. IMPORTS
The Commission sent questionnaires to 50 firms believed to have imported certain frozen fishfillets between January 2003 and December 2008. Questionnaire responses were received from 11 firms.1 Data for the subject Vietnamese merchandise include frozen basa or tra fillets. Data for nonsubject filletsinclude frozen catfish, basa, or tra fillets. U.S. import data for Vietnam are based on aggregated exportdata reported by VASEP. U.S. import data for all other sources are based on official U.S. importstatistics.2 Firms responding to the Commission’s questionnaires accounted for *** percent of importsfrom Vietnam and *** percent of total imports in 2008. Data regarding U.S. imports appear in tables IV-1 and IV-2.
In 2008, imports of frozen fish fillets from Vietnam were greatest in April-October, imports fromChina were greatest in January-May, and imports from all other sources were greatest in January-July.3 In 2008, the leading ports of entry for imports from Vietnam were: Los Angeles, CA (44.8 percent); NewYork, NY (12.7 percent); and Miami, FL (10.2 percent). The leading ports of entry for imports fromChina were: Los Angeles, CA (23.3 percent); Houston-Galveston, TX (18.1 percent); Boston, MA (14.9percent); and New Orleans, LA (11.9 percent). The leading ports of entry for imports from all othersources were Los Angeles, CA (57.3 percent); New York, NY (19.4 percent); and Miami, FL (14.3percent).
Table IV-1Certain frozen fish fillets: U.S. imports, by sources, 2003-08
Source
Calendar year
2003 2004 2005 2006 2007 2008
Quantity (1,000 pounds)
Vietnam 19,689 31,349 32,548 53,531 46,728 53,305
China 719 1,679 3,344 14,593 21,420 27,542
All other 457 820 5,618 16,277 18,443 16,586
Total 20,865 33,848 41,510 84,401 86,591 97,434
Value (1,000 dollars)1
Vietnam 24,228 43,150 35,258 72,872 67,606 78,559
China 1,265 2,879 6,109 27,214 38,978 50,687
All other 509 1,290 7,577 26,945 33,143 27,136
Total 26,003 47,319 48,944 127,031 139,727 156,382
Table continued on next page.
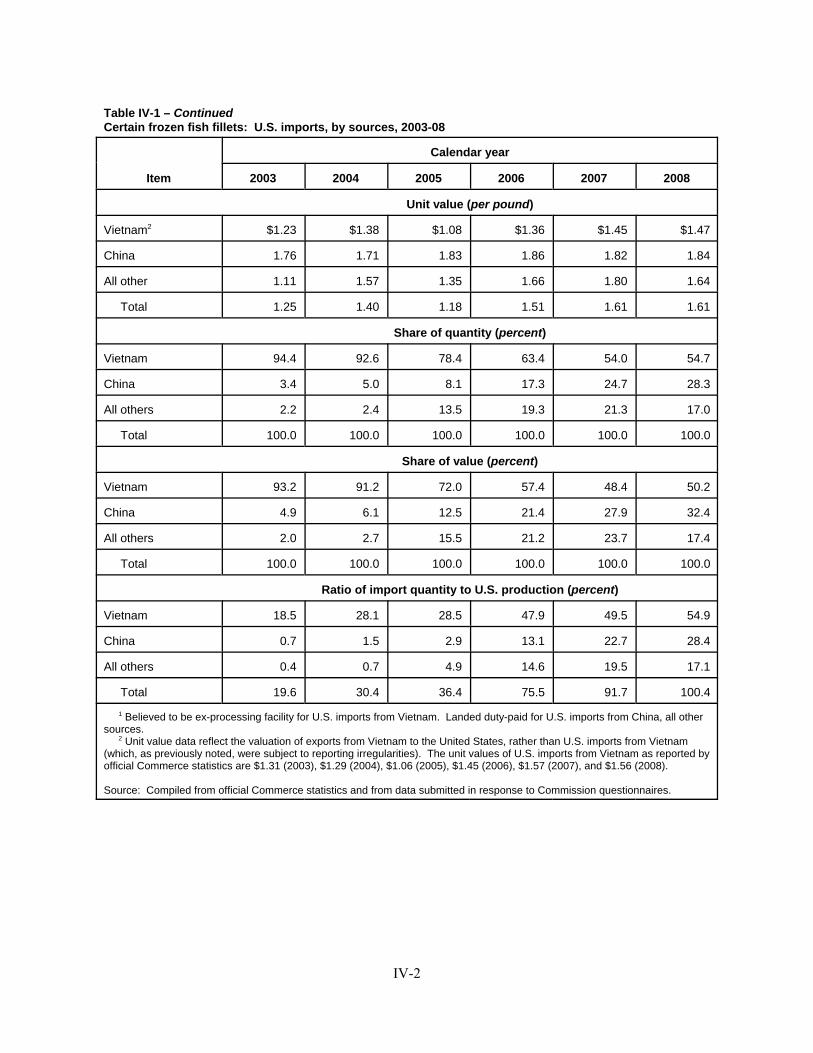
IV-2
Table IV-1 – ContinuedCertain frozen fish fillets: U.S. imports, by sources, 2003-08
Item
Calendar year
2003 2004 2005 2006 2007 2008
Unit value (per pound)
Vietnam2 $1.23 $1.38 $1.08 $1.36 $1.45 $1.47
China 1.76 1.71 1.83 1.86 1.82 1.84
All other 1.11 1.57 1.35 1.66 1.80 1.64
Total 1.25 1.40 1.18 1.51 1.61 1.61
Share of quantity (percent)
Vietnam 94.4 92.6 78.4 63.4 54.0 54.7
China 3.4 5.0 8.1 17.3 24.7 28.3
All others 2.2 2.4 13.5 19.3 21.3 17.0
Total 100.0 100.0 100.0 100.0 100.0 100.0
Share of value (percent)
Vietnam 93.2 91.2 72.0 57.4 48.4 50.2
China 4.9 6.1 12.5 21.4 27.9 32.4
All others 2.0 2.7 15.5 21.2 23.7 17.4
Total 100.0 100.0 100.0 100.0 100.0 100.0
Ratio of import quantity to U.S. production (percent)
Vietnam 18.5 28.1 28.5 47.9 49.5 54.9
China 0.7 1.5 2.9 13.1 22.7 28.4
All others 0.4 0.7 4.9 14.6 19.5 17.1
Total 19.6 30.4 36.4 75.5 91.7 100.4
1 Believed to be ex-processing facility for U.S. imports from Vietnam. Landed duty-paid for U.S. imports from China, all othersources. 2 Unit value data reflect the valuation of exports from Vietnam to the United States, rather than U.S. imports from Vietnam(which, as previously noted, were subject to reporting irregularities). The unit values of U.S. imports from Vietnam as reported byofficial Commerce statistics are $1.31 (2003), $1.29 (2004), $1.06 (2005), $1.45 (2006), $1.57 (2007), and $1.56 (2008).
Source: Compiled from official Commerce statistics and from data submitted in response to Commission questionnaires.
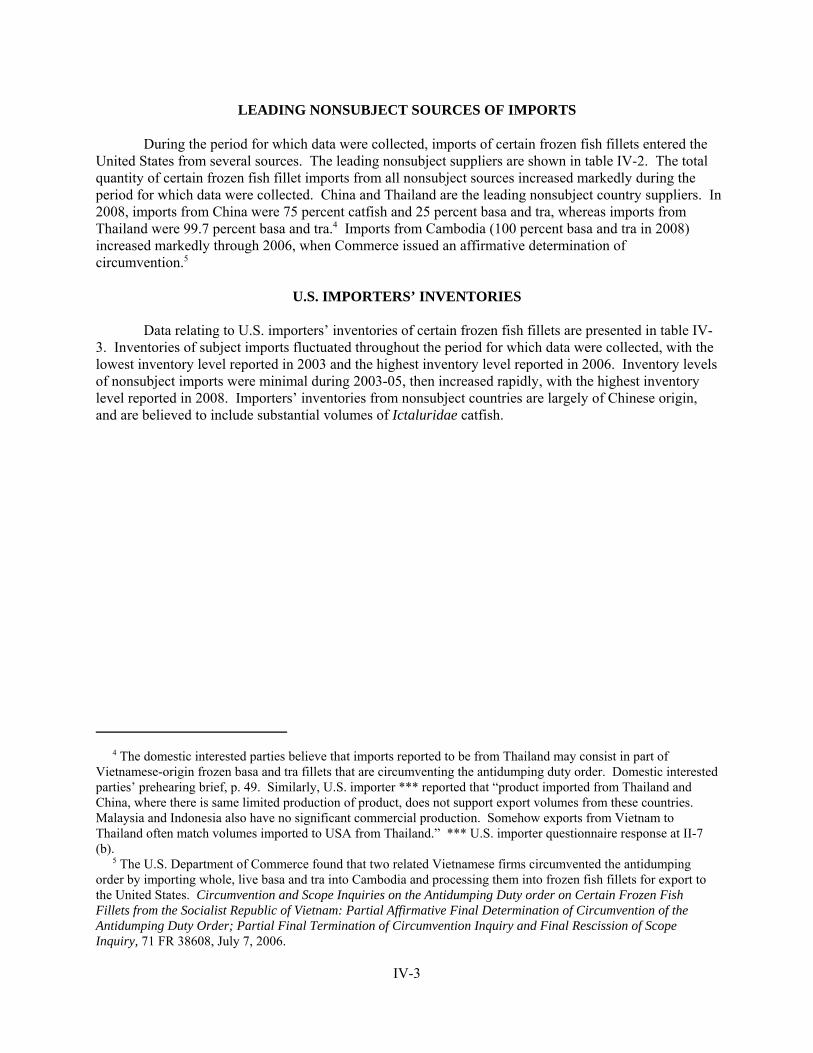
4 The domestic interested parties believe that imports reported to be from Thailand may consist in part ofVietnamese-origin frozen basa and tra fillets that are circumventing the antidumping duty order. Domestic interestedparties’ prehearing brief, p. 49. Similarly, U.S. importer *** reported that “product imported from Thailand andChina, where there is same limited production of product, does not support export volumes from these countries. Malaysia and Indonesia also have no significant commercial production. Somehow exports from Vietnam toThailand often match volumes imported to USA from Thailand.” *** U.S. importer questionnaire response at II-7(b). 5 The U.S. Department of Commerce found that two related Vietnamese firms circumvented the antidumpingorder by importing whole, live basa and tra into Cambodia and processing them into frozen fish fillets for export tothe United States. Circumvention and Scope Inquiries on the Antidumping Duty order on Certain Frozen FishFillets from the Socialist Republic of Vietnam: Partial Affirmative Final Determination of Circumvention of theAntidumping Duty Order; Partial Final Termination of Circumvention Inquiry and Final Rescission of ScopeInquiry, 71 FR 38608, July 7, 2006.
IV-3
LEADING NONSUBJECT SOURCES OF IMPORTS
During the period for which data were collected, imports of certain frozen fish fillets entered theUnited States from several sources. The leading nonsubject suppliers are shown in table IV-2. The totalquantity of certain frozen fish fillet imports from all nonsubject sources increased markedly during theperiod for which data were collected. China and Thailand are the leading nonsubject country suppliers. In2008, imports from China were 75 percent catfish and 25 percent basa and tra, whereas imports fromThailand were 99.7 percent basa and tra.4 Imports from Cambodia (100 percent basa and tra in 2008)increased markedly through 2006, when Commerce issued an affirmative determination ofcircumvention.5
U.S. IMPORTERS’ INVENTORIES
Data relating to U.S. importers’ inventories of certain frozen fish fillets are presented in table IV-3. Inventories of subject imports fluctuated throughout the period for which data were collected, with thelowest inventory level reported in 2003 and the highest inventory level reported in 2006. Inventory levelsof nonsubject imports were minimal during 2003-05, then increased rapidly, with the highest inventorylevel reported in 2008. Importers’ inventories from nonsubject countries are largely of Chinese origin,and are believed to include substantial volumes of Ictaluridae catfish.

IV-4
Table IV-2Certain frozen fish fillets: U.S. imports from leading nonsubject sources, 2003-08
Item
Calendar year
2003 2004 2005 2006 2007 2008
Quantity (1,000 pounds)
Cambodia 0 437 1,005 2,033 2,350 2,126
China 719 1,679 3,344 14,593 21,420 27,542
Indonesia 0 0 58 1,196 1,832 1,552
Malaysia 16 0 426 4,769 904 145
Thailand1 47 5 3,252 7,525 12,332 12,338
All others2 394 377 878 754 1,025 426
Totalnonsubject 1,176 2,499 8,962 30,870 39,863 44,129
Value (1,000 dollars)3
Cambodia 0 767 1,561 3,713 4,329 3,470
China 1,265 2,879 6,109 27,214 38,978 50,687
Indonesia 0 0 94 2,255 3,396 2,907
Malaysia 14 0 551 6,858 1,416 204
Thailand1 41 5 4,102 12,675 20,199 18,729
All others2 454 518 1,270 1,443 3,804 1,826
Totalnonsubject 1,775 4,169 13,686 54,159 72,121 77,823
Unit value (per pound)
Cambodia (3) $1.75 $1.55 $1.83 $1.84 $1.63
China $1.76 1.71 1.83 1.86 1.82 1.84
Indonesia (3) (3) 1.61 1.89 1.85 1.87
Malaysia 0.86 (3) 1.29 1.44 1.57 1.41
Thailand1 0.88 0.99 1.26 1.68 1.64 1.52
All others2 1.15 1.37 1.45 1.92 3.71 4.28
Totalnonsubject 1.51 1.67 1.53 1.75 1.81 1.76
1 The domestic interested parties and U.S. importer *** questioned whether imports from Thailand are in part Vietnamese-origin frozen fish fillets. Domestic interested parties’ prehearing brief, p. 49, and *** U.S. importer questionnaire, II-7(b). 2 All others includes Australia, Bangladesh, Brazil, Canada, Chile, Guyana, Hong Kong, India, Mexico, Singapore, Spain,Taiwan. 3 Landed, duty-paid. Source: Compiled from official Commerce statistics.
6 Aquaculture is the farming of freshwater and saltwater organisms under controlled conditions. 7 Information in this section is adapted from the United Nation Food and Agriculture Organization’s NationalAquaculture Sector Overview. Viet Nam. Text by Nguyen, T.P. & Truong, H.M. FAO Fisheries and AquacultureDepartment. Rome. Updated 10 October 2005. http://www.fao.org/fishery/countrysector/naso_vietnam/en.
IV-5
Table IV-3Certain frozen fish fillets: U.S. importers’ end-of-period inventories of imports, by source, 2003-08
Item
Calendar year
2003 2004 2005 2006 2007 2008
Imports from Vietnam:
Inventories (1,000 pounds) *** *** *** *** *** ***
Ratio to imports (percent) *** *** *** *** *** ***
Ratio to U.S. shipments of imports (percent) *** *** *** *** *** ***
Ratio to total import shipments (percent) *** *** *** *** *** ***
Imports from all other sources:
Inventories (1,000 pounds) *** *** *** *** *** ***
Ratio to imports (percent) *** *** *** *** *** ***
Ratio to U.S. shipments of imports (percent) *** *** *** *** *** ***
Ratio to total import shipments (percent) *** *** *** *** *** ***
Imports from all sources:
Inventories (1,000 pounds) 39 1,457 2,118 7,466 4,798 5,377
Ratio to imports (percent) 4.7 25.1 25.1 27.7 15.0 10.9
Ratio to U.S. shipments of imports (percent) 4.9 31.8 28.8 35.0 14.3 11.3
Ratio to total import shipments (percent) 4.9 31.8 28.8 34.6 14.1 11.3
Source: Compiled from data submitted in response to Commission questionnaires.
THE INDUSTRY IN VIETNAM
Overview
Growth in the Vietnamese aquaculture sector6 has been rapid in the last two decades owing to thediversification of farming practices and the intense adaptation to the production of species for export.7 After Vietnamese reunification, the fisheries sector was identified as a key economic sector for the nationfor its importance in domestic food production. In the 1980s, buoyed by rapid export growth, the sector,mainly aquaculture, grew further. Owing to the wide range of geographical and climatic conditionsthroughout the country, different species are farmed in different regions. Shrimp and basa and tra are thelargest aquaculture products produced in Vietnam; they are raised primarily in the south in the MekongRiver Delta. Total aquaculture production was 1.15 million metric tons (2.535 billion pounds) on902,900 hectares in 2004. Aquaculture production accounted for 60 percent of the $2.397 billion inexport earnings from the fisheries sector in 2004.
8 Aquaculture share of total fisheries production increased from 31.2 percent in 1991 to 43.8 percent in 2003,according to FAO. 9 Information in this section is adapted from the United Nation Food and Agriculture Organization’s NationalAquaculture Sector Overview. Viet Nam. Text by Nguyen, T.P. & Truong, H.M. FAO Fisheries and AquacultureDepartment. Rome. Updated 10 October 2005. http://www.fao.org/fishery/countrysector/naso_vietnam/en. 10 UN, FAO, FishStat database, 2007. 11 In VASEP’s response to the notice of institution, it reported its members’ 2007 production of certain frozen fishfillets was *** pounds. VASEP’s response to the notice of institution, p. 3. These data only covered VASEP’sreporting members during the response to the notice of institution (which were a smaller subset than in later VASEPsubmissions). These data are substantially understated compared to export data submitted by VASEP during thereview and compared to the domestic interested parties’ estimate of Vietnamese production of certain frozen fishfillets. 12 UN FAO, National Aquaculture Sector Overview. Viet Nam. Text by Nguyen, T.P. & Truong, H.M. In: FAOFisheries and Aquaculture Department. Rome. Updated 10 October 2005.http://www.fao.org/fishery/countrysector/naso_vietnam/en.
IV-6
Reports indicate that Vietnamese aquaculture production is likely to continue its upward trend8
and both domestic and export markets will expand to absorb the production increases. Internationalobservers note that the challenges the Vietnamese industry faces moving forward include the increasinginternational demand for high quality, safe and clean aquatic products and the need to regulate a rapidlyexpanding sector faced with meeting international safety and quality standards, securing sufficient highquality seed, a lack of capital for infrastructure investment, poorly educated farmers, and the lack ofskilled workers.9
Basa and Tra Operations in Vietnam
Production of basa (Pangasius hypophthalmus) and tra (Pangasius bocourti) is one of Vietnam’smost developed aquaculture sectors along with the giant tiger prawn (Penaeus monodon). Typical culturesystems of the south for basa and tra production include pond, fence, and cage culture in high densities infreshwater. Basa and tra production grew from 114,000 metric tons (251 million pounds), valued at $171million, in 2001 to 850,000 metric tons (1.873 billion pounds), valued at $1.3 billion, in 2007 (table IV-4).10 11 From 2001 to 2005, area under production grew from just over 2,000 ha to just over 4,000 ha. Yields of over 100 kg/m3/crop from cage farming; 183-582 tons/ha/crop in pond farming (depending onthe stocking density); and 35 tons/ha/crop from fence farming have been reported.12
Table IV-4Basa and tra: Vietnamese production of basa and tra, 1997-2007
Item 1997 1998 1999 2000 2001 2002 2003 2004 2005 2006 2007
Volume(1,000 lb)
88,185 132,277 191,802 220,462 251,327 297,624 359,353 496,040 828,938 1,146,403 1,873,929
Value($1,000)
64,000 96,000 121,800 140,000 171,000 202,500 244,500 382,500 564,000 780,000 1,275,000
Source: Global Aquaculture Production, FAOStat database.
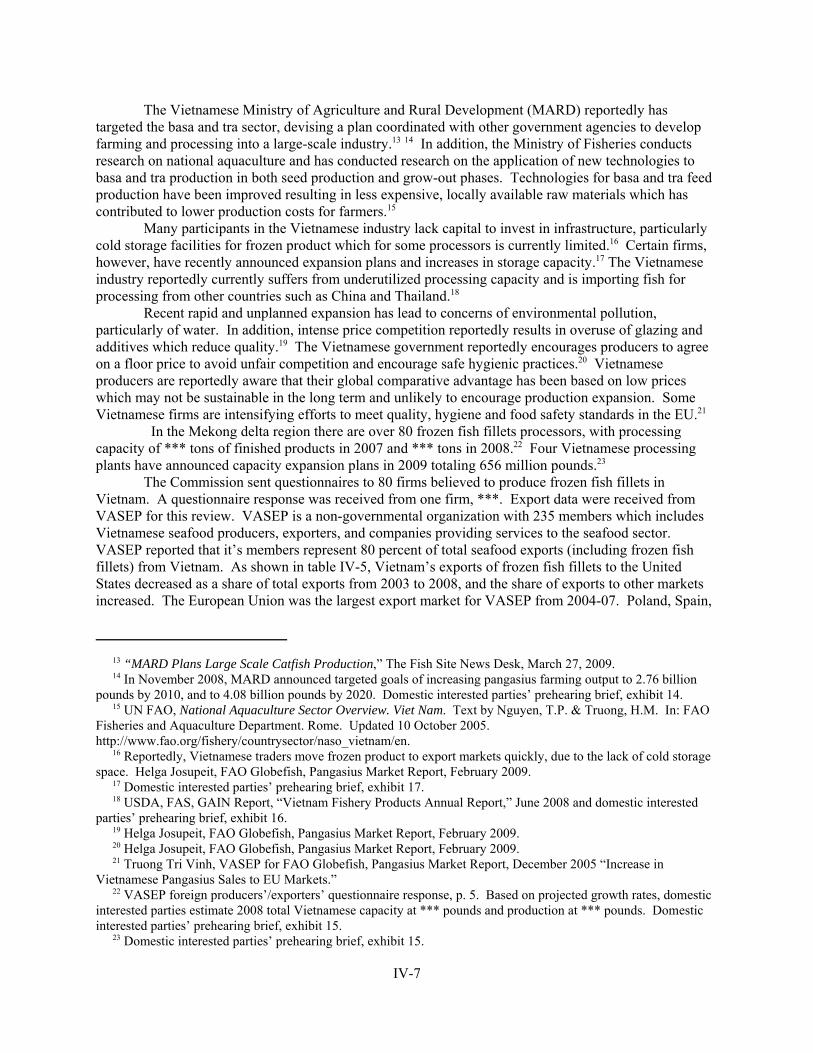
13 “MARD Plans Large Scale Catfish Production,” The Fish Site News Desk, March 27, 2009. 14 In November 2008, MARD announced targeted goals of increasing pangasius farming output to 2.76 billionpounds by 2010, and to 4.08 billion pounds by 2020. Domestic interested parties’ prehearing brief, exhibit 14. 15 UN FAO, National Aquaculture Sector Overview. Viet Nam. Text by Nguyen, T.P. & Truong, H.M. In: FAOFisheries and Aquaculture Department. Rome. Updated 10 October 2005.http://www.fao.org/fishery/countrysector/naso_vietnam/en. 16 Reportedly, Vietnamese traders move frozen product to export markets quickly, due to the lack of cold storagespace. Helga Josupeit, FAO Globefish, Pangasius Market Report, February 2009. 17 Domestic interested parties’ prehearing brief, exhibit 17. 18 USDA, FAS, GAIN Report, “Vietnam Fishery Products Annual Report,” June 2008 and domestic interestedparties’ prehearing brief, exhibit 16. 19 Helga Josupeit, FAO Globefish, Pangasius Market Report, February 2009. 20 Helga Josupeit, FAO Globefish, Pangasius Market Report, February 2009. 21 Truong Tri Vinh, VASEP for FAO Globefish, Pangasius Market Report, December 2005 “Increase inVietnamese Pangasius Sales to EU Markets.” 22 VASEP foreign producers’/exporters’ questionnaire response, p. 5. Based on projected growth rates, domesticinterested parties estimate 2008 total Vietnamese capacity at *** pounds and production at *** pounds. Domesticinterested parties’ prehearing brief, exhibit 15. 23 Domestic interested parties’ prehearing brief, exhibit 15.
IV-7
The Vietnamese Ministry of Agriculture and Rural Development (MARD) reportedly hastargeted the basa and tra sector, devising a plan coordinated with other government agencies to developfarming and processing into a large-scale industry.13 14 In addition, the Ministry of Fisheries conductsresearch on national aquaculture and has conducted research on the application of new technologies tobasa and tra production in both seed production and grow-out phases. Technologies for basa and tra feedproduction have been improved resulting in less expensive, locally available raw materials which hascontributed to lower production costs for farmers.15
Many participants in the Vietnamese industry lack capital to invest in infrastructure, particularlycold storage facilities for frozen product which for some processors is currently limited.16 Certain firms,however, have recently announced expansion plans and increases in storage capacity.17 The Vietnameseindustry reportedly currently suffers from underutilized processing capacity and is importing fish forprocessing from other countries such as China and Thailand.18
Recent rapid and unplanned expansion has lead to concerns of environmental pollution,particularly of water. In addition, intense price competition reportedly results in overuse of glazing andadditives which reduce quality.19 The Vietnamese government reportedly encourages producers to agreeon a floor price to avoid unfair competition and encourage safe hygienic practices.20 Vietnameseproducers are reportedly aware that their global comparative advantage has been based on low priceswhich may not be sustainable in the long term and unlikely to encourage production expansion. SomeVietnamese firms are intensifying efforts to meet quality, hygiene and food safety standards in the EU.21
In the Mekong delta region there are over 80 frozen fish fillets processors, with processingcapacity of *** tons of finished products in 2007 and *** tons in 2008.22 Four Vietnamese processingplants have announced capacity expansion plans in 2009 totaling 656 million pounds.23
The Commission sent questionnaires to 80 firms believed to produce frozen fish fillets inVietnam. A questionnaire response was received from one firm, ***. Export data were received fromVASEP for this review. VASEP is a non-governmental organization with 235 members which includesVietnamese seafood producers, exporters, and companies providing services to the seafood sector. VASEP reported that it’s members represent 80 percent of total seafood exports (including frozen fishfillets) from Vietnam. As shown in table IV-5, Vietnam’s exports of frozen fish fillets to the UnitedStates decreased as a share of total exports from 2003 to 2008, and the share of exports to other marketsincreased. The European Union was the largest export market for VASEP from 2004-07. Poland, Spain,
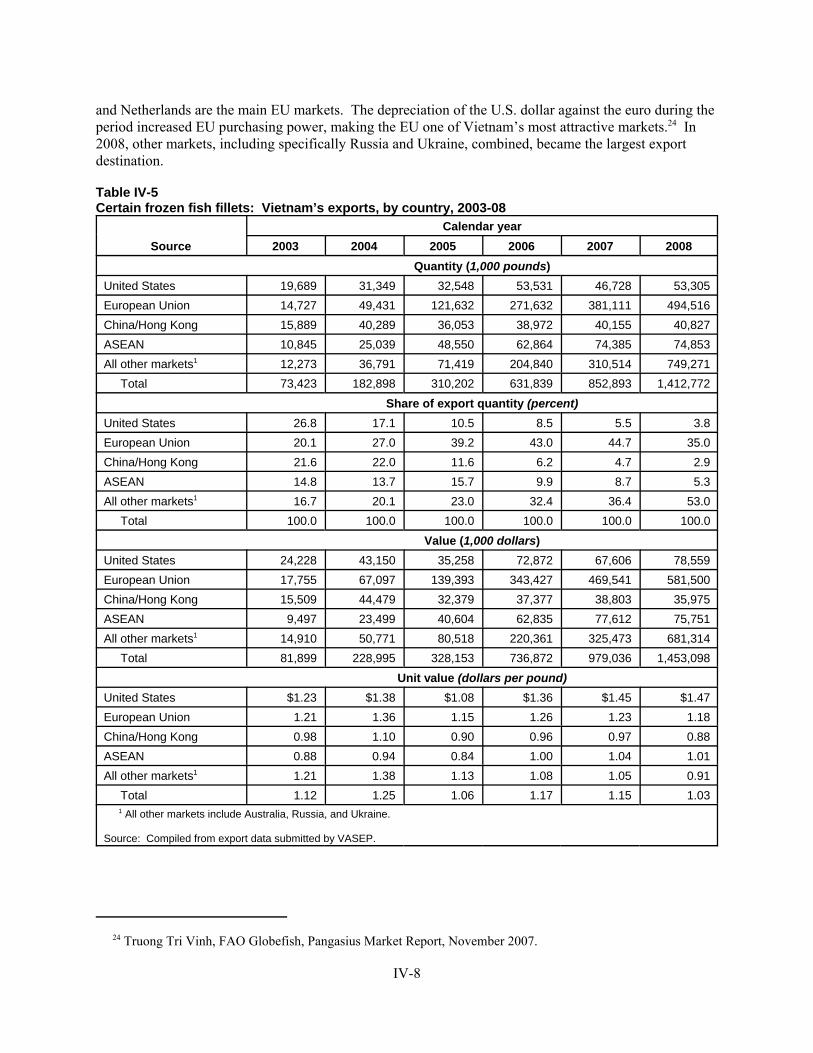
24 Truong Tri Vinh, FAO Globefish, Pangasius Market Report, November 2007.
IV-8
and Netherlands are the main EU markets. The depreciation of the U.S. dollar against the euro during theperiod increased EU purchasing power, making the EU one of Vietnam’s most attractive markets.24 In2008, other markets, including specifically Russia and Ukraine, combined, became the largest exportdestination.
Table IV-5Certain frozen fish fillets: Vietnam’s exports, by country, 2003-08
SourceCalendar year
2003 2004 2005 2006 2007 2008Quantity (1,000 pounds)
United States 19,689 31,349 32,548 53,531 46,728 53,305European Union 14,727 49,431 121,632 271,632 381,111 494,516China/Hong Kong 15,889 40,289 36,053 38,972 40,155 40,827ASEAN 10,845 25,039 48,550 62,864 74,385 74,853All other markets1 12,273 36,791 71,419 204,840 310,514 749,271 Total 73,423 182,898 310,202 631,839 852,893 1,412,772
Share of export quantity (percent)United States 26.8 17.1 10.5 8.5 5.5 3.8European Union 20.1 27.0 39.2 43.0 44.7 35.0China/Hong Kong 21.6 22.0 11.6 6.2 4.7 2.9ASEAN 14.8 13.7 15.7 9.9 8.7 5.3All other markets1 16.7 20.1 23.0 32.4 36.4 53.0 Total 100.0 100.0 100.0 100.0 100.0 100.0
Value (1,000 dollars)United States 24,228 43,150 35,258 72,872 67,606 78,559European Union 17,755 67,097 139,393 343,427 469,541 581,500China/Hong Kong 15,509 44,479 32,379 37,377 38,803 35,975ASEAN 9,497 23,499 40,604 62,835 77,612 75,751All other markets1 14,910 50,771 80,518 220,361 325,473 681,314 Total 81,899 228,995 328,153 736,872 979,036 1,453,098
Unit value (dollars per pound)United States $1.23 $1.38 $1.08 $1.36 $1.45 $1.47European Union 1.21 1.36 1.15 1.26 1.23 1.18China/Hong Kong 0.98 1.10 0.90 0.96 0.97 0.88ASEAN 0.88 0.94 0.84 1.00 1.04 1.01All other markets1 1.21 1.38 1.13 1.08 1.05 0.91 Total 1.12 1.25 1.06 1.17 1.15 1.03 1 All other markets include Australia, Russia, and Ukraine.
Source: Compiled from export data submitted by VASEP.
25 Gerry O’Sullivan, FAO Globefish, Pangasius Market Report, July 2006. 26 Nick Holmyard, FAO Globefish, Pangasius Market Report, November 2008. 27 Domestic interested parties’ posthearing brief, exhibit 1, p. 40. 28 Helga Josupeit and Nicole Franz, “Aquaculture - Trade, Trends, Standards and Outlooks,” FAO FisheriesDepartment, January 2004 (ppt). 29 Helga Josupeit and Nicole Franz, “Aquaculture - Trade, Trends, Standards and Outlooks,” FAO FisheriesDepartment, January 2004 (ppt). 30 Developed countries’ share of global aquaculture production was 9 percent in 2001. 31 “Global Fish Trade Overview,” EUROFISH FAO Workshop, Split, Croatia, May 2007. 32 Some of the hazards associated with aquaculture include: pollution contaminating pond and tank water,contaminated feeds, abuse of veterinary drugs, and parasites in freshwater fish.
IV-9
Despite the initial decline in exports to the United States, total Vietnamese exports grew steadilyas increasingly more product was shipped to the EU. This expansion into the EU market reportedly isowed to increasing penetration among European grocery chains, where retail promotional activitiesmoved basa and tra from marginal to mainstream status.25 In the EU, Vietnamese basa and tra areconsidered less expensive alternatives to white fish, which is increasingly expensive in the EU due toreduced landings and quota policies. EU firms import frozen basa and tra fillets and perform their ownvalue-added operations.26
In 2006, Russian imports of Vietnamese basa and tra increased considerably. However, inDecember 2008, Russia banned all pangasius imports from Vietnam following the discovery of somecontaminated products. Although the ban was recently partially lifted, only 10 Vietnamese processingplants are authorized to export to Russia.27 In 2007 and 2008, Vietnamese exports to the United Statesrebounded, despite the antidumping order. In 2008, Polish imports of Vietnamese basa and tra droppedoff while Russian and Ukrainian imports grew rapidly along with smaller, developing markets such asEgypt and Mexico.
GLOBAL MARKET
Global aquaculture production reached nearly 48.4 million metric tons (106.7 billion pounds) in2001, up from 11.3 million tons (24.9 billion pounds) in 1985.28 Trends indicate that capture capacity formany species has reached its limit, making aquaculture production more important in supplying growingglobal demand for fish and fish products, which is predicted to grow by more than 50 percent by 2030.29
The global share of aquaculture production accounted for by developed countries is low.30 Growth in thesector has been almost entirely from developing countries, for whom export revenues of aquaculturespecies are crucial components of GDP. In 2005, China accounted for 67 percent of global aquacultureproduction, followed by India (6 percent), and Vietnam (3 percent).31 Much of current production indeveloping countries is relatively immature and commonly accepted global rules, particularly with regardto production practices and food safety, have not been developed.32
33 FAO. © 2006-2009. National Aquaculture Sector Overview. China. Text by Shuping, C. In: FAO Fisheriesand Aquaculture Department. Rome. Updated 1 February 2005.http://www.fao.org/fishery/countrysector/naso_china/en. 34 Helga Josupeit, FAO Globefish, Catfish Market Report, December 2007. 35 FAO Globefish, Catfish Market Report, January 2008. 36 Information in this section is drawn largely from FAO. 8 2006-2009. National Aquaculture Sector Overview.Thailand. Text by Pongsri, C. and Sukumasavin, N. In: FAO Fisheries and Aquaculture Department. Rome.Updated 1 February 2005. http://www.fao.org/fishery/countrysector/naso_thailand/en. 37 Thai aquaculture production began to grow rapidly beginning in the late 1980s, from just over 200,000 metrictons (441 million pounds) in 1988 to 1.39 million metric tons (3.1 billion pounds) in 2007.
IV-10
Supply Considerations
Vietnam is by far the largest global producer of basa and tra. Other major producers of catfishare the United States and China. The main exporters of catfish (regardless of species) are Vietnam, China,Thailand, Malaysia, and some Sub-Saharan African countries, including Tanzania.
China has a long history of aquaculture and in the last several decades it has become one of thecountry’s fastest growing agriculture sectors. The industry originally focused on carp production andalthough it has expanded into other species, carp currently accounts for almost three-quarters of Chinesefreshwater aquaculture production. In 2003, total aquaculture production was 30.28 million metric tons(66.8 billion pounds) covering 7,104 million hectares.33 This production mainly serves China’s domesticmarket, as less than 5 percent of Chinese aquaculture production is processed for export. Nonetheless,China is a major exporter of fish products, mainly frozen shrimp (mainly to the United States), baked eel(to Japan), and frozen tilapia fillets (to the United States).
Various species, including the species of catfish grown in the United States (Ictalurus), have beenintroduced in China from abroad for commercial cultivation. Chinese catfish production in 2006 was120,000 metric tons (265 million pounds).34 Chinese catfish production takes place in over 20 provincesin pond culture, cage culture and running water culture. Catfish for export is mainly produced by cageculture.35
Aquaculture production in Thailand in 2007 was 1.39 million metric tons (3.1 billion pounds) andaccounted for about one-quarter of fisheries production.36 In 2002, total aquaculture productioncontributed 2.07 percent of total GDP.37 Freshwater aquaculture accounts for about one-third of totalaquaculture production and is mainly for domestic consumption and marketed as fresh products. Themain fresh water species grown are Nile tilapia (Oreochromis niloticus) hybrid catfish (Clariasmacrocephalus X C. Gariepinus), and silver barb (Barbodes gonionotus). Catfish (Clarias sp.)production in 2003 was 86,475 metric tons (190.6 million pounds), or 30 percent of total freshwateraquaculture production. Although this species of catfish is preferred by growers because it grows fasterthan native species, the production per unit has been decreasing in recent times, possibly due to thequality of the original male stock introduced for cultivation. A Sutchi catfish (Pangasianodonhypophthalmus) is also produced in Thailand, accounting for 5 percent of total freshwater aquacultureproduction in 2003. Saltwater aquaculture production in Thailand, particularly barramundi (Latescalcarifer), grouper (Epinephalus sp.), and shellfish (mussels, shrimp, and prawn), is higher value thanfreshwater and is mainly for export.
38 Gerry O’Sullivan, FAO Globefish, Pangasius Market Report, July 2006. 39 Truong Tri Vinh, FAO Globefish, Pangasius Market Report, November 2007. 40 Helga Josupeit and Nicole Franz, “Aquaculture - Trade, trends, Standards and Outlooks,” FAO FisheriesDepartment, January 2004 (ppt). 41 FAO. © 2006-2009. National Aquaculture Sector Overview. China. Text by Shuping, C. In: FAO Fisheriesand Aquaculture Department. Rome. Updated 1 February 2005.Http://www.fao.org/fishery/countrysector/naso_china/en. 42 FAO. © 2006-2009. National Aquaculture Sector Overview. China. Text by Shuping, C. In: FAO Fisheriesand Aquaculture Department. Rome. Updated 1 February 2005.Http://www.fao.org/fishery/countrysector/naso_china/en. 43 FAO Globefish, Pangasius Market Report, May 2007. 44 Truong Tri Vinh, FAO Globefish, Pangasius Market Report, November 2007. 45 U.S. Food and Drug Administration, “FDA Detains Imports of Farm-Raised Chinese Seafood,” Press Release,June 28, 2007. 46 Helga Josupeit, FAO Globefish, Catfish Market Report, December 2007. 47 FAO Globefish, Catfish Market Report, January 2008. 48 U.S. producer, importer, and purchaser questionnaire responses, sections IV-15b and 16b, III-20b and 21b, andIII-11b and III-12b, respectively.
IV-11
Demand Considerations
The growing global demand for white fish can be attributed to consumer interest in the healthbenefits of fish and food safety issues surrounding beef and poultry (i.e., BSE and Avian flu outbreaks).Static or declining supplies of traditional white fish species has increased market interest in pricecompetitive aquaculture products.38 Vietnam is the major exporter of basa and tra to global markets.Vietnam’s competitive advantage in basa and tra production comes from favorable natural growingconditions and low labor costs, however similar conditions in China have led to strong competition,particularly in the EU market.39 However, frozen fish fillets from both Vietnam and China have facedchallenges in their growing markets, particularly in the United States and Russia (Vietnam) and in the EUand the United States (China).
In 2001, the EU issued a regulation on fish labeling and traceability in order to protect theconsumer.40 The EU was closed to Chinese aquaculture products from January 2002 to July 2004 whenresidues were found on imported Chinese fish products.41 At the end of 2002, the Chinese governmentimplemented a voluntary program to guide its aquaculture production in a sustainable, responsible andhealthy way.42
In October 2006, the Russian Federal Veterinary and Phytosanitary Surveillance Service (VPSS)adopted new regulations for food safety inspections of Vietnamese basa and tra at the border. Shipmentshad been found without proper documentation for approved processing plants by Russian inspectors.43
This resulted in reduced shipments to Russia.44 Increased exports to the Ukraine made up for the Russiandecline.
In June 2007 the U.S. Food and Drug Administration began to detain imports of Chinese farm-raised seafood products when samples were found to contain chemical residues.45 A protocol forinspection and control for Chinese food products, including cultured seafood like catfish, was reached inthe end of 2007 and U.S. imports of Chinese catfish began to increase again.46 Chinese exporters mustobtain an exemption on export restrictions by “requalifying within HACCP system.”47
U.S. processors, U.S. importers, and U.S. purchasers of certain frozen fish fillets were requestedin their questionnaire responses to comment on demand for certain frozen fish fillets outside of the UnitedStates since January 1, 2003 and anticipated in the future.48 Useable responses are summarized in thefollowing tabulation.
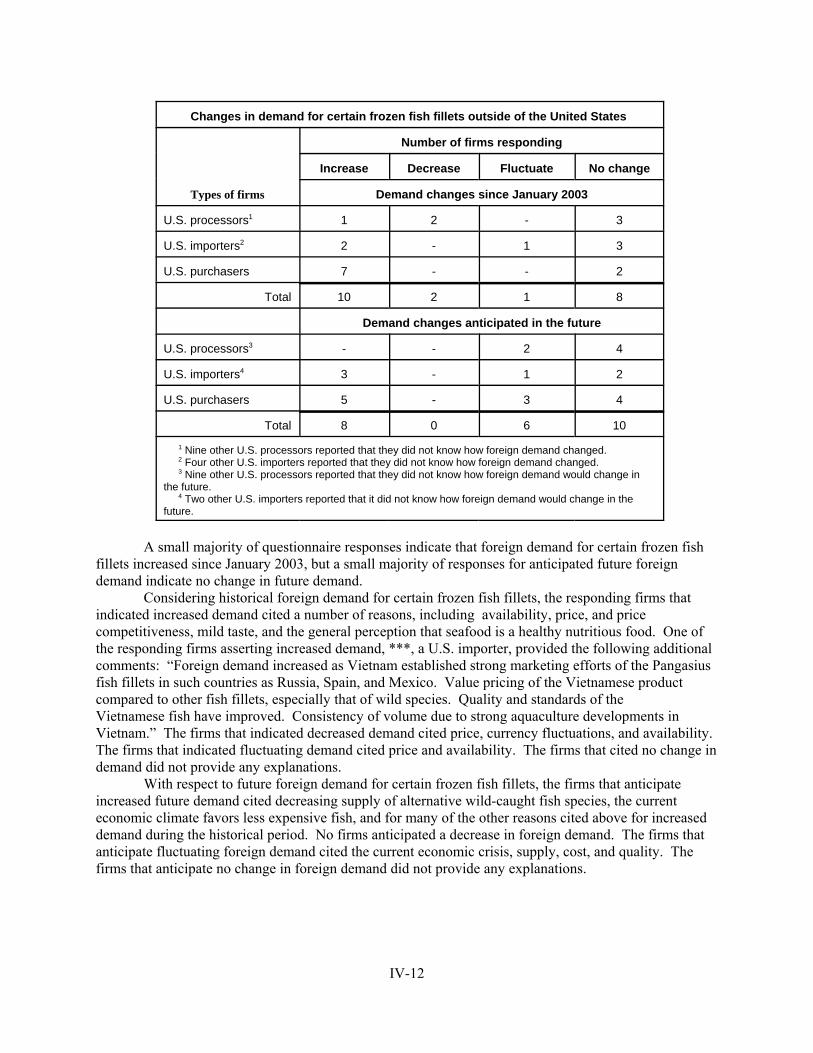
IV-12
Changes in demand for certain frozen fish fillets outside of the United States
Types of firms
Number of firms responding
Increase Decrease Fluctuate No change
Demand changes since January 2003
U.S. processors1 1 2 - 3
U.S. importers2 2 - 1 3
U.S. purchasers 7 - - 2
Total 10 2 1 8
Demand changes anticipated in the future
U.S. processors3 - - 2 4
U.S. importers4 3 - 1 2
U.S. purchasers 5 - 3 4
Total 8 0 6 10
1 Nine other U.S. processors reported that they did not know how foreign demand changed. 2 Four other U.S. importers reported that they did not know how foreign demand changed. 3 Nine other U.S. processors reported that they did not know how foreign demand would change inthe future. 4 Two other U.S. importers reported that it did not know how foreign demand would change in thefuture.
A small majority of questionnaire responses indicate that foreign demand for certain frozen fishfillets increased since January 2003, but a small majority of responses for anticipated future foreigndemand indicate no change in future demand.
Considering historical foreign demand for certain frozen fish fillets, the responding firms thatindicated increased demand cited a number of reasons, including availability, price, and pricecompetitiveness, mild taste, and the general perception that seafood is a healthy nutritious food. One ofthe responding firms asserting increased demand, ***, a U.S. importer, provided the following additionalcomments: “Foreign demand increased as Vietnam established strong marketing efforts of the Pangasiusfish fillets in such countries as Russia, Spain, and Mexico. Value pricing of the Vietnamese productcompared to other fish fillets, especially that of wild species. Quality and standards of the Vietnamese fish have improved. Consistency of volume due to strong aquaculture developments inVietnam.” The firms that indicated decreased demand cited price, currency fluctuations, and availability.The firms that indicated fluctuating demand cited price and availability. The firms that cited no change indemand did not provide any explanations.
With respect to future foreign demand for certain frozen fish fillets, the firms that anticipateincreased future demand cited decreasing supply of alternative wild-caught fish species, the currenteconomic climate favors less expensive fish, and for many of the other reasons cited above for increaseddemand during the historical period. No firms anticipated a decrease in foreign demand. The firms thatanticipate fluctuating foreign demand cited the current economic crisis, supply, cost, and quality. Thefirms that anticipate no change in foreign demand did not provide any explanations.
49 Truong Tri Vinh, VASEP for FAO Globefish, “Increase in Vietnamese Pangasius Sales to EU Markets,”Pangasius Market Report, December 2005. 50 FAO, Pangasius Market Report, May 2007. 51 Helga Josupeit, FAO Globefish, Catfish Market Report, September 2008. 52 Helga Josupeit, FAO Globefish, Catfish Market Report, September 2008. 53 U.S. producer and importer questionnaire responses, sections IV-20 and III-23, respectively.
IV-13
Prices
Price fluctuations for frozen fish fillets generally reflect global supply and demand conditions.Vietnamese unit values tend to be consistently lower in the EU with respect to other suppliers. In fact, in2005, the low prices for Vietnamese basa and tra were reportedly putting downward pressure on othersubstitute products, such as Nile perch.49 Supply shortages in 2006 caused global prices to riseconsiderably (by 40-50 percent from 2006 to 2007).50 Global prices also increased throughout 2008 dueto scarcity of supplies.51 Nonetheless, wide prices differences exist in various national and regionalmarkets. For example, prices in Russia in 2008 were about $1 per pound below those paid in the EU.52 Such price differences may reflect a variety of factors, including substantial variations in fish size andquality.
U.S. processors and importers of the certain frozen fish fillets were requested in theirquestionnaire responses to compare market prices of these products in the U.S. and non-U.S. markets.53 Fourteen U.S. processors of the frozen catfish fillets and seven U.S. importers of the certain frozen fishfillets, including the frozen basa and tra fillets from Vietnam, responded. However, 13 of the 14responding U.S. processors and four of the seven responding U.S. importers reported that they did nothave such information. The remaining U.S. processor and three U.S. importers provided some comments. ***, asserted that “prices vary by market due to freight differences and competitive offerings bothdomestically and imported.” Two of the three U.S. importers, ***, indicated that prices in the U.S.market were higher, and *** specifically attributed the higher prices to the antidumping duty order. Theremaining importer providing comments, ***, asserted that “certain frozen fish fillets are a globalcommodity. When unencumbered by duties, the U.S. market competes evenly for purchases, but whensubject to duties, competing markets have a significant advantage.”

1 Part II discusses in detail substitution between certain frozen fish fillets and alternative products andsubstitution between the U.S.-produced frozen catfish fillets and imports of the certain frozen fish fillets fromnonsubject countries. 2 U.S. producer questionnaire responses, section III-10. 3 Ibid. Most of the raw material consists of live catfish; breading and marinade for the value-added frozen filletsand other incidentals comprise the remainder of raw materials. 4 The quarterly price data were calculated as simple averages of monthly price data reported by the USDA. U.S.processors of frozen catfish fillets typically purchase the live catfish on a spot basis. Staff telephone interview with***. 5 Statistical correlation can quantify the degree to which these selling and purchase prices move together. Afrequent measure of statistical correlation is a linear correlation coefficient, where a coefficient of 1 indicates perfectcorrelation, declining values indicate progressively decreasing correlation, and a correlation coefficient of zeroindicates no correlation between the data series. The correlation coefficients between quarterly selling prices of thefrozen catfish fillet products and the purchase prices of live catfish ranged from 0.87 involving product 4 to 0.98involving product 2 during January 2003-December 2008.
V-1
PART V: PRICING AND RELATED INFORMATION
FACTORS AFFECTING PRICING
U.S. prices of certain frozen fish fillets can fluctuate based on demand factors such as overallU.S. economic activity, seasonal U.S. demand, and sectoral demand, particularly in restaurant and grocerystore retailing. On the supply side, prices of certain frozen fish fillets fluctuate based on the cost of thelive fish, which in turn, is affected substantially by the cost of feed; prices may also fluctuate due toseasonal domestic supply factors and due to a number of product specifications, including, but notrestricted to, the size of the fillets, whether regular, shank, or strip fillets, and whether plain, breaded, ormarinated. In addition, the prices of certain frozen fish fillets can fluctuate due to quantities contractedand the relative bargaining strength between purchasers and suppliers. U.S. prices of certain frozen fishfillets may also be affected by prices of alternative fish products, including certain fresh fish fillets.1
Raw Material Costs
Total raw materials used to process frozen catfish fillets averaged 72.9 percent of U.S.processors’ total cost of goods sold during 2003-08.2 The primary raw material used to process domesticfrozen catfish fillets is U.S. live farm-raised catfish. U.S. processors reported that the cost of live catfishaveraged 71.9 percent of the cost of goods sold of their frozen catfish fillets during 2003-08.3
Quarterly prices and quantities of U.S. live farm-raised catfish shipped to U.S. processors offrozen catfish fillets during January 2003-December 2008 are shown in figure V-1.4 Quarterly shipmentprices of live catfish fluctuated but generally increased during this period, while quantities fluctuated butgenerally decreased. From a period low of $0.55 per pound during January-March 2003, live catfishprices increased to a period high of almost $0.84 per pound during January-March 2007, then fluctuatedbut ended at $0.82 per pound by October-December 2008, for an increase of 49.1 percent over the entireperiod. As seen in tables V-1 through V-4 and figure V-1, the U.S. processors’ quarterly selling prices ofthe specified frozen catfish fillet products and their quarterly purchase prices of live catfish trendedclosely together during January 2003-December 2008.5
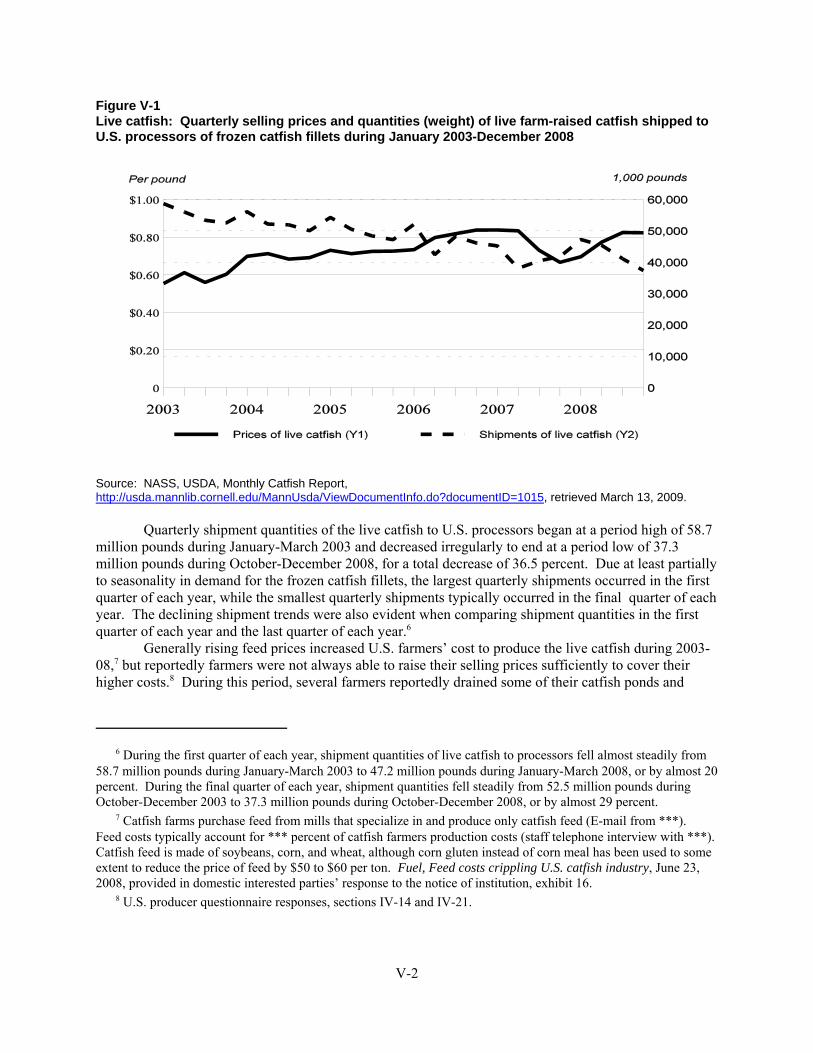
6 During the first quarter of each year, shipment quantities of live catfish to processors fell almost steadily from58.7 million pounds during January-March 2003 to 47.2 million pounds during January-March 2008, or by almost 20percent. During the final quarter of each year, shipment quantities fell steadily from 52.5 million pounds duringOctober-December 2003 to 37.3 million pounds during October-December 2008, or by almost 29 percent. 7 Catfish farms purchase feed from mills that specialize in and produce only catfish feed (E-mail from ***). Feed costs typically account for *** percent of catfish farmers production costs (staff telephone interview with ***). Catfish feed is made of soybeans, corn, and wheat, although corn gluten instead of corn meal has been used to someextent to reduce the price of feed by $50 to $60 per ton. Fuel, Feed costs crippling U.S. catfish industry, June 23,2008, provided in domestic interested parties’ response to the notice of institution, exhibit 16. 8 U.S. producer questionnaire responses, sections IV-14 and IV-21.
V-2
Figure V-1Live catfish: Quarterly selling prices and quantities (weight) of live farm-raised catfish shipped toU.S. processors of frozen catfish fillets during January 2003-December 2008
Source: NASS, USDA, Monthly Catfish Report, http://usda.mannlib.cornell.edu/MannUsda/ViewDocumentInfo.do?documentID=1015, retrieved March 13, 2009.
Quarterly shipment quantities of the live catfish to U.S. processors began at a period high of 58.7million pounds during January-March 2003 and decreased irregularly to end at a period low of 37.3million pounds during October-December 2008, for a total decrease of 36.5 percent. Due at least partiallyto seasonality in demand for the frozen catfish fillets, the largest quarterly shipments occurred in the firstquarter of each year, while the smallest quarterly shipments typically occurred in the final quarter of eachyear. The declining shipment trends were also evident when comparing shipment quantities in the firstquarter of each year and the last quarter of each year.6
Generally rising feed prices increased U.S. farmers’ cost to produce the live catfish during 2003-08,7 but reportedly farmers were not always able to raise their selling prices sufficiently to cover theirhigher costs.8 During this period, several farmers reportedly drained some of their catfish ponds and
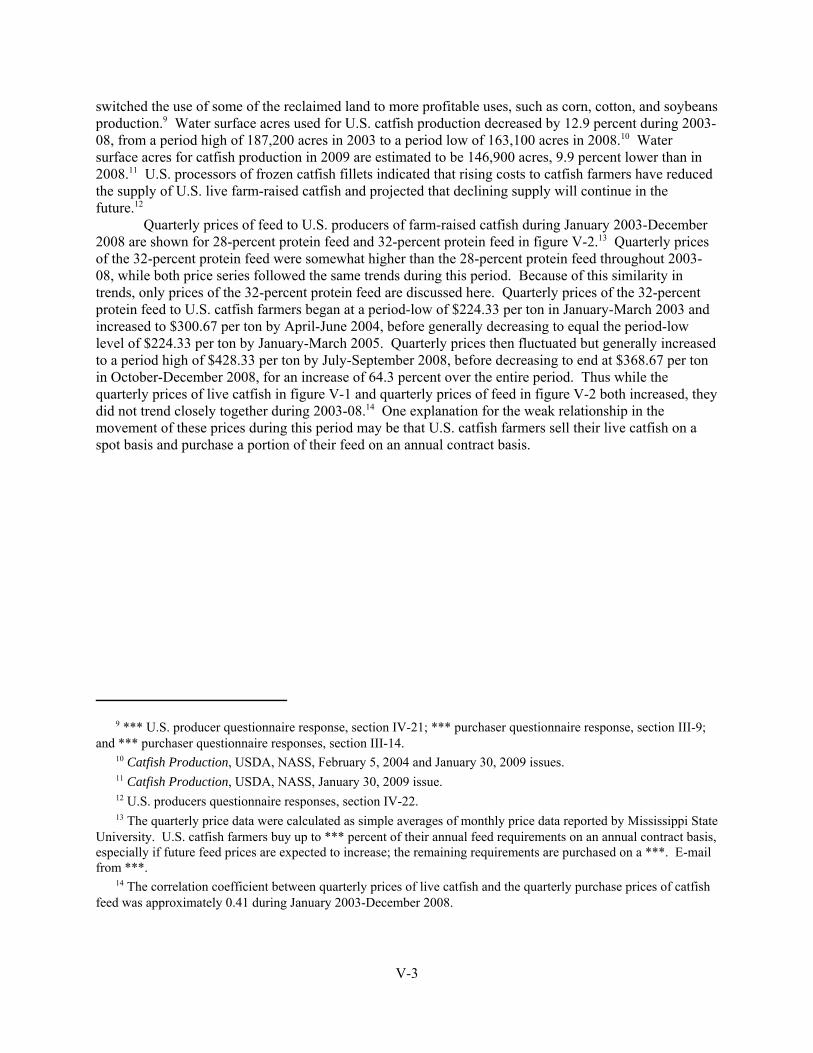
9 *** U.S. producer questionnaire response, section IV-21; *** purchaser questionnaire response, section III-9;and *** purchaser questionnaire responses, section III-14. 10 Catfish Production, USDA, NASS, February 5, 2004 and January 30, 2009 issues. 11 Catfish Production, USDA, NASS, January 30, 2009 issue. 12 U.S. producers questionnaire responses, section IV-22. 13 The quarterly price data were calculated as simple averages of monthly price data reported by Mississippi StateUniversity. U.S. catfish farmers buy up to *** percent of their annual feed requirements on an annual contract basis,especially if future feed prices are expected to increase; the remaining requirements are purchased on a ***. E-mailfrom ***. 14 The correlation coefficient between quarterly prices of live catfish and the quarterly purchase prices of catfishfeed was approximately 0.41 during January 2003-December 2008.
V-3
switched the use of some of the reclaimed land to more profitable uses, such as corn, cotton, and soybeansproduction.9 Water surface acres used for U.S. catfish production decreased by 12.9 percent during 2003-08, from a period high of 187,200 acres in 2003 to a period low of 163,100 acres in 2008.10 Watersurface acres for catfish production in 2009 are estimated to be 146,900 acres, 9.9 percent lower than in2008.11 U.S. processors of frozen catfish fillets indicated that rising costs to catfish farmers have reducedthe supply of U.S. live farm-raised catfish and projected that declining supply will continue in thefuture.12
Quarterly prices of feed to U.S. producers of farm-raised catfish during January 2003-December2008 are shown for 28-percent protein feed and 32-percent protein feed in figure V-2.13 Quarterly pricesof the 32-percent protein feed were somewhat higher than the 28-percent protein feed throughout 2003-08, while both price series followed the same trends during this period. Because of this similarity intrends, only prices of the 32-percent protein feed are discussed here. Quarterly prices of the 32-percentprotein feed to U.S. catfish farmers began at a period-low of $224.33 per ton in January-March 2003 andincreased to $300.67 per ton by April-June 2004, before generally decreasing to equal the period-lowlevel of $224.33 per ton by January-March 2005. Quarterly prices then fluctuated but generally increasedto a period high of $428.33 per ton by July-September 2008, before decreasing to end at $368.67 per tonin October-December 2008, for an increase of 64.3 percent over the entire period. Thus while thequarterly prices of live catfish in figure V-1 and quarterly prices of feed in figure V-2 both increased, theydid not trend closely together during 2003-08.14 One explanation for the weak relationship in themovement of these prices during this period may be that U.S. catfish farmers sell their live catfish on aspot basis and purchase a portion of their feed on an annual contract basis.
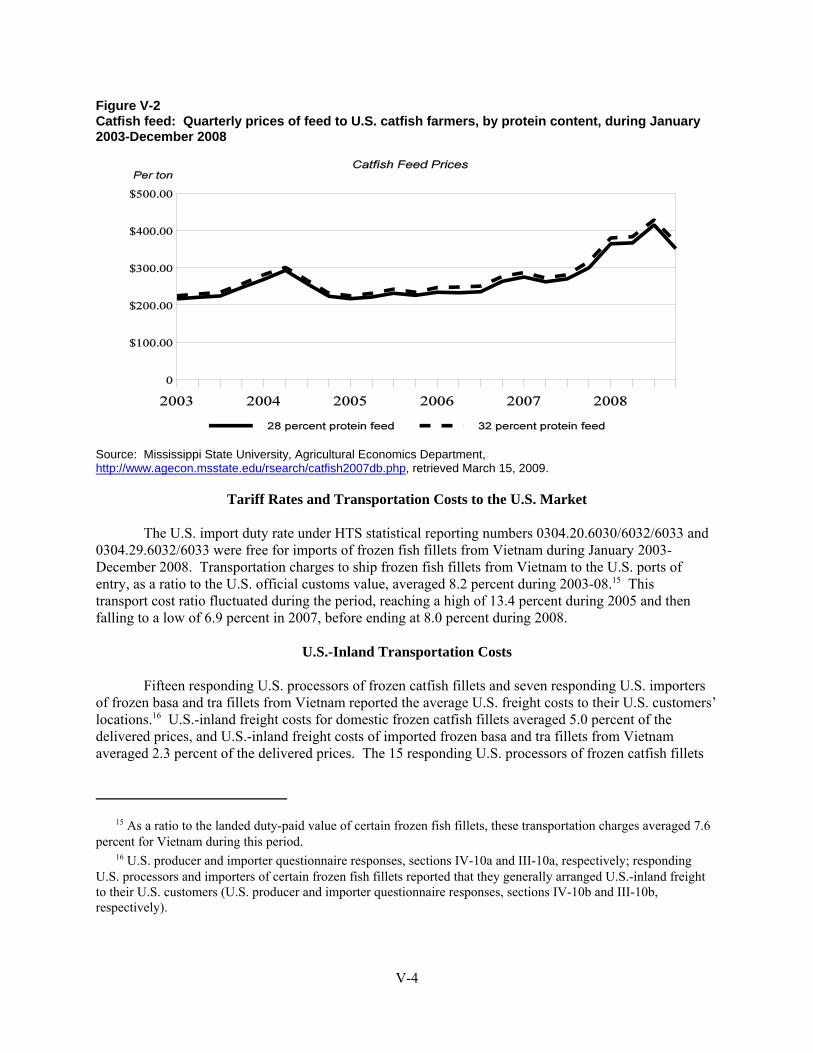
15 As a ratio to the landed duty-paid value of certain frozen fish fillets, these transportation charges averaged 7.6percent for Vietnam during this period. 16 U.S. producer and importer questionnaire responses, sections IV-10a and III-10a, respectively; respondingU.S. processors and importers of certain frozen fish fillets reported that they generally arranged U.S.-inland freightto their U.S. customers (U.S. producer and importer questionnaire responses, sections IV-10b and III-10b,respectively).
V-4
Figure V-2Catfish feed: Quarterly prices of feed to U.S. catfish farmers, by protein content, during January2003-December 2008
Source: Mississippi State University, Agricultural Economics Department, http://www.agecon.msstate.edu/rsearch/catfish2007db.php, retrieved March 15, 2009.
Tariff Rates and Transportation Costs to the U.S. Market
The U.S. import duty rate under HTS statistical reporting numbers 0304.20.6030/6032/6033 and0304.29.6032/6033 were free for imports of frozen fish fillets from Vietnam during January 2003-December 2008. Transportation charges to ship frozen fish fillets from Vietnam to the U.S. ports ofentry, as a ratio to the U.S. official customs value, averaged 8.2 percent during 2003-08.15 This transport cost ratio fluctuated during the period, reaching a high of 13.4 percent during 2005 and thenfalling to a low of 6.9 percent in 2007, before ending at 8.0 percent during 2008.
U.S.-Inland Transportation Costs
Fifteen responding U.S. processors of frozen catfish fillets and seven responding U.S. importersof frozen basa and tra fillets from Vietnam reported the average U.S. freight costs to their U.S. customers’locations.16 U.S.-inland freight costs for domestic frozen catfish fillets averaged 5.0 percent of thedelivered prices, and U.S.-inland freight costs of imported frozen basa and tra fillets from Vietnamaveraged 2.3 percent of the delivered prices. The 15 responding U.S. processors of frozen catfish fillets
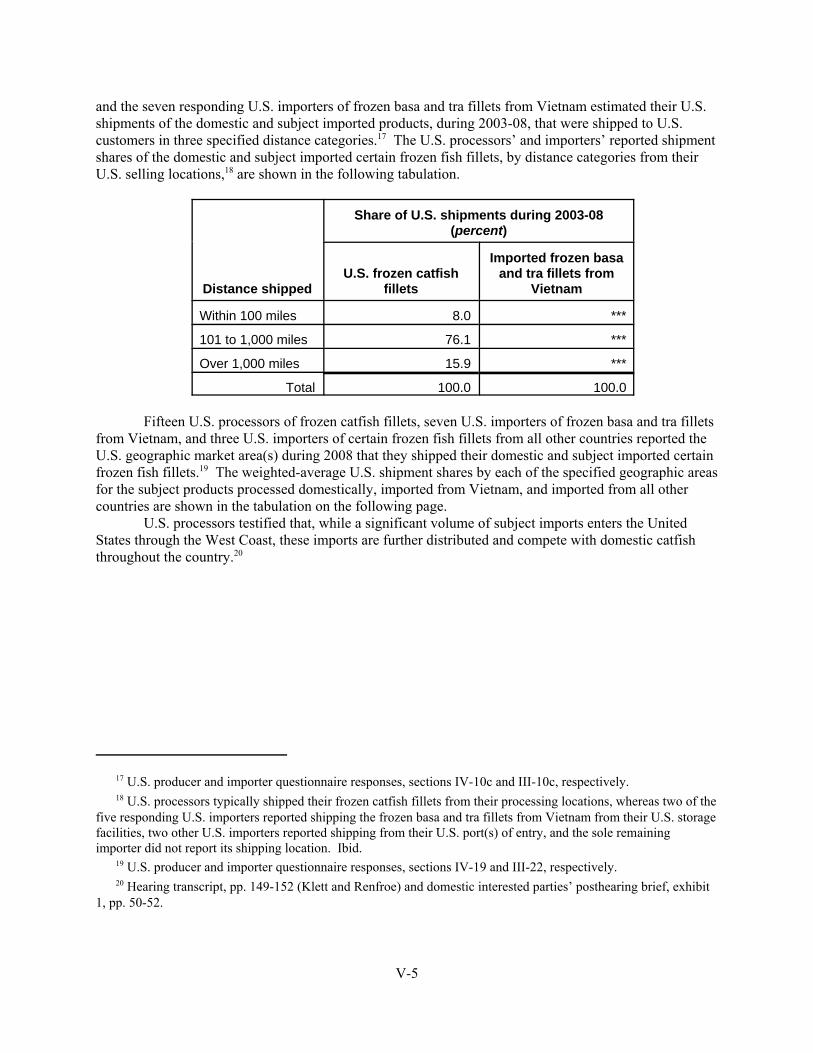
17 U.S. producer and importer questionnaire responses, sections IV-10c and III-10c, respectively. 18 U.S. processors typically shipped their frozen catfish fillets from their processing locations, whereas two of thefive responding U.S. importers reported shipping the frozen basa and tra fillets from Vietnam from their U.S. storagefacilities, two other U.S. importers reported shipping from their U.S. port(s) of entry, and the sole remainingimporter did not report its shipping location. Ibid. 19 U.S. producer and importer questionnaire responses, sections IV-19 and III-22, respectively. 20 Hearing transcript, pp. 149-152 (Klett and Renfroe) and domestic interested parties’ posthearing brief, exhibit1, pp. 50-52.
V-5
and the seven responding U.S. importers of frozen basa and tra fillets from Vietnam estimated their U.S.shipments of the domestic and subject imported products, during 2003-08, that were shipped to U.S.customers in three specified distance categories.17 The U.S. processors’ and importers’ reported shipmentshares of the domestic and subject imported certain frozen fish fillets, by distance categories from theirU.S. selling locations,18 are shown in the following tabulation.
Distance shipped
Share of U.S. shipments during 2003-08(percent)
U.S. frozen catfishfillets
Imported frozen basaand tra fillets from
Vietnam
Within 100 miles 8.0 ***
101 to 1,000 miles 76.1 ***
Over 1,000 miles 15.9 ***
Total 100.0 100.0
Fifteen U.S. processors of frozen catfish fillets, seven U.S. importers of frozen basa and tra filletsfrom Vietnam, and three U.S. importers of certain frozen fish fillets from all other countries reported theU.S. geographic market area(s) during 2008 that they shipped their domestic and subject imported certainfrozen fish fillets.19 The weighted-average U.S. shipment shares by each of the specified geographic areasfor the subject products processed domestically, imported from Vietnam, and imported from all othercountries are shown in the tabulation on the following page.
U.S. processors testified that, while a significant volume of subject imports enters the UnitedStates through the West Coast, these imports are further distributed and compete with domestic catfishthroughout the country.20
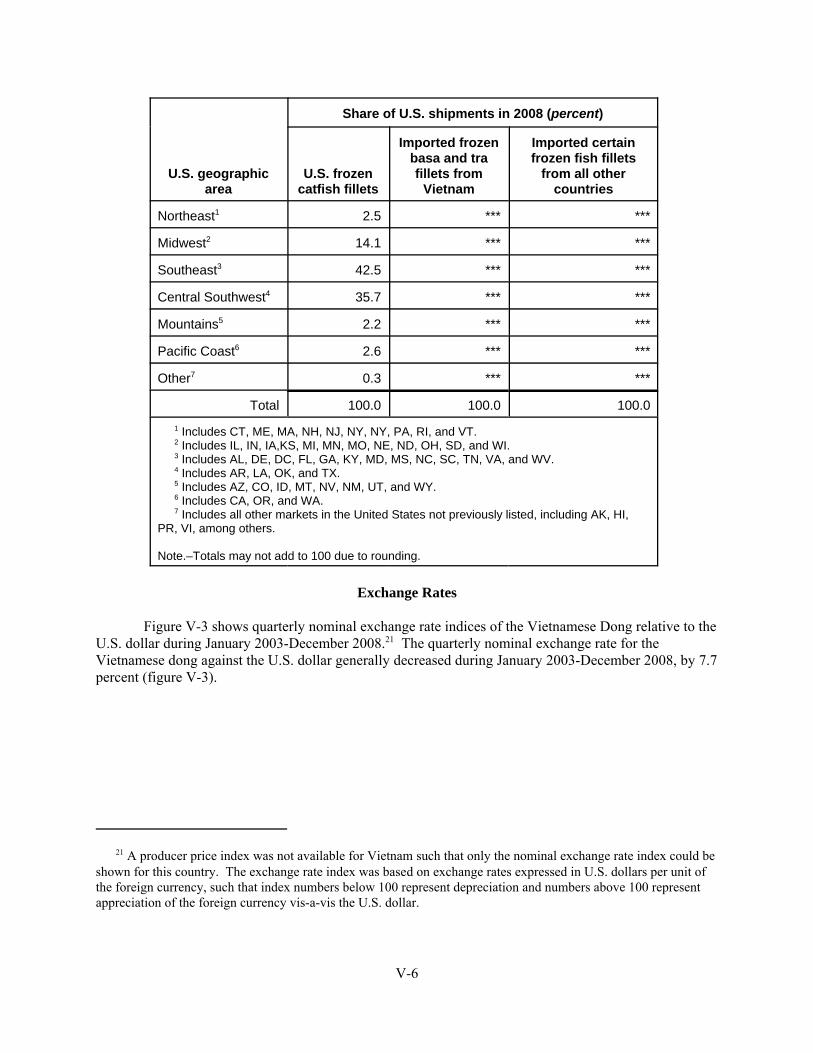
21 A producer price index was not available for Vietnam such that only the nominal exchange rate index could beshown for this country. The exchange rate index was based on exchange rates expressed in U.S. dollars per unit ofthe foreign currency, such that index numbers below 100 represent depreciation and numbers above 100 representappreciation of the foreign currency vis-a-vis the U.S. dollar.
V-6
U.S. geographicarea
Share of U.S. shipments in 2008 (percent)
U.S. frozencatfish fillets
Imported frozenbasa and trafillets from
Vietnam
Imported certainfrozen fish fillets
from all othercountries
Northeast1 2.5 *** ***
Midwest2 14.1 *** ***
Southeast3 42.5 *** ***
Central Southwest4 35.7 *** ***
Mountains5 2.2 *** ***
Pacific Coast6 2.6 *** ***
Other7 0.3 *** ***
Total 100.0 100.0 100.0
1 Includes CT, ME, MA, NH, NJ, NY, NY, PA, RI, and VT. 2 Includes IL, IN, IA,KS, MI, MN, MO, NE, ND, OH, SD, and WI. 3 Includes AL, DE, DC, FL, GA, KY, MD, MS, NC, SC, TN, VA, and WV. 4 Includes AR, LA, OK, and TX. 5 Includes AZ, CO, ID, MT, NV, NM, UT, and WY. 6 Includes CA, OR, and WA. 7 Includes all other markets in the United States not previously listed, including AK, HI,PR, VI, among others.
Note.–Totals may not add to 100 due to rounding.
Exchange Rates
Figure V-3 shows quarterly nominal exchange rate indices of the Vietnamese Dong relative to theU.S. dollar during January 2003-December 2008.21 The quarterly nominal exchange rate for theVietnamese dong against the U.S. dollar generally decreased during January 2003-December 2008, by 7.7percent (figure V-3).
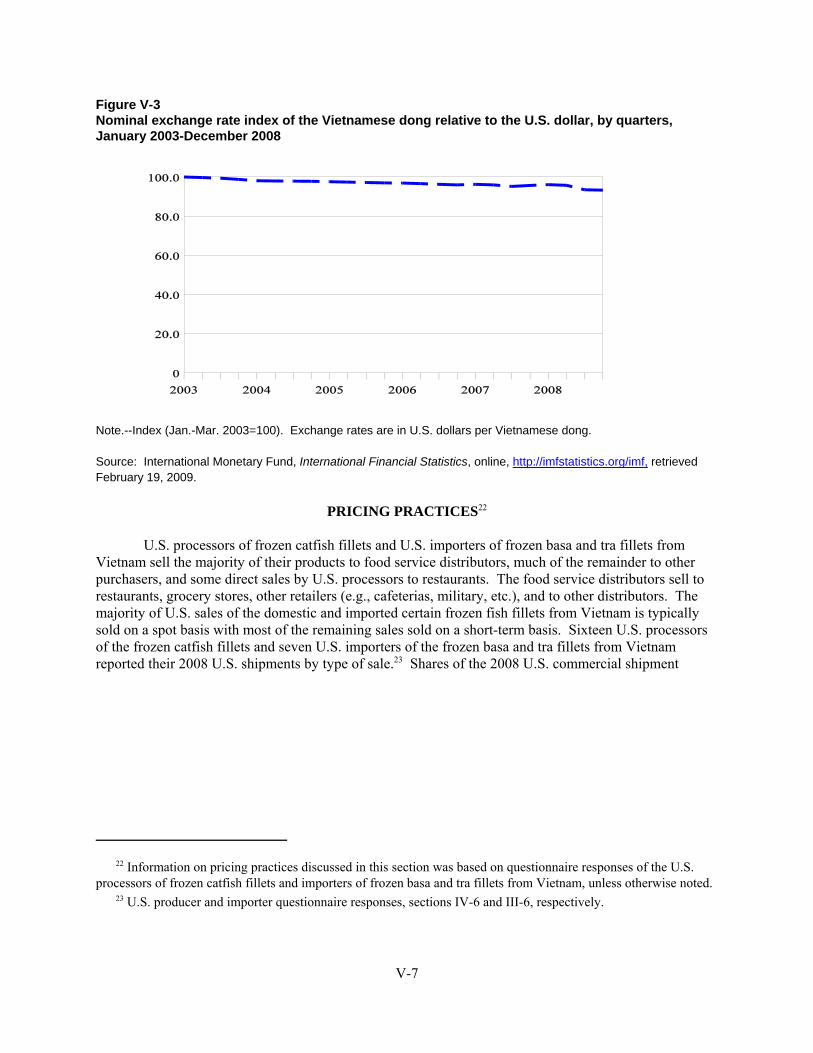
22 Information on pricing practices discussed in this section was based on questionnaire responses of the U.S.processors of frozen catfish fillets and importers of frozen basa and tra fillets from Vietnam, unless otherwise noted. 23 U.S. producer and importer questionnaire responses, sections IV-6 and III-6, respectively.
V-7
Figure V-3Nominal exchange rate index of the Vietnamese dong relative to the U.S. dollar, by quarters,January 2003-December 2008
Note.--Index (Jan.-Mar. 2003=100). Exchange rates are in U.S. dollars per Vietnamese dong.
Source: International Monetary Fund, International Financial Statistics, online, http://imfstatistics.org/imf, retrievedFebruary 19, 2009.
PRICING PRACTICES22
U.S. processors of frozen catfish fillets and U.S. importers of frozen basa and tra fillets fromVietnam sell the majority of their products to food service distributors, much of the remainder to otherpurchasers, and some direct sales by U.S. processors to restaurants. The food service distributors sell torestaurants, grocery stores, other retailers (e.g., cafeterias, military, etc.), and to other distributors. Themajority of U.S. sales of the domestic and imported certain frozen fish fillets from Vietnam is typicallysold on a spot basis with most of the remaining sales sold on a short-term basis. Sixteen U.S. processorsof the frozen catfish fillets and seven U.S. importers of the frozen basa and tra fillets from Vietnamreported their 2008 U.S. shipments by type of sale.23 Shares of the 2008 U.S. commercial shipment
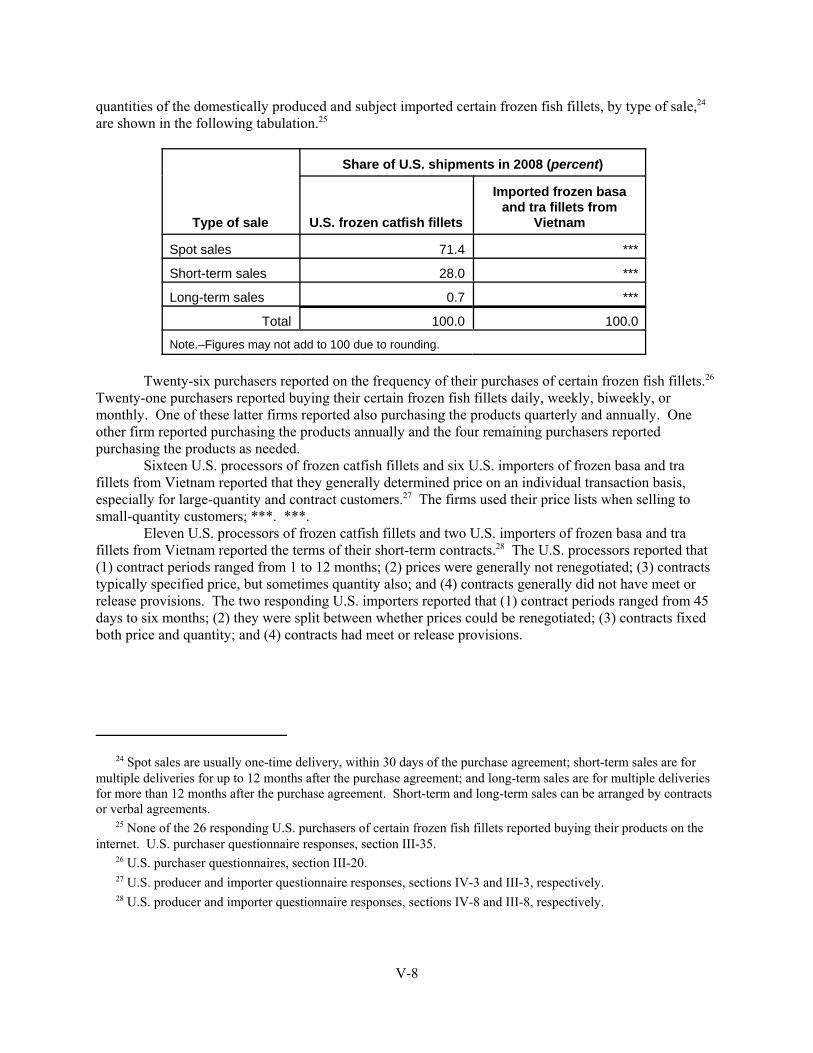
24 Spot sales are usually one-time delivery, within 30 days of the purchase agreement; short-term sales are formultiple deliveries for up to 12 months after the purchase agreement; and long-term sales are for multiple deliveriesfor more than 12 months after the purchase agreement. Short-term and long-term sales can be arranged by contractsor verbal agreements. 25 None of the 26 responding U.S. purchasers of certain frozen fish fillets reported buying their products on theinternet. U.S. purchaser questionnaire responses, section III-35. 26 U.S. purchaser questionnaires, section III-20. 27 U.S. producer and importer questionnaire responses, sections IV-3 and III-3, respectively. 28 U.S. producer and importer questionnaire responses, sections IV-8 and III-8, respectively.
V-8
quantities of the domestically produced and subject imported certain frozen fish fillets, by type of sale,24
are shown in the following tabulation.25
Type of sale
Share of U.S. shipments in 2008 (percent)
U.S. frozen catfish fillets
Imported frozen basaand tra fillets from
Vietnam
Spot sales 71.4 ***
Short-term sales 28.0 ***
Long-term sales 0.7 ***
Total 100.0 100.0
Note.–Figures may not add to 100 due to rounding.
Twenty-six purchasers reported on the frequency of their purchases of certain frozen fish fillets.26 Twenty-one purchasers reported buying their certain frozen fish fillets daily, weekly, biweekly, ormonthly. One of these latter firms reported also purchasing the products quarterly and annually. Oneother firm reported purchasing the products annually and the four remaining purchasers reportedpurchasing the products as needed.
Sixteen U.S. processors of frozen catfish fillets and six U.S. importers of frozen basa and trafillets from Vietnam reported that they generally determined price on an individual transaction basis,especially for large-quantity and contract customers.27 The firms used their price lists when selling tosmall-quantity customers; ***. ***.
Eleven U.S. processors of frozen catfish fillets and two U.S. importers of frozen basa and trafillets from Vietnam reported the terms of their short-term contracts.28 The U.S. processors reported that(1) contract periods ranged from 1 to 12 months; (2) prices were generally not renegotiated; (3) contractstypically specified price, but sometimes quantity also; and (4) contracts generally did not have meet orrelease provisions. The two responding U.S. importers reported that (1) contract periods ranged from 45days to six months; (2) they were split between whether prices could be renegotiated; (3) contracts fixedboth price and quantity; and (4) contracts had meet or release provisions.
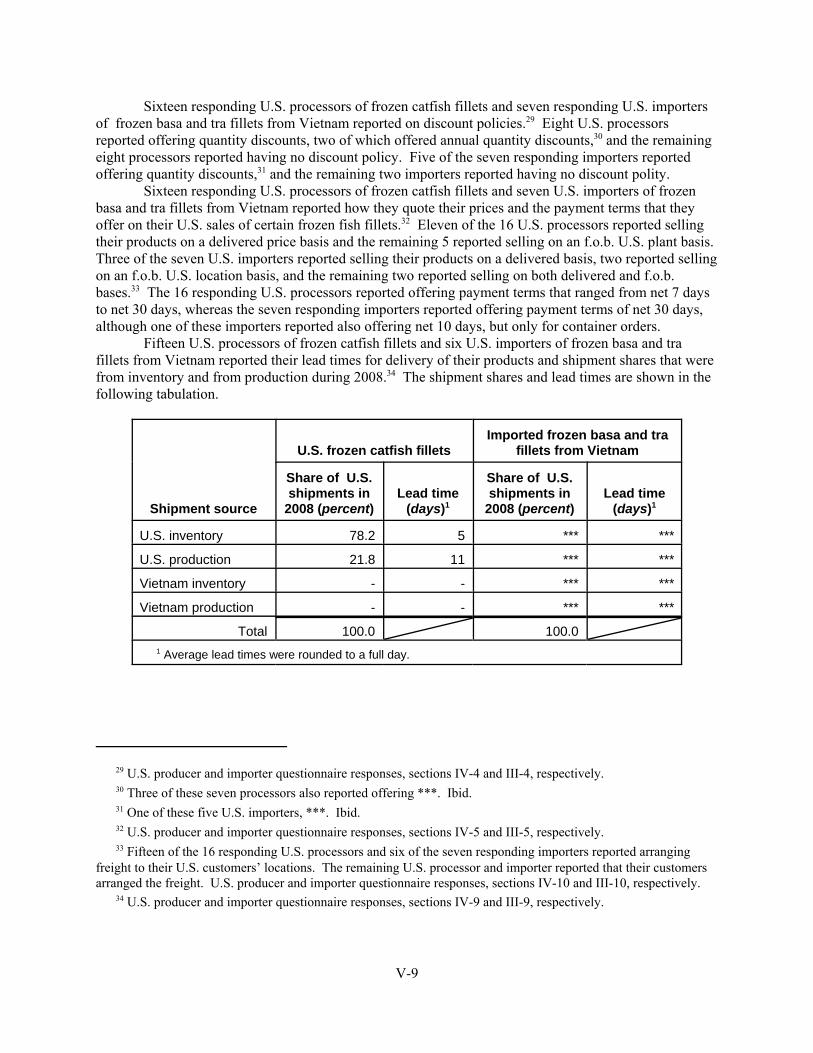
29 U.S. producer and importer questionnaire responses, sections IV-4 and III-4, respectively. 30 Three of these seven processors also reported offering ***. Ibid. 31 One of these five U.S. importers, ***. Ibid. 32 U.S. producer and importer questionnaire responses, sections IV-5 and III-5, respectively. 33 Fifteen of the 16 responding U.S. processors and six of the seven responding importers reported arrangingfreight to their U.S. customers’ locations. The remaining U.S. processor and importer reported that their customersarranged the freight. U.S. producer and importer questionnaire responses, sections IV-10 and III-10, respectively. 34 U.S. producer and importer questionnaire responses, sections IV-9 and III-9, respectively.
V-9
Sixteen responding U.S. processors of frozen catfish fillets and seven responding U.S. importersof frozen basa and tra fillets from Vietnam reported on discount policies.29 Eight U.S. processorsreported offering quantity discounts, two of which offered annual quantity discounts,30 and the remainingeight processors reported having no discount policy. Five of the seven responding importers reportedoffering quantity discounts,31 and the remaining two importers reported having no discount polity.
Sixteen responding U.S. processors of frozen catfish fillets and seven U.S. importers of frozenbasa and tra fillets from Vietnam reported how they quote their prices and the payment terms that theyoffer on their U.S. sales of certain frozen fish fillets.32 Eleven of the 16 U.S. processors reported sellingtheir products on a delivered price basis and the remaining 5 reported selling on an f.o.b. U.S. plant basis. Three of the seven U.S. importers reported selling their products on a delivered basis, two reported sellingon an f.o.b. U.S. location basis, and the remaining two reported selling on both delivered and f.o.b.bases.33 The 16 responding U.S. processors reported offering payment terms that ranged from net 7 daysto net 30 days, whereas the seven responding importers reported offering payment terms of net 30 days,although one of these importers reported also offering net 10 days, but only for container orders.
Fifteen U.S. processors of frozen catfish fillets and six U.S. importers of frozen basa and trafillets from Vietnam reported their lead times for delivery of their products and shipment shares that werefrom inventory and from production during 2008.34 The shipment shares and lead times are shown in thefollowing tabulation.
Shipment source
U.S. frozen catfish filletsImported frozen basa and tra
fillets from Vietnam
Share of U.S.shipments in
2008 (percent)Lead time
(days)1
Share of U.S.shipments in
2008 (percent)Lead time
(days)1
U.S. inventory 78.2 5 *** ***
U.S. production 21.8 11 *** ***
Vietnam inventory - - *** ***
Vietnam production - - *** ***
Total 100.0 100.0
1 Average lead times were rounded to a full day.
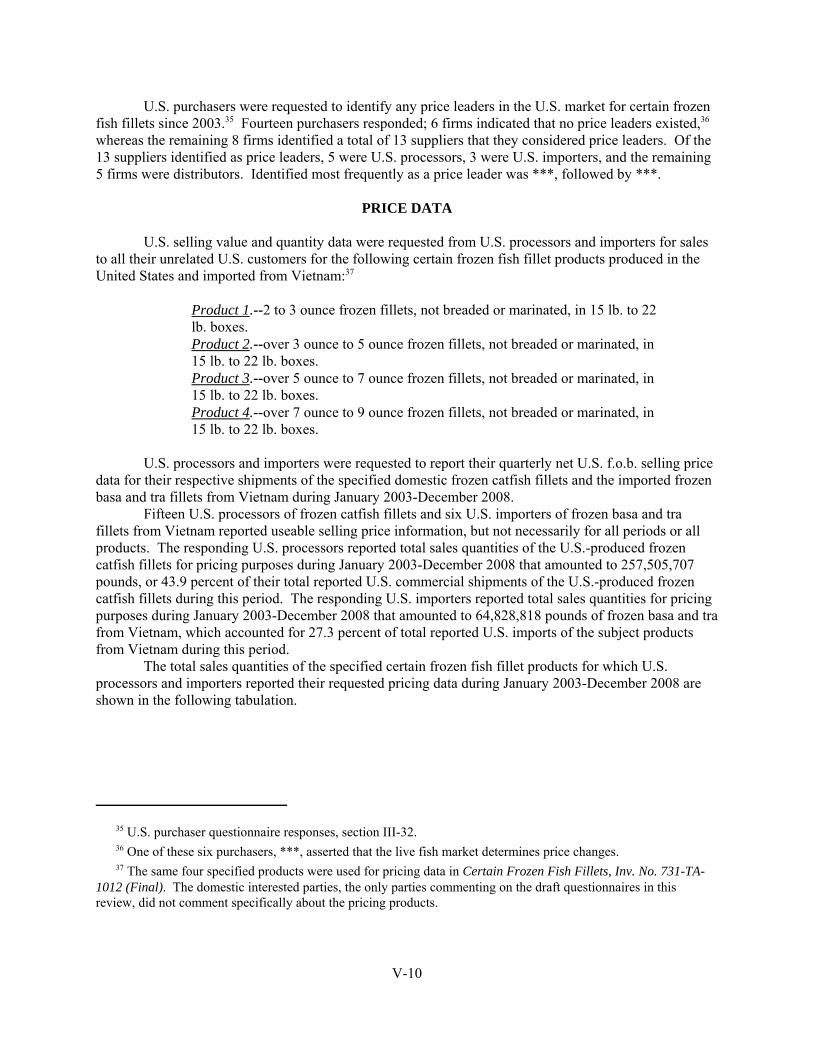
35 U.S. purchaser questionnaire responses, section III-32. 36 One of these six purchasers, ***, asserted that the live fish market determines price changes. 37 The same four specified products were used for pricing data in Certain Frozen Fish Fillets, Inv. No. 731-TA-1012 (Final). The domestic interested parties, the only parties commenting on the draft questionnaires in thisreview, did not comment specifically about the pricing products.
V-10
U.S. purchasers were requested to identify any price leaders in the U.S. market for certain frozenfish fillets since 2003.35 Fourteen purchasers responded; 6 firms indicated that no price leaders existed,36
whereas the remaining 8 firms identified a total of 13 suppliers that they considered price leaders. Of the13 suppliers identified as price leaders, 5 were U.S. processors, 3 were U.S. importers, and the remaining5 firms were distributors. Identified most frequently as a price leader was ***, followed by ***.
PRICE DATA
U.S. selling value and quantity data were requested from U.S. processors and importers for salesto all their unrelated U.S. customers for the following certain frozen fish fillet products produced in theUnited States and imported from Vietnam:37
Product 1.--2 to 3 ounce frozen fillets, not breaded or marinated, in 15 lb. to 22lb. boxes.Product 2.--over 3 ounce to 5 ounce frozen fillets, not breaded or marinated, in15 lb. to 22 lb. boxes.Product 3.--over 5 ounce to 7 ounce frozen fillets, not breaded or marinated, in15 lb. to 22 lb. boxes.Product 4.--over 7 ounce to 9 ounce frozen fillets, not breaded or marinated, in15 lb. to 22 lb. boxes.
U.S. processors and importers were requested to report their quarterly net U.S. f.o.b. selling pricedata for their respective shipments of the specified domestic frozen catfish fillets and the imported frozenbasa and tra fillets from Vietnam during January 2003-December 2008.
Fifteen U.S. processors of frozen catfish fillets and six U.S. importers of frozen basa and trafillets from Vietnam reported useable selling price information, but not necessarily for all periods or allproducts. The responding U.S. processors reported total sales quantities of the U.S.-produced frozencatfish fillets for pricing purposes during January 2003-December 2008 that amounted to 257,505,707pounds, or 43.9 percent of their total reported U.S. commercial shipments of the U.S.-produced frozencatfish fillets during this period. The responding U.S. importers reported total sales quantities for pricingpurposes during January 2003-December 2008 that amounted to 64,828,818 pounds of frozen basa and trafrom Vietnam, which accounted for 27.3 percent of total reported U.S. imports of the subject productsfrom Vietnam during this period.
The total sales quantities of the specified certain frozen fish fillet products for which U.S.processors and importers reported their requested pricing data during January 2003-December 2008 areshown in the following tabulation.
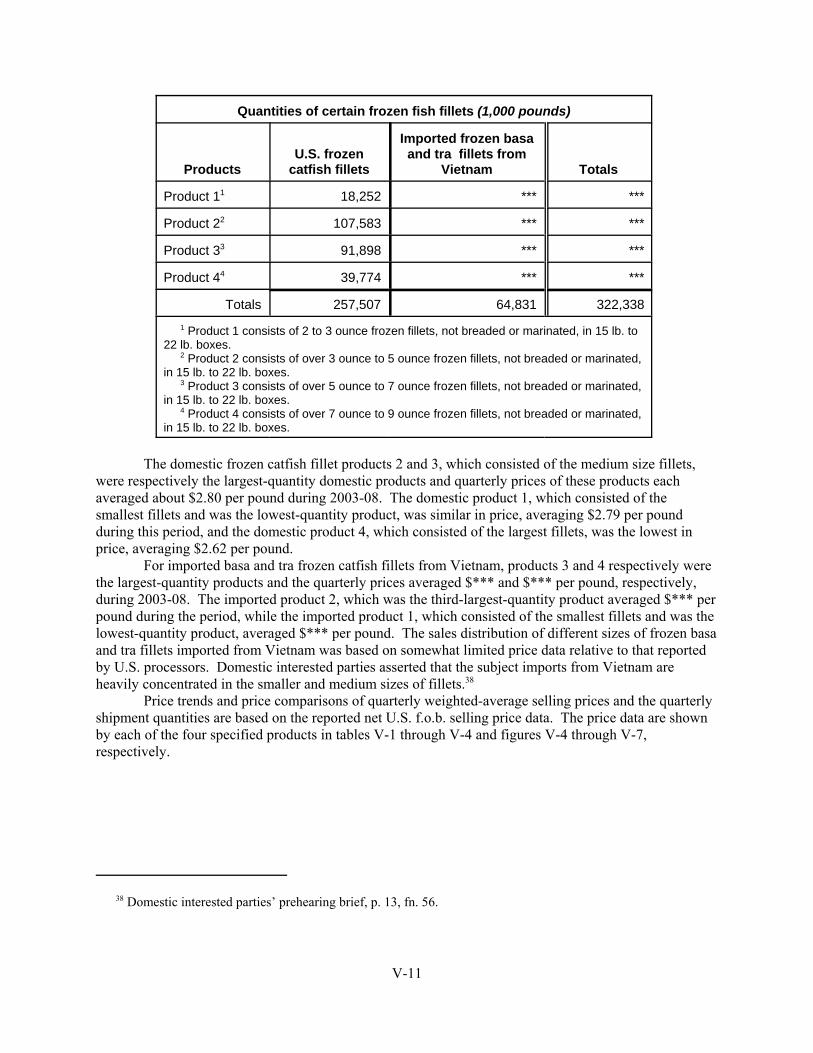
38 Domestic interested parties’ prehearing brief, p. 13, fn. 56.
V-11
Quantities of certain frozen fish fillets (1,000 pounds)
ProductsU.S. frozen
catfish fillets
Imported frozen basaand tra fillets from
Vietnam Totals
Product 11 18,252 *** ***
Product 22 107,583 *** ***
Product 33 91,898 *** ***
Product 44 39,774 *** ***
Totals 257,507 64,831 322,338
1 Product 1 consists of 2 to 3 ounce frozen fillets, not breaded or marinated, in 15 lb. to22 lb. boxes. 2 Product 2 consists of over 3 ounce to 5 ounce frozen fillets, not breaded or marinated,in 15 lb. to 22 lb. boxes. 3 Product 3 consists of over 5 ounce to 7 ounce frozen fillets, not breaded or marinated,in 15 lb. to 22 lb. boxes. 4 Product 4 consists of over 7 ounce to 9 ounce frozen fillets, not breaded or marinated,in 15 lb. to 22 lb. boxes.
The domestic frozen catfish fillet products 2 and 3, which consisted of the medium size fillets,were respectively the largest-quantity domestic products and quarterly prices of these products eachaveraged about $2.80 per pound during 2003-08. The domestic product 1, which consisted of thesmallest fillets and was the lowest-quantity product, was similar in price, averaging $2.79 per poundduring this period, and the domestic product 4, which consisted of the largest fillets, was the lowest inprice, averaging $2.62 per pound.
For imported basa and tra frozen catfish fillets from Vietnam, products 3 and 4 respectively werethe largest-quantity products and the quarterly prices averaged $*** and $*** per pound, respectively,during 2003-08. The imported product 2, which was the third-largest-quantity product averaged $*** perpound during the period, while the imported product 1, which consisted of the smallest fillets and was thelowest-quantity product, averaged $*** per pound. The sales distribution of different sizes of frozen basaand tra fillets imported from Vietnam was based on somewhat limited price data relative to that reportedby U.S. processors. Domestic interested parties asserted that the subject imports from Vietnam areheavily concentrated in the smaller and medium sizes of fillets.38
Price trends and price comparisons of quarterly weighted-average selling prices and the quarterlyshipment quantities are based on the reported net U.S. f.o.b. selling price data. The price data are shownby each of the four specified products in tables V-1 through V-4 and figures V-4 through V-7,respectively.
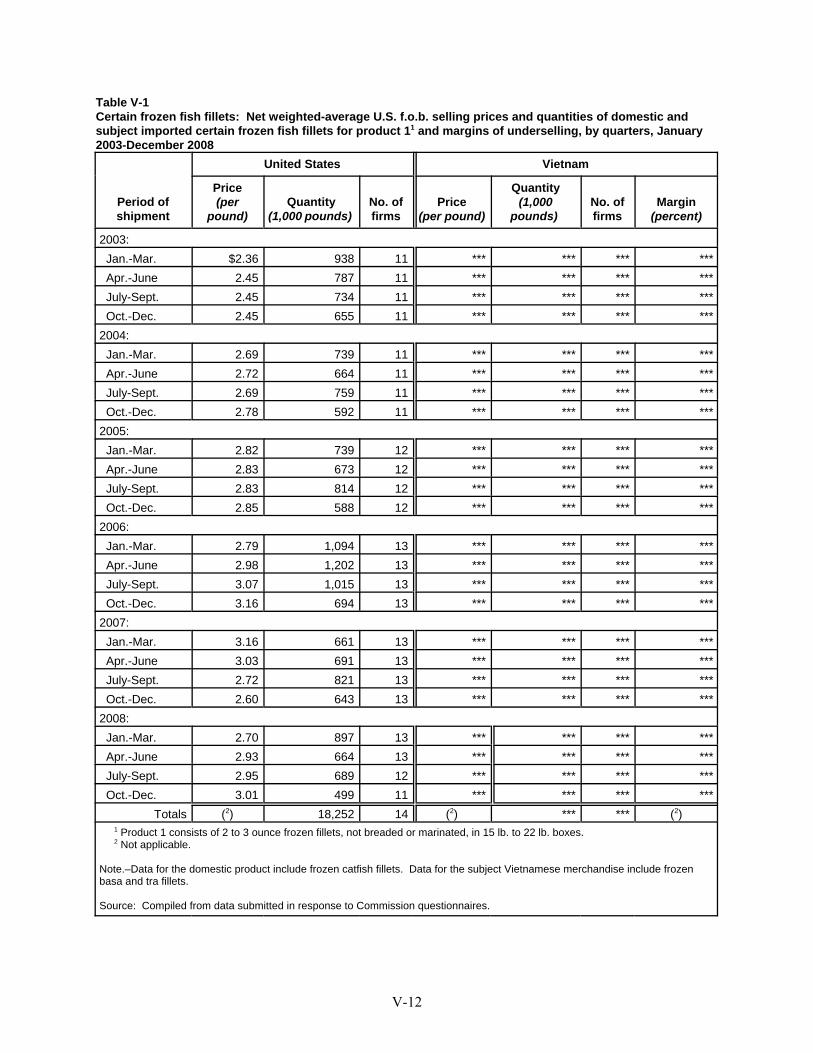
V-12
Table V-1Certain frozen fish fillets: Net weighted-average U.S. f.o.b. selling prices and quantities of domestic andsubject imported certain frozen fish fillets for product 11 and margins of underselling, by quarters, January2003-December 2008
Period ofshipment
United States Vietnam
Price(per
pound)Quantity
(1,000 pounds) No. offirms
Price(per pound)
Quantity(1,000
pounds) No. offirms
Margin(percent)
2003: Jan.-Mar. $2.36 938 11 *** *** *** *** Apr.-June 2.45 787 11 *** *** *** *** July-Sept. 2.45 734 11 *** *** *** *** Oct.-Dec. 2.45 655 11 *** *** *** ***2004: Jan.-Mar. 2.69 739 11 *** *** *** *** Apr.-June 2.72 664 11 *** *** *** *** July-Sept. 2.69 759 11 *** *** *** *** Oct.-Dec. 2.78 592 11 *** *** *** ***2005: Jan.-Mar. 2.82 739 12 *** *** *** *** Apr.-June 2.83 673 12 *** *** *** *** July-Sept. 2.83 814 12 *** *** *** *** Oct.-Dec. 2.85 588 12 *** *** *** ***2006: Jan.-Mar. 2.79 1,094 13 *** *** *** *** Apr.-June 2.98 1,202 13 *** *** *** *** July-Sept. 3.07 1,015 13 *** *** *** *** Oct.-Dec. 3.16 694 13 *** *** *** ***2007: Jan.-Mar. 3.16 661 13 *** *** *** *** Apr.-June 3.03 691 13 *** *** *** *** July-Sept. 2.72 821 13 *** *** *** *** Oct.-Dec. 2.60 643 13 *** *** *** ***2008: Jan.-Mar. 2.70 897 13 *** *** *** *** Apr.-June 2.93 664 13 *** *** *** *** July-Sept. 2.95 689 12 *** *** *** *** Oct.-Dec. 3.01 499 11 *** *** *** ***
Totals (2) 18,252 14 (2) *** *** (2) 1 Product 1 consists of 2 to 3 ounce frozen fillets, not breaded or marinated, in 15 lb. to 22 lb. boxes. 2 Not applicable.
Note.–Data for the domestic product include frozen catfish fillets. Data for the subject Vietnamese merchandise include frozenbasa and tra fillets.
Source: Compiled from data submitted in response to Commission questionnaires.

V-13
Table V-2Certain frozen fish fillets: Net weighted-average U.S. f.o.b. selling prices and quantities of domestic andsubject imported certain frozen fish fillets for product 21 and margins of underselling, by quarters, January2003-December 2008
Period ofshipment
United States Vietnam
Price(per
pound)Quantity
(1,000 pounds) No. offirms
Price(per pound)
Quantity(1,000
pounds) No. offirms
Margin(percent)
2003: Jan.-Mar. $2.42 5,276 11 *** *** *** *** Apr.-June 2.51 4,791 11 *** *** *** *** July-Sept. 2.44 5,192 11 *** *** *** *** Oct.-Dec. 2.47 3,666 11 *** *** *** ***2004: Jan.-Mar. 2.68 4,914 11 *** *** *** *** Apr.-June 2.77 4,391 11 *** *** *** *** July-Sept. 2.71 5,007 11 *** *** *** *** Oct.-Dec. 2.74 3,595 11 *** *** *** ***2005: Jan.-Mar. 2.82 4,820 12 *** *** *** *** Apr.-June 2.83 4,753 12 *** *** *** *** July-Sept. 2.82 5,276 12 *** *** *** *** Oct.-Dec. 2.79 4,218 12 *** *** *** ***2006: Jan.-Mar. 2.82 5,413 13 *** *** *** *** Apr.-June 3.02 4,405 13 *** *** *** *** July-Sept. 3.10 4,939 13 *** *** *** *** Oct.-Dec. 3.07 3,784 13 *** *** *** ***2007: Jan.-Mar. 3.15 4,239 13 *** *** *** *** Apr.-June 3.10 4,222 13 *** *** *** *** July-Sept. 2.90 4,692 13 *** *** *** *** Oct.-Dec. 2.76 3,838 13 *** *** *** ***2008: Jan.-Mar. 2.78 5,123 13 *** *** *** *** Apr.-June 2.94 4,614 13 *** *** *** *** July-Sept. 3.03 3,977 12 *** *** *** *** Oct.-Dec. 3.12 2,438 11 *** *** *** ***
Totals (2) 107,583 14 (2) *** *** (2) 1 Product 2 consists of over 3 ounce to 5 ounce frozen fillets, not breaded or marinated, in 15 lb. to 22 lb. boxes. 2 Not applicable.
Note.–Data for the domestic product include frozen catfish fillets. Data for the subject Vietnamese merchandise include frozenbasa and tra fillets.
Source: Compiled from data submitted in response to Commission questionnaires.
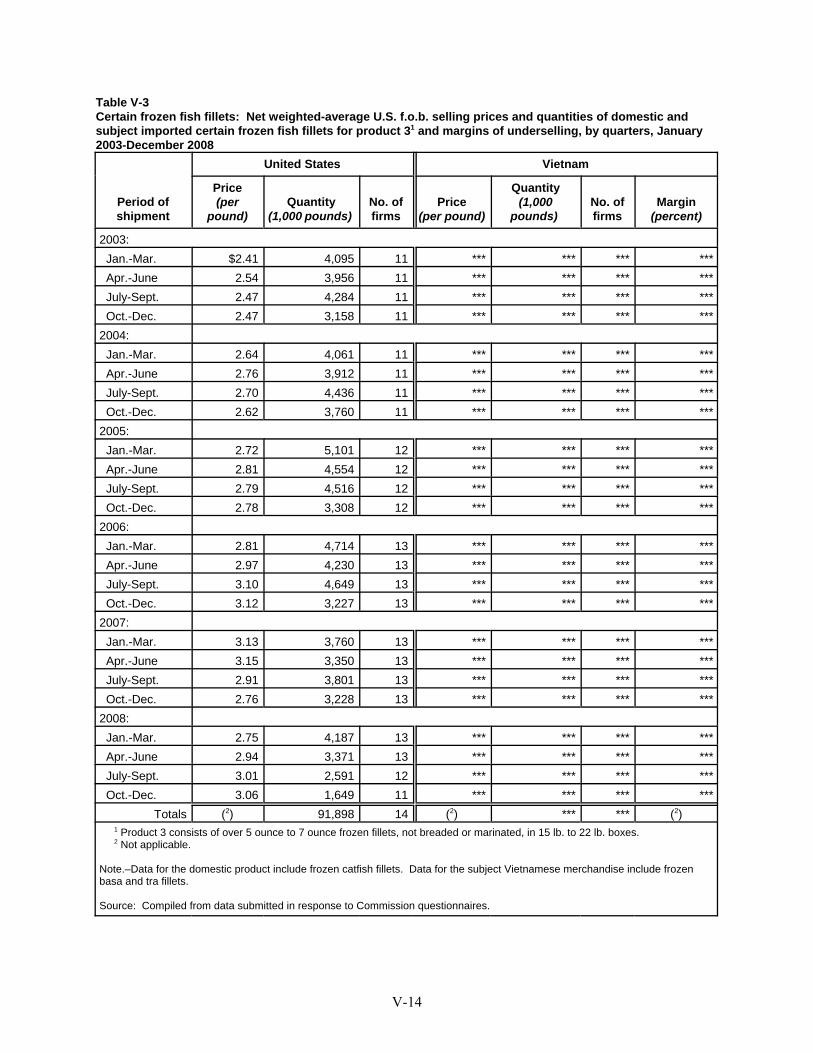
V-14
Table V-3Certain frozen fish fillets: Net weighted-average U.S. f.o.b. selling prices and quantities of domestic andsubject imported certain frozen fish fillets for product 31 and margins of underselling, by quarters, January2003-December 2008
Period ofshipment
United States Vietnam
Price(per
pound)Quantity
(1,000 pounds) No. offirms
Price(per pound)
Quantity(1,000
pounds) No. offirms
Margin(percent)
2003: Jan.-Mar. $2.41 4,095 11 *** *** *** *** Apr.-June 2.54 3,956 11 *** *** *** *** July-Sept. 2.47 4,284 11 *** *** *** *** Oct.-Dec. 2.47 3,158 11 *** *** *** ***2004: Jan.-Mar. 2.64 4,061 11 *** *** *** *** Apr.-June 2.76 3,912 11 *** *** *** *** July-Sept. 2.70 4,436 11 *** *** *** *** Oct.-Dec. 2.62 3,760 11 *** *** *** ***2005: Jan.-Mar. 2.72 5,101 12 *** *** *** *** Apr.-June 2.81 4,554 12 *** *** *** *** July-Sept. 2.79 4,516 12 *** *** *** *** Oct.-Dec. 2.78 3,308 12 *** *** *** ***2006: Jan.-Mar. 2.81 4,714 13 *** *** *** *** Apr.-June 2.97 4,230 13 *** *** *** *** July-Sept. 3.10 4,649 13 *** *** *** *** Oct.-Dec. 3.12 3,227 13 *** *** *** ***2007: Jan.-Mar. 3.13 3,760 13 *** *** *** *** Apr.-June 3.15 3,350 13 *** *** *** *** July-Sept. 2.91 3,801 13 *** *** *** *** Oct.-Dec. 2.76 3,228 13 *** *** *** ***2008: Jan.-Mar. 2.75 4,187 13 *** *** *** *** Apr.-June 2.94 3,371 13 *** *** *** *** July-Sept. 3.01 2,591 12 *** *** *** *** Oct.-Dec. 3.06 1,649 11 *** *** *** ***
Totals (2) 91,898 14 (2) *** *** (2) 1 Product 3 consists of over 5 ounce to 7 ounce frozen fillets, not breaded or marinated, in 15 lb. to 22 lb. boxes. 2 Not applicable.
Note.–Data for the domestic product include frozen catfish fillets. Data for the subject Vietnamese merchandise include frozenbasa and tra fillets.
Source: Compiled from data submitted in response to Commission questionnaires.

V-15
Table V-4Certain frozen fish fillets: Net weighted-average U.S. f.o.b. selling prices and quantities of domestic andsubject imported certain frozen fish fillets for product 41 and margins of underselling, by quarters, January2003-December 2008
Period ofshipment
United States Vietnam
Price(per
pound)Quantity
(1,000 pounds) No. offirms
Price(per pound)
Quantity(1,000
pounds) No. offirms
Margin(percent)
2003: Jan.-Mar. $2.29 2,238 11 *** *** *** *** Apr.-June 2.35 1,952 10 *** *** *** *** July-Sept. 2.34 2,050 11 *** *** *** *** Oct.-Dec. 2.37 1,607 11 *** *** *** ***2004: Jan.-Mar. 2.55 2,085 11 *** *** *** *** Apr.-June 2.65 1,745 11 *** *** *** *** July-Sept. 2.58 1,734 11 *** *** *** *** Oct.-Dec. 2.57 1,412 11 *** *** *** ***2005: Jan.-Mar. 2.52 2,553 12 *** *** *** *** Apr.-June 2.53 2,324 12 *** *** *** *** July-Sept. 2.48 2,461 12 *** *** *** ***
Oct.-Dec. 2.52 1,920 12 *** *** *** ***2006: Jan.-Mar. 2.68 1,643 13 *** *** *** *** Apr.-June 2.91 1,219 13 *** *** *** *** July-Sept. 3.04 1,383 13 *** *** *** *** Oct.-Dec. 3.09 1,052 13 *** *** *** ***2007: Jan.-Mar. 3.11 1,310 13 *** *** *** *** Apr.-June 2.63 1,698 13 *** *** *** *** July-Sept. 2.77 1,412 13 *** *** *** *** Oct.-Dec. 2.71 1,108 13 *** *** *** ***2008: Jan.-Mar. 2.63 1,637 13 *** *** *** *** Apr.-June 2.85 1,312 13 *** *** *** *** July-Sept. 3.00 1,019 12 *** *** *** *** Oct.-Dec. 2.90 900 11 *** *** *** ***
Totals (2) 39,774 14 (2) *** *** (2) 1 Product 4 consists of over 7 ounce to 9 ounce frozen fillets, not breaded or marinated, in 15 lb. to 22 lb. boxes. 2 Not applicable.
Note.–Data for the domestic product include frozen catfish fillets. Data for the subject Vietnamese merchandise include frozenbasa and tra fillets.
Source: Compiled from data submitted in response to Commission questionnaires.
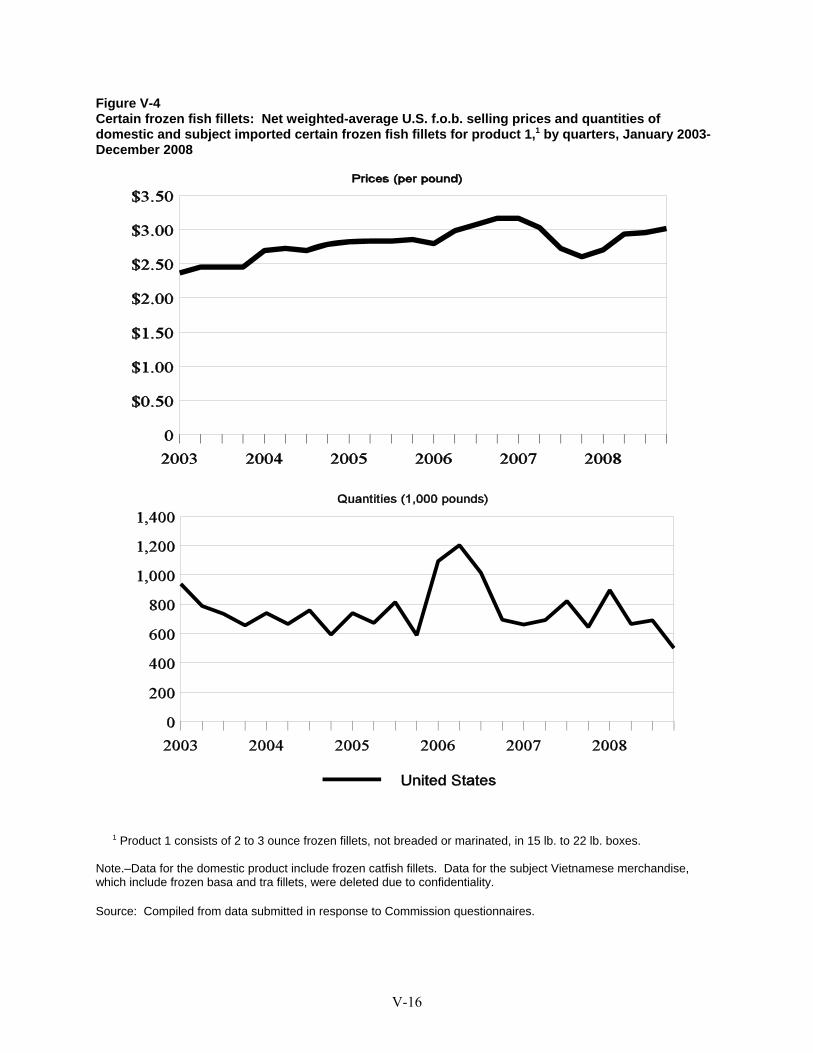
V-16
Figure V-4Certain frozen fish fillets: Net weighted-average U.S. f.o.b. selling prices and quantities ofdomestic and subject imported certain frozen fish fillets for product 1,1 by quarters, January 2003-December 2008
1 Product 1 consists of 2 to 3 ounce frozen fillets, not breaded or marinated, in 15 lb. to 22 lb. boxes.
Note.–Data for the domestic product include frozen catfish fillets. Data for the subject Vietnamese merchandise,which include frozen basa and tra fillets, were deleted due to confidentiality.
Source: Compiled from data submitted in response to Commission questionnaires.
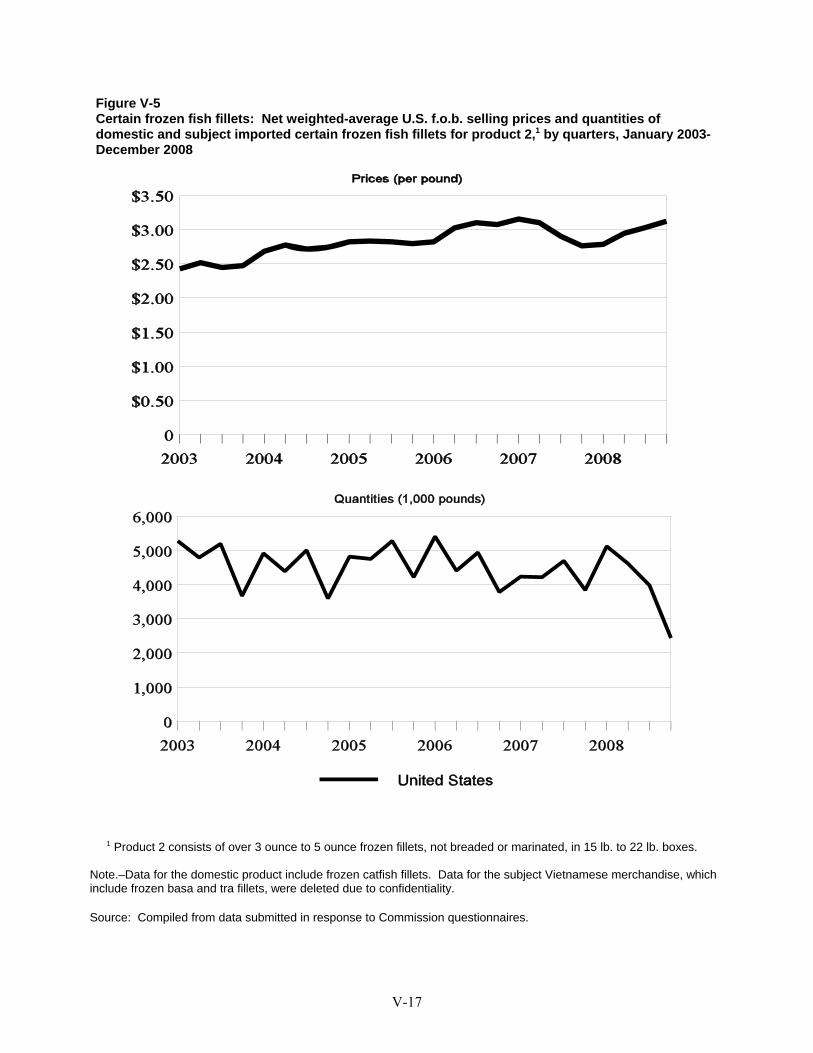
V-17
Figure V-5Certain frozen fish fillets: Net weighted-average U.S. f.o.b. selling prices and quantities ofdomestic and subject imported certain frozen fish fillets for product 2,1 by quarters, January 2003-December 2008
1 Product 2 consists of over 3 ounce to 5 ounce frozen fillets, not breaded or marinated, in 15 lb. to 22 lb. boxes.
Note.–Data for the domestic product include frozen catfish fillets. Data for the subject Vietnamese merchandise, whichinclude frozen basa and tra fillets, were deleted due to confidentiality.
Source: Compiled from data submitted in response to Commission questionnaires.
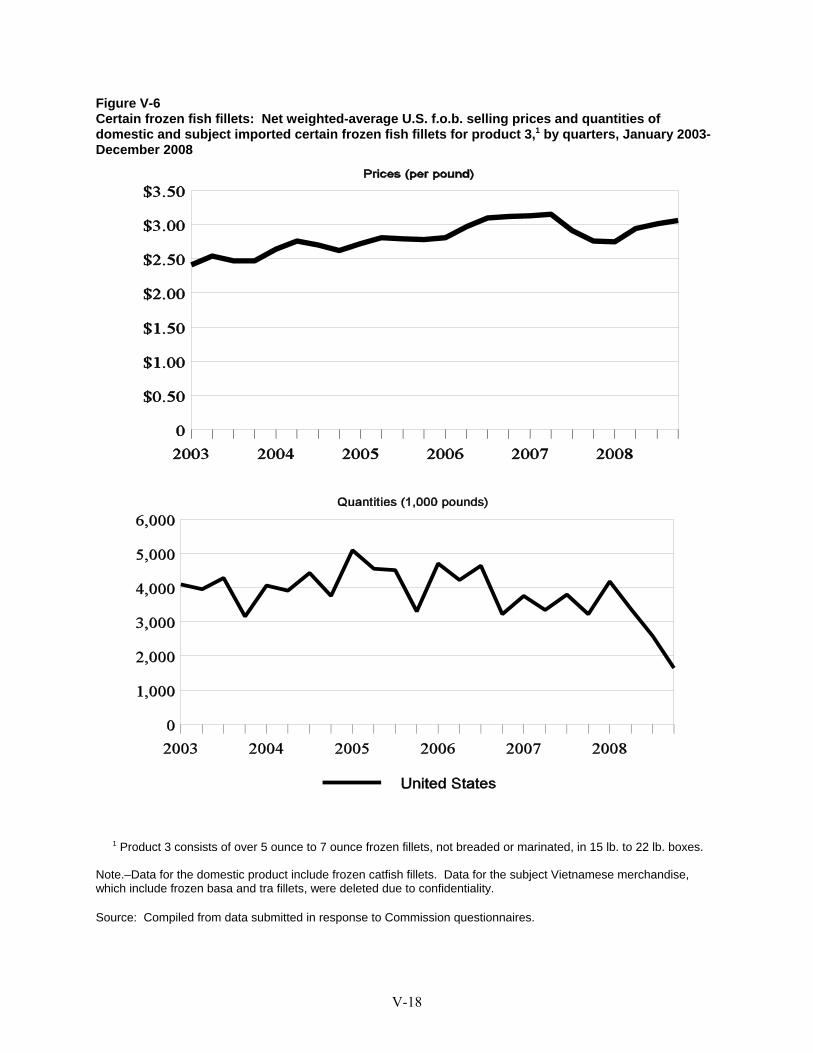
V-18
Figure V-6Certain frozen fish fillets: Net weighted-average U.S. f.o.b. selling prices and quantities ofdomestic and subject imported certain frozen fish fillets for product 3,1 by quarters, January 2003-December 2008
1 Product 3 consists of over 5 ounce to 7 ounce frozen fillets, not breaded or marinated, in 15 lb. to 22 lb. boxes.
Note.–Data for the domestic product include frozen catfish fillets. Data for the subject Vietnamese merchandise,which include frozen basa and tra fillets, were deleted due to confidentiality.
Source: Compiled from data submitted in response to Commission questionnaires.
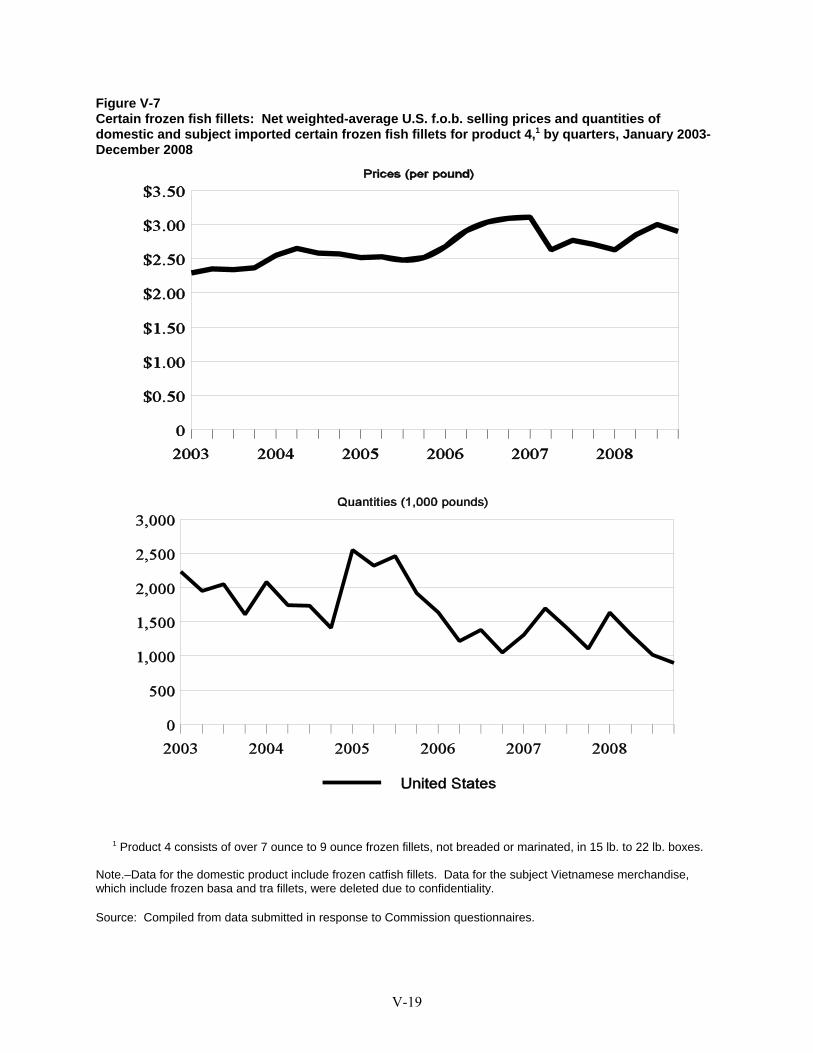
V-19
Figure V-7Certain frozen fish fillets: Net weighted-average U.S. f.o.b. selling prices and quantities ofdomestic and subject imported certain frozen fish fillets for product 4,1 by quarters, January 2003-December 2008
1 Product 4 consists of over 7 ounce to 9 ounce frozen fillets, not breaded or marinated, in 15 lb. to 22 lb. boxes.
Note.–Data for the domestic product include frozen catfish fillets. Data for the subject Vietnamese merchandise,which include frozen basa and tra fillets, were deleted due to confidentiality.
Source: Compiled from data submitted in response to Commission questionnaires.
39 Weighted-average prices and quantities of domestic frozen catfish fillet products 1-4 were available for everyquarter during 2003-08, whereas the price data for imported frozen basa and tra fillet products 1-4 from Vietnamwere not reported for every quarter during this period. The reported price data for imported frozen basa and tra filletproduct 1 from Vietnam were more limited than for products 2-4, leading to less complete price trends; therefore,trends in the price data for imported product 1 are discussed more briefly than those for imported products 2-4. 40 U.S. apparent consumption of certain frozen fish fillets decreased by approximately 8.2 percent in 2007 fromthe previous year, and a 2006 inventory buildup by U.S. processors of their domestic frozen catfish fillets reportedlyhad to be moved in 2007 at tremendous write downs. Hearing transcript, p. 119-120 (Walker)). 41 Quarterly prices of the imported frozen basa and tra fillet product 1 increased by *** percent during October-December 2003 through October-December 2008. However, quarterly prices of the imported product 1 decreasedby *** percent from its period-high during April-June 2006 through October-December 2008.
V-20
Price Trends
Quarterly prices of the domestic frozen catfish fillet products 1-4 fluctuated but generallyincreased during January 2003-December 2008, while quarterly prices of the imported frozen basa and trafillet products 1-4 from Vietnam also fluctuated and increased over the incomplete periods reported, butgenerally decreased from their period-high prices, the latter during various quarters of 2006, throughOctober-December 2008.39 Quarterly prices of the domestic frozen catfish fillet products 1-4 generallydecreased during 2007,40 the only year in which prices of all four domestic products generally decreased,but then typically increased during 2008. On the other hand, quarterly prices of the imported basa and trafrozen fillet products 1-4 generally decreased throughout 2007-08. Quarterly shipment quantities of thefour domestic products showed more pronounced fluctuation than prices of the domestic products, butgenerally decreased during January 2003-December 2008, while shipment quantities of the four importedfrozen basa and tra fillet products from Vietnam fluctuated but generally increased for the incompleteperiods reported. The trends in reported prices and quantities of the subject imported products fromVietnam may be somewhat skewed because only limited price data were reported in the early periodscompared to larger volume price data reported in more recent periods. A summary of price trends andhigh/low prices for the domestic and imported subject products from Vietnam are shown in table V-5.
Quarterly prices of the four domestic frozen catfish fillet products increased similarly during2003-08, with prices increasing over the full period by 27.5 percent for product 1, 28.9 percent for product 2, 27.0 percent for product 3, and 26.6 percent for product 4. Quarterly prices of the domesticfrozen catfish fillet products 1-4 decreased during 2007, by 17.7 percent for product 1, 12.4 percent forproduct 2, 11.8 percent for product 3, and 12.9 percent from product 4. On the other hand, quarterlyprices of the domestic frozen catfish fillet products 1-4 increased during 2008, by 11.5 percent for product1, 12.2 percent for product 2, 11.3 percent for product 3, and 10.3 percent for product 4.
Quarterly prices of the imported frozen basa and tra fillet products 2-4 increased from the initialperiods reported, by *** percent during October-December 2003 through October-December 2008 forproduct 2, and, during April-June 2003 through October-December 2008, by *** percent for product 3and *** percent for product 4.41 On the other hand, quarterly prices of the subject imported products 2-4generally decreased from their period highs; prices of product 2 decreased by *** percent during July-September 2006 through October-December 2008, prices of product 3 decreased by *** percent duringApril-June 2006 through October-December 2008, and prices of product 4 decreased by *** percentduring July-September 2006 through October-December 2008.
42 Quarterly shipment quantities of domestic product 1 decreased by 46.8 percent during January-March 2003through October-December 2008, but product 1 shipment quantities decreased by 4.4 percent and 23.8 percent basedon first-quarter comparisons (January-March 2003 through January-March 2008) and fourth-quarter comparisons(October-December 2003 through October-December 2008), respectively. Quarterly shipment quantities ofdomestic product 2 decreased by 53.8 percent during January-March 2003 through October-December 2008, butproduct 2 shipment quantities decreased by 2.9 percent and 33.5 percent based on first-quarter and fourth-quartercomparisons, respectively. Quarterly shipment quantities of domestic product 3 decreased by 59.7 percent duringJanuary-March 2003 through October-December 2008, but product 3 shipment quantities increased by 2.2 percent
(continued...)
V-21
Table V-5Certain frozen fish fillets: Summary of trends in quarterly weighted-average net f.o.b. sellingprices for domestic and subject imported certain frozen fish fillet products 1-4, by country oforigin, January 2003-December 2008
Country
Number ofquartersreported
Highest price inthe period (per
pound)
Lowest price inthe period (per
pound)
Percentagechange in pricein the period1
Product 1 (2-3 ounce frozen fillets)United States 24 $3.16 $2.36 27.5 Vietnam 12 *** *** ***2
Product 2 (over 3 ounce to 5 ounce frozen fillets)United States 24 3.15 2.42 28.9 Vietnam 20 *** *** ***3
Product 3 (over 5 ounce to 7 ounce frozen fillets)United States 24 3.15 2.41 27.0 Vietnam 21 *** *** ***4
Product 4 (over 7 ounce to 9 ounce frozen fillets)United States 24 3.11 2.29 26.6 Vietnam 21 *** *** ***5
1 Price change is from the first quarter of 2003 to the fourth quarter of 2008 if available. If data for thesequarters are not available, it is the change from the first quarter to the last quarter for which the data are available;this price change does not necessarily show the change between the highest and lowest prices, unless such priceswere in the first and last quarters for which data are available. 2 Price change is based on data for the fourth quarter of 2003 and for the fourth quarter of 2008. 3 Price change is from the fourth quarter of 2003 to the fourth quarter of 2008. 4 Price change is from the second quarter of 2003 to the fourth quarter of 2008. 5 Price change is from the second quarter of 2003 to the fourth quarter of 2008.
Source: Compiled from data submitted in response to Commission questionnaires.
Total quarterly shipment quantities reported by the U.S. processors of the domestic frozen catfishfillet products 1-4 fluctuated but decreased during January 2003-December 2008. Measuring the trend inshipment quantities for the entire period by the change from January-March 2003 through October-December 2008 may overstate the decreases. The reported quarterly shipment quantities show that during2003-08, at least partially as a result of seasonal demand factors, the first quarter of each year generallyrepresented the largest quarterly quantity for the year, while the fourth quarter of each year consistentlyrepresented the lowest quarterly quantity for each year.42 Declining shipment trends were
42 (...continued)and decreased by 47.8 percent based on first-quarter and fourth-quarter comparisons, respectively. Quarterlyshipment quantities of domestic product 4 decreased by 59.8 percent during January-March 2003 through October-December 2008, but product 4 shipment quantities decreased by 26.9 percent and 44.0 percent based on first-quarterand fourth-quarter comparisons, respectively. 43 Quarterly shipment quantities of the imported product 1 from Vietnam increased by *** percent duringOctober-December 2003 (the earliest period for which price data were reported for this product) through October-December 2008; but product 1 shipment quantities increased by *** percent based on first quarter comparisons(January-March 2007 (earliest reported period for this product) through January-March 2008. Quarterly shipmentquantities of the imported product 2 from Vietnam increased by *** percent during October-December 2003 (earliestreported period for this product) through October-December 2008, but product 2 shipment quantities increased by*** percent based on first-quarter comparisons (January-March 2004 (earliest reported period for this product)through January-March 2008). Quarterly shipment quantities of the imported product 3 from Vietnam increased by*** percent during April-June 2003 (earliest reported period for this product) through October-December 2008, butproduct 3 shipment quantities increased by *** and *** percent based on first-quarter comparisons (January-March2004 (earliest reported first-quarter period for this product) through January-March 2008) and fourth-quartercomparisons (October-December 2003 through October-December 2008), respectively. Quarterly shipmentquantities of the imported product 4 from Vietnam increased by *** percent during April-June 2003 (earliestreported period for this product) through October-December 2008, but product 4 shipment quantities increased by*** percent and *** percent based on first-quarter comparisons (January-March 2004 (earliest reported first-quarterperiod for this product) through January-March 2008) and fourth-quarter comparisons (October-December 2003-October-December 2008), respectively. 44 U.S. purchaser questionnaire responses, section IV-9b.
V-22
evident whether comparing shipment quantities in the first and last quarter of the period 2003-08, orcomparing shipments in the first quarters of 2003 and 2008 or the last quarters of 2003 and 2008.
Total quarterly shipment quantities reported by the U.S. importers of the frozen basa and tra filletproducts 1-4 from Vietnam fluctuated but increased during the various periods reported for each suchproduct. Part of this increase in quarterly quantities resulted because of the limited reported price data ofthe subject imported products during the early part of 2003-08 and more complete data in the latter part ofthis period. In addition, because the reported price data for the imported products was less complete thanthat of the domestic producers, seasonal factors were less prominent in the shipment quantities of thesubject imported products than the domestic products.43
Price Comparisons
A total of 74 quarterly net weighted-average U.S. f.o.b. selling price comparisons were possiblebetween the domestic frozen catfish fillet products 1-4 and the imported frozen basa and tra fillet productsfrom Vietnam during January 2003-December 2008. All 74 selling price comparisons showed that theimported products were priced less than the domestic products. The selling price comparisons are shownby period and by product in table V-6.
U.S. purchasers were requested in their purchaser questionnaire responses to comment whetherdomestic frozen fish fillets were higher in price than imported frozen basa and tra fillets from Vietnam.44 Twelve of the 14 responding purchasers reported that prices of domestic frozen catfish fillets were higher,whereas 2 reported that prices of the domestic products were lower. One of the latter two purchasers,***, reported that prices of imported frozen basa fillets from Vietnam were higher than prices of
45 *** also reported that most Vietnamese production initially was basa, which was raised in floating cages in thevast Mekong River Delta. However, in recent years, almost all Vietnamese fish farmers have switched to tra, whichnow accounts for more than *** percent of Vietnam’s combined production and a reported *** percent of exports.*** purchaser questionnaire response, section I-7. 46 U.S. purchaser questionnaire responses, section III-31. 47 The quarterly data were developed from the monthly data reported by USDA, NASS.
V-23
Table V-6Certain frozen fish fillets: Number of quarterly net weighted-average U.S. f.o.b. selling pricecomparisons between U.S. frozen catfish fillets and imported frozen basa and tra fillets fromVietnam, by year and by product, import quantities, and ranges of underselling, January 2003-December 2008
* * * * * *
domestic frozen catfish fillets, but prices of imported frozen tra fillets from Vietnam were lower than prices of the domestic products.45
U.S. purchasers were also requested to indicate how frequently (always, usually, sometimes, ornever) they purchased certain frozen fish fillets that were the lowest in price.46 Of the 25 purchasers that responded, 7 reported that they usually purchase certain frozen fish fillets that were lowest in price, 11reported that they sometimes do so, and 7 reported that they never do so.
Table V-7 presents the number, import quantity, and ranges of underselling from the originalinvestigation. The number of price comparisons from the original investigation were based on monthlyprice data.
Table V-7Certain frozen fish fillets: Number of monthly net weighted-average U.S. f.o.b. selling pricecomparisons between U.S. frozen catfish fillets and imported frozen basa and tra fillets fromVietnam, by year and by product, import quantities, and ranges of underselling, January 2000-March 2003
* * * * * * *
Unit Sales Values and Quantities of U.S. Frozen and Fresh Catfish Fillets
Although U.S. processors produce primarily frozen catfish fillets, they also produce fresh catfishfillets. Data published by the USDA show U.S. processors’ unit sales values and quantities of theirfrozen and fresh catfish fillets for all fillet sizes combined, including regular, shank and strip fillets, butexcluding breaded products. The quarterly weighted-average unit sales values and quantities for the U.S.processors’ frozen and fresh catfish fillets during 2003-08 are shown in table V-8 and figure V-8.47
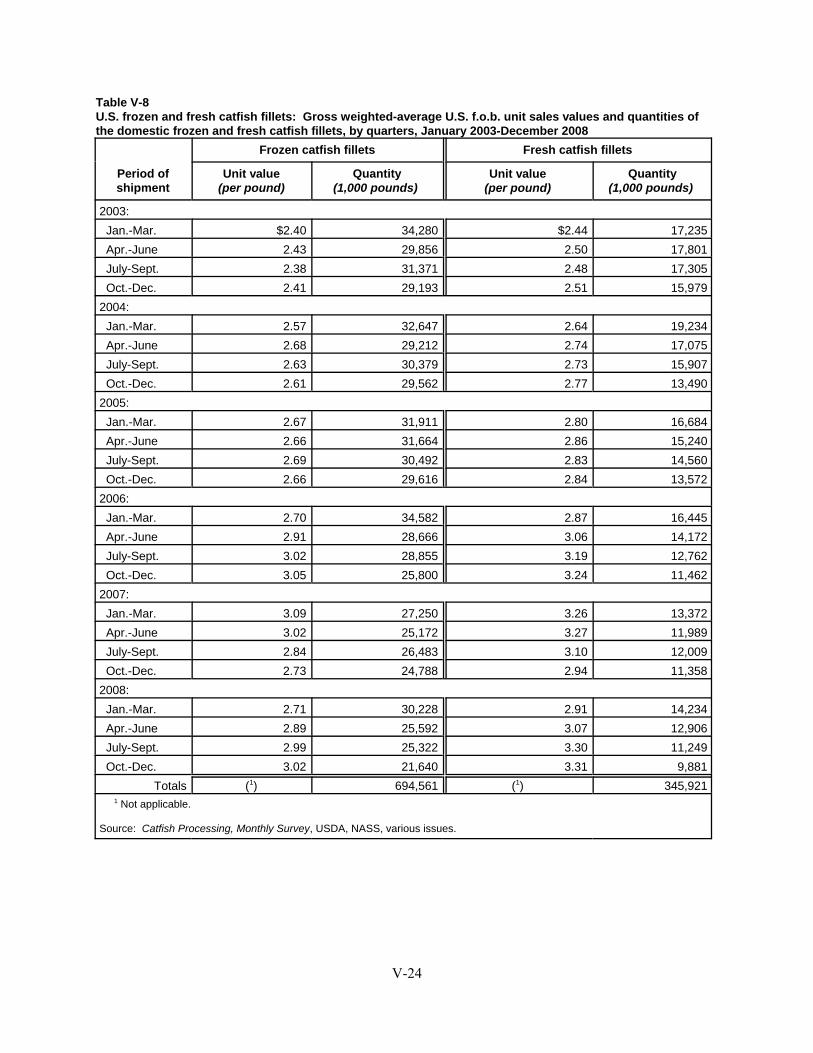
V-24
Table V-8U.S. frozen and fresh catfish fillets: Gross weighted-average U.S. f.o.b. unit sales values and quantities ofthe domestic frozen and fresh catfish fillets, by quarters, January 2003-December 2008
Period ofshipment
Frozen catfish fillets Fresh catfish fillets
Unit value(per pound)
Quantity(1,000 pounds)
Unit value(per pound)
Quantity(1,000 pounds)
2003: Jan.-Mar. $2.40 34,280 $2.44 17,235 Apr.-June 2.43 29,856 2.50 17,801 July-Sept. 2.38 31,371 2.48 17,305 Oct.-Dec. 2.41 29,193 2.51 15,9792004: Jan.-Mar. 2.57 32,647 2.64 19,234 Apr.-June 2.68 29,212 2.74 17,075 July-Sept. 2.63 30,379 2.73 15,907 Oct.-Dec. 2.61 29,562 2.77 13,4902005: Jan.-Mar. 2.67 31,911 2.80 16,684 Apr.-June 2.66 31,664 2.86 15,240 July-Sept. 2.69 30,492 2.83 14,560 Oct.-Dec. 2.66 29,616 2.84 13,5722006: Jan.-Mar. 2.70 34,582 2.87 16,445 Apr.-June 2.91 28,666 3.06 14,172 July-Sept. 3.02 28,855 3.19 12,762 Oct.-Dec. 3.05 25,800 3.24 11,4622007: Jan.-Mar. 3.09 27,250 3.26 13,372 Apr.-June 3.02 25,172 3.27 11,989 July-Sept. 2.84 26,483 3.10 12,009 Oct.-Dec. 2.73 24,788 2.94 11,3582008: Jan.-Mar. 2.71 30,228 2.91 14,234 Apr.-June 2.89 25,592 3.07 12,906 July-Sept. 2.99 25,322 3.30 11,249 Oct.-Dec. 3.02 21,640 3.31 9,881
Totals (1) 694,561 (1) 345,921 1 Not applicable.
Source: Catfish Processing, Monthly Survey, USDA, NASS, various issues.
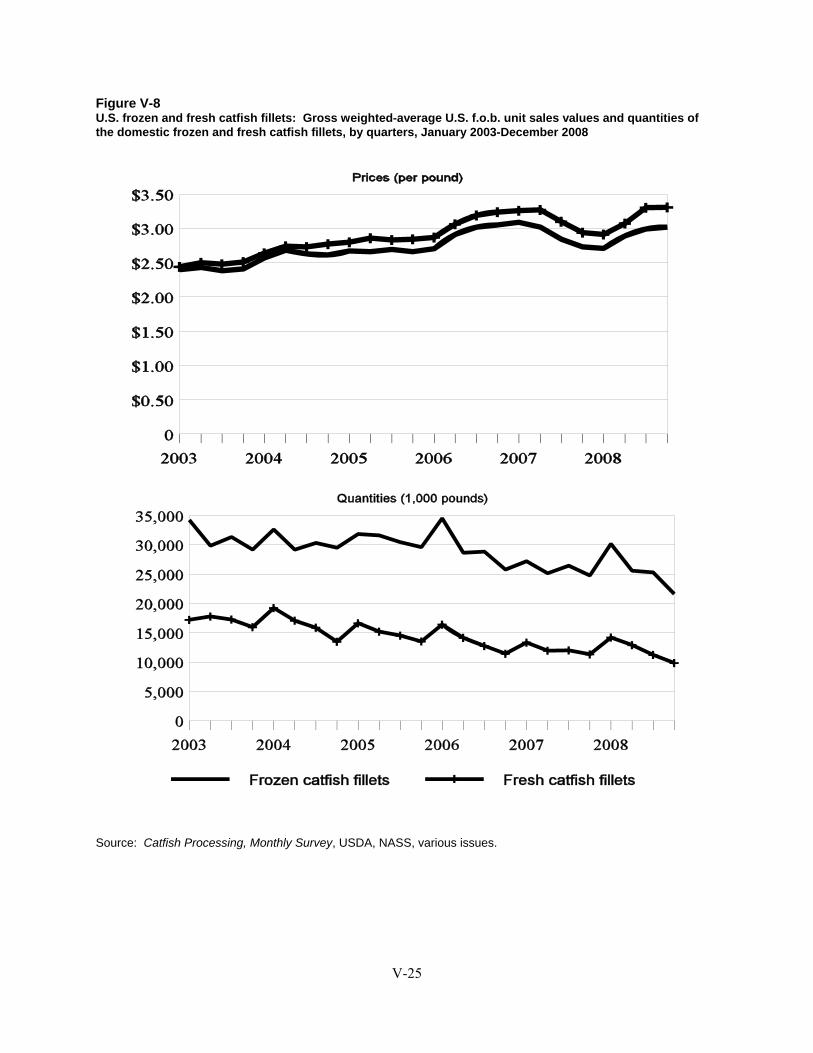
V-25
Figure V-8U.S. frozen and fresh catfish fillets: Gross weighted-average U.S. f.o.b. unit sales values and quantities ofthe domestic frozen and fresh catfish fillets, by quarters, January 2003-December 2008
Source: Catfish Processing, Monthly Survey, USDA, NASS, various issues.
48 The higher price of the fresh product compared to the frozen product may be due at least partially to thedifferences in shelf life. The fresh product has a shelf life of days compared to months for the frozen product, suchthat more of the fresh product is likely discarded than the frozen product. This factor and more careful handling ofthe fresh product likely raises costs of the fresh product compared to the frozen product. In addition, domesticinterested parties asserted that the increasing prices of the domestic fresh catfish fillets relative to prices the domesticfrozen catfish fillets was due to less competition of the fresh product with the imported products. Hearing transcript,p. 122 (Walker). 49 The quarterly unit values of both domestic frozen and fresh catfish fillets generally increased during 2003-08,and the correlation coefficient between the quarterly unit values of the frozen and fresh catfish fillets was 0.98during this period.
V-26
The U.S. processors sell about twice the quantity of frozen catfish fillets compared to freshcatfish fillets, but fresh catfish fillets are sold at higher prices than frozen catfish fillets.48 As seen intable V-8 and figure V-8, the U.S. processors produced a total of approximately 694.6 million pounds offrozen catfish fillets during 2003-08, and 345.9 million pounds of fresh catfish fillets during this period. At the same time, based on annual data, the unit value of fresh catfish fillets increased vis-a-vis frozencatfish fillets, from $0.07 per pound or 2.9 percent higher in 2003 to $0.24 per pound or 8.3 percenthigher in 2008.49 Although not shown, this latter differential remained about the same during January-February 2009, as unit values of the domestic frozen and fresh catfish fillets decreased somewhat at thebeginning of 2009.
A-1
APPENDIX A
FEDERAL REGISTER NOTICES AND STATEMENT ON ADEQUACY

37411 Federal Register / Vol. 73, No. 127 / Tuesday, July 1, 2008 / Notices
1 In comments made on the interim final sunset regulations, a number of parties stated that the proposed five-day period for rebuttals to substantive responses to a notice of initiation was insufficient. This requirement was retained in the final sunset regulations at 19 CFR 351.218(d)(4). As provided in 19 CFR 351.302(b), however, the Department will consider individual requests to extend that five-day deadline based upon a showing of good cause.
DEPARTMENT OF COMMERCE
International Trade Administration
Initiation of Five-year (‘‘Sunset’’) Review
AGENCY: Import Administration, International Trade Administration, Department of Commerce. SUMMARY: In accordance with section 751(c) of the Tariff Act of 1930, as amended (‘‘the Act’’), the Department of Commerce (‘‘the Department’’) is automatically initiating a five-year review (‘‘Sunset Review’’) of the antidumping and countervailing duty orders listed below. The International Trade Commission (‘‘the Commission’’) is publishing concurrently with this notice its notice of Institution of Five-
year Review which covers the same orders. EFFECTIVE DATE: July 1, 2008. FOR FURTHER INFORMATION CONTACT: The Department official identified in the Initiation of Review section below at AD/CVD Operations, Import Administration, International Trade Administration, U.S. Department of Commerce, 14th Street & Constitution Ave., NW, Washington, DC 20230. For information from the Commission contact Mary Messer, Office of Investigations, U.S. International Trade Commission at (202) 205–3193. SUPPLEMENTARY INFORMATION:
Background The Department’s procedures for the
conduct of Sunset Reviews are set forth
in its Procedures for Conducting Five- year (‘‘Sunset’’) Reviews of Antidumping and Countervailing Duty Orders, 63 FR 13516 (March 20, 1998) and 70 FR 62061 (October 28, 2005). Guidance on methodological or analytical issues relevant to the Department’s conduct of Sunset Reviews is set forth in the Department’s Policy Bulletin 98.3 - Policies Regarding the Conduct of Five-year (‘‘Sunset’’) Reviews of Antidumping and Countervailing Duty Orders: Policy Bulletin, 63 FR 18871 (April 16, 1998).
Initiation of Review
In accordance with 19 CFR 351.218(c), we are initiating the Sunset Review of the following antidumping and countervailing duty orders:
DOC Case No. ITC Case No. Country Product Department Contact
A–552–801 ......................... 731–TA–1012 Vietnam Frozen Fish Fillets Alex Villanueva (202) 482–3208 A–570–848 ......................... 731–TA–752
(Second Review) PRC Freshwater Crawfish Tail Meat Lyn Johnson (202) 482–5287
C–580–851 ........................ 701–TA–431 Korea Dynamic Random Access Memory Semiconductors
Nancy Decker (202) 482–0196
Filing Information
As a courtesy, we are making information related to Sunset proceedings, including copies of the pertinent statute and Department’s regulations, the Department schedule for Sunset Reviews, a listing of past revocations and continuations, and current service lists, available to the public on the Department’s sunset Internet Web site at the following address:
≥http://ia.ita.doc.gov/sunset/.’’ All submissions in these Sunset Reviews must be filed in accordance with the Department’s regulations regarding format, translation, service, and certification of documents. These rules can be found at 19 CFR 351.303.
Pursuant to 19 CFR 351.103 (c), the Department will maintain and make available a service list for these proceedings. To facilitate the timely preparation of the service list(s), it is requested that those seeking recognition as interested parties to a proceeding contact the Department in writing within 10 days of the publication of the Notice of Initiation.
Because deadlines in Sunset Reviews can be very short, we urge interested parties to apply for access to proprietary information under administrative protective order (‘‘APO’’) immediately following publication in the Federal Register of this notice of initiation by filing a notice of intent to participate. The Department’s regulations on
submission of proprietary information and eligibility to receive access to business proprietary information under APO can be found at 19 CFR 351.304– 306.
Information Required from Interested Parties
Domestic interested parties defined in section 771(9)(C), (D), (E), (F), and (G) of the Act and 19 CFR 351.102(b)) wishing to participate in a Sunset Review must respond not later than 15 days after the date of publication in the Federal Register of this notice of initiation by filing a notice of intent to participate. The required contents of the notice of intent to participate are set forth at 19 CFR 351.218(d)(1)(ii). In accordance with the Department’s regulations, if we do not receive a notice of intent to participate from at least one domestic interested party by the 15-day deadline, the Department will automatically revoke the order without further review. See 19 CFR 351.218(d)(1)(iii).
If we receive an order–specific notice of intent to participate from a domestic interested party, the Department’s regulations provide that all parties wishing to participate in the Sunset Review must file complete substantive responses not later than 30 days after the date of publication in the Federal Register of this notice of initiation. The required contents of a substantive response, on an order–specific basis, are set forth at 19 CFR 351.218(d)(3). Note
that certain information requirements differ for respondent and domestic parties. Also, note that the Department’s information requirements are distinct from the Commission’s information requirements. Please consult the Department’s regulations for information regarding the Department’s conduct of Sunset Reviews.1 Please consult the Department’s regulations at 19 CFR Part 351 for definitions of terms and for other general information concerning antidumping and countervailing duty proceedings at the Department.
This notice of initiation is being published in accordance with section 751(c) of the Act and 19 CFR 351.218 (c).
Dated: June 18, 2008.
Stephen J. Claeys, Deputy Assistant Secretaryfor Import Administration. [FR Doc. E8–14910 Filed 6–30–04; 8:45 am]
BILLING CODE 3510–DS–S
VerDate Aug<31>2005 21:01 Jun 30, 2008 Jkt 214001 PO 00000 Frm 00005 Fmt 4703 Sfmt 4703 E:\FR\FM\01JYN1.SGM 01JYN1srob
erts
on
PR
OD
1PC
70 w
ith N
OT
ICE
S
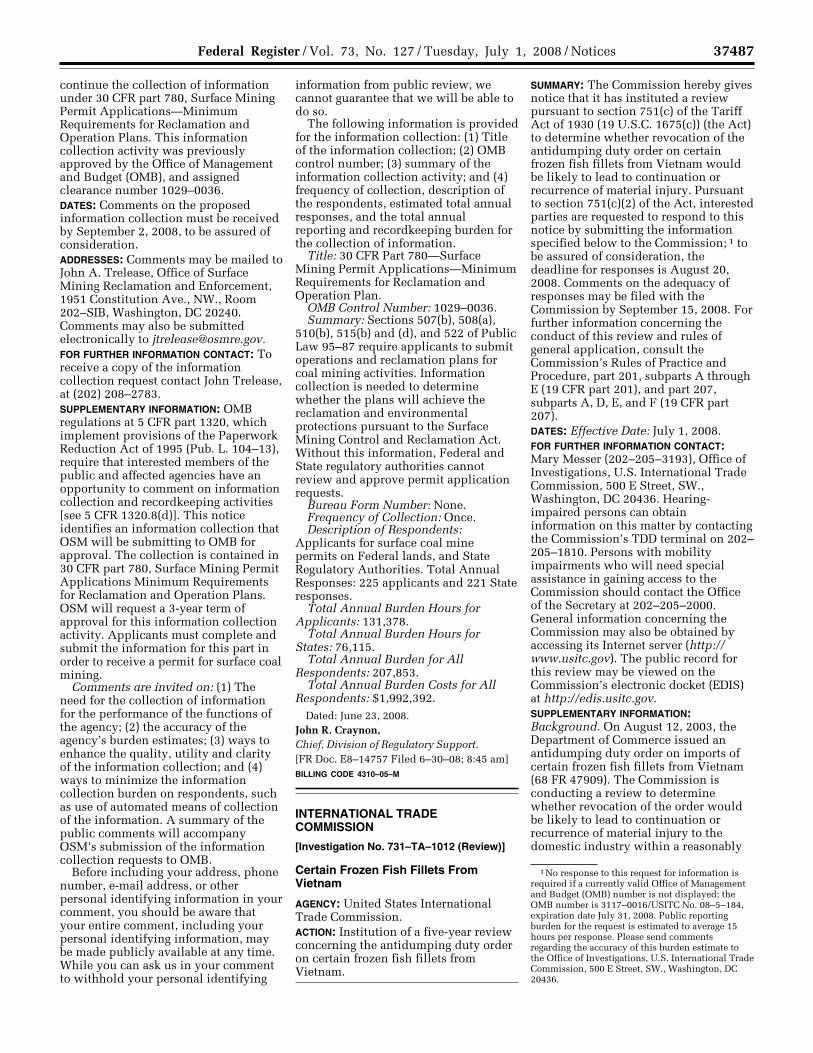
37487 Federal Register / Vol. 73, No. 127 / Tuesday, July 1, 2008 / Notices
1 No response to this request for information is required if a currently valid Office of Management and Budget (OMB) number is not displayed; the OMB number is 3117–0016/USITC No. 08–5–184, expiration date July 31, 2008. Public reporting burden for the request is estimated to average 15 hours per response. Please send comments regarding the accuracy of this burden estimate to the Office of Investigations, U.S. International Trade Commission, 500 E Street, SW., Washington, DC 20436.
continue the collection of information under 30 CFR part 780, Surface Mining Permit Applications—Minimum Requirements for Reclamation and Operation Plans. This information collection activity was previously approved by the Office of Management and Budget (OMB), and assigned clearance number 1029–0036. DATES: Comments on the proposed information collection must be received by September 2, 2008, to be assured of consideration. ADDRESSES: Comments may be mailed to John A. Trelease, Office of Surface Mining Reclamation and Enforcement, 1951 Constitution Ave., NW., Room 202–SIB, Washington, DC 20240. Comments may also be submitted electronically to [email protected]. FOR FURTHER INFORMATION CONTACT: To receive a copy of the information collection request contact John Trelease, at (202) 208–2783. SUPPLEMENTARY INFORMATION: OMB regulations at 5 CFR part 1320, which implement provisions of the Paperwork Reduction Act of 1995 (Pub. L. 104–13), require that interested members of the public and affected agencies have an opportunity to comment on information collection and recordkeeping activities [see 5 CFR 1320.8(d)]. This notice identifies an information collection that OSM will be submitting to OMB for approval. The collection is contained in 30 CFR part 780, Surface Mining Permit Applications Minimum Requirements for Reclamation and Operation Plans. OSM will request a 3-year term of approval for this information collection activity. Applicants must complete and submit the information for this part in order to receive a permit for surface coal mining.
Comments are invited on: (1) The need for the collection of information for the performance of the functions of the agency; (2) the accuracy of the agency’s burden estimates; (3) ways to enhance the quality, utility and clarity of the information collection; and (4) ways to minimize the information collection burden on respondents, such as use of automated means of collection of the information. A summary of the public comments will accompany OSM’s submission of the information collection requests to OMB.
Before including your address, phone number, e-mail address, or other personal identifying information in your comment, you should be aware that your entire comment, including your personal identifying information, may be made publicly available at any time. While you can ask us in your comment to withhold your personal identifying
information from public review, we cannot guarantee that we will be able to do so.
The following information is provided for the information collection: (1) Title of the information collection; (2) OMB control number; (3) summary of the information collection activity; and (4) frequency of collection, description of the respondents, estimated total annual responses, and the total annual reporting and recordkeeping burden for the collection of information.
Title: 30 CFR Part 780—Surface Mining Permit Applications—Minimum Requirements for Reclamation and Operation Plan.
OMB Control Number: 1029–0036. Summary: Sections 507(b), 508(a),
510(b), 515(b) and (d), and 522 of Public Law 95–87 require applicants to submit operations and reclamation plans for coal mining activities. Information collection is needed to determine whether the plans will achieve the reclamation and environmental protections pursuant to the Surface Mining Control and Reclamation Act. Without this information, Federal and State regulatory authorities cannot review and approve permit application requests.
Bureau Form Number: None. Frequency of Collection: Once. Description of Respondents:
Applicants for surface coal mine permits on Federal lands, and State Regulatory Authorities. Total Annual Responses: 225 applicants and 221 State responses.
Total Annual Burden Hours for Applicants: 131,378.
Total Annual Burden Hours for States: 76,115.
Total Annual Burden for All Respondents: 207,853.
Total Annual Burden Costs for All Respondents: $1,992,392.
Dated: June 23, 2008. John R. Craynon, Chief, Division of Regulatory Support. [FR Doc. E8–14757 Filed 6–30–08; 8:45 am] BILLING CODE 4310–05–M
INTERNATIONAL TRADE COMMISSION
[Investigation No. 731–TA–1012 (Review)]
Certain Frozen Fish Fillets From Vietnam
AGENCY: United States International Trade Commission. ACTION: Institution of a five-year review concerning the antidumping duty order on certain frozen fish fillets from Vietnam.
SUMMARY: The Commission hereby gives notice that it has instituted a review pursuant to section 751(c) of the Tariff Act of 1930 (19 U.S.C. 1675(c)) (the Act) to determine whether revocation of the antidumping duty order on certain frozen fish fillets from Vietnam would be likely to lead to continuation or recurrence of material injury. Pursuant to section 751(c)(2) of the Act, interested parties are requested to respond to this notice by submitting the information specified below to the Commission; 1 to be assured of consideration, the deadline for responses is August 20, 2008. Comments on the adequacy of responses may be filed with the Commission by September 15, 2008. For further information concerning the conduct of this review and rules of general application, consult the Commission’s Rules of Practice and Procedure, part 201, subparts A through E (19 CFR part 201), and part 207, subparts A, D, E, and F (19 CFR part 207). DATES: Effective Date: July 1, 2008. FOR FURTHER INFORMATION CONTACT: Mary Messer (202–205–3193), Office of Investigations, U.S. International Trade Commission, 500 E Street, SW., Washington, DC 20436. Hearing- impaired persons can obtain information on this matter by contacting the Commission’s TDD terminal on 202– 205–1810. Persons with mobility impairments who will need special assistance in gaining access to the Commission should contact the Office of the Secretary at 202–205–2000. General information concerning the Commission may also be obtained by accessing its Internet server (http:// www.usitc.gov). The public record for this review may be viewed on the Commission’s electronic docket (EDIS) at http://edis.usitc.gov. SUPPLEMENTARY INFORMATION: Background. On August 12, 2003, the Department of Commerce issued an antidumping duty order on imports of certain frozen fish fillets from Vietnam (68 FR 47909). The Commission is conducting a review to determine whether revocation of the order would be likely to lead to continuation or recurrence of material injury to the domestic industry within a reasonably
VerDate Aug<31>2005 21:01 Jun 30, 2008 Jkt 214001 PO 00000 Frm 00081 Fmt 4703 Sfmt 4703 E:\FR\FM\01JYN1.SGM 01JYN1srob
erts
on
PR
OD
1PC
70 w
ith N
OT
ICE
S
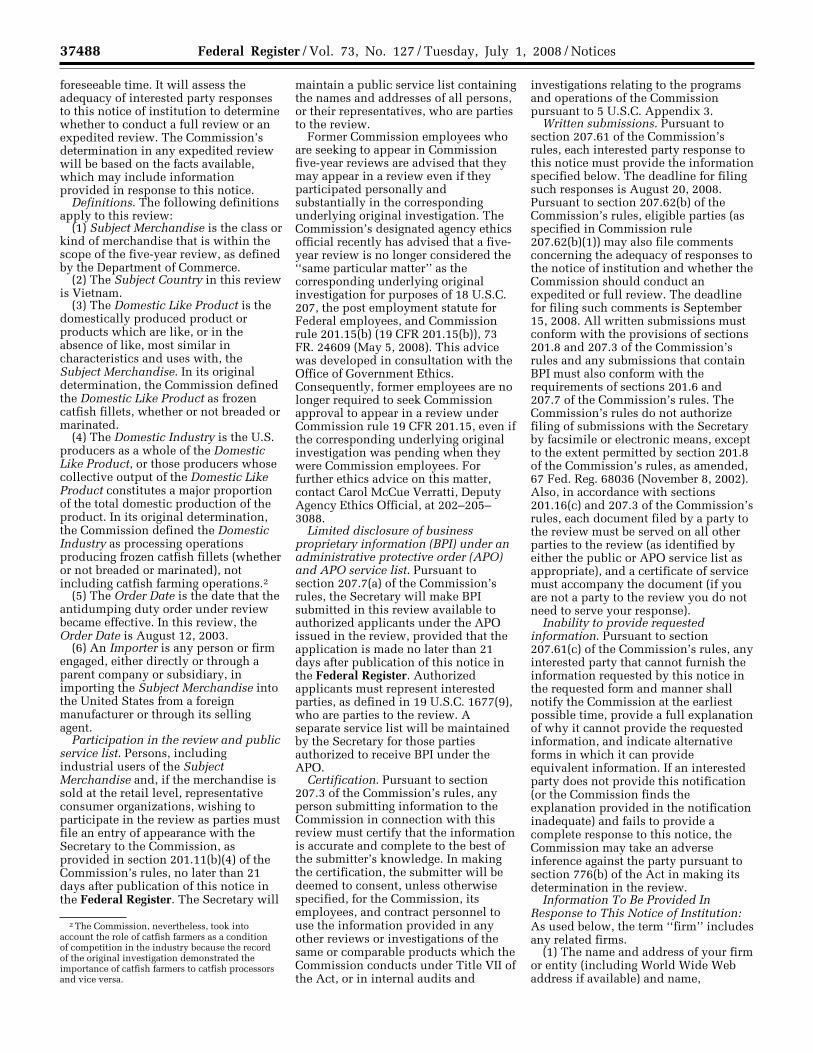
37488 Federal Register / Vol. 73, No. 127 / Tuesday, July 1, 2008 / Notices
2 The Commission, nevertheless, took into account the role of catfish farmers as a condition of competition in the industry because the record of the original investigation demonstrated the importance of catfish farmers to catfish processors and vice versa.
foreseeable time. It will assess the adequacy of interested party responses to this notice of institution to determine whether to conduct a full review or an expedited review. The Commission’s determination in any expedited review will be based on the facts available, which may include information provided in response to this notice.
Definitions. The following definitions apply to this review:
(1) Subject Merchandise is the class or kind of merchandise that is within the scope of the five-year review, as defined by the Department of Commerce.
(2) The Subject Country in this review is Vietnam.
(3) The Domestic Like Product is the domestically produced product or products which are like, or in the absence of like, most similar in characteristics and uses with, the Subject Merchandise. In its original determination, the Commission defined the Domestic Like Product as frozen catfish fillets, whether or not breaded or marinated.
(4) The Domestic Industry is the U.S. producers as a whole of the Domestic Like Product, or those producers whose collective output of the Domestic Like Product constitutes a major proportion of the total domestic production of the product. In its original determination, the Commission defined the Domestic Industry as processing operations producing frozen catfish fillets (whether or not breaded or marinated), not including catfish farming operations.2
(5) The Order Date is the date that the antidumping duty order under review became effective. In this review, the Order Date is August 12, 2003.
(6) An Importer is any person or firm engaged, either directly or through a parent company or subsidiary, in importing the Subject Merchandise into the United States from a foreign manufacturer or through its selling agent.
Participation in the review and public service list. Persons, including industrial users of the Subject Merchandise and, if the merchandise is sold at the retail level, representative consumer organizations, wishing to participate in the review as parties must file an entry of appearance with the Secretary to the Commission, as provided in section 201.11(b)(4) of the Commission’s rules, no later than 21 days after publication of this notice in the Federal Register. The Secretary will
maintain a public service list containing the names and addresses of all persons, or their representatives, who are parties to the review.
Former Commission employees who are seeking to appear in Commission five-year reviews are advised that they may appear in a review even if they participated personally and substantially in the corresponding underlying original investigation. The Commission’s designated agency ethics official recently has advised that a five- year review is no longer considered the ‘‘same particular matter’’ as the corresponding underlying original investigation for purposes of 18 U.S.C. 207, the post employment statute for Federal employees, and Commission rule 201.15(b) (19 CFR 201.15(b)), 73 FR. 24609 (May 5, 2008). This advice was developed in consultation with the Office of Government Ethics. Consequently, former employees are no longer required to seek Commission approval to appear in a review under Commission rule 19 CFR 201.15, even if the corresponding underlying original investigation was pending when they were Commission employees. For further ethics advice on this matter, contact Carol McCue Verratti, Deputy Agency Ethics Official, at 202–205– 3088.
Limited disclosure of business proprietary information (BPI) under an administrative protective order (APO) and APO service list. Pursuant to section 207.7(a) of the Commission’s rules, the Secretary will make BPI submitted in this review available to authorized applicants under the APO issued in the review, provided that the application is made no later than 21 days after publication of this notice in the Federal Register. Authorized applicants must represent interested parties, as defined in 19 U.S.C. 1677(9), who are parties to the review. A separate service list will be maintained by the Secretary for those parties authorized to receive BPI under the APO.
Certification. Pursuant to section 207.3 of the Commission’s rules, any person submitting information to the Commission in connection with this review must certify that the information is accurate and complete to the best of the submitter’s knowledge. In making the certification, the submitter will be deemed to consent, unless otherwise specified, for the Commission, its employees, and contract personnel to use the information provided in any other reviews or investigations of the same or comparable products which the Commission conducts under Title VII of the Act, or in internal audits and
investigations relating to the programs and operations of the Commission pursuant to 5 U.S.C. Appendix 3.
Written submissions. Pursuant to section 207.61 of the Commission’s rules, each interested party response to this notice must provide the information specified below. The deadline for filing such responses is August 20, 2008. Pursuant to section 207.62(b) of the Commission’s rules, eligible parties (as specified in Commission rule 207.62(b)(1)) may also file comments concerning the adequacy of responses to the notice of institution and whether the Commission should conduct an expedited or full review. The deadline for filing such comments is September 15, 2008. All written submissions must conform with the provisions of sections 201.8 and 207.3 of the Commission’s rules and any submissions that contain BPI must also conform with the requirements of sections 201.6 and 207.7 of the Commission’s rules. The Commission’s rules do not authorize filing of submissions with the Secretary by facsimile or electronic means, except to the extent permitted by section 201.8 of the Commission’s rules, as amended, 67 Fed. Reg. 68036 (November 8, 2002). Also, in accordance with sections 201.16(c) and 207.3 of the Commission’s rules, each document filed by a party to the review must be served on all other parties to the review (as identified by either the public or APO service list as appropriate), and a certificate of service must accompany the document (if you are not a party to the review you do not need to serve your response).
Inability to provide requested information. Pursuant to section 207.61(c) of the Commission’s rules, any interested party that cannot furnish the information requested by this notice in the requested form and manner shall notify the Commission at the earliest possible time, provide a full explanation of why it cannot provide the requested information, and indicate alternative forms in which it can provide equivalent information. If an interested party does not provide this notification (or the Commission finds the explanation provided in the notification inadequate) and fails to provide a complete response to this notice, the Commission may take an adverse inference against the party pursuant to section 776(b) of the Act in making its determination in the review.
Information To Be Provided In Response to This Notice of Institution: As used below, the term ‘‘firm’’ includes any related firms.
(1) The name and address of your firm or entity (including World Wide Web address if available) and name,
VerDate Aug<31>2005 21:01 Jun 30, 2008 Jkt 214001 PO 00000 Frm 00082 Fmt 4703 Sfmt 4703 E:\FR\FM\01JYN1.SGM 01JYN1srob
erts
on
PR
OD
1PC
70 w
ith N
OT
ICE
S
37489 Federal Register / Vol. 73, No. 127 / Tuesday, July 1, 2008 / Notices
1 No response to this request for information is required if a currently valid Office of Management and Budget (OMB) number is not displayed; the
Continued
telephone number, fax number, and E- mail address of the certifying official.
(2) A statement indicating whether your firm/entity is a U.S. producer of the Domestic Like Product, a U.S. union or worker group, a U.S. importer of the Subject Merchandise, a foreign producer or exporter of the Subject Merchandise, a U.S. or foreign trade or business association, or another interested party (including an explanation). If you are a union/worker group or trade/business association, identify the firms in which your workers are employed or which are members of your association.
(3) A statement indicating whether your firm/entity is willing to participate in this review by providing information requested by the Commission.
(4) A statement of the likely effects of the revocation of the antidumping duty order on the Domestic Industry in general and/or your firm/entity specifically. In your response, please discuss the various factors specified in section 752(a) of the Act (19 U.S.C. 1675a(a)) including the likely volume of subject imports, likely price effects of subject imports, and likely impact of imports of Subject Merchandise on the Domestic Industry.
(5) A list of all known and currently operating U.S. producers of the Domestic Like Product. Identify any known related parties and the nature of the relationship as defined in section 771(4)(B) of the Act (19 U.S.C. 1677(4)(B)).
(6) A list of all known and currently operating U.S. importers of the Subject Merchandise and producers of the Subject Merchandise in the Subject Country that currently export or have exported Subject Merchandise to the United States or other countries since the Order Date.
(7) If you are a U.S. producer of the Domestic Like Product, provide the following information on your firm’s operations on that product during calendar year 2007 (report quantity data in pounds and value data in U.S. dollars, f.o.b. plant). If you are a union/ worker group or trade/business association, provide the information, on an aggregate basis, for the firms in which your workers are employed/ which are members of your association.
(a) Production (quantity) and, if known, an estimate of the percentage of total U.S. production of the Domestic Like Product accounted for by your firm’s(s’) production;
(b) The quantity and value of U.S. commercial shipments of the Domestic Like Product produced in your U.S. plant(s); and
(c) The quantity and value of U.S. internal consumption/company
transfers of the Domestic Like Product produced in your U.S. plant(s).
(8) If you are a U.S. importer or a trade/business association of U.S. importers of the Subject Merchandise from the Subject Country, provide the following information on your firm’s(s’) operations on that product during calendar year 2007 (report quantity data in pounds and value data in U.S. dollars). If you are a trade/business association, provide the information, on an aggregate basis, for the firms which are members of your association.
(a) The quantity and value (landed, duty-paid but not including antidumping duties) of U.S. imports and, if known, an estimate of the percentage of total U.S. imports of Subject Merchandise from the Subject Country accounted for by your firm’s(s’) imports;
(b) The quantity and value (f.o.b. U.S. port, including antidumping duties) of U.S. commercial shipments of Subject Merchandise imported from the Subject Country; and
(c) The quantity and value (f.o.b. U.S. port, including antidumping duties) of U.S. internal consumption/company transfers of Subject Merchandise imported from the Subject Country.
(9) If you are a producer, an exporter, or a trade/business association of producers or exporters of the Subject Merchandise in the Subject Country, provide the following information on your firm’s(s’) operations on that product during calendar year 2007 (report quantity data in pounds and value data in U.S. dollars, landed and duty-paid at the U.S. port but not including antidumping duties). If you are a trade/business association, provide the information, on an aggregate basis, for the firms which are members of your association.
(a) Production (quantity) and, if known, an estimate of the percentage of total production of Subject Merchandise in the Subject Country accounted for by your firm’s(s’) production; and
(b) The quantity and value of your firm’s(s’) exports to the United States of Subject Merchandise and, if known, an estimate of the percentage of total exports to the United States of Subject Merchandise from the Subject Country accounted for by your firm’s(s’) exports.
(10) Identify significant changes, if any, in the supply and demand conditions or business cycle for the Domestic Like Product that have occurred in the United States or in the market for the Subject Merchandise in the Subject Country since the Order Date, and significant changes, if any, that are likely to occur within a reasonably foreseeable time. Supply
conditions to consider include technology; production methods; development efforts; ability to increase production (including the shift of production facilities used for other products and the use, cost, or availability of major inputs into production); and factors related to the ability to shift supply among different national markets (including barriers to importation in foreign markets or changes in market demand abroad). Demand conditions to consider include end uses and applications; the existence and availability of substitute products; and the level of competition among the Domestic Like Product produced in the United States, Subject Merchandise produced in the Subject Country, and such merchandise from other countries.
(11)(Optional) A statement of whether you agree with the above definitions of the Domestic Like Product and Domestic Industry; if you disagree with either or both of these definitions, please explain why and provide alternative definitions.
Authority: This review is being conducted under authority of title VII of the Tariff Act of 1930; this notice is published pursuant to section 207.61 of the Commission’s rules.
Issued: June 16, 2008. By order of the Commission.
Marilyn R. Abbott, Secretary to the Commission. [FR Doc. E8–14181 Filed 6–30–08; 8:45 am] BILLING CODE 7020–02–P
INTERNATIONAL TRADE COMMISSION
[Investigation No. 731–TA–752 (Second Review)]
Crawfish Tail Meat From China
AGENCY: United States International Trade Commission. ACTION: Institution of a five-year review concerning the antidumping duty order on crawfish tail meat from China.
SUMMARY: The Commission hereby gives notice that it has instituted a review pursuant to section 751(c) of the Tariff Act of 1930 (19 U.S.C. 1675(c)) (the Act) to determine whether revocation of the antidumping duty order on crawfish tail meat from China would be likely to lead to continuation or recurrence of material injury. Pursuant to section 751(c)(2) of the Act, interested parties are requested to respond to this notice by submitting the information specified below to the Commission; 1 to be assured of
VerDate Aug<31>2005 21:01 Jun 30, 2008 Jkt 214001 PO 00000 Frm 00083 Fmt 4703 Sfmt 4703 E:\FR\FM\01JYN1.SGM 01JYN1srob
erts
on
PR
OD
1PC
70 w
ith N
OT
ICE
S

62318 Federal Register / Vol. 73, No. 203 / Monday, October 20, 2008 / Notices
1 A record of the Commissioners’ votes, the Commission’s statement on adequacy, and any individual Commissioner’s statements will be available from the Office of the Secretary and at the Commission’s Web site.
2 The Commission has found the responses submitted by the Crawfish Processors Alliance to be individually adequate. Comments from other interested parties will not be accepted (see 19 CFR 207.62(d)(2)).
parties to the investigation (as identified by either the public or BPI service list), and a certificate of service must be timely filed. The Secretary will not accept a document for filing without a certificate of service.
Parties are also advised to consult with the Commission’s Rules of Practice and Procedure, part 201, subparts A through E (19 CFR part 201), and part 207, subpart A (19 CFR part 207) for provisions of general applicability concerning written submissions to the Commission.
By order of the Commission. Issued: October 14, 2008
Marilyn R. Abbott, Secretary to the Commission. [FR Doc. E8–24890 Filed 10–17–08; 8:45 am] BILLING CODE 7020–02–P
INTERNATIONAL TRADE COMMISSION
[Investigation No. 731–TA–1012 (Review)]
Certain Frozen Fish Fillets From Vietnam
AGENCY: United States International Trade Commission. ACTION: Notice of Commission determination to conduct a full five-year review concerning the antidumping duty order on certain frozen fish fillets from Vietnam.
SUMMARY: The Commission hereby gives notice that it will proceed with a full review pursuant to section 751(c)(5) of the Tariff Act of 1930 (19 U.S.C. 1675(c)(5)) to determine whether revocation of the antidumping duty order on certain frozen fish fillets from Vietnam would be likely to lead to continuation or recurrence of material injury within a reasonably foreseeable time. A schedule for the review will be established and announced at a later date. For further information concerning the conduct of this review and rules of general application, consult the Commission’s Rules of Practice and Procedure, part 201, subparts A through E (19 CFR part 201), and part 207, subparts A, D, E, and F (19 CFR part 207). DATES: Effective Date: October 6, 2008. FOR FURTHER INFORMATION CONTACT: Mary Messer (202–205–3193), Office of Investigations, U.S. International Trade Commission, 500 E Street, SW., Washington, DC 20436. Hearing- impaired persons can obtain information on this matter by contacting the Commission’s TDD terminal on 202– 205–1810. Persons with mobility impairments who will need special
assistance in gaining access to the Commission should contact the Office of the Secretary at 202–205–2000. General information concerning the Commission may also be obtained by accessing its Internet server (http:// www.usitc.gov). The public record for this review may be viewed on the Commission’s electronic docket (EDIS) at http://edis.usitc.gov. SUPPLEMENTARY INFORMATION: On October 6, 2008, the Commission determined that it should proceed to a full review in the subject five-year review pursuant to section 751(c)(5) of the Act. The Commission found that both the domestic and respondent interested party group responses to its notice of institution (73 FR 37487, July 1, 2008) were adequate. A record of the Commissioners’ votes, the Commission’s statement on adequacy, and any individual Commissioner’s statements will be available from the Office of the Secretary and at the Commission’s Web site.
Authority: This review is being conducted under authority of title VII of the Tariff Act of 1930; this notice is published pursuant to section 207.62 of the Commission’s rules.
By order of the Commission. Issued: October 14, 2008.
Marilyn R. Abbott, Secretary to the Commission. [FR Doc. E8–24894 Filed 10–17–08; 8:45 am] BILLING CODE 7020–02–P
INTERNATIONAL TRADE COMMISSION
[Investigation No. 731–TA–752 (Second Review)]
Crawfish Tail Meat From China
AGENCY: United States International Trade Commission. ACTION: Scheduling of an expedited five- year review concerning the antidumping duty order on crawfish tail meat from China.
SUMMARY: The Commission hereby gives notice of the scheduling of an expedited review pursuant to section 751(c)(3) of the Tariff Act of 1930 (19 U.S.C. 1675(c)(3)) (the Act) to determine whether revocation of the antidumping duty order on crawfish tail meat from China would be likely to lead to continuation or recurrence of material injury within a reasonably foreseeable time. For further information concerning the conduct of this review and rules of general application, consult the Commission’s Rules of Practice and Procedure, part 201, subparts A through E (19 CFR part 201), and part 207,
subparts A, D, E, and F (19 CFR part 207). DATES: Effective Date: October 6, 2008. FOR FURTHER INFORMATION CONTACT: Olympia DeRosa Hand (202–205–3182), Office of Investigations, U.S. International Trade Commission, 500 E Street, SW., Washington, DC 20436. Hearing-impaired persons can obtain information on this matter by contacting the Commission’s TDD terminal on 202– 205–1810. Persons with mobility impairments who will need special assistance in gaining access to the Commission should contact the Office of the Secretary at 202–205–2000. General information concerning the Commission may also be obtained by accessing its Internet server (http:// www.usitc.gov). The public record for this review may be viewed on the Commission’s electronic docket (EDIS) at http://edis.usitc.gov. SUPPLEMENTARY INFORMATION:
Background.—On October 6, 2008, the Commission determined that the domestic interested party group response to its notice of institution (73 FR 37489, July 1, 2008) of the subject five-year review was adequate and that the respondent interested party group response was inadequate. The Commission did not find any other circumstances that would warrant conducting a full review.1 Accordingly, the Commission determined that it would conduct an expedited review pursuant to section 751(c)(3) of the Act.
Staff report.—A staff report containing information concerning the subject matter of the review will be placed in the nonpublic record on October 30, 2008, and made available to persons on the Administrative Protective Order service list for this review. A public version will be issued thereafter, pursuant to section 207.62(d)(4) of the Commission’s rules.
Written submissions.—As provided in section 207.62(d) of the Commission’s rules, interested parties that are parties to the review and that have provided individually adequate responses to the notice of institution,2 and any party other than an interested party to the review, may file written comments with the Secretary on what determination the Commission should reach in the review. Comments are due on or before
VerDate Aug<31>2005 16:42 Oct 17, 2008 Jkt 217001 PO 00000 Frm 00073 Fmt 4703 Sfmt 4703 E:\FR\FM\20OCN1.SGM 20OCN1mst
ocks
till o
n P
RO
D1P
C66
with
NO
TIC
ES
2616 Federal Register / Vol. 74, No. 10 / Thursday, January 15, 2009 / Notices
• University of California-Davis, Shields Library, Documents Department, 100 NW Quad University of California, Davis, CA 95616–5292
• Merced County Public Library, 1312 South 7th Street, Los Banos, CA 93635– 4757
• Fresno County Public Library Government Publications, 2420 Mariposa Street, Fresno, CA 93721– 2204
• Stanislaus County Library, 1500 I Street, Modesto, CA 95354
• Resources Agency Library, 1416 Ninth Street, Suite 117, Sacramento, CA 95814–5510
• California State Library, 914 Capitol Mall, Suite E–29, Sacramento, CA 95814–4802
• University of California, Berkeley, Water Resources Archive, 410 O’Brien Hall, Berkeley, CA 94720–1718
If special accommodation is required, please contact Susan Mussett at 209– 826–9696 or [email protected] by January 30, 2009 to enable the Authority to secure the needed services.
Before including your name, address, phone number, e-mail address, or other personal identifying information in your comment, you should be aware that your entire comment—including your personal identifying information—may be made publicly available at any time. While you can ask us in your comment to withhold your personal identifying information from public review, we cannot guarantee that we will be able to do so.
Dated: December 11, 2008. John F. Davis, Deputy Regional Director, Mid-Pacific Region. [FR Doc. E9–723 Filed 1–14–09; 8:45 am] BILLING CODE 4310–MN–P
INTERNATIONAL TRADE COMMISSION
[Investigation No. 731–TA–1012 (Review)]
Certain Frozen Fish Fillets From Vietnam
AGENCY: United States International Trade Commission. ACTION: Scheduling of a full five-year review concerning the antidumping duty order on certain frozen fish fillets from Vietnam.
SUMMARY: The Commission hereby gives notice of the scheduling of a full review pursuant to section 751(c)(5) of the Tariff Act of 1930 (19 U.S.C. 1675(c)(5)) (the Act) to determine whether revocation of the antidumping duty order on certain frozen fish fillets from Vietnam would be likely to lead to
continuation or recurrence of material injury within a reasonably foreseeable time. For further information concerning the conduct of this review and rules of general application, consult the Commission’s Rules of Practice and Procedure, part 201, subparts A through E (19 CFR part 201), and part 207, subparts A, D, E, and F (19 CFR part 207). DATES: Effective Date: January 9, 2009. FOR FURTHER INFORMATION CONTACT: Russell Duncan (202–708–4727, [email protected]), Office of Investigations, U.S. International Trade Commission, 500 E Street, SW., Washington, DC 20436. Hearing- impaired persons can obtain information on this matter by contacting the Commission’s TDD terminal on 202– 205–1810. Persons with mobility impairments who will need special assistance in gaining access to the Commission should contact the Office of the Secretary at 202–205–2000. General information concerning the Commission may also be obtained by accessing its Internet server (http:// www.usitc.gov). The public record for this review may be viewed on the Commission’s electronic docket (EDIS) at http://edis.usitc.gov. SUPPLEMENTARY INFORMATION:
Background.—On October 6, 2008, the Commission determined that responses to its notice of institution of the subject five-year review were such that a full review pursuant to section 751(c)(5) of the Act should proceed (73 FR 62318, Monday, October 20, 2008). A record of the Commissioners’ votes, the Commission’s statement on adequacy, and any individual Commissioner’s statements are available from the Office of the Secretary and at the Commission’s Web site.
Participation in the review and public service list.—Persons, including industrial users of the subject merchandise and, if the merchandise is sold at the retail level, representative consumer organizations, wishing to participate in this review as parties must file an entry of appearance with the Secretary to the Commission, as provided in section 201.11 of the Commission’s rules, by 45 days after publication of this notice. A party that filed a notice of appearance following publication of the Commission’s notice of institution of the review need not file an additional notice of appearance. The Secretary will maintain a public service list containing the names and addresses of all persons, or their representatives, who are parties to the review.
Limited disclosure of business proprietary information (BPI) under an
administrative protective order (APO) and BPI service list.—Pursuant to section 207.7(a) of the Commission’s rules, the Secretary will make BPI gathered in this review available to authorized applicants under the APO issued in the review, provided that the application is made by 45 days after publication of this notice. Authorized applicants must represent interested parties, as defined by 19 U.S.C. 1677(9), who are parties to the review. A party granted access to BPI following publication of the Commission’s notice of institution of the review need not reapply for such access. A separate service list will be maintained by the Secretary for those parties authorized to receive BPI under the APO.
Staff report.—The prehearing staff report in the review will be placed in the nonpublic record on April 16, 2009, and a public version will be issued thereafter, pursuant to section 207.64 of the Commission’s rules.
Hearing.—The Commission will hold a hearing in connection with the review beginning at 9:30 a.m. on May 6, 2009, at the U.S. International Trade Commission Building. Requests to appear at the hearing should be filed in writing with the Secretary to the Commission on or before May 1, 2009. A nonparty who has testimony that may aid the Commission’s deliberations may request permission to present a short statement at the hearing. All parties and nonparties desiring to appear at the hearing and make oral presentations should attend a prehearing conference to be held at 9:30 a.m. on May 4, 2009, at the U.S. International Trade Commission Building. Oral testimony and written materials to be submitted at the public hearing are governed by sections 201.6(b)(2), 201.13(f), 207.24, and 207.66 of the Commission’s rules. Parties must submit any request to present a portion of their hearing testimony in camera no later than 7 business days prior to the date of the hearing.
Written submissions.—Each party to the review may submit a prehearing brief to the Commission. Prehearing briefs must conform with the provisions of section 207.65 of the Commission’s rules; the deadline for filing is April 27, 2009. Parties may also file written testimony in connection with their presentation at the hearing, as provided in section 207.24 of the Commission’s rules, and posthearing briefs, which must conform with the provisions of section 207.67 of the Commission’s rules. The deadline for filing posthearing briefs is May 15, 2009; witness testimony must be filed no later than two days before the hearing. In
VerDate Nov<24>2008 18:58 Jan 14, 2009 Jkt 217001 PO 00000 Frm 00109 Fmt 4703 Sfmt 4703 E:\FR\FM\15JAN1.SGM 15JAN1jlent
ini o
n P
RO
D1P
C65
with
NO
TIC
ES
2617 Federal Register / Vol. 74, No. 10 / Thursday, January 15, 2009 / Notices
addition, any person who has not entered an appearance as a party to the review may submit a written statement of information pertinent to the subject of the review on or before May 15, 2009. On June 8, 2009, the Commission will make available to parties all information on which they have not had an opportunity to comment. Parties may submit final comments on this information on or before June 10, 2009, but such final comments must not contain new factual information and must otherwise comply with section 207.68 of the Commission’s rules. All written submissions must conform with the provisions of section 201.8 of the Commission’s rules; any submissions that contain BPI must also conform with the requirements of sections 201.6, 207.3, and 207.7 of the Commission’s rules. The Commission’s rules do not authorize filing of submissions with the Secretary by facsimile or electronic means, except to the extent permitted by section 201.8 of the Commission’s rules, as amended, 67 FR 68036 (November 8, 2002). Even where electronic filing of a document is permitted, certain documents must also be filed in paper form, as specified in II (C) of the Commission’s Handbook on Electronic Filing Procedures, 67 FR 68168, 68173 (November 8, 2002).
Additional written submissions to the Commission, including requests pursuant to section 201.12 of the Commission’s rules, shall not be accepted unless good cause is shown for accepting such submissions, or unless the submission is pursuant to a specific request by a Commissioner or Commission staff.
In accordance with sections 201.16(c) and 207.3 of the Commission’s rules, each document filed by a party to the review must be served on all other parties to the review (as identified by either the public or BPI service list), and a certificate of service must be timely filed. The Secretary will not accept a document for filing without a certificate of service. Authority: This review is being conducted under authority of title VII of the Tariff Act of 1930; this notice is published pursuant to section 207.62 of the Commission’s rules.
Issued: January 12, 2009.
By order of the Commission.
Marilyn R. Abbott, Secretary to the Commission. [FR Doc. E9–800 Filed 1–14–09; 8:45 am]
BILLING CODE 7020–02–P
DEPARTMENT OF JUSTICE
Notice of Lodging of Consent Decree Under the Comprehensive Environmental Response, Compensation, and Liability Act (CERCLA)
Notice is hereby given that on January 9, 2009, a proposed Consent Decree (Decree) in United States v. Citibank Global Market Holdings, Inc., Civil Action No. 09–CV–4002–SAC, was lodged with the United States District Court for the District of Kansas.
In this action the United States, on behalf of the U.S. Environmental Protection Agency, sought to recover CERCLA response costs from Citibank Global Holdings, Inc. and U.S. Steel Corporation. The costs were incurred for the National Zinc Superfund Site (Site) in Cherryvale, Kansas. The Complaint alleges that Defendants are liable as successors to owners or operators of a smelter that was located and operated at the Site. The Decree would settle the government’s claim for past response costs in return for a total payment of $1 million into the Hazardous Substances Superfund.
The Department of Justice will receive for a period of thirty (30) days from the date of this publication comments relating to the Decree. Comments should be addressed to the Assistant Attorney General, Environment and Natural Resources Division, and either e-mailed to [email protected] or mailed to P.O. Box 7611, U.S. Department of Justice, Washington, DC 20044–7611, and should refer to United States v. Citibank Global Market Holdings, Inc., D.J. Ref. 90–11–3–08705/ 1.
The Decree may be examined at the Office of the United States Attorney, 1200 Epic Center, 301 N. Main, Wichita, Kansas 67202. During the public comment period, the Decree, may also be examined on the following Department of Justice Web site, to http://www.usdoj.gov/enrd/ Consent_Decrees.html. A copy of the Decree may also be obtained by mail from the Consent Decree Library, P.O. Box 7611, U.S. Department of Justice, Washington, DC 20044–7611 or by faxing or e-mailing a request to Tonia Fleetwood ([email protected]), fax no. (202) 514–0097, phone confirmation number (202) 514–1547. In requesting a copy from the Consent Decree Library, please enclose a check in the amount of $4.25 (25 cents per page reproduction cost) payable to the U.S. Treasury or, if by e-mail or fax, forward a check in that amount to the
Consent Decree Library at the stated address.
Robert E. Maher, Jr., Assistant Chief, Environmental Enforcement Section, Environment and Natural Resources Division. [FR Doc. E9–709 Filed 1–14–09; 8:45 am] BILLING CODE 4410–15–P
DEPARTMENT OF JUSTICE
Bureau of Alcohol, Tobacco, Firearms and Explosives
[OMB Number 1140–0051]
Agency Information Collection Activities: Proposed Collection; Comments Requested
ACTION: 60-Day Notice of Information Collection Under Review: Certification of Secure Gun Storage or Safety Devices.
The Department of Justice (DOJ), Bureau of Alcohol, Tobacco, Firearms and Explosives (ATF), will be submitting the following information collection request to the Office of Management and Budget (OMB) for review and approval in accordance with the Paperwork Reduction Act of 1995. The proposed information collection is published to obtain comments from the public and affected agencies. Comments are encouraged and will be accepted for ‘‘sixty days’’ until March 16, 2009. This process is conducted in accordance with 5 CFR 1320.10.
If you have comments especially on the estimated public burden or associated response time, suggestions, or need a copy of the proposed information collection instrument with instructions or additional information, please contact Patricia Power, Chief, Federal Firearms Licensing Center, 244 Needy Road, Martinsburg, WV 25405.
Written comments and suggestions from the public and affected agencies concerning the proposed collection of information are encouraged. Your comments should address one or more of the following four points:
—Evaluate whether the proposed collection of information is necessary for the proper performance of the functions of the agency, including whether the information will have practical utility;
—Evaluate the accuracy of the agency’s estimate of the burden of the proposed collection of information, including the validity of the methodology and assumptions used;
—Enhance the quality, utility, and clarity of the information to be collected; and
VerDate Nov<24>2008 18:58 Jan 14, 2009 Jkt 217001 PO 00000 Frm 00110 Fmt 4703 Sfmt 4703 E:\FR\FM\15JAN1.SGM 15JAN1jlent
ini o
n P
RO
D1P
C65
with
NO
TIC
ES
5819 Federal Register / Vol. 74, No. 20 / Monday, February 2, 2009 / Notices
Dated: January 26, 2009. Ronald Lorentzen, Acting Assistant Secretary for Import Administration. [FR Doc. E9–2182 Filed 1–30–09; 8:45 am] BILLING CODE 3510–DS–P
DEPARTMENT OF COMMERCE
International Trade Administration
Applications for Duty-Free Entry of Scientific Instruments
Pursuant to Section 6(c) of the Educational, Scientific and Cultural Materials Importation Act of 1966 (Pub. L. 89–651, as amended by Pub. L. 106– 36; 80 Stat. 897; 15 CFR part 301), we invite comments on the question of whether instruments of equivalent scientific value, for the purposes for which the instruments shown below are intended to be used, are being manufactured in the United States.
Comments must comply with 15 CFR 301.5(a)(3) and (4) of the regulations and be postmarked on or before February 23, 2009. Address written comments to Statutory Import Programs Staff, Room 3720, U.S. Department of Commerce, Washington, DC 20230. Applications may be examined between 8:30 a.m. and 5 p.m. at the U.S. Department of Commerce in Room 3720.
Docket Number: 08–054. Applicant: University of Wisconsin—Madison, Purchasing Services, 21 N. Park Street, Suite 6101, Madison, WI 53715–1218. Instrument: FEI Titan 80–200 Electron Microscope. Manufacturer: FEI Company, Czech Republic. Intended Use: The instrument will be used to measure the structure, composition and bonding of a wide variety of materials and phenomena, such as semiconducting and metallic glasses, superconductors including magnesium diboride, semiconductors including zinc oxide, geochemical reactions confined to natural nanopores in minerals, nanotubes of titanium dioxide and related oxides with and without loading of catalytic nanoparticles, and metal nanoparticles used as labels in cells. Application accepted by Commissioner of Customs: October 8, 2008.
Docket Number: 08–059. Applicant: Emory University, 1599 Clifton Road, 4th Floor, Atlanta, GA 30322–4250. Instrument: Electron Microscope, Model JEM–1011. Manufacturer: JEOL, Japan. Intended Use: The instrument will be used in anatomical studies to help students understand a disease such as Parkinson’s. Specifically, students will be able to visualize axonal tracers after intracerebral injection, perfusion,
sectioning, incubations, EM processing, embedding, ultra-thin sectioning and observation at the electron microscope level. Application accepted by Commissioner of Customs: December 16, 2008.
Docket Number: 08–060. Applicant: University of Arizona, Department of Chemistry, 1306 E. University Boulevard, Tucson, AZ 85721. Instrument: FEI Inspect S Scanning Electron Microscope. Manufacturer: FEI Company, Czech Republic. Intended Use: The instrument will be used to characterize a wide variety of materials in terms of surface morphology and chemical composition. It will also be used as the base system for an electron beam lithography module which will be used to pattern and characterize nano- scale features that represent the next generation of molecular electronic devices, and as the base system for an Energy Dispersive Spectrometer that will allow the chemical mapping at the same resolution as the SEM images. Application accepted by Commissioner of Customs: December 16, 2008.
Dated: January 27, 2009. Chris Cassel, Director, Statutory Import Programs Staff, Import Administration. [FR Doc. E9–2194 Filed 1–30–09; 8:45 am] BILLING CODE 3510–DS–P
DEPARTMENT OF COMMERCE
International Trade Administration
[A–552–801]
Certain Frozen Fish Fillets From the Socialist Republic of Vietnam: Notice of Final Results of Expedited Sunset Review of Antidumping Duty Order
AGENCY: Import Administration, International Trade Administration, Department of Commerce. DATES: Effective Date: February 2, 2009. SUMMARY: On July 1, 2008, the Department of Commerce (‘‘Department’’) initiated a sunset review of the antidumping duty order on certain frozen fish fillets (‘‘fish fillets’’) from the Socialist Republic of Vietnam (‘‘Vietnam’’). On the basis of a notice of intent to participate, and an adequate substantive response filed on behalf of domestic interested parties, as well as a lack of response from respondent interested parties, the Department conducted an expedited sunset review. As a result of the sunset review, the Department finds that revocation of the antidumping duty order would be likely to lead to continuation or recurrence of dumping.
The dumping margins are identified in the Final Results of Review section of this notice. FOR FURTHER INFORMATION CONTACT: Matthew Renkey, AD/CVD Operations, Office 8, Import Administration, International Trade Administration, U.S. Department of Commerce, 14th Street and Constitution Avenue, NW., Washington, DC 20230; telephone: (202) 482–2312. SUPPLEMENTARY INFORMATION:
Background
On July 1, 2008, the Department published the notice of initiation of the sunset review of the antidumping duty order on fish fillets from Vietnam pursuant to section 751(c) of the Tariff Act of 1930, as amended (‘‘the Act’’). See Initiation of Five-Year (‘‘Sunset’’) Review, 73 FR 37411 (July 1, 2008). On July 16, 2008, the Department received a notice of intent to participate from the Catfish Farmers of America (‘‘CFA’’) and individual U.S. catfish processors, America’s Catch, Consolidated Catfish Companies, LLC dba Country Select Catfish, Delta Pride Catfish, Inc., Harvest Select Catfish, Inc. dba Alabama Catfish Inc., Heartland Catfish Company, Magnolia Processing, Inc. dba Pride of the Pond, Simmons Farm Raised Catfish, Inc., and Southern Pride Catfish Company LLC (collectively, ‘‘Petitioners’’). Submissions of the notices of intent to participate filed by Petitioners were within the deadline specified in section 351.218(d)(1)(i) of the Department’s regulations. The domestic interested parties claimed interested party status under section 771(9)(C) and (G) of the Act as they comprise domestic producers of fish fillets in the United States and a trade association representative of the industry. On July 31, 2008, the Department received a substantive response from the domestic interested parties within the deadline specified in section 351.218(d)(3)(i) of the Department’s regulations. We did not receive responses from any respondent interested parties to this proceeding. As a result, pursuant to section 751(c)(3)(B) of the Act and section 351.218(e)(1)(ii)(C)(2) of the Department’s regulations, the Department determined to conduct an expedited review of the order.
Scope of the Order
The product covered by this Order is frozen fish fillets, including regular, shank, and strip fillets and portions thereof, whether or not breaded or marinated, of the species Pangasius Bocourti, Pangasius Hypophthalmus
VerDate Nov<24>2008 15:03 Jan 30, 2009 Jkt 217001 PO 00000 Frm 00008 Fmt 4703 Sfmt 4703 E:\FR\FM\02FEN1.SGM 02FEN1dwas
hing
ton3
on
PR
OD
1PC
60 w
ith N
OT
ICE
S
5820 Federal Register / Vol. 74, No. 20 / Monday, February 2, 2009 / Notices
1 Until July 1, 2004, these products were classifiable under tariff article codes 0304.20.60.30 (Frozen Catfish Fillets), 0304.20.60.96 (Frozen Fish
Fillets, NESOI), 0304.20.60.43 (Frozen Freshwater Fish Fillets) and 0304.20.60.57 (Frozen Sole Fillets) of the HTSUS. Until February 1, 2007, these
products were classifiable under tariff article code 0304.20.60.33 (Frozen Fish Fillets of the species Pangasius including basa and tra) of the HTSUS.
(also known as Pangasius Pangasius), and Pangasius Micronemus. Frozen fish fillets are lengthwise cuts of whole fish. The fillet products covered by the scope include boneless fillets with the belly flap intact (‘‘regular’’ fillets), boneless fillets with the belly flap removed (‘‘shank’’ fillets), boneless shank fillets cut into strips (‘‘fillet strips/finger’’), which include fillets cut into strips, chunks, blocks, skewers, or any other shape. Specifically excluded from the scope are frozen whole fish (whether or not dressed), frozen steaks, and frozen belly-flap nuggets. Frozen whole dressed fish are deheaded, skinned, and eviscerated. Steaks are bone-in, cross- section cuts of dressed fish. Nuggets are the belly-flaps. The subject merchandise will be hereinafter referred to as frozen ‘‘basa’’ and ‘‘tra’’ fillets, which are the Vietnamese common names for these species of fish. These products are classifiable under tariff article codes 1604.19.4000, 1604.19.5000,
0305.59.4000, 0304.29.6033 (Frozen Fish Fillets of the species Pangasius including basa and tra) of the Harmonized Tariff Schedule of the United States (‘‘HTSUS’’).1 This Order covers all frozen fish fillets meeting the above specification, regardless of tariff classification. Although the HTSUS subheading is provided for convenience and customs purposes, our written description of the scope of the Order is dispositive.
Analysis of Comments Received All issues raised in this review are
addressed in the ‘‘Issues and Decision Memorandum’’ (‘‘Decision Memorandum’’) from John M. Andersen, Acting Deputy Assistant Secretary for Import Administration, to Ronald K. Lorentzen, Acting Assistant Secretary for Import Administration, which is hereby adopted by this notice. The issues discussed in the Decision Memorandum include the likelihood of
continuation or recurrence of dumping and the magnitude of the margins likely to prevail if the order were revoked. Parties can find a complete discussion of all issues raised in this review and the corresponding recommendations in this public memorandum, which is on file in the Central Records Unit in room 1117 of the main Commerce building.
In addition, a complete version of the Decision Memorandum can be accessed directly on the Web at http:// ia.ita.doc.gov/frn. The paper copy and electronic version of the Decision Memorandum are identical in content.
Final Results of Review
Pursuant to sections 752(c)(1) and (3) of the Act, we determine that revocation of the antidumping duty order on fish fillets from Vietnam would be likely to lead to continuation or recurrence of dumping at the following weighted- average percentage margins:
Manufacturers/exporters/producers
Weighted- average margin
(percent)
An Giang Fisheries Import and Export Joint Stock Company (‘‘Agifish’’) ............................................................................................... 47.05 Vinh Hoan Company Limited (‘‘Vinh Hoan’’) ........................................................................................................................................... 36.84 Nam Viet Company Limited (‘‘Nam Viet’’) ............................................................................................................................................... 53.68 Can Tho Agricultural and Animal Products Import Export Company (‘‘CATACO’’) ................................................................................ 45.81 An Giang Agriculture and Food Import Export Company (‘‘Afiex’’) ........................................................................................................ 45.55 Can Tho Animal Fishery Products Processing Export Enterprise (‘‘CAFATEX’’) ................................................................................... 45.55 Da Nang Seaproducts Import-Export Corporation (‘‘Da Nang’’) ............................................................................................................. 45.55 Mekongfish Company (‘‘Mekonimex’’) ..................................................................................................................................................... 45.55 QVD Food Company Limited (‘‘QVD’’) .................................................................................................................................................... 45.55 Viet Hai Seafood Company Limited (‘‘Viet Hai’’) ..................................................................................................................................... 45.55 Vinh Long Import-Export Company (‘‘Vinh Long’’) .................................................................................................................................. 45.55 Vietnam-Wide .......................................................................................................................................................................................... 63.88
This notice also serves as the only reminder to parties subject to administrative protective orders (‘‘APO’’) of their responsibility concerning the return or destruction of proprietary information disclosed under APO in accordance with section 351.305 of the Department’s regulations. Timely notification of the return or destruction of APO materials or conversion to judicial protective order is hereby requested. Failure to comply with the regulations and terms of an APO is a violation which is subject to sanction.
We are issuing and publishing the results and notice in accordance with sections 751(c), 752(c), and 777(i)(1) of the Act.
Dated: January 27, 2009. Ronald K. Lorentzen, Acting Assistant Secretary for Import Administration. [FR Doc. E9–2195 Filed 1–30–09; 8:45 am] BILLING CODE 3510–DS–P
DEPARTMENT OF COMMERCE
International Trade Administration
House Ear Institute, et al.; Notice of Consolidated Decision on Applications for Duty-Free Entry of Electron Microscopes
This is a decision consolidated pursuant to Section 6(c) of the Educational, Scientific, and Cultural Materials Importation Act of 1966 (Pub. L. 89–651, as amended by Pub. L. 106–
36; 80 Stat. 897; 15 CFR part 301). Related records can be viewed between 8:30 a.m. and 5 p.m. in Room 2104, U.S. Department of Commerce, 14th and Constitution Avenue, NW., Washington, DC.
Docket Number: 08–055. Applicant: House Ear Institute, Los Angeles, CA 90057. Instrument: Electron Microscope, Model Technai G2 20 TEM. Manufacturer: FEI Company, Czech Republic. Intended Use: See notice at 73 FR 74703, December 9, 2008.
Docket Number: 08–057. Applicant: Louisiana State University, Baton Rouge, LA 70803. Instrument: Electron Microscope, Model FEI Quanta 3D FEG DualBeam. Manufacturer: FEI Company, the Netherlands. Intended Use: See notice at 73 FR 70961, November 24, 2008.
VerDate Nov<24>2008 15:03 Jan 30, 2009 Jkt 217001 PO 00000 Frm 00009 Fmt 4703 Sfmt 4703 E:\FR\FM\02FEN1.SGM 02FEN1dwas
hing
ton3
on
PR
OD
1PC
60 w
ith N
OT
ICE
S
EXPLANATION OF COMMISSION DETERMINATION ON ADEQUACY
in
Frozen Fish Fillets from Vietnam Inv. No. 731-TA-1012 (Review)
On October 6, 2008, the Commission determined that it will proceed to a full review inthe subject five-year review pursuant to section 751(c)(3)(B) of the Tariff Act of 1930, asamended, 19 U.S.C. § 1675(c)(3)(B).
The Commission received a response to the notice of institution of the five-year reviewof the antidumping duty order on imports of frozen fish fillets from the Catfish Farmers ofAmerica and the following U.S. catfish processors: America’s Catch, Inc.; Consolidated CatfishCompanies, LLC, dba Country Select Catfish; Delta Pride Catfish, Inc.; Alabama Catfish Inc.,dba Harvest Select Catfish, Inc.; TT&W Farm Products, Inc., dba Heartland Catfish Co.;Magnolia Processing, Inc., dba Pride of the Pond; Simmons Farm Raised Catfish, Inc.; andSouthern Pride Catfish Co. LLC. The Commission found this domestic interested party responseto the notice of institution to be individually adequate. Because these companies account for themajority of U.S. production of the domestic like product, frozen catfish fillets, the Commissiondetermined that the domestic interested party group response was adequate.
The Commission received one response to the notice of institution from the VietnamAssociation of Seafood Exporters and Producers and 24 member companies that produce and/orexport the subject merchandise. The Commission found this respondent interested partyresponse to the notice of institution to be individually adequate for the association and the 24member companies. Because the Commission received an adequate response from foreignproducers accounting for the majority of the subject exports from Vietnam, the Commissiondetermined that the respondent interested party group response was adequate. Accordingly, theCommission determined to proceed to a full review.
A record of the Commissioners’ votes is available from the Office of the Secretary andthe Commission’s web site (http://www.usitc.gov).

B-1
APPENDIX B
HEARING WITNESSES

CALENDAR OF PUBLIC HEARING
Those listed below appeared as witnesses at the United States International TradeCommission’s hearing:
Subject: Certain Frozen Fish Fillets from Vietnam
Inv. No.: 731-TA-1012 (Review)
Date and Time: May 6, 2009 - 9:30 a.m.
Sessions were held in connection with this review in the Main Hearing Room, 500 E Street(room 101), SW, Washington, D.C.
OPENING REMARKS:
In Support of Continuation of Order (Valerie A. Slater, Akin GumpStrauss Hauer & Feld LLP)
In Support of Continuation of Antidumping Duty Order:
Akin Gump Strauss Hauer & Feld LLPWashington, D.C.on behalf of
Catfish Farmers of AmericaAmerica’s CatchConsolidated Catfish Companies, LLC D/B/A Country Select CatfishDelta Pride Catfish, Inc.Harvest Select Catfish, Inc.Heartland Catfish CompanyPride of the PondSimmons Farm Raised Catfish, Inc.
Danny Walker, Chief Executive Officer, HeartlandCatfish Company
Randy Rhodes, President, Harvest Select Catfish, Inc.
In Support of Continuation of Antidumping Duty Order (continued):
Ray Renfroe, National Accounts and SouthernRegional Manager, Harvest Select Catfish, Inc.
Joey Lowery, President, Catfish Farmers of America
Daniel W. Klett, Economist, Capital Trade, Inc.
Thomas Rogers, Economist, Capital Trade, Inc.
Valerie A. Slater )J. David Park )
) – OF COUNSELJarrod M. Goldfeder )Natalya D. Dobrowolsky )
CLOSING REMARKS:
In Support of Continuation of Order (Valerie A. Slater, Akin GumpStrauss Hauer & Feld LLP)

C-1
APPENDIX C
SUMMARY DATA

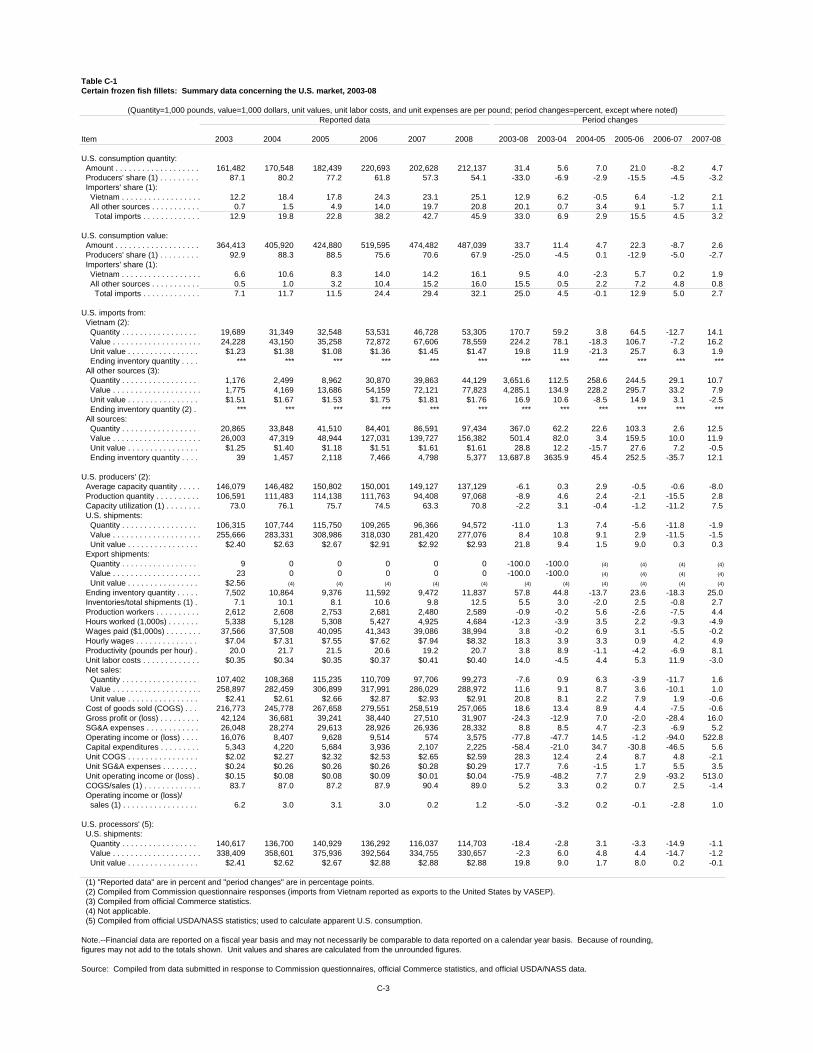
Table C-1Certain frozen fish fillets: Summary data concerning the U.S. market, 2003-08
(Quantity=1,000 pounds, value=1,000 dollars, unit values, unit labor costs, and unit expenses are per pound; period changes=percent, except where noted)Reported data Period changes
Item 2003 2004 2005 2006 2007 2008 2003-08 2003-04 2004-05 2005-06 2006-07 2007-08
U.S. consumption quantity: Amount . . . . . . . . . . . . . . . . . . . 161,482 170,548 182,439 220,693 202,628 212,137 31.4 5.6 7.0 21.0 -8.2 4.7 Producers' share (1) . . . . . . . . . 87.1 80.2 77.2 61.8 57.3 54.1 -33.0 -6.9 -2.9 -15.5 -4.5 -3.2 Importers' share (1): Vietnam . . . . . . . . . . . . . . . . . . 12.2 18.4 17.8 24.3 23.1 25.1 12.9 6.2 -0.5 6.4 -1.2 2.1 All other sources . . . . . . . . . . . 0.7 1.5 4.9 14.0 19.7 20.8 20.1 0.7 3.4 9.1 5.7 1.1 Total imports . . . . . . . . . . . . . 12.9 19.8 22.8 38.2 42.7 45.9 33.0 6.9 2.9 15.5 4.5 3.2
U.S. consumption value: Amount . . . . . . . . . . . . . . . . . . . 364,413 405,920 424,880 519,595 474,482 487,039 33.7 11.4 4.7 22.3 -8.7 2.6 Producers' share (1) . . . . . . . . . 92.9 88.3 88.5 75.6 70.6 67.9 -25.0 -4.5 0.1 -12.9 -5.0 -2.7 Importers' share (1): Vietnam . . . . . . . . . . . . . . . . . . 6.6 10.6 8.3 14.0 14.2 16.1 9.5 4.0 -2.3 5.7 0.2 1.9 All other sources . . . . . . . . . . . 0.5 1.0 3.2 10.4 15.2 16.0 15.5 0.5 2.2 7.2 4.8 0.8 Total imports . . . . . . . . . . . . . 7.1 11.7 11.5 24.4 29.4 32.1 25.0 4.5 -0.1 12.9 5.0 2.7
U.S. imports from: Vietnam (2): Quantity . . . . . . . . . . . . . . . . . . 19,689 31,349 32,548 53,531 46,728 53,305 170.7 59.2 3.8 64.5 -12.7 14.1 Value . . . . . . . . . . . . . . . . . . . . 24,228 43,150 35,258 72,872 67,606 78,559 224.2 78.1 -18.3 106.7 -7.2 16.2 Unit value . . . . . . . . . . . . . . . . $1.23 $1.38 $1.08 $1.36 $1.45 $1.47 19.8 11.9 -21.3 25.7 6.3 1.9 Ending inventory quantity . . . . *** *** *** *** *** *** *** *** *** *** *** *** All other sources (3): Quantity . . . . . . . . . . . . . . . . . . 1,176 2,499 8,962 30,870 39,863 44,129 3,651.6 112.5 258.6 244.5 29.1 10.7 Value . . . . . . . . . . . . . . . . . . . . 1,775 4,169 13,686 54,159 72,121 77,823 4,285.1 134.9 228.2 295.7 33.2 7.9 Unit value . . . . . . . . . . . . . . . . $1.51 $1.67 $1.53 $1.75 $1.81 $1.76 16.9 10.6 -8.5 14.9 3.1 -2.5 Ending inventory quantity (2) . . *** *** *** *** *** *** *** *** *** *** *** *** All sources: Quantity . . . . . . . . . . . . . . . . . . 20,865 33,848 41,510 84,401 86,591 97,434 367.0 62.2 22.6 103.3 2.6 12.5 Value . . . . . . . . . . . . . . . . . . . . 26,003 47,319 48,944 127,031 139,727 156,382 501.4 82.0 3.4 159.5 10.0 11.9 Unit value . . . . . . . . . . . . . . . . $1.25 $1.40 $1.18 $1.51 $1.61 $1.61 28.8 12.2 -15.7 27.6 7.2 -0.5 Ending inventory quantity . . . . 39 1,457 2,118 7,466 4,798 5,377 13,687.8 3635.9 45.4 252.5 -35.7 12.1
U.S. producers' (2): Average capacity quantity . . . . . 146,079 146,482 150,802 150,001 149,127 137,129 -6.1 0.3 2.9 -0.5 -0.6 -8.0 Production quantity . . . . . . . . . . 106,591 111,483 114,138 111,763 94,408 97,068 -8.9 4.6 2.4 -2.1 -15.5 2.8 Capacity utilization (1) . . . . . . . . 73.0 76.1 75.7 74.5 63.3 70.8 -2.2 3.1 -0.4 -1.2 -11.2 7.5 U.S. shipments: Quantity . . . . . . . . . . . . . . . . . . 106,315 107,744 115,750 109,265 96,366 94,572 -11.0 1.3 7.4 -5.6 -11.8 -1.9 Value . . . . . . . . . . . . . . . . . . . . 255,666 283,331 308,986 318,030 281,420 277,076 8.4 10.8 9.1 2.9 -11.5 -1.5 Unit value . . . . . . . . . . . . . . . . $2.40 $2.63 $2.67 $2.91 $2.92 $2.93 21.8 9.4 1.5 9.0 0.3 0.3 Export shipments: Quantity . . . . . . . . . . . . . . . . . . 9 0 0 0 0 0 -100.0 -100.0 (4) (4) (4) (4)
Value . . . . . . . . . . . . . . . . . . . . 23 0 0 0 0 0 -100.0 -100.0 (4) (4) (4) (4)
Unit value . . . . . . . . . . . . . . . . $2.56 (4) (4) (4) (4) (4) (4) (4) (4) (4) (4) (4)
Ending inventory quantity . . . . . 7,502 10,864 9,376 11,592 9,472 11,837 57.8 44.8 -13.7 23.6 -18.3 25.0 Inventories/total shipments (1) . 7.1 10.1 8.1 10.6 9.8 12.5 5.5 3.0 -2.0 2.5 -0.8 2.7 Production workers . . . . . . . . . . 2,612 2,608 2,753 2,681 2,480 2,589 -0.9 -0.2 5.6 -2.6 -7.5 4.4 Hours worked (1,000s) . . . . . . . 5,338 5,128 5,308 5,427 4,925 4,684 -12.3 -3.9 3.5 2.2 -9.3 -4.9 Wages paid ($1,000s) . . . . . . . . 37,566 37,508 40,095 41,343 39,086 38,994 3.8 -0.2 6.9 3.1 -5.5 -0.2 Hourly wages . . . . . . . . . . . . . . . $7.04 $7.31 $7.55 $7.62 $7.94 $8.32 18.3 3.9 3.3 0.9 4.2 4.9 Productivity (pounds per hour) . 20.0 21.7 21.5 20.6 19.2 20.7 3.8 8.9 -1.1 -4.2 -6.9 8.1 Unit labor costs . . . . . . . . . . . . . $0.35 $0.34 $0.35 $0.37 $0.41 $0.40 14.0 -4.5 4.4 5.3 11.9 -3.0 Net sales: Quantity . . . . . . . . . . . . . . . . . . 107,402 108,368 115,235 110,709 97,706 99,273 -7.6 0.9 6.3 -3.9 -11.7 1.6 Value . . . . . . . . . . . . . . . . . . . . 258,897 282,459 306,899 317,991 286,029 288,972 11.6 9.1 8.7 3.6 -10.1 1.0 Unit value . . . . . . . . . . . . . . . . $2.41 $2.61 $2.66 $2.87 $2.93 $2.91 20.8 8.1 2.2 7.9 1.9 -0.6 Cost of goods sold (COGS) . . . . 216,773 245,778 267,658 279,551 258,519 257,065 18.6 13.4 8.9 4.4 -7.5 -0.6 Gross profit or (loss) . . . . . . . . . 42,124 36,681 39,241 38,440 27,510 31,907 -24.3 -12.9 7.0 -2.0 -28.4 16.0 SG&A expenses . . . . . . . . . . . . 26,048 28,274 29,613 28,926 26,936 28,332 8.8 8.5 4.7 -2.3 -6.9 5.2 Operating income or (loss) . . . . 16,076 8,407 9,628 9,514 574 3,575 -77.8 -47.7 14.5 -1.2 -94.0 522.8 Capital expenditures . . . . . . . . . 5,343 4,220 5,684 3,936 2,107 2,225 -58.4 -21.0 34.7 -30.8 -46.5 5.6 Unit COGS . . . . . . . . . . . . . . . . $2.02 $2.27 $2.32 $2.53 $2.65 $2.59 28.3 12.4 2.4 8.7 4.8 -2.1 Unit SG&A expenses . . . . . . . . . $0.24 $0.26 $0.26 $0.26 $0.28 $0.29 17.7 7.6 -1.5 1.7 5.5 3.5 Unit operating income or (loss) . $0.15 $0.08 $0.08 $0.09 $0.01 $0.04 -75.9 -48.2 7.7 2.9 -93.2 513.0 COGS/sales (1) . . . . . . . . . . . . . 83.7 87.0 87.2 87.9 90.4 89.0 5.2 3.3 0.2 0.7 2.5 -1.4 Operating income or (loss)/ sales (1) . . . . . . . . . . . . . . . . . 6.2 3.0 3.1 3.0 0.2 1.2 -5.0 -3.2 0.2 -0.1 -2.8 1.0
U.S. processors' (5): U.S. shipments: Quantity . . . . . . . . . . . . . . . . . . 140,617 136,700 140,929 136,292 116,037 114,703 -18.4 -2.8 3.1 -3.3 -14.9 -1.1 Value . . . . . . . . . . . . . . . . . . . . 338,409 358,601 375,936 392,564 334,755 330,657 -2.3 6.0 4.8 4.4 -14.7 -1.2 Unit value . . . . . . . . . . . . . . . . $2.41 $2.62 $2.67 $2.88 $2.88 $2.88 19.8 9.0 1.7 8.0 0.2 -0.1
(1) "Reported data" are in percent and "period changes" are in percentage points. (2) Compiled from Commission questionnaire responses (imports from Vietnam reported as exports to the United States by VASEP). (3) Compiled from official Commerce statistics. (4) Not applicable. (5) Compiled from official USDA/NASS statistics; used to calculate apparent U.S. consumption.
Note.--Financial data are reported on a fiscal year basis and may not necessarily be comparable to data reported on a calendar year basis. Because of rounding,figures may not add to the totals shown. Unit values and shares are calculated from the unrounded figures.
Source: Compiled from data submitted in response to Commission questionnaires, official Commerce statistics, and official USDA/NASS data.
C-3


D-1
APPENDIX D
COMMENTS BY U.S. PRODUCERS, IMPORTERS, PURCHASERS, AND FOREIGN PRODUCERS REGARDING THE EFFECTS OF THE
ORDERS AND THE LIKELY EFFECTS OF REVOCATION

D-3
U.S. PROCESSORS’ COMMENTS REGARDING THE SIGNIFICANCE OF THEANTIDUMPING DUTY ORDER AND THE LIKELY EFFECTS OF REVOCATION
Effect Of The Order(Question II-18)
The Commission requested U.S. processors to describe the significance of the existingantidumping duty order covering imports of certain frozen fish fillets from Vietnam in terms of itseffect on their firms’ production capacity, production, U.S. shipments, inventories, purchases,employment, revenues, costs, profits, cash flow, capital expenditures, research and developmentexpenditures, and asset values. Their responses are as follows:
* * * * * * *
Likely Effect Of Revocation Of The Order(Question II-19)
The Commission requested U.S. processors to describe any anticipated changes in theirproduction capacity, production, U.S. shipments, inventories, purchases, employment, revenues,costs, profits, cash flow, capital expenditures, research and development expenditures, or assetvalues relating to the production of certain frozen fish fillets in the future if the antidumping dutyorder on certain frozen fish fillets from Vietnam were to be revoked. Their responses are asfollows:
* * * * * * *
Anticipated Changes In Operations In The Event The Order Is Revoked(Question II-4)
The Commission requested U.S. processors to describe anticipated changes in the characterof their operations or organization relating to the production of certain frozen fish fillets in thefuture if the antidumping duty order on certain frozen fish fillets from Vietnam were to be revoked. Their responses are as follows:
* * * * * * *
D-4
U.S. IMPORTERS’ COMMENTS REGARDING THE SIGNIFICANCE OF THEANTIDUMPING DUTY ORDER AND THE LIKELY EFFECTS OF REVOCATION
Effect Of The Order(Question II-11)
The Commission requested U.S. importers to describe the significance of the existingantidumping duty order covering imports of certain frozen fish fillets from Vietnam in terms of itseffect their firm’s imports, U.S. shipments of imports, and inventories. Their responses are asfollows:
* * * * * * *
Likely Effect Of Revocation Of Order(Question II-12)
The Commission requested U.S. importers to describe anticipated changes in their imports,U.S. shipments of imports, or inventories of certain frozen fish fillets in the future if theantidumping duty order on certain frozen fish fillets from Vietnam were to be revoked. Theirresponses are as follows:
* * * * * * *
Anticipated Changes In Operations In The Event The Order Is Revoked(Question II-4)
The Commission requested U.S. importers to describe anticipated changes in the characterof their operations or organization relating to the importation of certain frozen fish fillets in thefuture if the antidumping duty order on certain frozen fish fillets form Vietnam were to be revoked.
* * * * * * *
PURCHASER COMMENTS REGARDING LIKELY EFFECTS OF REVOCATION
Likely Effects of Revocation (Question III-38)
The Commission requested U.S. purchasers to describe likely effects of any revocation ofthe antidumping duty order for imports of certain frozen fish fillets from Vietnam. As appropriate,please discuss any potential effects of revocation of the antidumping duty order on (1) the futureactivities of your firm and (2) the market as a whole.
* * * * * * *
D-5
FOREIGN PRODUCERS'/EXPORTERS' COMMENTS REGARDING THE SIGNIFICANCE OFTHE ANTIDUMPING DUTY ORDER AND THE LIKELY EFFECTS OF REVOCATION
Signficance Of The Order(Question II-14)
The Commission requested foreign producers/exporters to describe the significance of theexisting antidumping duty order covering imports of certain frozen fish fillets from Vietnam interms of its effect on their firms’ production capacity, production, home market shipments, exportsto the United States and other markets, and inventories. Their responses are as follows:
* * * * * * *
Anticipated Changes If The Order Revoked (Question II-15)
The Commission requested foreign producers/exporters to describe any anticipated changesin their production capacity, production, home market shipments, exports to the United States andother markets, or inventories relating to the production of certain frozen fish fillets from Vietnam ifthe antidumping duty order on certain frozen fish fillets from Vietnam were to be revoked. Theirresponses are as follows:
* * * * * * *
Anticipated Changes In Operations In The Event The Order Is Revoked(Question II-4)
The Commission requested foreign producers/exporters to describe anticipated changes inthe character of their operations or organization relating to the production of certain frozen fishfillets in the future if the antidumping duty order on certain frozen fish fillets from Vietnam were tobe revoked. Their responses are as follows:
* * * * * * *

E-1
APPENDIX E
QUESTIONNAIRE RESPONSES OF U.S. PROCESSORS AND PURCHASERSDISCUSSING THE EFFECTS OF CHANGES IN PRICES OF RAW
MATERIALS AND OTHER FACTORS ON DOMESTIC PROCESSORS


E-3
Effects of changes in prices of raw materials and other factors on domestic processors
* * * * * * *

F-1
APPENDIX F
OVERVIEW OF VARIANCE CALCULATION

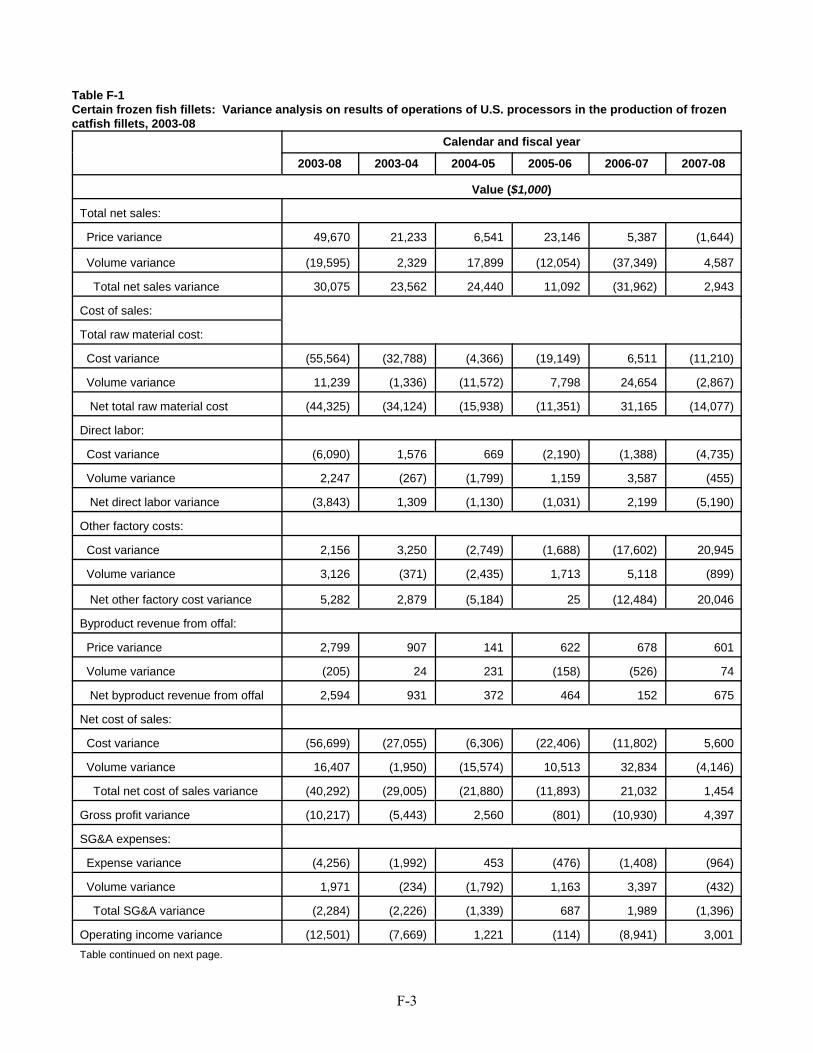
F-3
Table F-1Certain frozen fish fillets: Variance analysis on results of operations of U.S. processors in the production of frozencatfish fillets, 2003-08
Calendar and fiscal year
2003-08 2003-04 2004-05 2005-06 2006-07 2007-08
Value ($1,000)
Total net sales:
Price variance 49,670 21,233 6,541 23,146 5,387 (1,644)
Volume variance (19,595) 2,329 17,899 (12,054) (37,349) 4,587
Total net sales variance 30,075 23,562 24,440 11,092 (31,962) 2,943
Cost of sales:
Total raw material cost:
Cost variance (55,564) (32,788) (4,366) (19,149) 6,511 (11,210)
Volume variance 11,239 (1,336) (11,572) 7,798 24,654 (2,867)
Net total raw material cost (44,325) (34,124) (15,938) (11,351) 31,165 (14,077)
Direct labor:
Cost variance (6,090) 1,576 669 (2,190) (1,388) (4,735)
Volume variance 2,247 (267) (1,799) 1,159 3,587 (455)
Net direct labor variance (3,843) 1,309 (1,130) (1,031) 2,199 (5,190)
Other factory costs:
Cost variance 2,156 3,250 (2,749) (1,688) (17,602) 20,945
Volume variance 3,126 (371) (2,435) 1,713 5,118 (899)
Net other factory cost variance 5,282 2,879 (5,184) 25 (12,484) 20,046
Byproduct revenue from offal:
Price variance 2,799 907 141 622 678 601
Volume variance (205) 24 231 (158) (526) 74
Net byproduct revenue from offal 2,594 931 372 464 152 675
Net cost of sales:
Cost variance (56,699) (27,055) (6,306) (22,406) (11,802) 5,600
Volume variance 16,407 (1,950) (15,574) 10,513 32,834 (4,146)
Total net cost of sales variance (40,292) (29,005) (21,880) (11,893) 21,032 1,454
Gross profit variance (10,217) (5,443) 2,560 (801) (10,930) 4,397
SG&A expenses:
Expense variance (4,256) (1,992) 453 (476) (1,408) (964)
Volume variance 1,971 (234) (1,792) 1,163 3,397 (432)
Total SG&A variance (2,284) (2,226) (1,339) 687 1,989 (1,396)
Operating income variance (12,501) (7,669) 1,221 (114) (8,941) 3,001Table continued on next page.
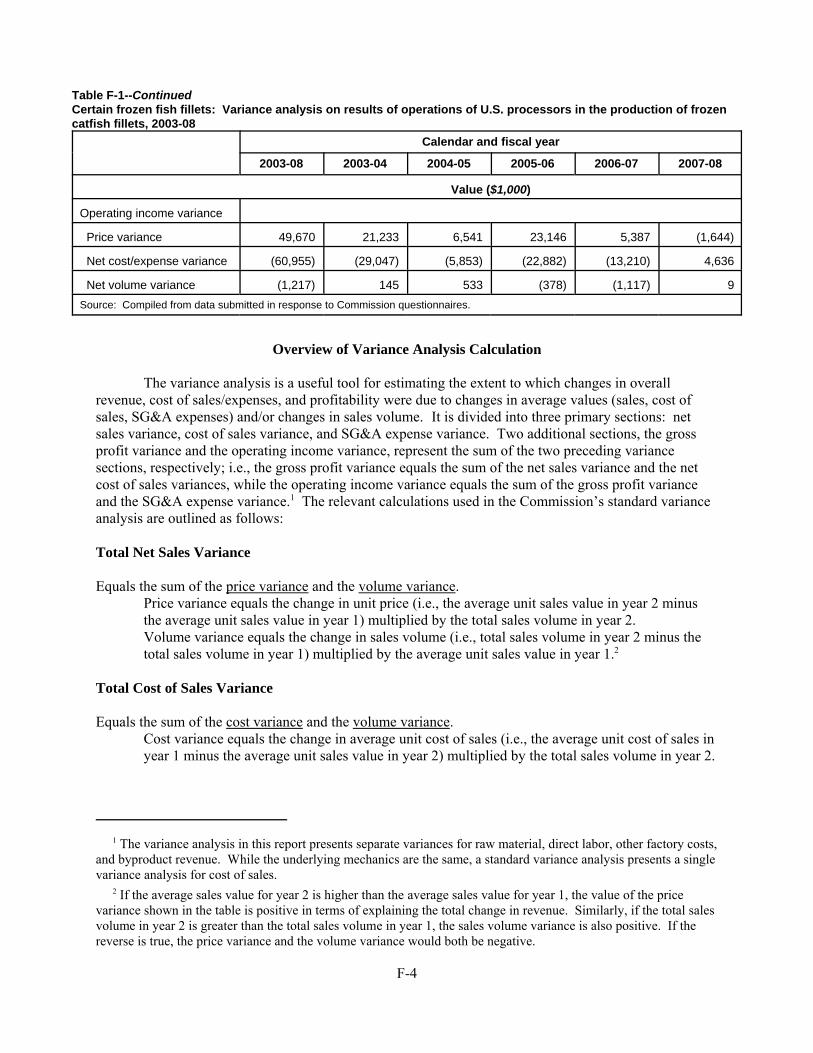
1 The variance analysis in this report presents separate variances for raw material, direct labor, other factory costs,and byproduct revenue. While the underlying mechanics are the same, a standard variance analysis presents a singlevariance analysis for cost of sales. 2 If the average sales value for year 2 is higher than the average sales value for year 1, the value of the pricevariance shown in the table is positive in terms of explaining the total change in revenue. Similarly, if the total salesvolume in year 2 is greater than the total sales volume in year 1, the sales volume variance is also positive. If thereverse is true, the price variance and the volume variance would both be negative.
F-4
Table F-1--ContinuedCertain frozen fish fillets: Variance analysis on results of operations of U.S. processors in the production of frozencatfish fillets, 2003-08
Calendar and fiscal year
2003-08 2003-04 2004-05 2005-06 2006-07 2007-08
Value ($1,000)
Operating income variance
Price variance 49,670 21,233 6,541 23,146 5,387 (1,644)
Net cost/expense variance (60,955) (29,047) (5,853) (22,882) (13,210) 4,636
Net volume variance (1,217) 145 533 (378) (1,117) 9Source: Compiled from data submitted in response to Commission questionnaires.
Overview of Variance Analysis Calculation
The variance analysis is a useful tool for estimating the extent to which changes in overallrevenue, cost of sales/expenses, and profitability were due to changes in average values (sales, cost ofsales, SG&A expenses) and/or changes in sales volume. It is divided into three primary sections: netsales variance, cost of sales variance, and SG&A expense variance. Two additional sections, the grossprofit variance and the operating income variance, represent the sum of the two preceding variancesections, respectively; i.e., the gross profit variance equals the sum of the net sales variance and the netcost of sales variances, while the operating income variance equals the sum of the gross profit varianceand the SG&A expense variance.1 The relevant calculations used in the Commission’s standard varianceanalysis are outlined as follows:
Total Net Sales Variance
Equals the sum of the price variance and the volume variance. Price variance equals the change in unit price (i.e., the average unit sales value in year 2 minusthe average unit sales value in year 1) multiplied by the total sales volume in year 2. Volume variance equals the change in sales volume (i.e., total sales volume in year 2 minus thetotal sales volume in year 1) multiplied by the average unit sales value in year 1.2
Total Cost of Sales Variance
Equals the sum of the cost variance and the volume variance.Cost variance equals the change in average unit cost of sales (i.e., the average unit cost of sales inyear 1 minus the average unit sales value in year 2) multiplied by the total sales volume in year 2.
3 While the total net sales variances and the total cost of sales variance use the same basic methodology, the totalnet sales variance uses average sales value, while the cost of sales variance uses the average cost of sales. The totalnet sales variances and the total cost of sales variance are also different in terms of whether changes in prices, costs,and/or volume are viewed as positive or negative. Since the objective of the variance analysis is to quantify theeffect of changes in prices, costs, expenses, and volume on changes in operating income, changes that increaseoperating income (i.e., increasing average sales value, decreasing average costs, increasing sales volumes when salesare profitable, and decreasing sales volumes when sales are unprofitable) are positive. In contrast, changes whichdecrease operating income (i.e., decreasing average sales values, increasing average costs, decreasing sales volumeswhen sales are profitable, and increasing sales volumes when sales are unprofitable) are negative. 4 Some care should be given when considering the cost of sales variance and the corresponding volume variance. The variance analysis does not distinguish between changes in average cost of sales due to increases/decreases invariable costs and/or changes due to increases/decreases in fixed cost absorption related to variations inproduction/sales volume. While the expanded variance analysis presented in this report separately presents rawmaterials, direct labor, and other factory costs, the impact of changes in fixed cost absorption, which would generallybe reflected most noticeably in other factory costs, is not separately isolated. 5 The gross profit variance is the net change in gross profit for the two periods considered; i.e., a negative grossprofit variance indicates that total gross profit was lower in year 2 compared to year 1, while a positive gross profitvariance indicates that total gross profit was higher in year 2 compared to year 1. 6 Similar to the cost of sales variance, the SG&A expense variance has the same limitation noted above in termsof explaining changes due to increases/decreases in variable costs versus changes due to increased/decreased fixedcost absorption. A positive SG&A expense variance means that total SG&A expenses declined in year 2 comparedto year 1, while a negative SG&A expense variance indicates that total SG&A expenses increased.
F-5
Volume variance equals the change in sales volume (i.e., total sales volume in year 1 minus thetotal sales volume in year 2) multiplied by the average unit cost of sales in year 1.3 4
Gross Profit Variance
Equals the sum of the total net sales variance and the total cost of sales variance.5
Total SG&A Expense Variance
Equals the sum of the SG&A expense variance and the volume variance.SG&A expense variance equals the change in average SG&A expenses (i.e., average unit SG&Aexpenses in year 1 minus the average unit SG&A expense value in year 2) multiplied by the totalsales volume in year 2. Volume variance equals the change in sales volume (i.e., total sales volume in year 1 minus thetotal sales volume in year 2) multiplied by average unit SG&A expenses in year 1.6
Operating Income Variance
Equals the sum of the price variance, the sum the cost of sales variance and the SG&A expenses variance,and the sum of all volume variances. Since the volume variances related to sales and costs ofsales/SG&A expenses generally offset each other (i.e., an increase in sales volume results in a positivevolume variance in the calculation of the net sales variance, while the same increase results in a negativevolume variance in the calculation of the cost of sales variance), the primary components of the operatingincome variance are usually the price variance and the cost of sales/SG&A expense variance.
