ceo equity incentives and accounting manipulation: the...
TRANSCRIPT
CEO Equity Incentives and Accounting Manipulation: The Role of Auditor Expertise
Sudarshan Jayaraman and Todd Milbourn#
January 2014
Abstract
Prior studies find inconsistent evidence regarding the effect of CEO equity incentives on accounting manipulation. We argue that this inconsistency stems from non-consideration of detection mechanisms that mitigate the effect of equity incentives on accounting manipulation by inhibiting the ability of managers to carry out such manipulative activities. Using auditor industry expertise as one such detection mechanism, we document that CEO equity incentives are positively associated with accounting manipulation only in sub-samples where auditor expertise is low, but not where expertise is high. The implication of these results is that auditor expertise lowers the cost of granting equity-based incentives, and that firms audited by an industry expert grant their CEOs greater equity incentives. We find strong evidence in favor of this implication. Controlling for previously identified determinants of CEO equity incentives, we find that firms audited by an industry expert grant their CEOs more equity incentives (to the tune of 14%) as compared to those audited by a non-expert. To put aside endogeneity concerns, we use the collapse of Arthur Andersen as a quasi-natural experiment and find analogous evidence. Overall, our study documents the critical role of detection mechanisms in the link between CEO contracting and financial misreporting.
# Olin Business School, Washington University in St. Louis, Campus Box 1133, One Brookings Drive, St. Louis, MO 63130. Contact author: [email protected]. We appreciate very helpful comments from two anonymous referees, the editor (John Harry Evans), Amir Amel-Zadeh, Chris Armstrong, Nick Dopuch, Gerald Garvey, Eitan Goldman, Radha Gopalan, Todd Gormley, Allison Koester, Adair Morse, Doug Skinner and seminar participants at the Penn State Accounting Research conference and University of Illinois at Chicago. We thank Lauren Barth and Sisi Ren for excellent research assistance. Any errors are our own.
1. Introduction
A large literature in accounting and finance tests whether CEOs with equity-based
incentives manipulate their reported financial statements.1 The overall evidence in this literature
is inconclusive, with some studies documenting a positive association (e.g., Burns and Kedia,
2006; Bergstresser and Phillipon, 2006; Denis, Hanouna and Sarin, 2006; Efendi, Srivastava and
Swanson, 2007; Harris and Bromiley, 2007), and others failing to find such an association (e.g.,
Armstrong, Jagolinzer and Larcker, 2010; Baber, Kang and Liang, 2007; Erickson, Hanlon and
Maydew, 2006).
While the above studies differ in their research designs, empirical measures and sample
periods, none of them considers the role of detection mechanisms that would inhibit the ability
of managers to successfully carry out any manipulation (under the assumption that equity
incentives do indeed encourage reporting manipulation). We posit effective auditing as one such
mechanism and argue that incorporating it in a CEO contracting-financial misreporting
framework is likely to shed light on the aforementioned inconsistent findings. Following the
auditing literature, we use auditor industry expertise to capture the effectiveness of auditing and
examine how it affects the association between CEO equity incentives and financial misreporting.
First, we replicate the positive association between CEO equity incentives (defined as the
sensitivity of the CEO’s equity portfolio to the stock price i.e., delta) and the likelihood of
accounting manipulation (based on the comprehensive set of class action lawsuits identified by
Dyck, Morse and Zingales, 2010).
1 We use the terms “accounting manipulation” and “financial misreporting” interchangeably to refer to actions taken by managers to induce opacity into reported financial statements. As these activities are not directly observable, we use instances of class-action lawsuits to infer the presence of such activities.
1
Second, we condition our sample on whether the auditor is an industry expert and find
that the positive association between misreporting and CEO incentives is concentrated in the
subsample of non-industry-expert auditors. We are unable to detect any association between
misreporting and CEO incentives in the sub-sample of auditors that are industry experts. Further,
we uncover these results in both univariate as well as multivariate tests, indicating that our
inferences are not on account of selective inclusion or exclusion of control variables.
Third, we verify that our inferences are robust to using the propensity-score based
matching design suggested by Armstrong, Jagolinzer and Larcker (2010). These authors
convincingly argue that using a propensity score design that achieves maximum variation in the
variable of interest, while minimizing variation in the control variables, is a superior econometric
approach to matching on the outcome variable. We concur and replicate their results by using the
propensity-score matching technique and confirm that there is no statistical association between
the frequency of accounting manipulations and CEO incentives in the full sample. However,
when we split the sample based on auditor expertise, we again find that CEO equity incentives
are associated with a higher frequency of accounting manipulations – but only in the subsample
of non-expert auditors. In the high auditor expertise subsample, we find that equity incentives
correlate with a lower frequency of accounting manipulations.2 Overall, our results are robust to
using alternative empirical methodologies and provide an economic rationale for the prior
inconsistent evidence between CEO incentives and accounting manipulation.
An implication that emerges from the above tests is that effective auditing reduces the
costs of granting equity-based incentives by deterring managers from manipulating financial
2 This result is interesting, but further exploration is beyond the scope of our current study. Our hypotheses merely predict that CEO equity incentives do not correlate with more frequent accounting manipulations in the presence of greater auditor expertise. We therefore do not examine this result further, and leave it to future research.
2
statements. If that is true, then optimal contracting theories would predict that these firms should
grant more equity-based incentives to their CEOs. For example, Goldman and Slezak (2006)
examine how the potential for financial statement manipulation influences managerial equity-
based incentives. They argue that while more equity incentives induce better strategic decisions
and greater effort, they also encourage the manager to manipulate financial reports to artificially
inflate the stock price, especially if the manipulation is unlikely to be detected. Their model
predicts that CEOs will be granted more equity incentives when financial misreporting is more
likely to be detected. Our framework allows us to take this prediction to the data.
We find strong evidence in favor of this optimal contracting story. Controlling for
previously identified determinants of CEO incentives, firms audited by an industry expert grant
their CEOs more equity incentives (to the tune of 14%) than those audited by a non-expert. These
results are robust to additional sensitivity tests such as restricting the sample to Big Five auditees,
using alternative measures of both auditor expertise and equity-based incentives, and to
including the top five executives rather than only the CEO. To further validate our inferences, we
exploit variation across industries in the extent to which earnings matter for determining the
stock price and find that auditor expertise is positively associated with CEO incentives only in
industries where earnings matter for stock price informativeness. Overall, these results are
consistent with optimal contracting theories where equity-based incentives are, at least in part,
granted by trading off the benefits of effort with the costs of accounting manipulation.
A lingering concern that remains, of course, is the endogeneity of auditor expertise. For
example, it could be that CEOs with greater equity incentives are more aligned with shareholders
and therefore select expert auditors to bind themselves to greater monitoring. To address this
endogeneity, we use the demise of Arthur Andersen (AA) as a quasi-natural experiment of forced
auditor changes (e.g., Blouin, Grein and Rountree, 2007; Dyck, Morse and Zingales, 2011). Our
3
identifying assumption uses firms’ switch to a new auditor around AA’s demise as a quasi-
exogenous shock to auditor expertise. In particular, we use a difference-in-differences design to
compare changes in CEO incentives for AA clients with an expert auditor in the post period to
those without an expert auditor. A distinct advantage of this within-firm approach is that it
implicitly controls for all time-invariant differences across firms that might be correlated with
auditor expertise. Evidence from this event-study methodology fully validates our cross-sectional
inferences. We find that AA firms audited by an expert auditor in the post-period experience
larger increases in CEO incentives (to the tune of 17%) as compared to AA firms audited by a
non-expert in the post-period. A final concern here is that although firms’ decision to switch
auditors is exogenous, their choice of the incoming auditor is not. To mitigate this concern, we
use a two-stage approach where we model the probability of selecting an industry expert auditor
in the first stage and control for the inverse Mills ratio in the second stage. Our results are robust
to this correction as well. Overall, these time-series tests complement our cross-sectional
inferences of the important effect of auditor expertise on CEO equity incentives.
Our study makes two contributions. First, it contributes to the CEO contracting-financial
misreporting literature by providing an economic rationale for the inconsistent evidence in prior
studies. We show that detection mechanisms such as auditor expertise mitigate the effect of
equity incentives on accounting manipulation by inhibiting the ability of managers to misreport
financial statements. Second, our evidence documents an important role for financial statement
verification in the way managers are incentivized. While the economic consequences of auditing
have focused on improvements to the information environment (e.g., Ball, Jayaraman and
Shivakumar, 2012) and a lower cost of capital (e.g., Anderson et al., 2004; Pittman and Fortin,
2004), our study broadens the role of auditing in the efficient functioning of firms. The link
between auditor expertise and managerial incentives is an important one as CEO incentives have
4
been shown to have wide implications for managerial risk-taking (Coles et al., 2006) and the
efficient functioning of corporate governance structures (e.g., Admati and Pfleiderer, 2009;
Edmans, 2009; Bharath, Jayaraman and Nagar, 2013).
The remainder of the paper is organized as follows: Section 2 lays out the hypotheses and
Section 3 the empirical strategy. Section 4 presents the main results and includes our robustness
tests. Section 5 concludes.
2. Motivation and hypotheses
In the following section, we motivate and flesh out our empirically testable hypotheses.
2.1. CEO equity incentives and accounting manipulation
In the aftermath of accounting scandals at the turn of the century, many academics,
regulators, and the media have questioned whether managerial compensation contracts are the
culprits behind these acts of reporting transgressions. Allegedly, high equity incentives
encourage managers to indulge in myopic acts aimed at maintaining stock prices and earnings at
artificially high levels in the near term. For example, in his monetary policy report to Congress
on July 16, 2002, Alan Greenspan stated that “the highly desirable spread of shareholding and
options among business managers perversely created incentives to artificially inflate reported
earnings in order to keep stock prices high and rising”. Jensen (2003) argues that current
compensation schemes are responsible for causing managers to take actions that “game the
system” and destroy shareholder value. Put more forcefully, Coffee (2005) identifies stock options
as the best explanation for the rise in accounting scandals in the late 1990s and early 2000s, stating
that “…absent special controls, more options means more fraud”.
5
On the other hand, others express a healthy skepticism of these interpretations. In
particular, Bushman and Smith (2001) discuss the effect of observed incentive contracts on
earnings management behavior and note that “this research begs the question of why these
contracts exist in the first place. Are the observed contracts at these firms not optimal? After all,
any incentives for earnings management could be mitigated by offering flat wage contracts.” So
whether equity incentives are truly to blame for manipulative reporting behavior remains an
unanswered empirical question.
Several studies test the above assertions by examining the association between accounting
manipulation and CEO incentives. While this literature is burgeoning, the overall evidence is
inconclusive. The above view, as Armstrong et al. (2010) point out, implicitly ignores the effect of
actions by monitors in curbing the accounting manipulation. Thus, even if one were to entertain
the possibility that CEO incentives encourage accounting manipulation, one would not
necessarily observe a positive association ex post if there are mechanisms in place that would
detect the manipulation. We argue that one reason for the mixed evidence owes to the lack of
conditioning on such detection mechanisms that arguably mitigate the positive association
between CEO equity incentives and accounting manipulation. We follow the auditing literature
and posit that the expertise of the firm’s auditor is one such mechanism. Support for this claim
comes from prior studies that provide evidence of the link between auditor industry expertise
and the detection of accounting manipulation.
Craswell, Francis and Taylor (1995) and DeFond, Francis and Wong (2000) find that
industry specialists charge a higher price for audits, indicating that they produce higher quality
audits. Solomon et al. (1999) find that auditors who are industry experts are more likely to detect
financial reporting misstatements that are due to non-errors (i.e., intentional and hence more
egregious). Gunny et al. (2007) find that auditors with industry expertise are less likely to be
6
found deficient (and also severely deficient) by the PCAOB (Public Company Accounting
Oversight Board). Finally, Balsam, Krishnan and Yang (2003) and Krishnan (2003) document that
abnormal accruals are smaller for companies audited by industry experts; and Reichelt and Wang
(2010) show that auditor industry expertise is associated with smaller abnormal accruals (both
income-increasing and income-decreasing) and a lower likelihood of meeting or beating analysts’
earnings forecasts by one penny per share. Our primary hypothesis is thus as follows:
H1: Auditor expertise mitigates the positive association between CEO incentives and accounting manipulation.
2.2. Effect of auditor expertise on CEO incentives
An implication of the above hypothesis is that auditor expertise reduces the costs of
granting equity incentives by reducing the likelihood of accounting manipulation. If that is true,
then optimal contracting theories would predict that these firms should grant their CEOs more
equity-based incentives. For example, Goldman and Slezak (2006) present a model where the
manager exerts effort that positively affects output, but also indulge in misrepresentation of
performance (see also Peng and Roell, 2008 and Laux and Laux, 2009). Shareholders determine
the optimal level of stock-based incentives by trading off the benefits of higher effort with the
costs of greater manipulation. The prediction from their model is that firms with a higher
detection likelihood of accounting manipulation should grant their CEO’s more equity incentives.
The intuition is that the greater probability of detection reduces manager’s incentives to indulge
in information manipulation, thereby reducing the ex-ante costs of granting equity-based
incentives.
It is pertinent to distinguish between auditor expertise as a “detection mechanism” and
other forms of corporate governance that act as “monitoring mechanisms”. In a single-task
agency setting, where the manager can only influence the stock price via his effort, the agency
7
literature has traditionally characterized monitoring mechanisms (such as debt and large
shareholding) as substitutes for CEO equity incentives. The intuition is that these mechanisms
can monitor the actions of the manager, and thus reduce the need to grant equity-based incentives
to the manager. For example, Ittner et al. (2003, pg. 103) note that:
“Corporate governance mechanisms provide an alternative to the explicit use of equity-based incentives. For example, holders of large block of stock have greater incentive to monitor the actions of managers and greater power to force managers to allow monitoring to occur…Similarly, bondholders have incentives to restrict managers’ ability to take actions that transfer wealth from bondholders to shareholders and/or managers…Consequently, the use of equity-based incentives should be lower when external monitoring is greater.”
However, things become tricky when one moves to a multi-tasking framework. For
example, Goldman and Slezak (2006) allow the manager to influence the stock via both effort and
accounting manipulation. They model the “monitoring environment” to represent the collection
of parameters that directly affect manipulation: the probability of detection (which is where
auditor expertise comes in), the penalty if detected, and the cost of hiding manipulative activities.
They find that equity-incentives are increasing in the detection probability and in the penalty of
manipulation. It is pertinent to note that Goldman and Slezak (2006) do not allow the “monitoring
environment” to influence managerial effort. Thus, the overall effect of monitoring mechanisms
on equity incentives depends on their relative influence on effort versus on manipulation. As the
former channel reduces equity-incentives, while the latter increases it, the overall effect of
monitoring mechanisms on equity incentives is ambiguous. In contrast, since auditors are less
likely to influence the manager’s effort directly, the effect of auditor expertise on CEO equity
incentives operates only through the accounting manipulation channel, thereby offering an
unambiguous prediction. Thus, our second hypothesis is:
H2: Firms offer more equity incentives to CEOs when they are audited by an industry expert.
8
2.3. Role of stock price sensitivity to earnings
We expect the effect of auditor expertise on CEO equity incentives to vary depending on
the extent to which earnings matter for stock prices. Since managers’ incentives to manipulate
earnings stems from their desire to maintain the stock price at a high level, we expect the effect
of auditor expertise on CEO equity incentives to be pronounced in industries where earnings play
an important role in determining the stock price. Thus our third hypothesis is:
H3: The effect of auditor expertise on CEO equity incentives is pronounced in industries where earnings are important in determining the stock price.
3. Research design
In this section, we describe the empirical proxies, motivate our control variables, present
our regression specifications and finish with a description of our sample.
3.1. Primary variables
3.1.1. Accounting manipulation (LAWSUIT)
It is difficult to construct an appropriate empirical measure of accounting manipulation
since this managerial action is unobservable (see discussion in Armstrong et al, 2010). As a result,
we follow prior studies and infer manipulation based on “extreme” outcomes where
manipulation is likely to have occurred. In particular, we follow Armstrong et al. (2010) and Dyck,
Morse and Zingales (2010) and use an indicator variable LAWSUIT to denote firm-years during
which the firm faced a securities class action lawsuit in the Stanford Securities Class Action
Clearinghouse (SSCAC) database. The advantage of this database is not only that it encompasses
most cases of accounting manipulation including restatements and AAERs, but also that Dyck et
al. apply several filters to exclude frivolous and dismissed cases, and most importantly make
9
these data publicly available.3 In particular, they exclude cases where the lawsuit occurred due
to reasons such as IPO underwriter allocation cases, mutual fund timing and late trading cases
and analyst cases involving false provision of favorable coverage (see Dyck et al. for details).
3.1.2. CEO equity incentives (EQINC)
Following prior studies, such as Armstrong et al. (2010), Burns and Kedia (2006), Core and
Guay (1999) and Erickson et al. (2006), we measure CEO equity incentives as the portfolio delta,
defined as the dollar change in the CEO’s equity portfolio value for a 1% change in the firm’s
stock price. We construct this delta measure based on the methodology in Core and Guay (1999,
2002) and denote this measure of CEO equity-based incentives as EQINC.
3.1.3. Auditor expertise (EXPERTISE)
Following Reichelt and Wang (2010), we define auditor expertise based on the auditor’s
annual market share of audit fees within a two-digit SIC category. In particular, we use their two
definitions of industry expertise – definition 1 (labeled EXPERTISE1) measures industry expertise
by auditor dominance and is defined as an indicator that takes the value of 1 if in a particular
year the auditor has the largest market share in a two-digit SIC category and if its market share
is at least ten percentage points greater than the second largest industry leader. A sufficiently
larger market share, as Reichelt and Wang (2010) argue, ensures that the industry leader is
dominant. Definition 2 (EXPERTISE2) measures industry expertise assuming that auditor
expertise increases with industry market share and that a sufficiently large market share exists.
Specifically, it defines an industry specialist if in a particular year the auditor has a market share
3 These are obtained from http://faculty.chicagobooth.edu/adair.morse/research/data.html. We thank the authors for making these data available.
10
greater than 35% in a two-digit SIC category.4 We use a composite measure of auditor expertise
(EXPERTISE) that is set to 1 if either measure indicates that the auditor is an industry expert. We
verify in subsequent tests that our results are robust to using the individual measures and also to
using the continuous measure of market share (similar to Reichelt and Wang, 2010).
Following Reichelt and Wang (2010), we define EXPERTISE over the period 2003 to 2007.
We start in 2003 as that is the first year of the Big Four, and restrict the sample period to end by
2007 as sample coverage on Audit Analytics declined drastically from 2007 onwards (see Reichelt
and Wang, 2010 for further details). To provide insight into the auditor expertise variable, we
provide descriptive statistics similar to Reichelt and Wang (2010). For each year, we present the
number of unique two-digit industries that each of the Big Four auditors (Deloitte, Ernst & Young,
KPMG and PwC) are the experts. Table 1 presents these values for each individual expertise
measure. We find that PwC ranks as the expert for the most number of industries, followed by
Ernst & Young, Deloitte, and finally KPMG. These ordinal rankings are consistent across the two
measures and are similar to those reported in Reichelt and Wang (2010). For example, Reichelt
and Wang (2010) report that PwC, on average, ranks as the industry expert as per the second
definition, EXPERTISE2, in 18 industries, followed by Ernst & Young in 14, Deloitte in 10, and
KPMG in 4. In our sample, these values correspond to 17, 12, 9, and 4, respectively.
3.2. Sample construction
3.2.1. Accounting manipulation and auditor expertise
To test hypothesis H1 (i.e., the role of auditor expertise in the link between CEO equity
incentives and accounting manipulation), we merge four databases – (i) data on lawsuits from
4 Following Neal and Riley (2004) and Reichelt and Wang (2010), we define the breakpoint as 1.2 times the inverse of the average number of unique auditors in each industry, which is 3.45. This amounts to 35% (1.2*3.45-1).
11
1994 to 2004 from Dyck et al. (2010), (ii) data on CEO equity incentives from Execucomp, (iii) data
on auditor expertise from 2003 to 2007 from Audit Analytics; and (iv) data on control variables
from Compustat and IRRC (now called Risk Metrics). To circumvent the lack of overlap between
the lawsuit database (from 1994 to 2004) and the auditor expertise database (from 2003 to 2007),
we assume that auditors that are industry experts in each of the years from 2003 to 2007 (based
on Audit Analytics) would have also been industry experts during the years from 1994 to 2002.
In other words, in the combined sample that covers the 1994 to 2004 period, we set the indicator
EXPERTISE to 1 if the auditor has remained an industry expert in each of the years from 2003 to
2007. This, we contend, is a stricter definition of auditor expertise and one that eliminates artificial
variation in the variable due to temporary fluctuations in auditor market share.5 The final sample
comprises 7,427 firm-year observations over the period 1994 to 2004. Out of these observations,
201 firm-years (i.e., 2.71% of the sample) involve a lawsuit claiming the presence of an accounting
(or other) manipulation (i.e., the indicator LAWSUIT = 1). These involve 87 unique firms.6
We include several variables shown by prior studies to be related to CEO incentives. These
variables form the input to the propensity-score based matching model that we estimate
following Armstrong et al. (2010). For example, as larger firms and those with greater monitoring
difficulties grant more equity based incentives (Demsetz and Lehn, 1985; Armstrong et al., 2010),
we include firm size (SIZE) defined as the log of market value of equity, the market-to-book ratio
(MB), leverage (LEV) defined as total debt divided by total assets, and stock return volatility
(RETVOL) as controls for the underlying economic environment. Further, following Core,
Holthausen and Larcker (1999) and Armstrong et al. (2010) we include variables to capture
5 We thank an anonymous referee for this suggestion. 6 Following Dyck et al. (2010), we delete firms with assets of less than $750 million. Our results are, however, robust to the inclusion of these firms.
12
differences in the corporate governance environment. In particular, we use the Gompers et al.
(2003) G-index (GINDEX), the size of the board (BOARDSIZE), the number of affiliated directors
on the board (AFFLDIR), the presence of interlocking directorships (INTLCKDIR), whether the
CEO is also the chairman of the board (CEO_COB), whether substantial shareholders in the firm
are allowed cumulative voting (CUMVOTE), the proportion of institutional ownership
(INSTOWN), and finally, CEO tenure (TENURE). We present detailed variable definitions and
data sources in the Appendix.
3.2.2. Accounting manipulation and auditor expertise
To test hypothesis H2, which predicts a positive influence of auditor expertise on CEO
equity incentives, we use a sample that comprises the intersection of all firms with compensation
data from ExecuComp, auditor expertise data from Audit Analytics, accounting data from
Compustat, and stock price data from CRSP. This sample consists of 7,149 firm-year observations
across 1,836 unique firms between the years 2003 and 2007.
In terms of control variables, we include the log of total sales (LNSALE), as prior studies
show that firm size is an important determinant of equity incentives. As larger firms grant their
executives more compensation (Gabaix and Landier, 2008), we expect the coefficient on LNSALE
to be positive. Following Ittner et al. (2003), we use leverage (LEV) to capture monitoring by debt
holders and expect a negative association with equity incentives. As prior studies find that the
investment opportunity set affects equity incentives (e.g., Clinch, 1991; Smith and Watts, 1992;
Gaver and Gaver, 1993; and Baber et al, 1996), we follow Ittner et al. (2003) and include three
variables to capture the investment opportunity set – the market-to-book ratio (MB), the ratio of
research and development expenses to sales (R&D) and the ratio of advertising expenses to sales
(ADVT). Consistent with prior studies, we expect a positive coefficient on MB, R&D, and ADVT.
13
We use both accounting (ROA) and stock price (RET) based measures to capture prior
performance. ROA represents return on assets defined as income before extraordinary items
scaled by total assets while RET represents the annual stock return.
We also include earnings volatility (ROAVOL) and stock return volatility (RETVOL) to
capture features of the operating environment. ROAVOL and RETVOL are computed as standard
deviations of five annual observations of ROA and RET, respectively. Prendergast (2000, 2002)
argues that firms rely more on stock-based incentives in riskier environments where it is more
difficult to monitor the manager’s actions. On the other hand, Demsetz and Lehn (1985), Lambert
and Larcker (1987), Aggarwal and Samwick (1999) and Garvey and Milbourn (2003) argue that
greater volatility captures more noise in the output measure, and firms should therefore reduce
stock-based incentives. We, therefore, do not make a directional prediction for ROAVOL and
RETVOL. Finally, we include stock turnover (LIQ) as Jayaraman and Milbourn (2012) show that
firms with greater stock liquidity grant their executives more equity-based incentives. They argue
that by increasing stock price informativeness, greater stock liquidity provides shareholders a
more informative signal about the manager’s actions.
Following Petersen (2009), we estimate the regressions with year and industry indicators,
and cluster the standard errors by firm. All control variables have been defined as of the
beginning of the year. Our empirical specification is as follows:
, 0 1 , 1 2 , 1 3 , 1 4 , 1 5 , 1
6 , 1 7 , 1 8 , 1 9 , 1 10 , 1
11 , 1
&(1)
i t i t i t i t i t i t
i t i t i t i t i t
i t
EQINC EXPERTISE LNSALE LEV MB R DADVT ROA RET ROAVOL RETVOL
LIQ Year Industry
β β β β β β
β β β β β
β ε
− − − − −
− − − − −
−
= + + + + +
+ + + + +
+ + + +∑ ∑
Hypothesis H2 predicts β1>0 , i.e., auditor expertise allows for more equity incentives.
14
4. Results
4.1. Accounting manipulation and auditor expertise
4.1.1. Descriptive statistics
Descriptive statistics are presented in Panel A of Table 2. The mean value of LAWSUIT is
0.027, indicating that 2.7% of the sample pertains to firm-years with a lawsuit. This proportion
closely resembles the 3.4% that Armstrong et al. (2010) report. The mean value of EQINC is
706.426, which suggests that a 1% increase in the stock price increases the value of the average
CEO’s equity portfolio by $706,426. Around 8% of the sample is being audited by an industry
expert, as seen by the mean value of EXPERTISE.
4.1.2. CEO equity incentives and accounting manipulation - the role of auditor expertise
Panel B of Table 2 presents results of the role of auditor expertise in the association
between CEO equity incentives and accounting manipulation. The first set of results entitled “Full
sample” replicates prior studies. We estimate a probit model of the likelihood of accounting
manipulation (Pr (LAWSUIT = 1)) as a function of CEO incentives (EQINC) and control variables
(SIZE, LEV and MB). Following Armstrong et al. (2010), we start with univariate results. In
addition, we present multivariate evidence, where following Burns and Kedia (2006), we include
industry and year fixed effects in addition to the control variables. Turning to the univariate
results in Model 1, we find, consistent with Armstrong et al. that the coefficient on EQINC is
positive and significant. These results also come through in the multivariate results and validate
prior inferences that the likelihood of accounting manipulation is higher in firms with greater
equity incentives granted to the CEO.
To evaluate the role of auditor expertise in the association between CEO incentives and
accounting manipulation, we split the sample based on whether the auditor is an industry expert
15
and estimate the probit model within each sub-sample. Splitting the sample rather than
estimating interaction terms allows the coefficients on all the control variables to also vary
between the two groups (see Armstrong et al., 2010). These results are presented in specifications
entitled “High auditor expertise” and “Low auditor expertise”.
The results starkly illustrate that CEO equity incentives do not seem to influence the
likelihood of accounting manipulations when the firm is audited by an industry expert. In
particular, the coefficient on EQINC is insignificant in both specifications in the “High auditor
expertise” subsample. The higher likelihood of accounting manipulation associated with CEO
incentives is concentrated in firms not audited by an industry expert as seen by the positive and
significant coefficient on EQINC in the “Low auditor expertise” subsample. These results are
consistent with hypothesis H1 and indicate that detection mechanisms, such as auditor expertise,
mitigate the association between CEO equity incentives and accounting manipulation. Further,
as we obtain these results in univariate and multivariate specifications, our inferences are unlikely
to be driven by the inclusion or exclusion of select controls.
To reinforce our results, we further classify lawsuits based on whether they are
accounting-related. We expect the effect of auditor expertise in mitigating accounting
manipulation to exist only for accounting-related lawsuits.7 To classify lawsuits into accounting-
related and non-accounting-related, we obtain source documents underlying the lawsuits and, in
conjunction with data on accounting irregularities from Hennes et al. (2008), classify these
lawsuits into accounting-fraud related versus all others (such as non-timely disclosure of relevant
news, price fixing concerns, insider trading allegations etc.).8 We then re-estimate the probit
7 We thank an anonymous referee for this excellent suggestion. 8 We obtained the underlying source document from Adair Morse’s webpage at the following link: (http://faculty.haas.berkeley.edu/morse/research/papers/Whistleblowers%20in%20US%20frauds%20final.pdf)
16
model for each of these types of lawsuits. Consistent with our prediction, we find in Panel C, that
the mitigating effect of auditor expertise on lawsuit likelihood is concentrated in accounting-
related lawsuits. For non-accounting related lawsuits, CEO incentives are positively associated
with the likelihood of a lawsuit even when the firm is audited by an expert auditor.9
4.1.3. Propensity-score based matching
In a recent study, Armstrong et al. (2010) argue that prior studies incorrectly select control
firms based on matching on the outcome variable (i.e., accounting manipulation). They posit that
using a propensity score design that achieves maximum variation in the variable of interest (i.e.,
equity incentives) while minimizing variation in the control variables, is a superior econometric
approach to matching on the outcome variable. Using this improved empirical design, they
document no association between CEO incentives and accounting manipulation. A critical next
step for us then is to examine the sensitivity of our inferences to this technique. In particular, we
follow Armstrong et al. (2010) and perform the following three steps – (i) we estimate a
propensity-score model, i.e., the probability that the CEO will receive high equity incentives
conditional on observable features of the contracting environment. Second, we identify matched-
9 We strongly urge the readers to interpret these results cautiously for two reasons. First, the classification of lawsuits into accounting-related and non-accounting related tends to be subjective. For example, we found several cases where it was difficult to unambiguously classify the lawsuits into accounting-related versus not accounting-related. That was the reason we supplemented our classification with that in Hennes et al. (2008). While we drop these ambiguous cases from either classification, it is hard to gauge the sensitivity of our results to classifying lawsuits based on other criteria. Second, we start to slice the data more and more thinly as we introduce additional levels of differencing. In particular, we start with 201 firm-years where LAWSUIT=1. The first split is based on auditor expertise, where we have 18 firm-years where LAWSUIT=1 in the EXPERTISE=1 subsample (3.00% of the sample of 601 observation) and the remaining 183 firm-years in the EXPERTISE=0 subsample (2.68% of the sample of 6,826 observations). Now, when we slice the EXPERTISE=1 subsample further into accounting-related and non-accounting related and also omit the ambiguous cases, we have only 1 firm-year where LAWSUIT=1 and is an accounting-related lawsuit; and 9 firm-years where LAWSUIT=1 and is a non-accounting related lawsuit. Thus, we are able to provide only univariate evidence.
17
pairs with the smallest propensity-score differences and examine the covariate balance between
the treatment and control samples. Finally, we examine the relationship between equity
incentives and accounting manipulation by assessing whether the frequency of accounting
manipulations differ significantly between the treatment and control groups.
Panel D of Table 2 presents results of each of these steps. The first panel (Step 1) presents
results of the propensity-score model where we estimate the likelihood of receiving high equity
incentives using the median as the cutoff (i.e., Pr (EQ_HIGH = 1)) on the economic determinants
used in Armstrong et al. (2010) (see Section 3.2.1).10 Consistent with Armstrong et al., we find that
CEO incentives are greater at larger firms, firms with growth opportunities, and firms with
longer-tenured CEOs. Further, we find lower incentives in firms with more leverage, lower values
of GINDEX, non-affiliated directors, greater voting rights for large shareholders, and firms
without CEO duality. Further, the propensity model has a reasonable explanatory power of 24%,
which is on par with the 27% documented by Armstrong et al.
The second panel (labeled Step 2) presents results that verify covariate balance across the
3,601 pairs generated from Step 1 using the “nearest-neighbor” matching technique. As argued
by Armstrong et al. (2010), covariate balance is achieved if both the treatment and control groups
appear similar along their observable dimensions except for their level of equity incentives. To
assess covariate balance, we test in Panel A whether the mean value of each determinant differs
across the treatment and control groups.11 In addition to t-tests, we also report normalized
differences, defined (following Imbens and Rubin, 1997) as the difference in means scaled by the
average of the two within-group standard deviations. The advantage of normalized differences
10 While we exclude year and industry fixed effects to remain consistent with Armstrong et al., our results are robust to including these fixed effects. 11 Results based on the median are similar and are therefore not tabulated.
18
is that they are invariant to sample sizes and thus a more reliable way of assessing covariate
balance.12 A normalized difference of 0.25 or less indicates acceptable balance.
We start with equity incentives (EQINC) followed by the economic determinants. The
treatment group has mean incentives of around $1.4 million, compared to $72,000 for the control
group. Thus, there is a substantial difference in equity incentives between the two groups with a
normalized difference of 0.642. The subsequent rows indicate that the propensity-score model
does a good job of selecting control firms with similar economic determinants as treatment firms.
In particular, none of the normalized differences is even close to the cutoff of 0.25, with the highest
being -0.139 for INSTOWN. Even in cases where there is a statistical difference as per the t-test,
the economic differences are quite negligible. For example, return volatility is significantly
different between the two groups, but the average for the treatment group is 0.105 and 0.110 for
the control group. The statistical significance arises due to the large sample size for these tests,
which further justifies using normalized differences. Overall, these results suggest that the
covariates are generally well balanced across the treatment and control samples.
To further assess whether the differences between the two samples are important, we re-
estimate the propensity score model on the matched sample. The pseudo R-square of this
regression is 0.012 or 1.2%, as compared to 24% for the one in Step 1. We also re-estimate the
propensity score model on a matched sample now based on the “farthest-neighbor-match” that
maximizes the distance between the propensity scores. This specification returns a pseudo R-
square of 37%. We interpret these results as evidence that any differences between the matched
samples are unimportant.
12 We thank an anonymous referee for this suggestion.
19
The final panel of Table 2 (entitled Step 3) presents the comparison of the frequency of
accounting manipulations across the propensity-score based matched samples. Consistent with
Armstrong et al. (2010), we find no statistical difference (p. value = 0.898) in the number of firm-
years with lawsuits between the two groups in the full sample. In particular, the number of
lawsuit firm-years are 124 in the high incentives (i.e., treatment) group as compared to 126 in the
low incentives (i.e., control) group. This is especially striking given the substantial difference in
EQINC between the two groups (shown in last two columns). Overall, we find similar evidence
to Armstrong et al. (2010) using the propensity-score based matching model.13
However, when we split the propensity-based matched sample based on auditor expertise
and present the number of lawsuit firm-years across the individual sub-samples, the results are
again striking. 14 In the high auditor expertise sub-sample, there are significantly fewer lawsuit
firm-years in the treatment group compared to the control group (7 vs. 53), with this difference
being statistically significant (p. value = 0.000). Armstrong et al. (2010) also find some evidence
of a lower frequency of accounting manipulations in firms with more equity-based incentives.
There is a sizable difference in equity-based incentives between the two groups ($1.6 million vs.
$69,634), indicating that lack of power is not an issue. Turning to the low auditor expertise sub-
sample, there are more lawsuit firm-years in the treatment group than the control group (117 vs.
73), with this difference also being statistically significant (p. value = 0.003). Here too, there is a
large gap in equity incentives between the two groups ($1.3 million vs. $71,694). Overall, we find
that CEO incentives are associated with more frequent accounting manipulations when auditor
13 It is pertinent to note that the total number of “accounting manipulation” firm-years for this test is 250, as compared to 201 for the probit analyses. Two reasons account for this difference – (i) the latter is based on the overall sample, while the latter is based on a matched-sample design of 3,601 pairs, and (ii) the nearest-neighbor matching estimator is performed with replacement, which means that multiple obs. with LAWSUIT=1 can be used to form the low equity-incentives group. 14 There are only 18 observations where the matched pairs get split across the high and low auditor expertise groups. All results are robust to deleting these observations.
20
expertise is low; but less frequent when auditor expertise is high. Thus, our inferences are robust
to using the propensity-score based matching design of Armstrong et al. and suggest that auditor
expertise mitigates the association between CEO incentives and accounting manipulation by
acting as an effective detection mechanism.
4.2. The effect of auditor expertise on CEO equity incentives
4.2.1. Descriptive statistics
Descriptive statistics are presented in Panel A of Table 3. The values of EQINC indicate
that a 1% change in the stock price increase the value of the average CEO’s portfolio by $698,645,
and that of the median CEO by a more modest $193,221. These values are similar to those reported
in recent studies such as Chava and Purnanandam (2010) and Jayaraman and Milbourn (2012).
Close to 23% of the sample (i.e., 1,636 firm-year observations) is audited by an industry expert.
The values for the individual measures (EXPERTISE1 and EXPERTISE2) are 17% and 21%,
respectively. These are similar to the 12% and 21% reported by Reichelt and Wang (2010), even
though they use a larger sample that is not restricted to only Execucomp firms. Our sample is
made up of relatively large firms (i.e., the S&P 1500), which is typical of the ExecuComp database.
In particular, our average firm has annual sales of around $1.5 billion (exp (7.299)). Around 23%
of the assets of the firm are financed by debt. The sample firms are generally growing, as seen by
the average market-to-book ratio of around 3, and with average R&D and advertising
expenditures amounting to 4% and 1% of total sales respectively. The average firm reports ROA
of around 4% and an annual stock return of 14%. Overall, our sample is comparable to those used
in prior studies.
21
4.2.2. Multivariate evidence
In this section, we present results of Hypothesis H2, which predicts that firms grant their
CEOs more equity incentives when they are audited by an industry expert. Panel B of Table 3
presents results of the multivariate regression of EQINC on EXPERTISE and controls. We present
two sets of regressions. The first entitled “Entire sample” is self-explanatory and includes all firm-
year observations. The second, entitled “Non-varying sample”, excludes firm-years where the
auditor is an industry expert for only some of the years in the sample. Thus, out of the 1,636 firm-
years where the auditor is an industry expert, the auditor is an industry-expert for only part of
the sample in the case of 951 firm-years, and is an industry-expert all through the sample for 685
firm-years. In addition to deleting the former, we also delete 857 firm-year observations where
the firm appears in the sample only once, thus giving us a final sample (7,149 – 951 – 857 = 5,341
observations).
We present two specifications in each case. The first presents results for all auditees, while
the next restricts the sample to Big Four auditees. Consistent with hypothesis H2, the coefficient
on EXPERTISE is positive and significant in both specifications in the “Entire sample”, indicating
that CEO incentives are larger when an industry expert is the auditor of the firm. In terms of
economic significance, auditor expertise increases CEO equity incentives by 14%.15 Further, the
coefficient on EQINC remains positive and significant in both specifications of the “Non-varying
sample”, indicating that our results are robust to defining auditor expertise in a more stringent
fashion, similar to that in the accounting manipulation tests. The coefficient on EQINC is more
than twice in magnitude as compared to the full sample, indicating that this measure removes
measurement error in estimating auditor expertise, as we had contended before.
15 As equity incentives are expressed in logs, the economic magnitude is derived as exp(0.13)-1.
22
4.2.3. Role of stock price sensitivity to earnings
To bolster our inferences, we examine the role of stock price sensitivity to earnings in the
effect of auditor expertise on CEO incentives. If auditor expertise indeed lowers the cost of
granting equity incentives by decreasing the likelihood of accounting manipulation, then
hypothesis H3 predicts that our results should be pronounced in settings where earnings play an
important role in determining stock prices.16 To test H3, we define stock price sensitivity to
earnings at the industry level based on the 3-day earnings announcement returns. We split our
sample into high and low sensitivity to earnings (based on the median) and estimate the above
regression within each sub-group. Table 4 presents these results. Consistent with hypothesis H3,
the coefficient on EXPERTISE is positive and significant only in the high stock price sensitivity
group. Auditor expertise does not matter for CEO equity incentives in settings where earnings
play a relatively unimportant role in determining the stock price. These tests provide further
assurance that our results are indeed emanating from the detection channel that we hypothesize.
4.2.4. Endogeneity of auditor expertise
An unaddressed and natural concern is the endogeneity of auditor expertise, and in
particular, reverse causality where CEOs with greater equity incentives that are more aligned
with shareholders select expert auditors. Rather than building a full-fledged structural model that
explicitly incorporates all the costs and benefits of auditor expertise, we use a (presumably
exogenous) shock to auditor expertise to alleviate endogeneity concerns. Our identification
strategy uses the demise of Arthur Andersen (AA) as a quasi-natural experiment of forced auditor
changes (e.g., Blouin, Grein and Rountree, 2007; Dyck, Morse and Zingales, 2011). In particular,
16 We thank an anonymous referee for suggesting this test.
23
we use firms’ switch to a new auditor around AA’s demise as a quasi-exogenous shock to auditor
expertise and examine within-firm changes in CEO incentives.17 In particular, we compare changes
in CEO incentives of AA clients that employed an expert auditor in the post-AA period with those
that did not. This difference-in-differences design controls for all time-invariant differences across
firms that are possibly correlated with auditor expertise.
We construct our sample following the methodology in Blouin et al. (2007). In particular,
we use Audit Analytics to identify U.S. companies that were audited by AA prior to 2002
(excluding Enron) and have CEO compensation data on Execucomp. We compute the average
level of CEO equity incentives in the pre period (2000 to 2002) and the post period (2003 to 2007),
and define ∆EQINC as the change in equity incentives between the two periods. We define
changes in each control variable analogously. We define EXPERTISE as an indicator variable if
the new auditor is an industry expert. To examine how a shock to auditor expertise influences
changes in equity incentives, we regress ∆EQINC on EXPERTISE and controls.
Figure 1 presents graphical evidence for the 209 firms in the sample.18 The vertical axis
plots firm-level changes in equity incentives (∆EQINC ) around the event period, while the
horizontal axis indicates whether the incoming auditor is an industry expert. The vertical bar
corresponding to EXPERTISE=1 is higher than that corresponding to EXPERTISE=0, indicating
that CEO incentives increase more for firms with an expert auditor in the post period as compared
to those without.
Table 5 presents confirmatory statistical evidence. We present two specifications in Panel
A – Model 1 consists of only AA clients around the event (194 observations), where EXPERTISE
is an indicator variable denoting AA firms with an expert auditor in the post-period. Consistent
17 We thank an anonymous referee for suggesting this test. 18 This compares to 407 firms in Blouin et al. (2007) who are not constrained by Execucomp data.
24
with the graphical evidence, the coefficient on EXPERTISE is positive and significant, indicating
that CEO equity incentives around mandatory auditor switches increased more for AA firms
audited by an industry expert in the post period as compared to those that were not. Model 2
expands the sample to include all firms (901 observations) and incorporates an additional
indicator AA to denote Arthur Andersen clients. The coefficient of interest is EXPERTISE*AA,
which is again positive and significant, indicating that the increase in CEO equity incentives for
AA clients around the event survives the inclusion of non-AA clients as the control group. The
coefficient of 0.173 indicates that CEO incentives increase by 19% more for firms with an industry
expert in the post period.
A final concern is that while firms’ decision to switch auditors is exogenous, their choice
of the new auditor is not. To mitigate this selection-bias, we adopt a two-stage approach where
we model the likelihood of selecting an industry expert auditor (based on economic
determinants) in the first stage and incorporate the inverse Mills ratio in the second stage. We
follow Blouin et al., (2007) and include as our economic determinants, firm size (LNMVE),
whether or not Arthur Andersen was the industry expert in the pre-period (PRE_EXPERTISE),
leverage (PRE_LEV), growth opportunities (PRE_MB), the extent of discretionary accrual usage
(PRE_ABSACCR), whether the firm was making a loss (PRE_LOSS), the amount of free cash flows
to capture agency problems (PRE_FCF), and the number of segments and foreign sales to capture
firm complexity (PRE_SEG and PRE_FOREIGN). We expect the likelihood of selecting an
industry expert to increase in size, prior period expertise, agency conflicts, and complexity.
The first specification of Panel B presents results of the first stage. Several of the variables
enter the specification as expected, and in particular, PRE_EXPERTISE, which is positive and
significant, indicating that the likelihood of selecting an expert auditor is higher if the old auditor
was an industry expert. The second specification presents results of the second stage with the
25
inverse Mills ratio (MILLS) included as an additional control. It is comforting that the coefficient
on EXPERTISE*AA remains positive (0.218) and significant (t-stat = 2.12), indicating that our
results are robust to addressing the self-selection of the incoming auditor. Furthermore, the
coefficient on AA is negative (-0.105) and significant (t-stat = -1.88), indicating that AA clients that
chose a non-expert auditor in the post-period experienced a decrease in CEO equity incentives
(i.e., a removed treatment effect), which is again consistent with our hypotheses. Overall, these
time-series tests around mandatory auditor switches complement our cross-sectional analyses
and suggest that our inferences are unlikely to be driven by the endogeneity of auditor expertise.
4.3. Robustness tests
Finally, we subject our inferences to several additional robustness tests, and find that our
results survive in all cases.
4.3.1. Alternative measures of auditor expertise
Following Reichelt and Wang (2010), we verify the robustness of our results to replacing
the composite measure of auditor expertise with the two underlying measures – EXPERTISE1
and EXPERTISE2. We also use the continuous auditor market share variable (SHARE) rather than
the dichotomous variables. These results are presented in Panel A of Table 6. The estimated
coefficients on EXPERTISE1, EXPERTISE2 and SHARE are all positive and significant, indicating
that our inferences are robust to using alternative measures of auditor expertise.
4.3.2. Scaled measure of CEO incentives
Our results are also robust to using a scaled measure of CEO equity incentives. In
particular, we define EQINC_ALT as the ratio of stock option delta divided by the CEO’s salary
26
and present results based on this measure in Panel B of Table 6. The coefficient on EXPERTISE
continues to remain positive and significant in the full sample and also in the sample of only Big
Four auditees.
4.3.3. Top five executives
Following Erickson et al. (2006), we use EQINC of the top five executives rather than just
the CEO and tabulate these results in Panel C of Table 6. We find that our results are robust to
this alternative definition. In particular, the coefficient on EXPERTISE remains positive and
significant in both specifications using the top five executives.
4.3.4. Are the results driven by a few industries?
We perform additional tests to ensure that our results are not driven by only a few
industries. We focus on the high stock price sensitivity industries, because there is no effect of
auditor expertise on CEO equity incentives in the low sensitivity industries. In particular, we
identify the top five industries with the largest representation and delete each of these
individually. These industries are Financial institutions (SIC code 60 – 16% of the sample),
Industrial and Commercial Machinery and Computer Equipment (SIC code 35 – 14% of the
sample), Photographic, medical and optical Instruments (SIC code 38 – 14% of the sample), Health
services (SIC code 80 – 5% of the sample) and Transportation equipment (SIC code 37 – 4.6% of
the sample). We find that the coefficient on EXPERTISE remains positive and significant in every
case. The coefficients and t-stats are (0.206 and 2.06); (0.252 and 2.52); (0.238 and 2.35); (0.201 and
2.11) and (0.211 and 2.28) respectively. Our overall results clearly do not appear to be driven by
only a few industries.
27
5. Conclusion
We revisit the mixed findings on the association between CEO equity incentives and
accounting manipulation. We argue that even if CEO incentives increased the likelihood of
accounting manipulation, one might not observe a positive association ex post if there are
detection mechanisms in place that inhibit the manager’s ability to carry out the manipulation.
Using auditor industry expertise as one such mechanism, we provide strong evidence that the
positive association between CEO incentives and accounting manipulation is concentrated in sub-
samples where the auditor is not an industry expert. We fail to detect an association between CEO
incentives and accounting manipulation in firms audited by an industry expert.
An implication of the above results is that auditor expertise allows firms to grant their
CEOs more equity-based incentives by reducing the costs of accounting manipulation that
potentially accompany such incentive schemes. We find strong evidence in favor of this
prediction as well. Controlling for previously identified determinants of CEO equity incentives,
firms audited by an industry expert grant their CEOs more equity-based incentives to the tune of
14%. To alleviate endogeneity concerns, we use mandatory auditor switches around the demise
of Arthur Andersen as an exogenous shock to auditor expertise and find consistent evidence.
Our study offers two contributions. First, it incorporates the role of detection mechanisms,
such as auditor expertise, within the CEO contracting-financial misreporting literature. Second,
it broadens the role of effective auditing in the efficient functioning of firms. While the economic
consequences of auditing have focused on improvements to the information environment and
lower cost of financing, we show that financial statement verification plays an important role in
the way managers are incentivized. This link is important, given that CEO incentives have been
shown to have wide implications for managerial risk-taking (Coles et al., 2006) and the efficient
28

functioning of corporate governance structures (e.g., Admati and Pfleiderer, 2009; Edmans, 2009;
Bharath, Jayaraman and Nagar, 2013).
29
References Admati, A., and P. Pfleiderer, 2009, The Wall Street Walk and Shareholder Activism: Exit as a
Form of Voice, Review of Financial Studies 22, pg. 2645-2685 Aggarwal, R., Samwick, A., 1999. The other side of the trade-off: The impact of risk on executive
compensation. Journal of Political Economy, Vol. 107, pp. 65–105. Anderson, R., S. Mansi and D. Reeb, 2004, Board characteristics, accounting report integrity, and
the cost of debt, Journal of Accounting and Economics, Vol. 37 (3), pg. 315-342 Armstrong, C., A. Jagolinzer and D. Larcker, 2009, Chief Executive Officer Equity Incentives and
Accounting Irregularities, Journal of Accounting Research, Vol. 48 (2), pg. 225-271 Baber, W., S. Janakiraman, and S. Kang., 1996, Investment Opportunities and the Structure of
Executive Compensation, Journal of Accounting & Economics 21, no. 3: 297-318. Baber, W., S. Kang and L. Liang, 2007, Shareholder Rights, Corporate Governance and
Accounting Restatement, Working paper, Georgetown University, 2007 Ball, R, S. Jayaraman and L. Shivakumar, 2012, Audited financial reporting and voluntary
disclosure as complements: A test of the confirmation hypothesis, Journal of Accounting & Economics, Vol. 53, pg. 136-166
Balsam, S., J. Krishnan, and J. S. Yang, 2003, Auditor Industry Specialization and Earnings
Quality, Auditing: A Journal of Practice and Theory 22: 71–97. Bergstresser, D., and T. Philippon, 2006, CEO incentives and earnings management, Journal of
Financial Economics, Vol. 80 (3), pg. 511-529 Bharath, S., S. Jayaraman and V. Nagar, 2013, Exit as Governance: An Empirical Analysis, Journal
of Finance, Vol. 68 (6), pg. 2515-2547 Blouin, J., B. Grein, and B. Rountree, 2007, An analysis of forced auditor change: The case of
former Arthur Andersen clients, The Accounting Review, Volume: 82 (3), pg. 621-650 Burns, N. and S. Kedia, 2006, The Impact of Performance-Based Compensation on Misreporting,
Journal of Financial Economics, Vol. 79, pg. 35–67 Bushman, R. M., and A. J. Smith, 2001, Financial accounting information and corporate
governance, Journal of Accounting & Economics 32, no. 1-3: 237-333 Chava, Sudheer and Amiyatosh Purnanandam, 2010, CEOs versus CFOs: Incentives and
corporate policies, Journal of Financial Economics, 97, pg. 263-278 Clinch, G., 1991, Employee Compensation and Firms Research-and-Development Activity
Journal of Accounting Research 29, no. 1: 59-78.
30
Coles, J. L., N. D. Daniel and L. Naveen, 2006, Managerial incentives and risk-taking, Journal of Financial Economics, Vol. 79 (2), pg. 431-468
Core, J., and W. Guay, 1999, The Use of Equity Grants to Manage Optimal Equity Incentive Levels,
Journal of Accounting & Economics 28: 151–84. Core, John, and W. Guay, 2002, Estimating the value of employee stock option portfolios and their
sensitivities to price and volatility. Journal of Accounting Research 40, 613–630. Core, J. E., R. W. Holthausen and D. F. Larcker, 1999, Corporate governance, chief executive
officer compensation, and firm performance, Journal of Financial Economics 51, 371-406. Craswell, A. T., J. R. Francis; and S. L. Taylor, 1995, Auditor brand name reputations and industry
specializations, Journal of Accounting and Economics Vol. 20, pg. 297–322. DeFond, M. L.; J. R. Francis; and T. J. Wong, 2000, Auditor industry specialization and market
segmentation: Evidence from Hong Kong, Auditing: A Journal of Practice and Theory 19: 49–66 Demsetz, Harold, and Kenneth Lehn, 1985, The structure of corporate ownership: Causes and
consequences, Journal of Political Economy 93, 1155-1177 Denis, D., P. Hanouna, and A. Sarin, 2006, Is There a Dark Side to Incentive Compensation?
Journal of Corporate Finance, Vol. 12 (3) Dyck, A., A. Morse, and L. Zingales, 2010, Who Blows the Whistle on Corporate Fraud? Journal of
Finance, Vol. 65 (6), pg. 2213-2253 Dyck, A., A. Morse, and L. Zingales, 2013, How Pervasive is Corporate Fraud? University of
Toronto working paper Edmans, A., 2009, Blockholder Trading, Market Efficiency, and Managerial Myopia, Journal of
Finance 64, pg. 2481 - 2583. Efendi, J., A. Srivastava and E. Swanson, 2007, Why do corporate managers misstate financial
statements? The role of option compensation and other factors, Journal of Financial Economics 85: 667-708.
Erickson, M. M. Hanlon and E. Maydew, 2006, Is There a Link between Executive Equity
Incentives and Accounting Fraud? Journal of Accounting Research 44: 113-143. Gabaix, X and A. Landier, 2008, Why has CEO pay increased so much?
Quarterly Journal of Economics, Vol. 123 (1), pg. 49-100 Garvey, G. and T. Milbourn, 2003, Incentive compensation when executives can hedge the
market: evidence of relative performance evaluation in the cross-section, Journal of Finance 58 pp. 1557–1582
31
Gaver, J. J., and K. M. Gaver, 1993, Additional evidence on the association between the investment opportunity set and corporate financing, dividend, and compensation policies, Journal of Accounting & Economics 16, no. 1-3: 125-60.
Goldman, E., and S. L. Slezak, 2006, An equilibrium model of incentive contracts in the presence
of information manipulation, Journal of Financial Economics 80, no. 3: 603-26. Gompers, P., J. Ishii and A. Metrick, 2003, Corporate governance and equity prices, Quarterly
Journal of Economics 118, 107-155 Gunny, K., G. Krishnan and T. Zhang, 2007, Is Audit Quality Associated with Auditor Tenure,
Industry Expertise, and Fees? Evidence from PCAOB Opinions, UC Boulder working paper Harris, J., and P. Bromiley, 2007, Incentives to cheat: The influence of executive compensation and
firm performance on financial misrepresentation, Organization Science, Vol. 18 (3), pg. 350-367 Hennes, K., and A. Leone, and B. Miller, 2008, The importance of distinguishing errors from
irregularities in restatement research: The case of restatements and CEO/CFO turnover, The Accounting Review, Vol. 83, 1487-1520
Imbens, G.W., and D.B. Rubin, 1997, Baynesian inference for causal effects in randomized
experiments with noncompliance, Annals of Statistics, 25, 305-327. Ittner, C. D., R. Lambert, and D. Larcker, 2003, The structure and performance consequences of
equity grants to employees of new economy firms, Journal of Accounting & Economics 34, no. 1-3: 89-127.
Jayaraman, S. and T.T. Milbourn, 2012, The role of stock liquidity in executive compensation,
The Accounting Review, Vol. 87 (2), pg. 537-563 Jensen, M., 2003, Paying People to Lie: the Truth about the Budgeting Process, European Financial
Management, Vol. 9(3), pg. 379-406 Krishnan, G. V., 2003, Does Big 6 Auditor Industry Expertise Constrain Earnings Management?
Accounting Horizons 17 (2003): 1–16. Lambert, R., and D. Larcker, 1987, An analysis of the use of accounting and market measures of
performance in executive-compensation contracts, Journal of Accounting Research 25: 85-129. Laux, C., and V. Laux., 2009, Board Committees, CEO Compensation, and Earnings Management
Accounting Review 84, no. 3: 869-91. Neal, T. L. and R.R. Riley, Jr., 2004, Auditor Industry Specialist Research Design.” Auditing: A
Journal of Practice and Theory 23: 169–77 Peng, L., and A. Roell, 2008, Manipulation and equity-based compensation, American Economic
Review 98, no. 2: 285-90.
32
Petersen, M. A., 2009, Estimating standard errors in finance panel data sets: Comparing approaches, Review of Financial Studies 22, no. 1 (2009): 435-80.
Pittman, J.A. and S. Fortin, 2004, Auditor choice and the cost of debt capital for newly public
firms, Journal of Accounting & Economics, Vol. 37 (1), pg. 113-136 Prendergast, C., 2000, What Trade-off of Risk and Incentives? American Economic Review Papers
and Proceedings, 90: 421–25. Prendergast, C., 2002, The tenuous trade-off between risk and incentives, Journal of Political
Economy 110: 1071–102 Reichelt, J. K., and D. Wang, 2010, National and office-specific measures of auditor industry
expertise and effects on audit quality, Journal of Accounting Research 48 (3): 647–686. Solomon, I., M. Shields and O.R. Whittington, 1999, What do industry-specialist auditors know?
Journal of Accounting Research, Vol. 37, No. 1, pp. 191-208 Smith, C. W., and R. L. Watts., 1992, The Investment Opportunity Set and Corporate Financing,
Dividend, and Compensation Policies Journal of Financial Economics 32, no. 3: 263-92.
33
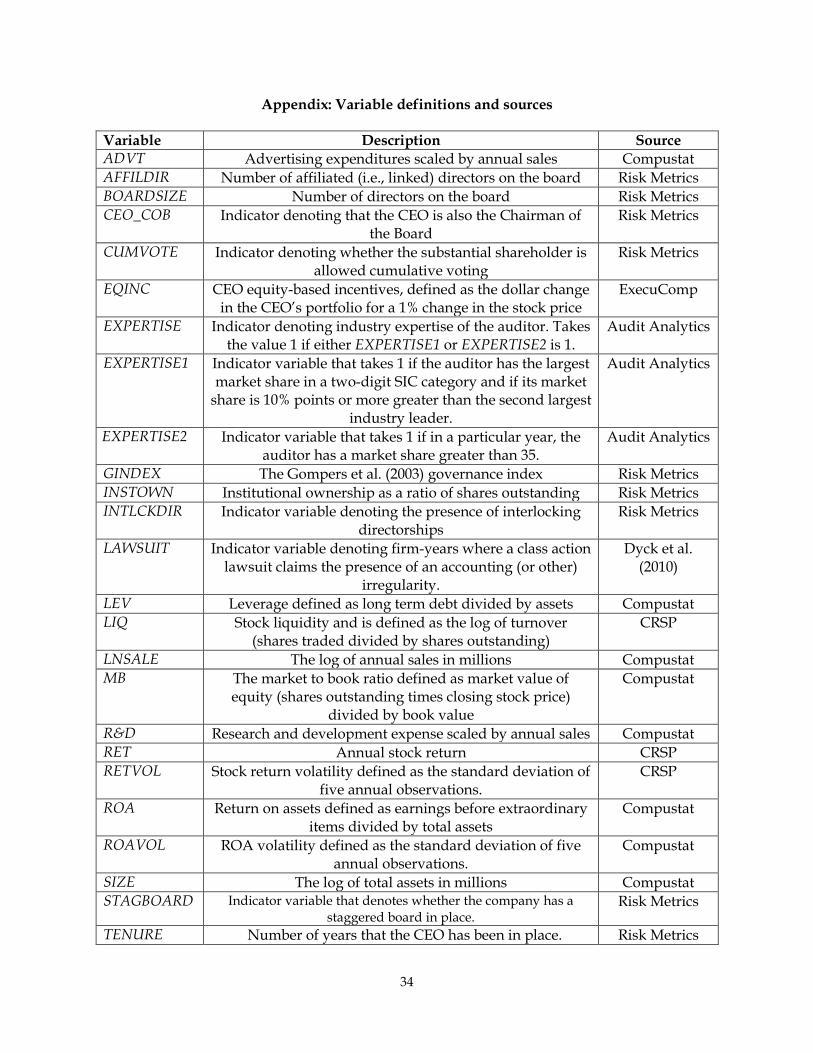
Appendix: Variable definitions and sources
Variable Description Source ADVT Advertising expenditures scaled by annual sales Compustat AFFILDIR Number of affiliated (i.e., linked) directors on the board Risk Metrics BOARDSIZE Number of directors on the board Risk Metrics CEO_COB Indicator denoting that the CEO is also the Chairman of
the Board Risk Metrics
CUMVOTE Indicator denoting whether the substantial shareholder is allowed cumulative voting
Risk Metrics
EQINC CEO equity-based incentives, defined as the dollar change in the CEO’s portfolio for a 1% change in the stock price
ExecuComp
EXPERTISE Indicator denoting industry expertise of the auditor. Takes the value 1 if either EXPERTISE1 or EXPERTISE2 is 1.
Audit Analytics
EXPERTISE1 Indicator variable that takes 1 if the auditor has the largest market share in a two-digit SIC category and if its market
share is 10% points or more greater than the second largest industry leader.
Audit Analytics
EXPERTISE2 Indicator variable that takes 1 if in a particular year, the auditor has a market share greater than 35.
Audit Analytics
GINDEX The Gompers et al. (2003) governance index Risk Metrics INSTOWN Institutional ownership as a ratio of shares outstanding Risk Metrics INTLCKDIR Indicator variable denoting the presence of interlocking
directorships Risk Metrics
LAWSUIT Indicator variable denoting firm-years where a class action lawsuit claims the presence of an accounting (or other)
irregularity.
Dyck et al. (2010)
LEV Leverage defined as long term debt divided by assets Compustat LIQ Stock liquidity and is defined as the log of turnover
(shares traded divided by shares outstanding) CRSP
LNSALE The log of annual sales in millions Compustat MB The market to book ratio defined as market value of
equity (shares outstanding times closing stock price) divided by book value
Compustat
R&D Research and development expense scaled by annual sales Compustat RET Annual stock return CRSP RETVOL Stock return volatility defined as the standard deviation of
five annual observations. CRSP
ROA Return on assets defined as earnings before extraordinary items divided by total assets
Compustat
ROAVOL ROA volatility defined as the standard deviation of five annual observations.
Compustat
SIZE The log of total assets in millions Compustat STAGBOARD Indicator variable that denotes whether the company has a
staggered board in place. Risk Metrics
TENURE Number of years that the CEO has been in place. Risk Metrics
34
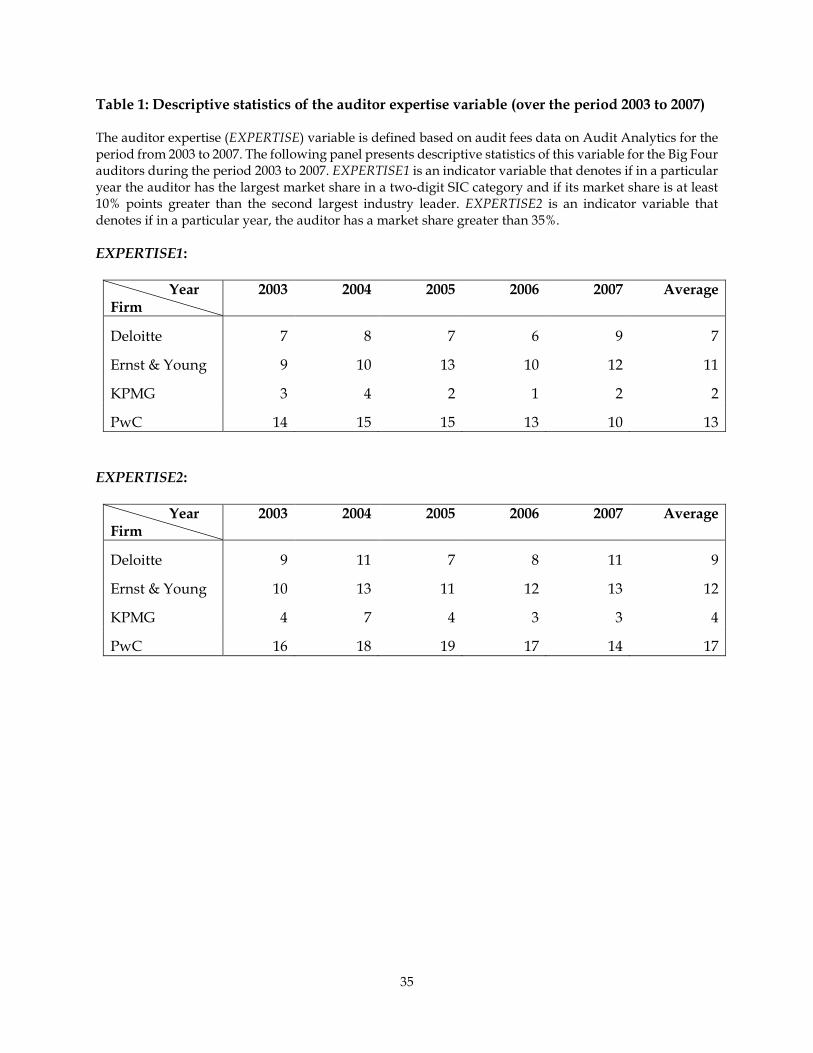
Table 1: Descriptive statistics of the auditor expertise variable (over the period 2003 to 2007) The auditor expertise (EXPERTISE) variable is defined based on audit fees data on Audit Analytics for the period from 2003 to 2007. The following panel presents descriptive statistics of this variable for the Big Four auditors during the period 2003 to 2007. EXPERTISE1 is an indicator variable that denotes if in a particular year the auditor has the largest market share in a two-digit SIC category and if its market share is at least 10% points greater than the second largest industry leader. EXPERTISE2 is an indicator variable that denotes if in a particular year, the auditor has a market share greater than 35%. EXPERTISE1:
Year Firm
2003 2004 2005 2006 2007 Average
Deloitte 7 8 7 6 9 7
Ernst & Young 9 10 13 10 12 11
KPMG 3 4 2 1 2 2
PwC 14 15 15 13 10 13 EXPERTISE2:
Year Firm
2003 2004 2005 2006 2007 Average
Deloitte 9 11 7 8 11 9
Ernst & Young 10 13 11 12 13 12
KPMG 4 7 4 3 3 4
PwC 16 18 19 17 14 17
35
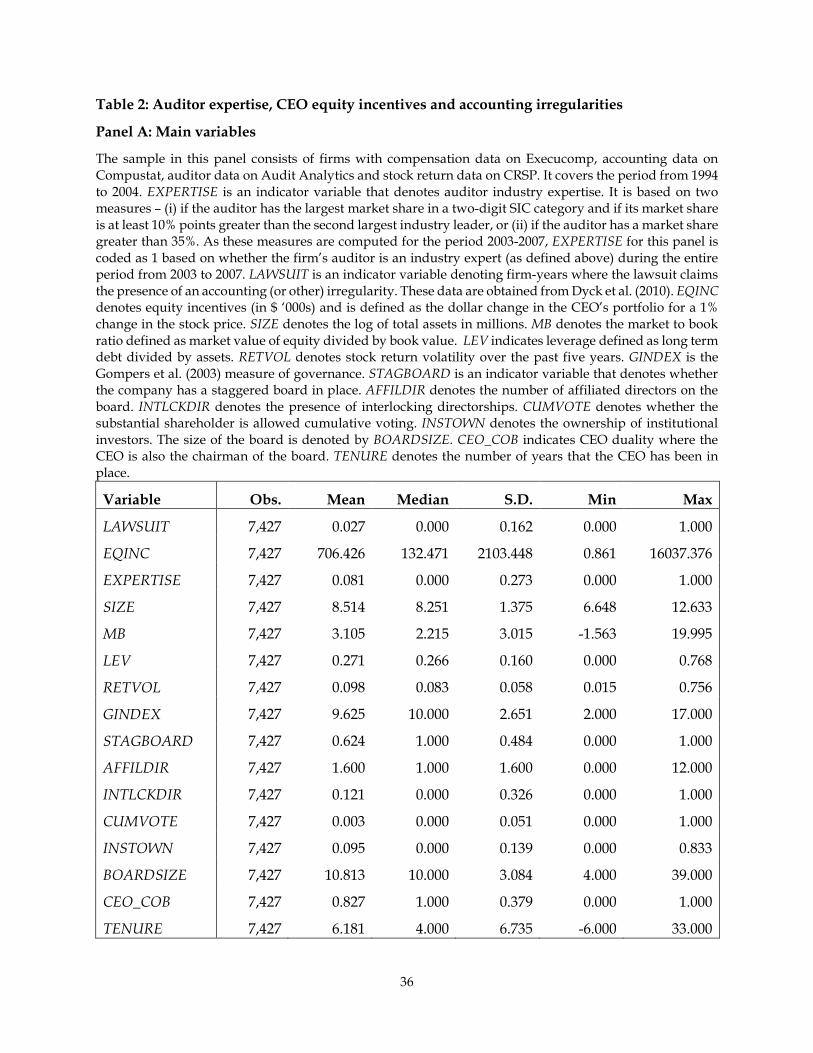
Table 2: Auditor expertise, CEO equity incentives and accounting irregularities
Panel A: Main variables
The sample in this panel consists of firms with compensation data on Execucomp, accounting data on Compustat, auditor data on Audit Analytics and stock return data on CRSP. It covers the period from 1994 to 2004. EXPERTISE is an indicator variable that denotes auditor industry expertise. It is based on two measures – (i) if the auditor has the largest market share in a two-digit SIC category and if its market share is at least 10% points greater than the second largest industry leader, or (ii) if the auditor has a market share greater than 35%. As these measures are computed for the period 2003-2007, EXPERTISE for this panel is coded as 1 based on whether the firm’s auditor is an industry expert (as defined above) during the entire period from 2003 to 2007. LAWSUIT is an indicator variable denoting firm-years where the lawsuit claims the presence of an accounting (or other) irregularity. These data are obtained from Dyck et al. (2010). EQINC denotes equity incentives (in $ ‘000s) and is defined as the dollar change in the CEO’s portfolio for a 1% change in the stock price. SIZE denotes the log of total assets in millions. MB denotes the market to book ratio defined as market value of equity divided by book value. LEV indicates leverage defined as long term debt divided by assets. RETVOL denotes stock return volatility over the past five years. GINDEX is the Gompers et al. (2003) measure of governance. STAGBOARD is an indicator variable that denotes whether the company has a staggered board in place. AFFILDIR denotes the number of affiliated directors on the board. INTLCKDIR denotes the presence of interlocking directorships. CUMVOTE denotes whether the substantial shareholder is allowed cumulative voting. INSTOWN denotes the ownership of institutional investors. The size of the board is denoted by BOARDSIZE. CEO_COB indicates CEO duality where the CEO is also the chairman of the board. TENURE denotes the number of years that the CEO has been in place.
Variable Obs. Mean Median S.D. Min Max
LAWSUIT 7,427 0.027 0.000 0.162 0.000 1.000
EQINC 7,427 706.426 132.471 2103.448 0.861 16037.376
EXPERTISE 7,427 0.081 0.000 0.273 0.000 1.000
SIZE 7,427 8.514 8.251 1.375 6.648 12.633
MB 7,427 3.105 2.215 3.015 -1.563 19.995
LEV 7,427 0.271 0.266 0.160 0.000 0.768
RETVOL 7,427 0.098 0.083 0.058 0.015 0.756
GINDEX 7,427 9.625 10.000 2.651 2.000 17.000
STAGBOARD 7,427 0.624 1.000 0.484 0.000 1.000
AFFILDIR 7,427 1.600 1.000 1.600 0.000 12.000
INTLCKDIR 7,427 0.121 0.000 0.326 0.000 1.000
CUMVOTE 7,427 0.003 0.000 0.051 0.000 1.000
INSTOWN 7,427 0.095 0.000 0.139 0.000 0.833
BOARDSIZE 7,427 10.813 10.000 3.084 4.000 39.000
CEO_COB 7,427 0.827 1.000 0.379 0.000 1.000
TENURE 7,427 6.181 4.000 6.735 -6.000 33.000
36
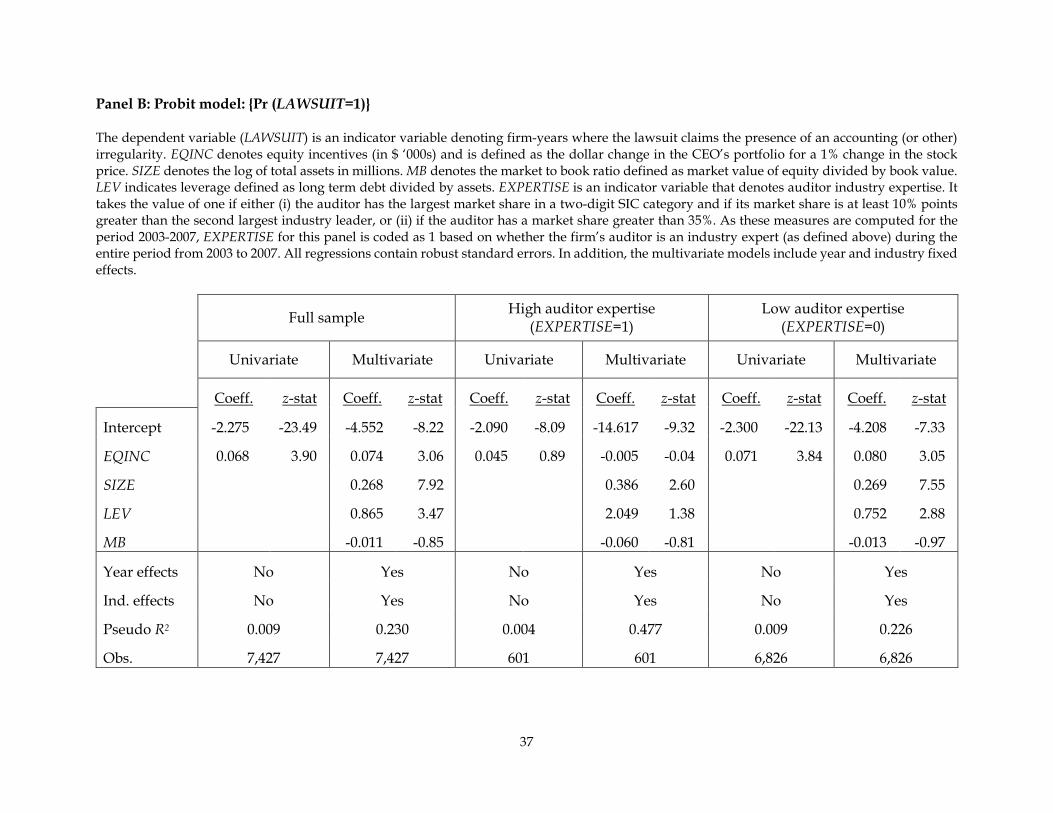
Panel B: Probit model: {Pr (LAWSUIT=1)} The dependent variable (LAWSUIT) is an indicator variable denoting firm-years where the lawsuit claims the presence of an accounting (or other) irregularity. EQINC denotes equity incentives (in $ ‘000s) and is defined as the dollar change in the CEO’s portfolio for a 1% change in the stock price. SIZE denotes the log of total assets in millions. MB denotes the market to book ratio defined as market value of equity divided by book value. LEV indicates leverage defined as long term debt divided by assets. EXPERTISE is an indicator variable that denotes auditor industry expertise. It takes the value of one if either (i) the auditor has the largest market share in a two-digit SIC category and if its market share is at least 10% points greater than the second largest industry leader, or (ii) if the auditor has a market share greater than 35%. As these measures are computed for the period 2003-2007, EXPERTISE for this panel is coded as 1 based on whether the firm’s auditor is an industry expert (as defined above) during the entire period from 2003 to 2007. All regressions contain robust standard errors. In addition, the multivariate models include year and industry fixed effects.
Full sample High auditor expertise
(EXPERTISE=1) Low auditor expertise
(EXPERTISE=0) Univariate Multivariate Univariate Multivariate Univariate Multivariate
Coeff. z-stat Coeff. z-stat Coeff. z-stat Coeff. z-stat Coeff. z-stat Coeff. z-stat
Intercept -2.275 -23.49 -4.552 -8.22 -2.090 -8.09 -14.617 -9.32 -2.300 -22.13 -4.208 -7.33
EQINC 0.068 3.90 0.074 3.06 0.045 0.89 -0.005 -0.04 0.071 3.84 0.080 3.05
SIZE 0.268 7.92 0.386 2.60 0.269 7.55
LEV 0.865 3.47 2.049 1.38 0.752 2.88
MB -0.011 -0.85 -0.060 -0.81 -0.013 -0.97
Year effects No Yes No Yes No Yes
Ind. effects No Yes No Yes No Yes
Pseudo R2 0.009 0.230 0.004 0.477 0.009 0.226
Obs. 7,427 7,427 601 601 6,826 6,826
37
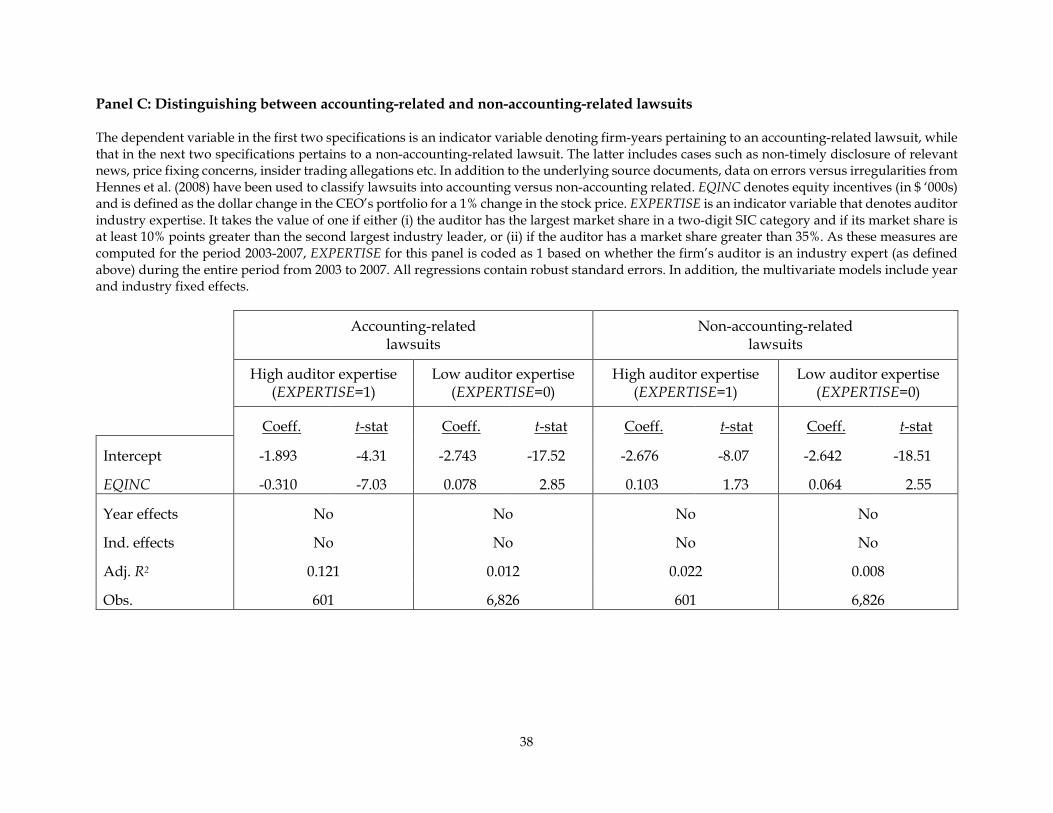
Panel C: Distinguishing between accounting-related and non-accounting-related lawsuits The dependent variable in the first two specifications is an indicator variable denoting firm-years pertaining to an accounting-related lawsuit, while that in the next two specifications pertains to a non-accounting-related lawsuit. The latter includes cases such as non-timely disclosure of relevant news, price fixing concerns, insider trading allegations etc. In addition to the underlying source documents, data on errors versus irregularities from Hennes et al. (2008) have been used to classify lawsuits into accounting versus non-accounting related. EQINC denotes equity incentives (in $ ‘000s) and is defined as the dollar change in the CEO’s portfolio for a 1% change in the stock price. EXPERTISE is an indicator variable that denotes auditor industry expertise. It takes the value of one if either (i) the auditor has the largest market share in a two-digit SIC category and if its market share is at least 10% points greater than the second largest industry leader, or (ii) if the auditor has a market share greater than 35%. As these measures are computed for the period 2003-2007, EXPERTISE for this panel is coded as 1 based on whether the firm’s auditor is an industry expert (as defined above) during the entire period from 2003 to 2007. All regressions contain robust standard errors. In addition, the multivariate models include year and industry fixed effects.
Accounting-related lawsuits
Non-accounting-related lawsuits
High auditor expertise (EXPERTISE=1)
Low auditor expertise (EXPERTISE=0)
High auditor expertise (EXPERTISE=1)
Low auditor expertise (EXPERTISE=0)
Coeff. t-stat Coeff. t-stat Coeff. t-stat Coeff. t-stat
Intercept -1.893 -4.31 -2.743 -17.52 -2.676 -8.07 -2.642 -18.51
EQINC -0.310 -7.03 0.078 2.85 0.103 1.73 0.064 2.55
Year effects No No No No
Ind. effects No No No No
Adj. R2 0.121 0.012 0.022 0.008
Obs. 601 6,826 601 6,826
38
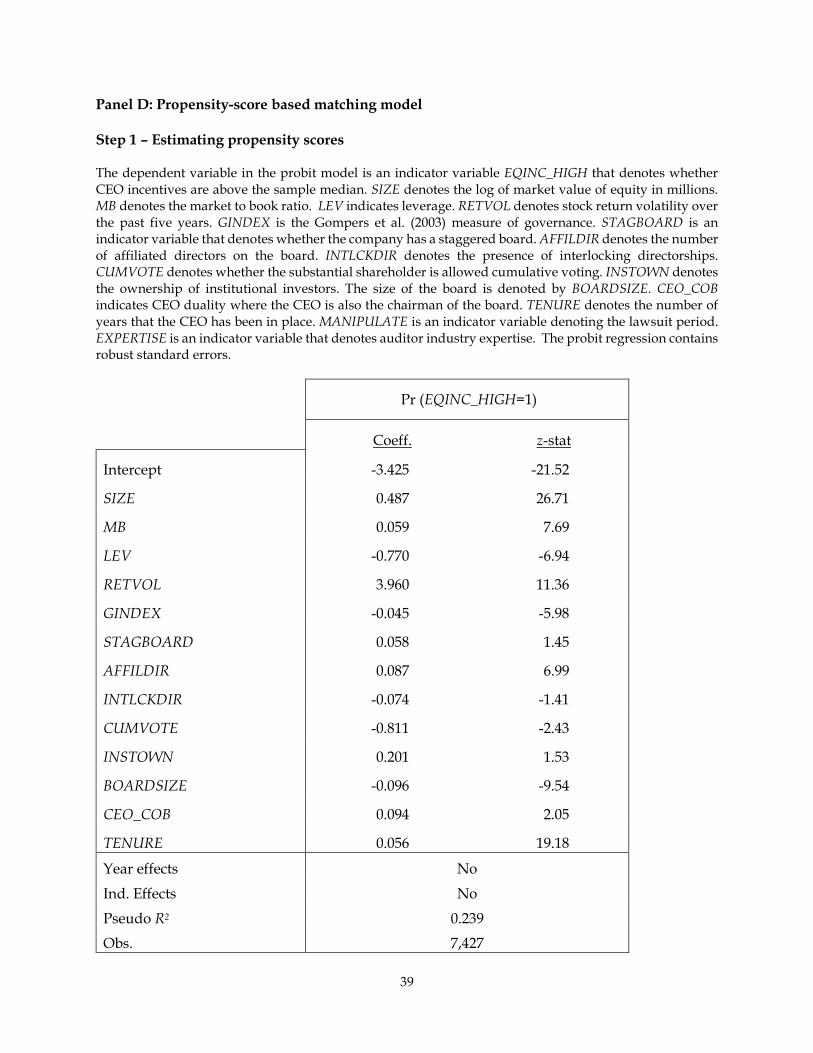
Panel D: Propensity-score based matching model Step 1 – Estimating propensity scores The dependent variable in the probit model is an indicator variable EQINC_HIGH that denotes whether CEO incentives are above the sample median. SIZE denotes the log of market value of equity in millions. MB denotes the market to book ratio. LEV indicates leverage. RETVOL denotes stock return volatility over the past five years. GINDEX is the Gompers et al. (2003) measure of governance. STAGBOARD is an indicator variable that denotes whether the company has a staggered board. AFFILDIR denotes the number of affiliated directors on the board. INTLCKDIR denotes the presence of interlocking directorships. CUMVOTE denotes whether the substantial shareholder is allowed cumulative voting. INSTOWN denotes the ownership of institutional investors. The size of the board is denoted by BOARDSIZE. CEO_COB indicates CEO duality where the CEO is also the chairman of the board. TENURE denotes the number of years that the CEO has been in place. MANIPULATE is an indicator variable denoting the lawsuit period. EXPERTISE is an indicator variable that denotes auditor industry expertise. The probit regression contains robust standard errors.
Pr (EQINC_HIGH=1)
Coeff. z-stat
Intercept -3.425 -21.52
SIZE 0.487 26.71
MB 0.059 7.69
LEV -0.770 -6.94
RETVOL 3.960 11.36
GINDEX -0.045 -5.98
STAGBOARD 0.058 1.45
AFFILDIR 0.087 6.99
INTLCKDIR -0.074 -1.41
CUMVOTE -0.811 -2.43
INSTOWN 0.201 1.53
BOARDSIZE -0.096 -9.54
CEO_COB 0.094 2.05
TENURE 0.056 19.18
Year effects No
Ind. Effects No
Pseudo R2 0.239
Obs. 7,427
39
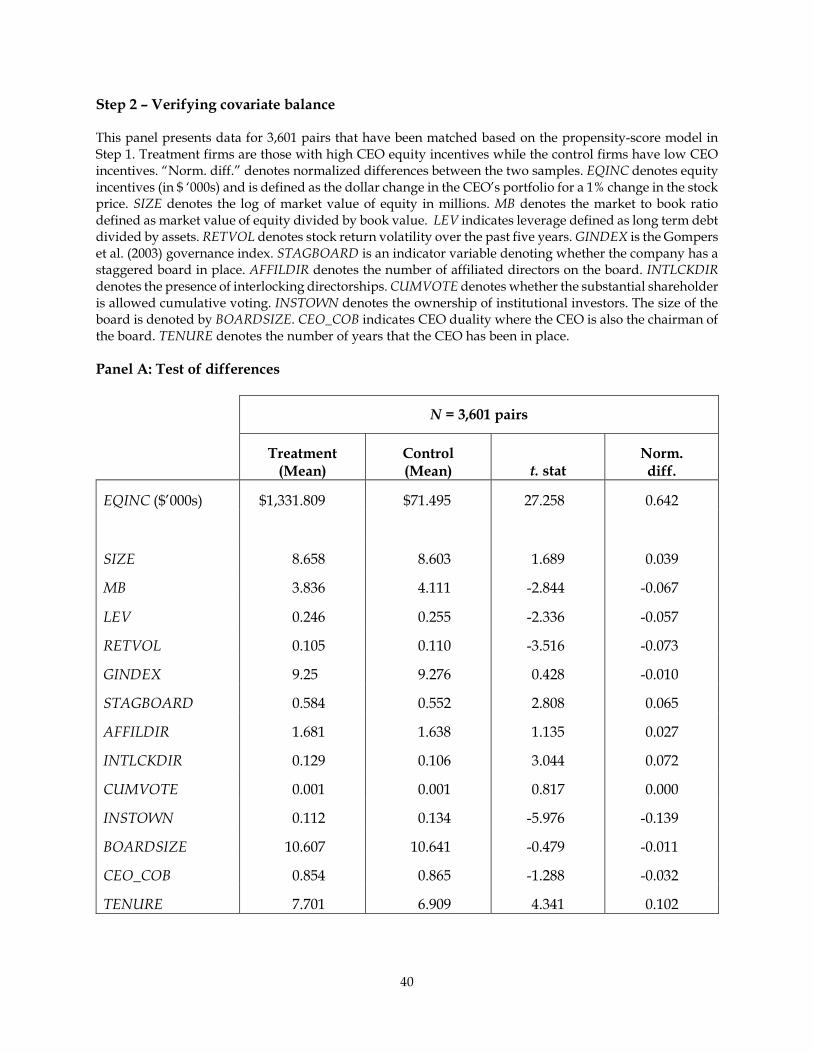
Step 2 – Verifying covariate balance This panel presents data for 3,601 pairs that have been matched based on the propensity-score model in Step 1. Treatment firms are those with high CEO equity incentives while the control firms have low CEO incentives. “Norm. diff.” denotes normalized differences between the two samples. EQINC denotes equity incentives (in $ ‘000s) and is defined as the dollar change in the CEO’s portfolio for a 1% change in the stock price. SIZE denotes the log of market value of equity in millions. MB denotes the market to book ratio defined as market value of equity divided by book value. LEV indicates leverage defined as long term debt divided by assets. RETVOL denotes stock return volatility over the past five years. GINDEX is the Gompers et al. (2003) governance index. STAGBOARD is an indicator variable denoting whether the company has a staggered board in place. AFFILDIR denotes the number of affiliated directors on the board. INTLCKDIR denotes the presence of interlocking directorships. CUMVOTE denotes whether the substantial shareholder is allowed cumulative voting. INSTOWN denotes the ownership of institutional investors. The size of the board is denoted by BOARDSIZE. CEO_COB indicates CEO duality where the CEO is also the chairman of the board. TENURE denotes the number of years that the CEO has been in place. Panel A: Test of differences
N = 3,601 pairs
Treatment
(Mean) Control (Mean) t. stat
Norm. diff.
EQINC ($’000s) $1,331.809 $71.495 27.258 0.642
SIZE 8.658 8.603 1.689 0.039
MB 3.836 4.111 -2.844 -0.067
LEV 0.246 0.255 -2.336 -0.057
RETVOL 0.105 0.110 -3.516 -0.073
GINDEX 9.25 9.276 0.428 -0.010
STAGBOARD 0.584 0.552 2.808 0.065
AFFILDIR 1.681 1.638 1.135 0.027
INTLCKDIR 0.129 0.106 3.044 0.072
CUMVOTE 0.001 0.001 0.817 0.000
INSTOWN 0.112 0.134 -5.976 -0.139
BOARDSIZE 10.607 10.641 -0.479 -0.011
CEO_COB 0.854 0.865 -1.288 -0.032
TENURE 7.701 6.909 4.341 0.102
40
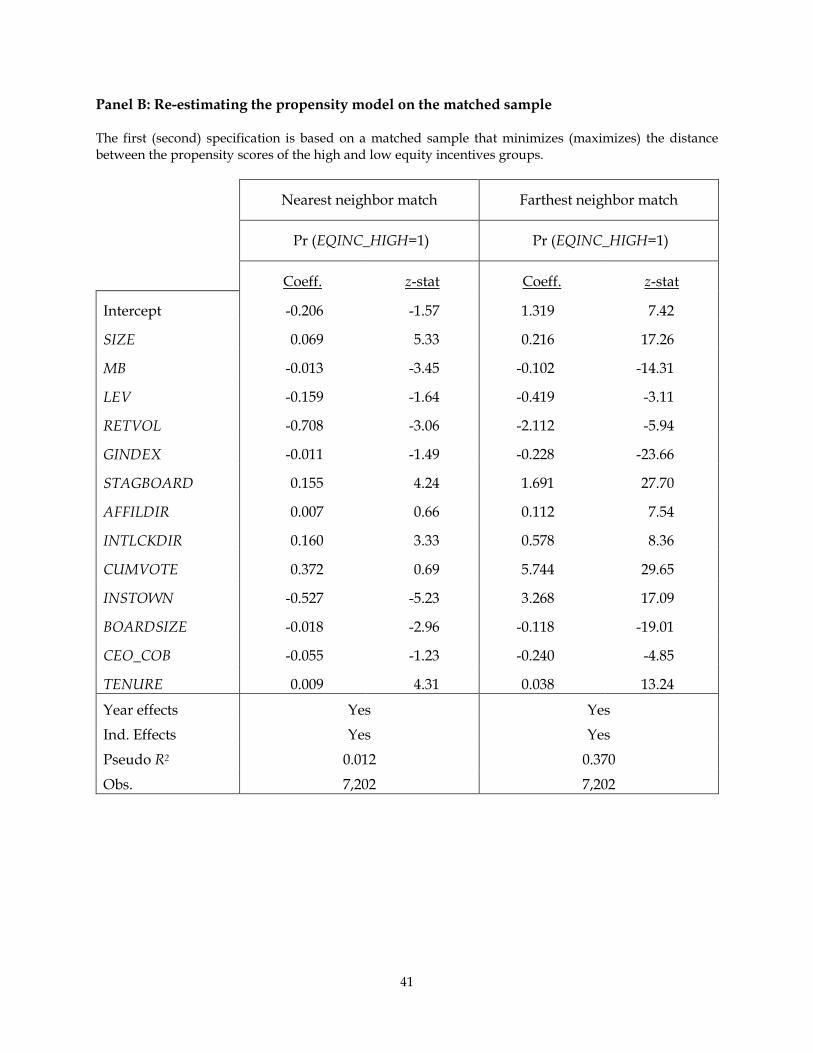
Panel B: Re-estimating the propensity model on the matched sample The first (second) specification is based on a matched sample that minimizes (maximizes) the distance between the propensity scores of the high and low equity incentives groups.
Nearest neighbor match Farthest neighbor match
Pr (EQINC_HIGH=1) Pr (EQINC_HIGH=1)
Coeff. z-stat Coeff. z-stat
Intercept -0.206 -1.57 1.319 7.42
SIZE 0.069 5.33 0.216 17.26
MB -0.013 -3.45 -0.102 -14.31
LEV -0.159 -1.64 -0.419 -3.11
RETVOL -0.708 -3.06 -2.112 -5.94
GINDEX -0.011 -1.49 -0.228 -23.66
STAGBOARD 0.155 4.24 1.691 27.70
AFFILDIR 0.007 0.66 0.112 7.54
INTLCKDIR 0.160 3.33 0.578 8.36
CUMVOTE 0.372 0.69 5.744 29.65
INSTOWN -0.527 -5.23 3.268 17.09
BOARDSIZE -0.018 -2.96 -0.118 -19.01
CEO_COB -0.055 -1.23 -0.240 -4.85
TENURE 0.009 4.31 0.038 13.24
Year effects Yes Yes
Ind. Effects Yes Yes
Pseudo R2 0.012 0.370
Obs. 7,202 7,202
41
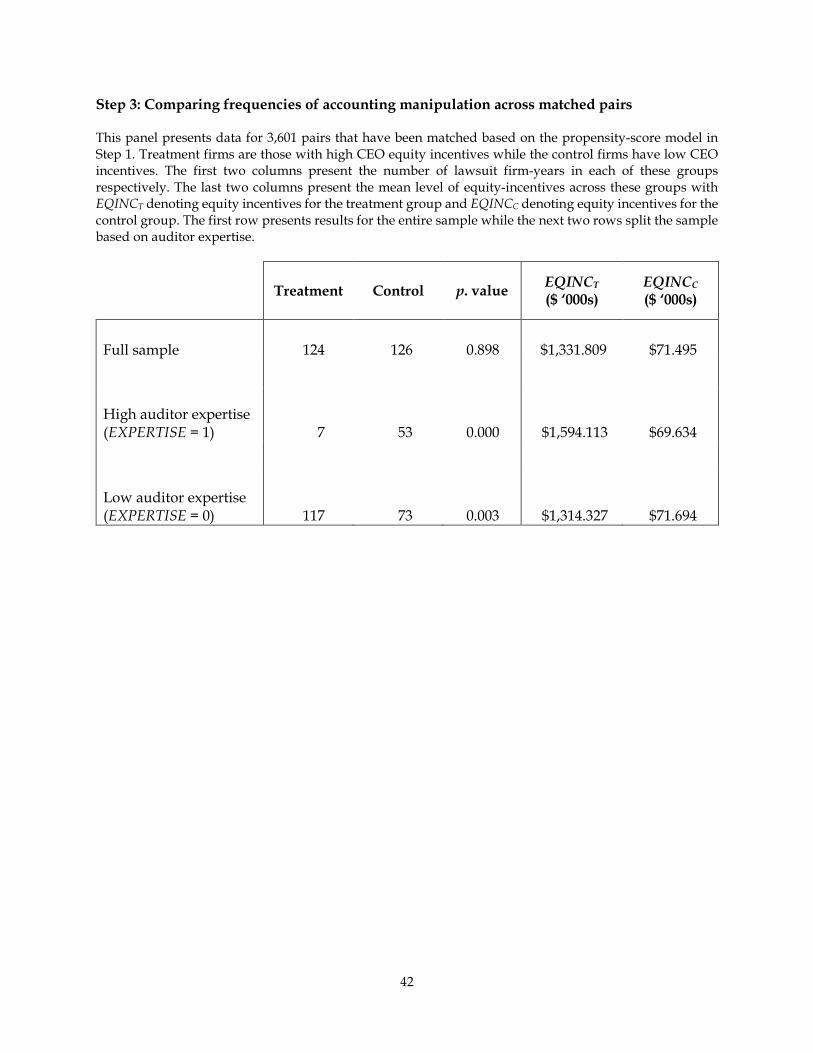
Step 3: Comparing frequencies of accounting manipulation across matched pairs This panel presents data for 3,601 pairs that have been matched based on the propensity-score model in Step 1. Treatment firms are those with high CEO equity incentives while the control firms have low CEO incentives. The first two columns present the number of lawsuit firm-years in each of these groups respectively. The last two columns present the mean level of equity-incentives across these groups with EQINCT denoting equity incentives for the treatment group and EQINCC denoting equity incentives for the control group. The first row presents results for the entire sample while the next two rows split the sample based on auditor expertise.
Treatment Control p. value EQINCT
($ ‘000s) EQINCC ($ ‘000s)
Full sample 124 126 0.898 $1,331.809 $71.495
High auditor expertise (EXPERTISE = 1) 7 53 0.000 $1,594.113 $69.634
Low auditor expertise (EXPERTISE = 0) 117 73 0.003 $1,314.327 $71.694
42
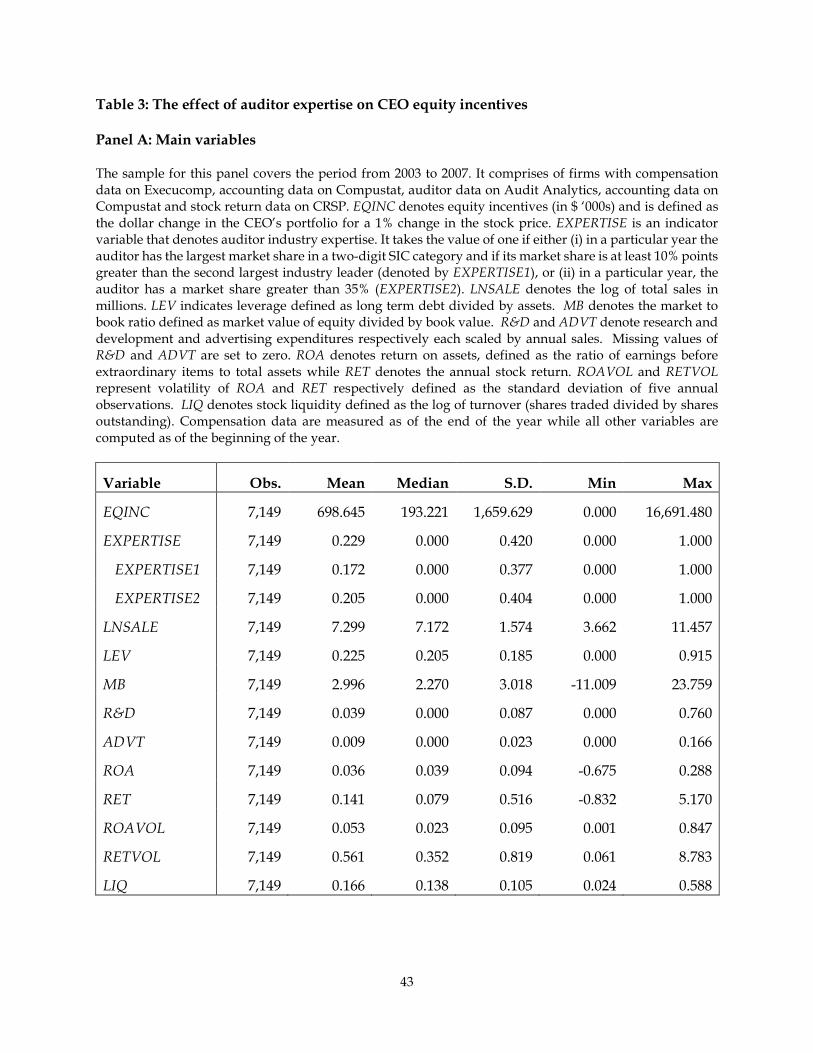
Table 3: The effect of auditor expertise on CEO equity incentives Panel A: Main variables The sample for this panel covers the period from 2003 to 2007. It comprises of firms with compensation data on Execucomp, accounting data on Compustat, auditor data on Audit Analytics, accounting data on Compustat and stock return data on CRSP. EQINC denotes equity incentives (in $ ‘000s) and is defined as the dollar change in the CEO’s portfolio for a 1% change in the stock price. EXPERTISE is an indicator variable that denotes auditor industry expertise. It takes the value of one if either (i) in a particular year the auditor has the largest market share in a two-digit SIC category and if its market share is at least 10% points greater than the second largest industry leader (denoted by EXPERTISE1), or (ii) in a particular year, the auditor has a market share greater than 35% (EXPERTISE2). LNSALE denotes the log of total sales in millions. LEV indicates leverage defined as long term debt divided by assets. MB denotes the market to book ratio defined as market value of equity divided by book value. R&D and ADVT denote research and development and advertising expenditures respectively each scaled by annual sales. Missing values of R&D and ADVT are set to zero. ROA denotes return on assets, defined as the ratio of earnings before extraordinary items to total assets while RET denotes the annual stock return. ROAVOL and RETVOL represent volatility of ROA and RET respectively defined as the standard deviation of five annual observations. LIQ denotes stock liquidity defined as the log of turnover (shares traded divided by shares outstanding). Compensation data are measured as of the end of the year while all other variables are computed as of the beginning of the year.
Variable Obs. Mean Median S.D. Min Max
EQINC 7,149 698.645 193.221 1,659.629 0.000 16,691.480
EXPERTISE 7,149 0.229 0.000 0.420 0.000 1.000
EXPERTISE1 7,149 0.172 0.000 0.377 0.000 1.000
EXPERTISE2 7,149 0.205 0.000 0.404 0.000 1.000
LNSALE 7,149 7.299 7.172 1.574 3.662 11.457
LEV 7,149 0.225 0.205 0.185 0.000 0.915
MB 7,149 2.996 2.270 3.018 -11.009 23.759
R&D 7,149 0.039 0.000 0.087 0.000 0.760
ADVT 7,149 0.009 0.000 0.023 0.000 0.166
ROA 7,149 0.036 0.039 0.094 -0.675 0.288
RET 7,149 0.141 0.079 0.516 -0.832 5.170
ROAVOL 7,149 0.053 0.023 0.095 0.001 0.847
RETVOL 7,149 0.561 0.352 0.819 0.061 8.783
LIQ 7,149 0.166 0.138 0.105 0.024 0.588
43
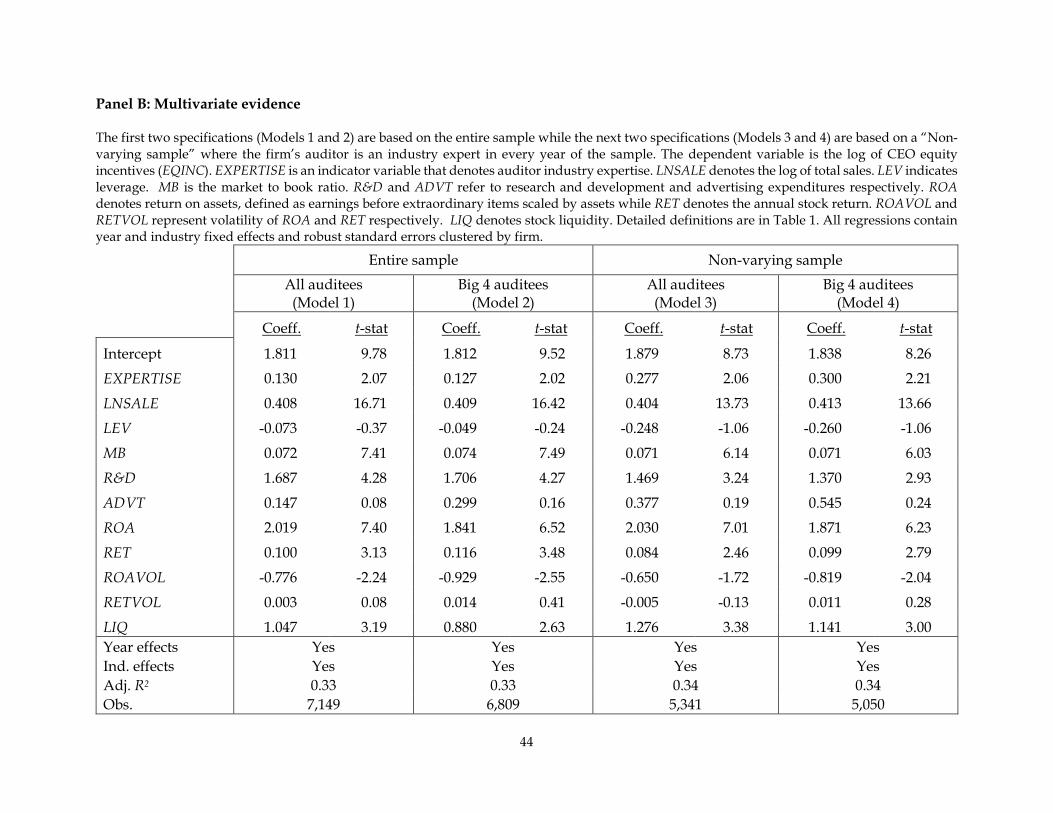
Panel B: Multivariate evidence The first two specifications (Models 1 and 2) are based on the entire sample while the next two specifications (Models 3 and 4) are based on a “Non-varying sample” where the firm’s auditor is an industry expert in every year of the sample. The dependent variable is the log of CEO equity incentives (EQINC). EXPERTISE is an indicator variable that denotes auditor industry expertise. LNSALE denotes the log of total sales. LEV indicates leverage. MB is the market to book ratio. R&D and ADVT refer to research and development and advertising expenditures respectively. ROA denotes return on assets, defined as earnings before extraordinary items scaled by assets while RET denotes the annual stock return. ROAVOL and RETVOL represent volatility of ROA and RET respectively. LIQ denotes stock liquidity. Detailed definitions are in Table 1. All regressions contain year and industry fixed effects and robust standard errors clustered by firm.
Entire sample Non-varying sample All auditees
(Model 1) Big 4 auditees
(Model 2) All auditees
(Model 3) Big 4 auditees
(Model 4) Coeff. t-stat Coeff. t-stat Coeff. t-stat Coeff. t-stat
Intercept 1.811 9.78 1.812 9.52 1.879 8.73 1.838 8.26
EXPERTISE 0.130 2.07 0.127 2.02 0.277 2.06 0.300 2.21
LNSALE 0.408 16.71 0.409 16.42 0.404 13.73 0.413 13.66
LEV -0.073 -0.37 -0.049 -0.24 -0.248 -1.06 -0.260 -1.06
MB 0.072 7.41 0.074 7.49 0.071 6.14 0.071 6.03
R&D 1.687 4.28 1.706 4.27 1.469 3.24 1.370 2.93
ADVT 0.147 0.08 0.299 0.16 0.377 0.19 0.545 0.24
ROA 2.019 7.40 1.841 6.52 2.030 7.01 1.871 6.23
RET 0.100 3.13 0.116 3.48 0.084 2.46 0.099 2.79
ROAVOL -0.776 -2.24 -0.929 -2.55 -0.650 -1.72 -0.819 -2.04
RETVOL 0.003 0.08 0.014 0.41 -0.005 -0.13 0.011 0.28
LIQ 1.047 3.19 0.880 2.63 1.276 3.38 1.141 3.00 Year effects Yes Yes Yes Yes Ind. effects Yes Yes Yes Yes Adj. R2 0.33 0.33 0.34 0.34 Obs. 7,149 6,809 5,341 5,050
44
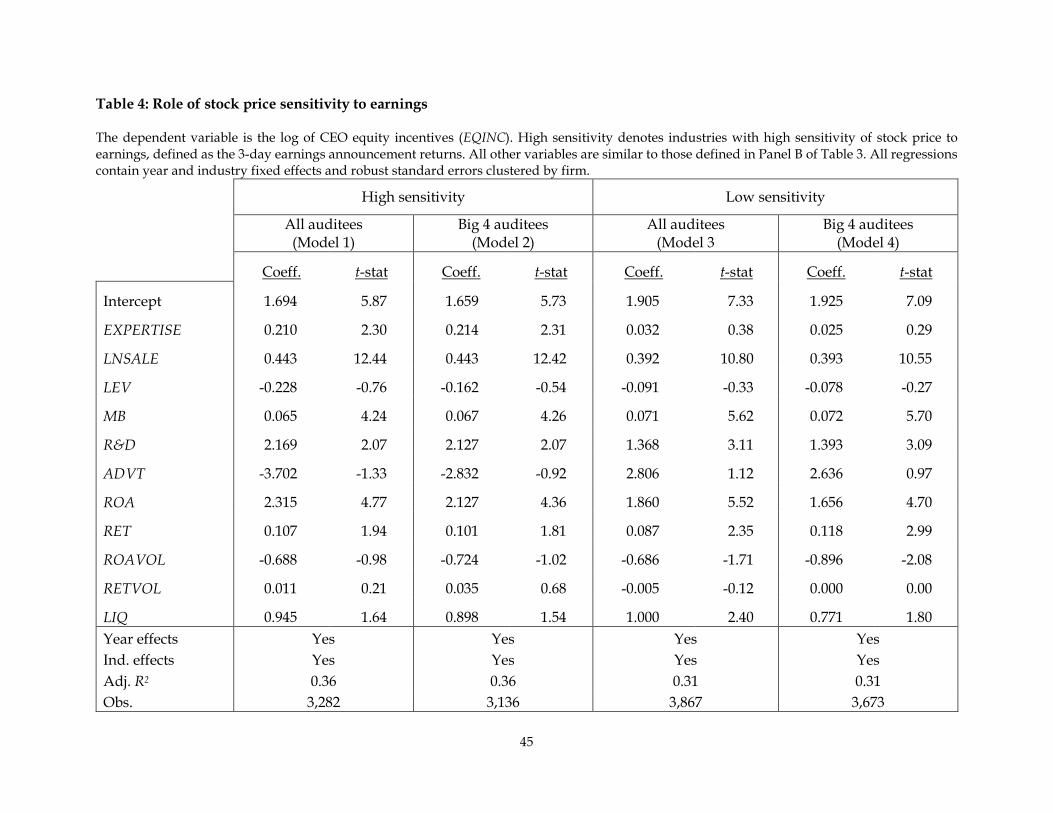
Table 4: Role of stock price sensitivity to earnings The dependent variable is the log of CEO equity incentives (EQINC). High sensitivity denotes industries with high sensitivity of stock price to earnings, defined as the 3-day earnings announcement returns. All other variables are similar to those defined in Panel B of Table 3. All regressions contain year and industry fixed effects and robust standard errors clustered by firm.
High sensitivity Low sensitivity
All auditees (Model 1)
Big 4 auditees (Model 2)
All auditees (Model 3
Big 4 auditees (Model 4)
Coeff. t-stat Coeff. t-stat Coeff. t-stat Coeff. t-stat
Intercept 1.694 5.87 1.659 5.73 1.905 7.33 1.925 7.09
EXPERTISE 0.210 2.30 0.214 2.31 0.032 0.38 0.025 0.29
LNSALE 0.443 12.44 0.443 12.42 0.392 10.80 0.393 10.55
LEV -0.228 -0.76 -0.162 -0.54 -0.091 -0.33 -0.078 -0.27
MB 0.065 4.24 0.067 4.26 0.071 5.62 0.072 5.70
R&D 2.169 2.07 2.127 2.07 1.368 3.11 1.393 3.09
ADVT -3.702 -1.33 -2.832 -0.92 2.806 1.12 2.636 0.97
ROA 2.315 4.77 2.127 4.36 1.860 5.52 1.656 4.70
RET 0.107 1.94 0.101 1.81 0.087 2.35 0.118 2.99
ROAVOL -0.688 -0.98 -0.724 -1.02 -0.686 -1.71 -0.896 -2.08
RETVOL 0.011 0.21 0.035 0.68 -0.005 -0.12 0.000 0.00
LIQ 0.945 1.64 0.898 1.54 1.000 2.40 0.771 1.80 Year effects Yes Yes Yes Yes Ind. effects Yes Yes Yes Yes Adj. R2 0.36 0.36 0.31 0.31 Obs. 3,282 3,136 3,867 3,673
45
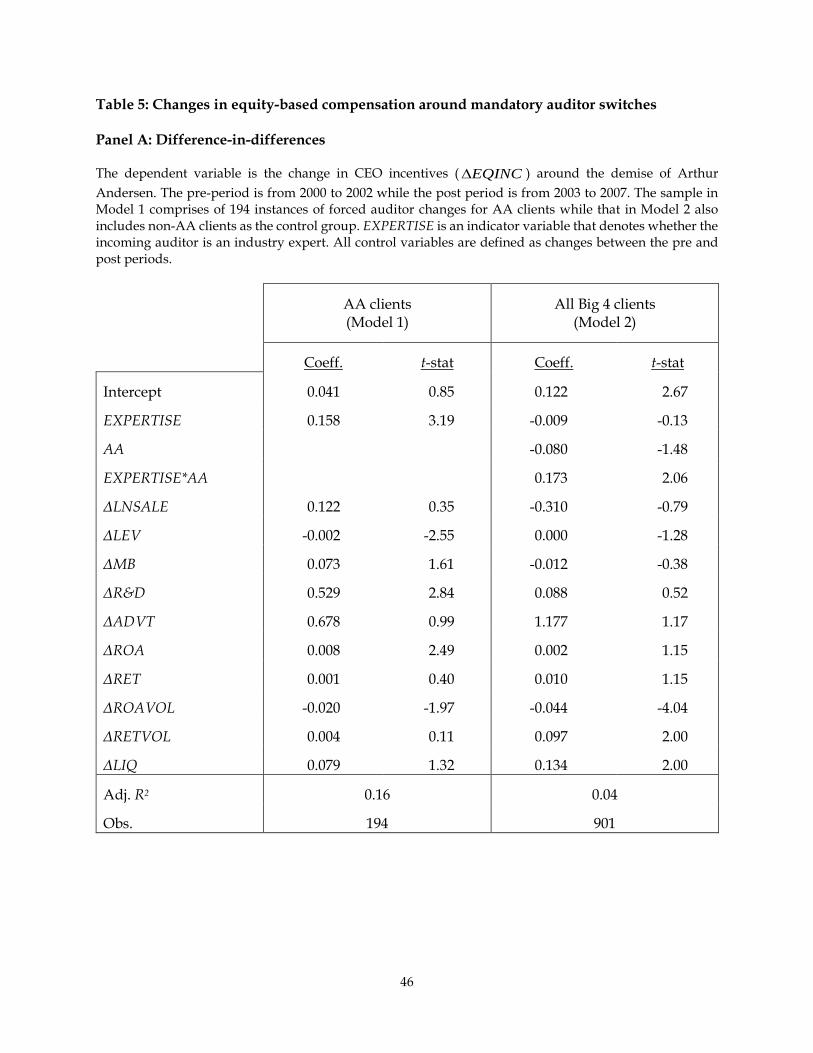
Table 5: Changes in equity-based compensation around mandatory auditor switches Panel A: Difference-in-differences The dependent variable is the change in CEO incentives ( EQINC∆ ) around the demise of Arthur Andersen. The pre-period is from 2000 to 2002 while the post period is from 2003 to 2007. The sample in Model 1 comprises of 194 instances of forced auditor changes for AA clients while that in Model 2 also includes non-AA clients as the control group. EXPERTISE is an indicator variable that denotes whether the incoming auditor is an industry expert. All control variables are defined as changes between the pre and post periods.
AA clients (Model 1)
All Big 4 clients (Model 2)
Coeff. t-stat Coeff. t-stat
Intercept 0.041 0.85 0.122 2.67
EXPERTISE 0.158 3.19 -0.009 -0.13
AA -0.080 -1.48
EXPERTISE*AA 0.173 2.06
ΔLNSALE 0.122 0.35 -0.310 -0.79
ΔLEV -0.002 -2.55 0.000 -1.28
ΔMB 0.073 1.61 -0.012 -0.38
ΔR&D 0.529 2.84 0.088 0.52
ΔADVT 0.678 0.99 1.177 1.17
ΔROA 0.008 2.49 0.002 1.15
ΔRET 0.001 0.40 0.010 1.15
ΔROAVOL -0.020 -1.97 -0.044 -4.04
ΔRETVOL 0.004 0.11 0.097 2.00
ΔLIQ 0.079 1.32 0.134 2.00
Adj. R2 0.16 0.04
Obs. 194 901
46
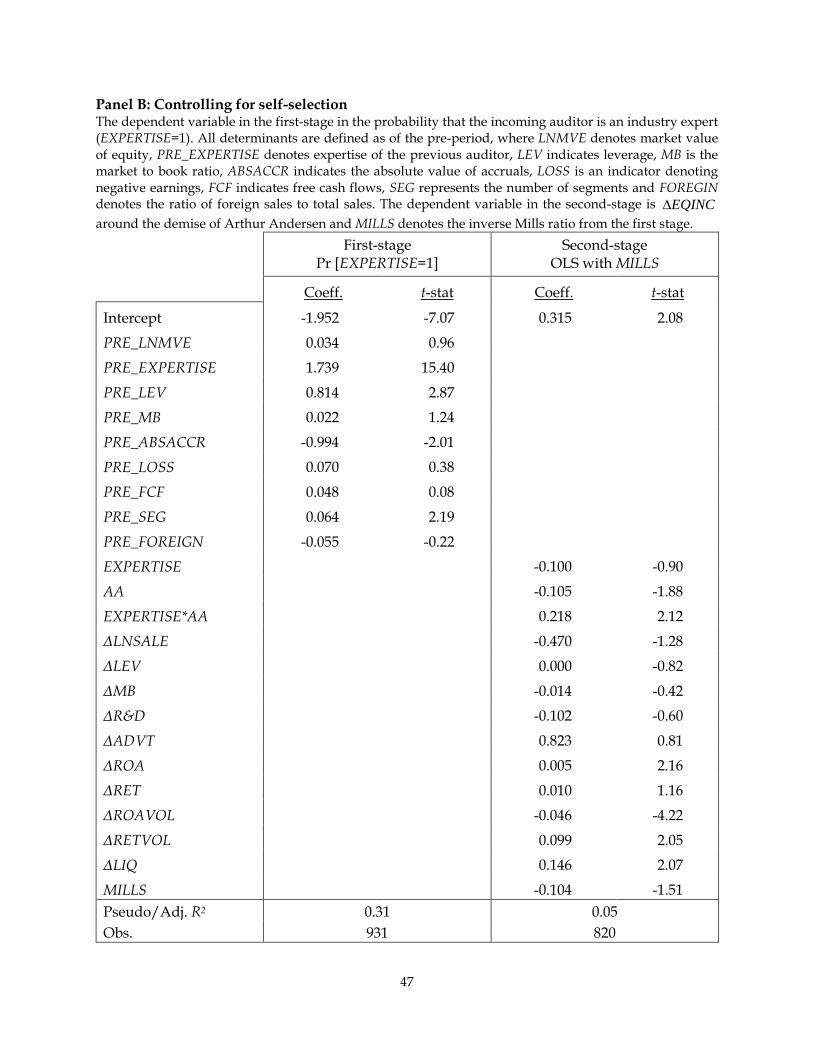
Panel B: Controlling for self-selection The dependent variable in the first-stage in the probability that the incoming auditor is an industry expert (EXPERTISE=1). All determinants are defined as of the pre-period, where LNMVE denotes market value of equity, PRE_EXPERTISE denotes expertise of the previous auditor, LEV indicates leverage, MB is the market to book ratio, ABSACCR indicates the absolute value of accruals, LOSS is an indicator denoting negative earnings, FCF indicates free cash flows, SEG represents the number of segments and FOREGIN denotes the ratio of foreign sales to total sales. The dependent variable in the second-stage is EQINC∆ around the demise of Arthur Andersen and MILLS denotes the inverse Mills ratio from the first stage.
First-stage Pr [EXPERTISE=1]
Second-stage OLS with MILLS
Coeff. t-stat Coeff. t-stat
Intercept -1.952 -7.07 0.315 2.08
PRE_LNMVE 0.034 0.96
PRE_EXPERTISE 1.739 15.40
PRE_LEV 0.814 2.87
PRE_MB 0.022 1.24
PRE_ABSACCR -0.994 -2.01
PRE_LOSS 0.070 0.38
PRE_FCF 0.048 0.08
PRE_SEG 0.064 2.19
PRE_FOREIGN -0.055 -0.22
EXPERTISE -0.100 -0.90
AA -0.105 -1.88
EXPERTISE*AA 0.218 2.12
ΔLNSALE -0.470 -1.28
ΔLEV 0.000 -0.82
ΔMB -0.014 -0.42
ΔR&D -0.102 -0.60
ΔADVT 0.823 0.81
ΔROA 0.005 2.16
ΔRET 0.010 1.16
ΔROAVOL -0.046 -4.22
ΔRETVOL 0.099 2.05
ΔLIQ 0.146 2.07
MILLS -0.104 -1.51 Pseudo/Adj. R2 0.31 0.05 Obs. 931 820
47
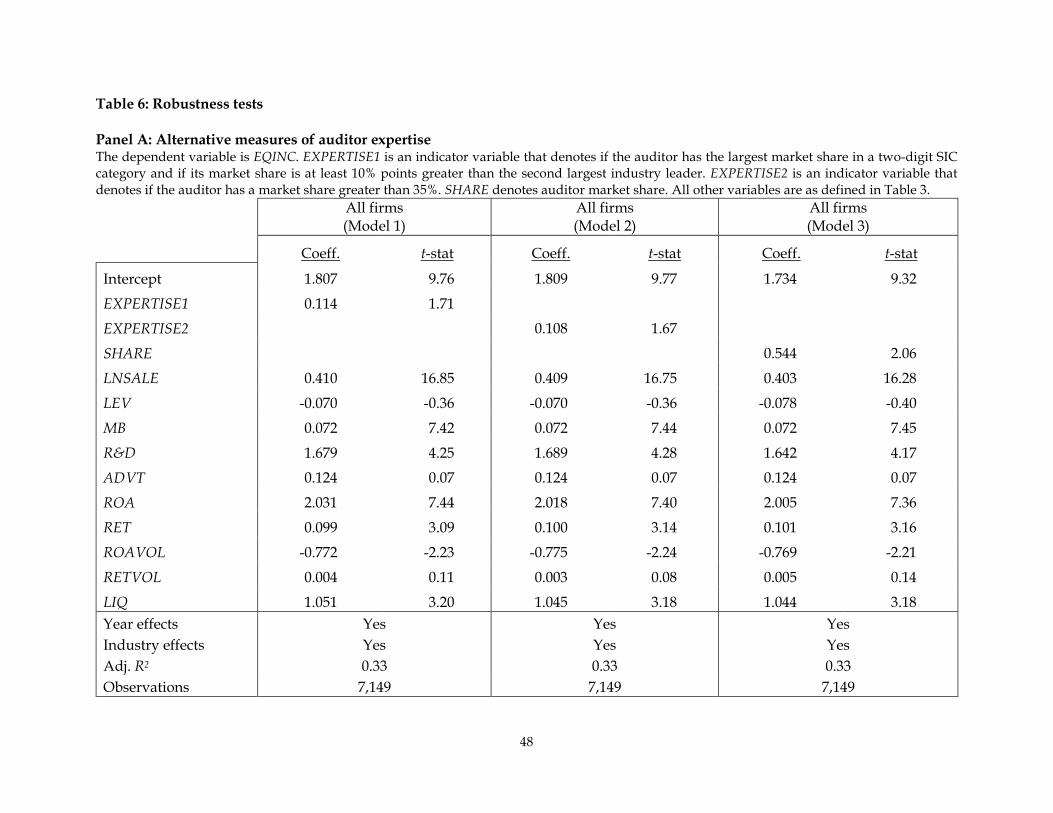
Table 6: Robustness tests Panel A: Alternative measures of auditor expertise The dependent variable is EQINC. EXPERTISE1 is an indicator variable that denotes if the auditor has the largest market share in a two-digit SIC category and if its market share is at least 10% points greater than the second largest industry leader. EXPERTISE2 is an indicator variable that denotes if the auditor has a market share greater than 35%. SHARE denotes auditor market share. All other variables are as defined in Table 3.
All firms (Model 1)
All firms (Model 2)
All firms (Model 3)
Coeff. t-stat Coeff. t-stat Coeff. t-stat
Intercept 1.807 9.76 1.809 9.77 1.734 9.32
EXPERTISE1 0.114 1.71
EXPERTISE2 0.108 1.67
SHARE 0.544 2.06
LNSALE 0.410 16.85 0.409 16.75 0.403 16.28
LEV -0.070 -0.36 -0.070 -0.36 -0.078 -0.40
MB 0.072 7.42 0.072 7.44 0.072 7.45
R&D 1.679 4.25 1.689 4.28 1.642 4.17
ADVT 0.124 0.07 0.124 0.07 0.124 0.07
ROA 2.031 7.44 2.018 7.40 2.005 7.36
RET 0.099 3.09 0.100 3.14 0.101 3.16
ROAVOL -0.772 -2.23 -0.775 -2.24 -0.769 -2.21
RETVOL 0.004 0.11 0.003 0.08 0.005 0.14
LIQ 1.051 3.20 1.045 3.18 1.044 3.18 Year effects Yes Yes Yes Industry effects Yes Yes Yes Adj. R2 0.33 0.33 0.33 Observations 7,149 7,149 7,149
48
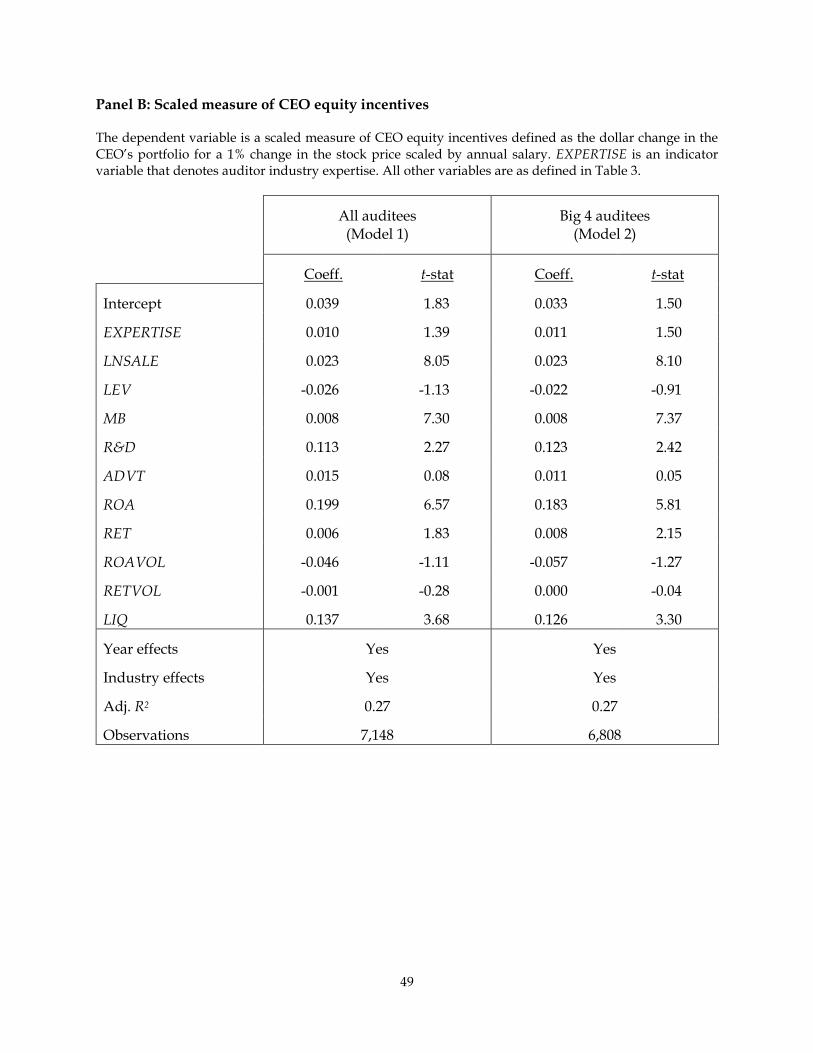
Panel B: Scaled measure of CEO equity incentives The dependent variable is a scaled measure of CEO equity incentives defined as the dollar change in the CEO’s portfolio for a 1% change in the stock price scaled by annual salary. EXPERTISE is an indicator variable that denotes auditor industry expertise. All other variables are as defined in Table 3.
All auditees
(Model 1) Big 4 auditees
(Model 2)
Coeff. t-stat Coeff. t-stat
Intercept 0.039 1.83 0.033 1.50
EXPERTISE 0.010 1.39 0.011 1.50
LNSALE 0.023 8.05 0.023 8.10
LEV -0.026 -1.13 -0.022 -0.91
MB 0.008 7.30 0.008 7.37
R&D 0.113 2.27 0.123 2.42
ADVT 0.015 0.08 0.011 0.05
ROA 0.199 6.57 0.183 5.81
RET 0.006 1.83 0.008 2.15
ROAVOL -0.046 -1.11 -0.057 -1.27
RETVOL -0.001 -0.28 0.000 -0.04
LIQ 0.137 3.68 0.126 3.30
Year effects Yes Yes
Industry effects Yes Yes
Adj. R2 0.27 0.27
Observations 7,148 6,808
49
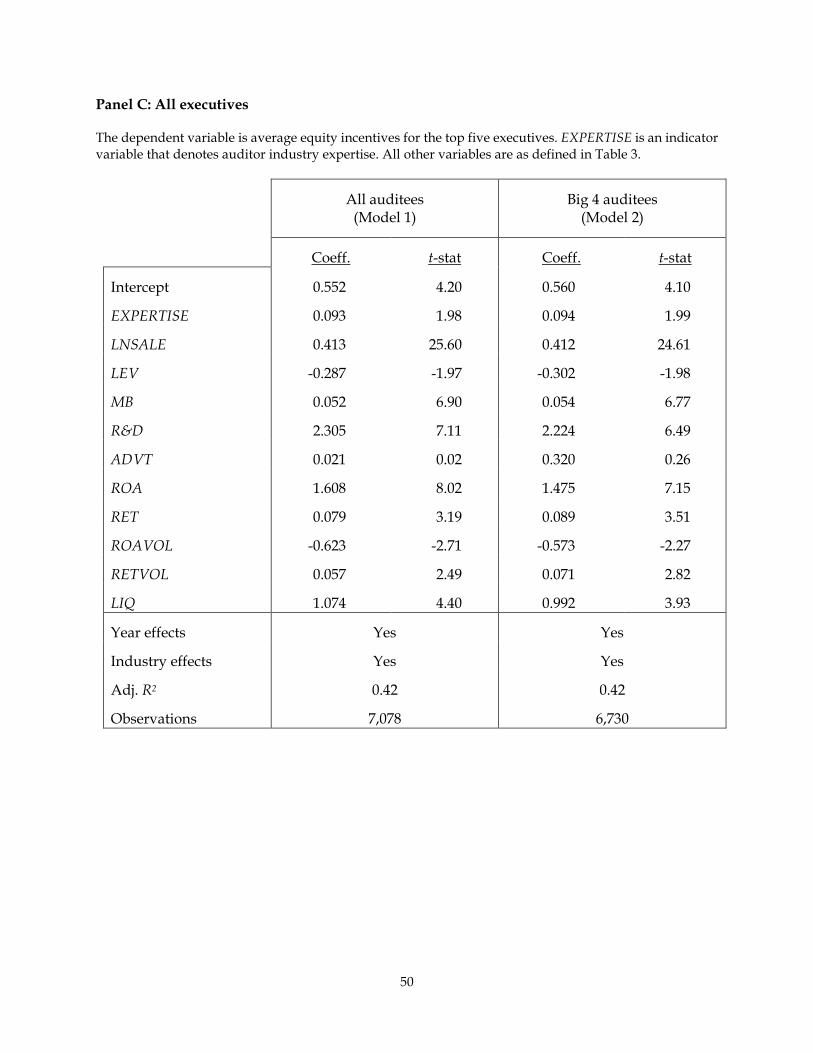
Panel C: All executives The dependent variable is average equity incentives for the top five executives. EXPERTISE is an indicator variable that denotes auditor industry expertise. All other variables are as defined in Table 3.
All auditees
(Model 1) Big 4 auditees
(Model 2)
Coeff. t-stat Coeff. t-stat
Intercept 0.552 4.20 0.560 4.10
EXPERTISE 0.093 1.98 0.094 1.99
LNSALE 0.413 25.60 0.412 24.61
LEV -0.287 -1.97 -0.302 -1.98
MB 0.052 6.90 0.054 6.77
R&D 2.305 7.11 2.224 6.49
ADVT 0.021 0.02 0.320 0.26
ROA 1.608 8.02 1.475 7.15
RET 0.079 3.19 0.089 3.51
ROAVOL -0.623 -2.71 -0.573 -2.27
RETVOL 0.057 2.49 0.071 2.82
LIQ 1.074 4.40 0.992 3.93
Year effects Yes Yes
Industry effects Yes Yes
Adj. R2 0.42 0.42
Observations 7,078 6,730
50
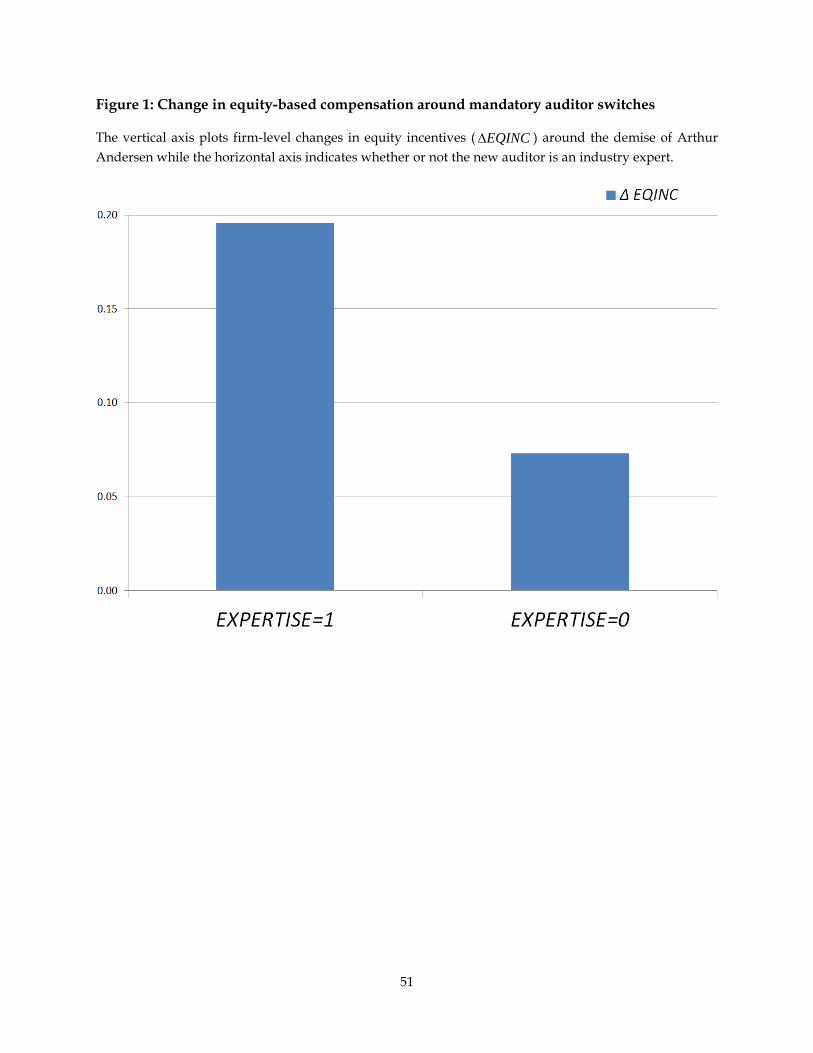
Figure 1: Change in equity-based compensation around mandatory auditor switches The vertical axis plots firm-level changes in equity incentives ( EQINC∆ ) around the demise of Arthur Andersen while the horizontal axis indicates whether or not the new auditor is an industry expert.
51