ceo cen webinar 2015 final v2
TRANSCRIPT
2015 M&A and Capital Markets Update – A Sellers Market but for How Long?
Today’s Presenters
Joseph Durnford CEO
David Barnes Managing Director
Jeffrey Sasakura Senior Vice President
3
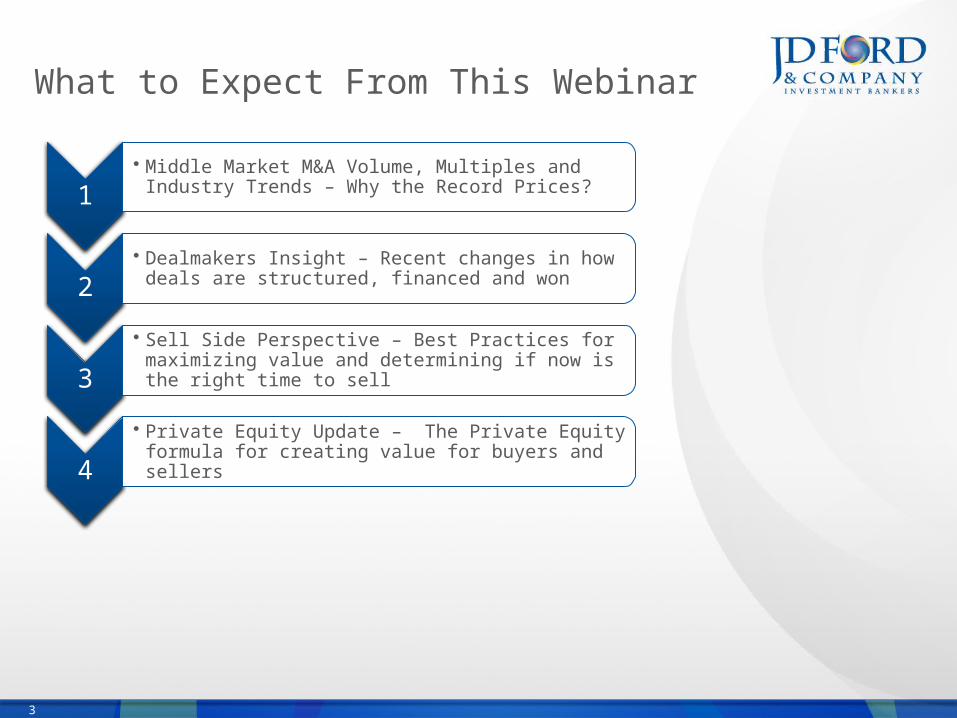
What to Expect From This Webinar
1• Middle Market M&A Volume, Multiples and Industry
Trends – Why the Record Prices?
2• Dealmakers Insight – Recent changes in how deals
are structured, financed and won
3• Sell Side Perspective – Best Practices for
maximizing value and determining if now is the right time to sell
4• Private Equity Update – The Private Equity formula
for creating value for buyers and sellers

OneMiddle Market M&A Volume, Multiples and Industry Trends
Jeffrey Sasakura Senior Vice President
5
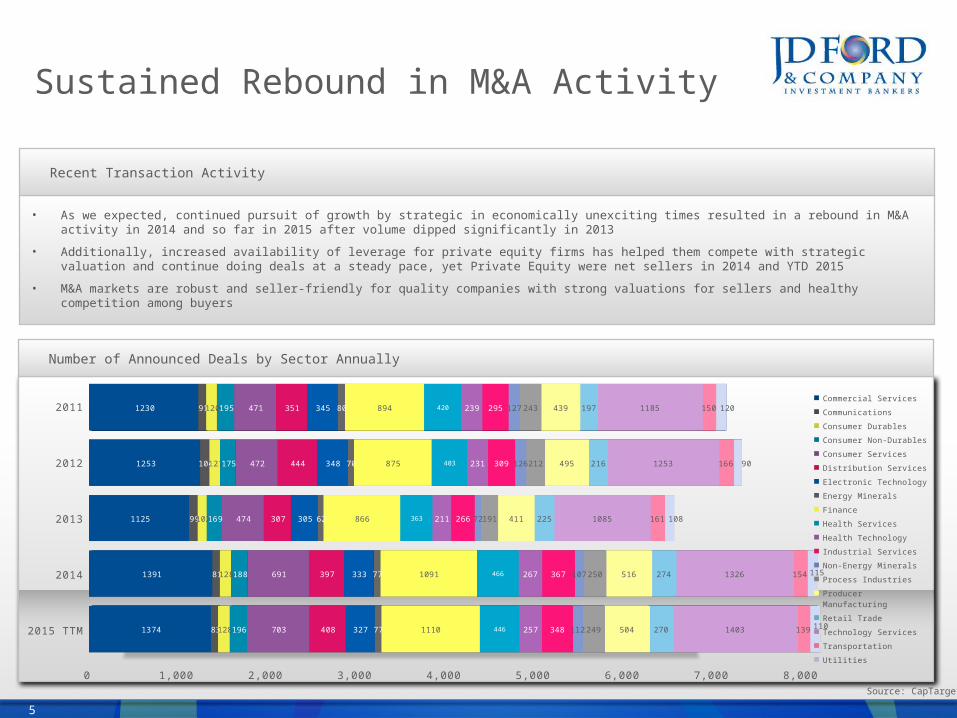
Sustained Rebound in M&A Activity
Number of Announced Deals by Sector Annually
• As we expected, continued pursuit of growth by strategic in economically unexciting times resulted in a rebound in M&A activity in 2014 and so far in 2015 after volume dipped significantly in 2013
• Additionally, increased availability of leverage for private equity firms has helped them compete with strategic valuation and continue doing deals at a steady pace, yet Private Equity were net sellers in 2014 and YTD 2015
• M&A markets are robust and seller-friendly for quality companies with strong valuations for sellers and healthy competition among buyers
Recent Transaction Activity
Source: CapTarget
2011
2012
2013
2014
2015 TTM
0 1,000 2,000 3,000 4,000 5,000 6,000 7,000 8,000
1230
1253
1125
1391
1374
91
104
99
81
83
120
121
102
128
128
195
175
169
188
196
471
472
474
691
703
351
444
307
397
408
345
348
305
333
327
80
70
62
77
77
894
875
866
1091
1110
420
403
363
466
446
239
231
211
267
257
295
309
266
367
348
127
126
72
107
112
243
212
191
250
249
439
495
411
516
504
197
216
225
274
270
1185
1253
1085
1326
1403
150
166
161
154
139
120
90
108
115
110
Commercial ServicesCommunicationsConsumer DurablesConsumer Non-DurablesConsumer ServicesDistribution ServicesElectronic TechnologyEnergy MineralsFinanceHealth ServicesHealth TechnologyIndustrial ServicesNon-Energy MineralsProcess IndustriesProducer ManufacturingRetail TradeTechnology ServicesTransportationUtilities
6
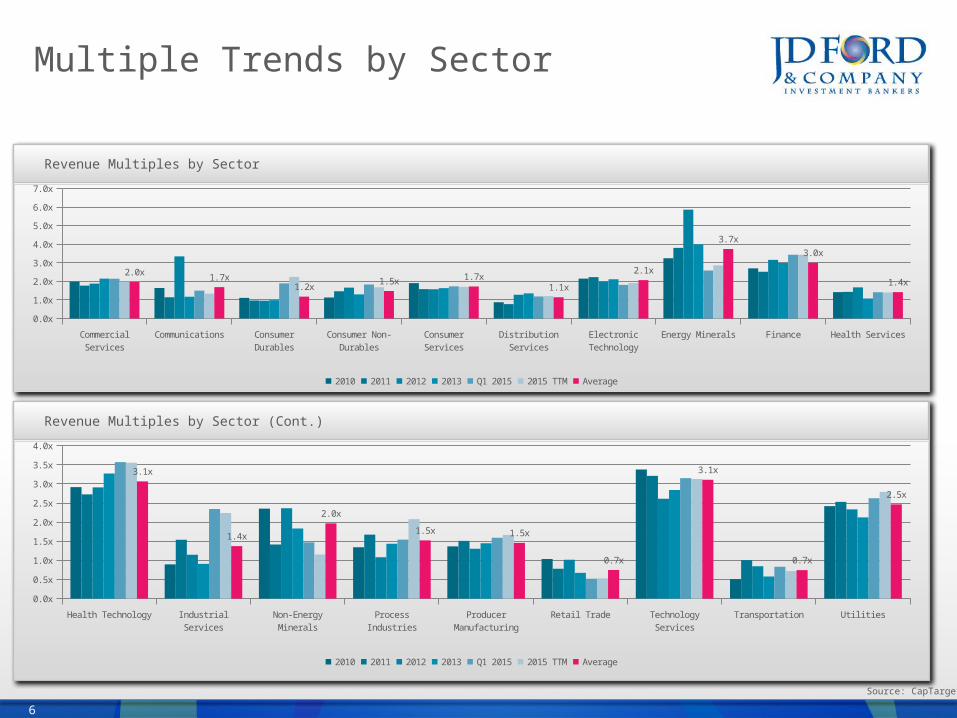
Multiple Trends by Sector
Revenue Multiples by Sector (Cont.)
Revenue Multiples by Sector
Source: CapTarget
Commercial Services
Communications Consumer Durables
Consumer Non-Durables
Consumer Services
Distribution Services
Electronic Technology
Energy Minerals Finance Health Services0.0x
1.0x
2.0x
3.0x
4.0x
5.0x
6.0x
7.0x
2.0x 1.7x1.2x 1.5x 1.7x
1.1x2.1x
3.7x3.0x
1.4x
2010 2011 2012 2013 2014 2015 TTM Average
Health
Techn
ology
Indust
rial S
ervice
s
Non-En
ergy M
ineral
s
Proces
s Indu
stries
Produ
cer Man
ufactu
ring
Retai
l Trad
e
Techn
ology
Servi
ces
Transp
ortati
on
Utilitie
s0.0x0.5x1.0x1.5x2.0x2.5x3.0x3.5x4.0x
3.1x
1.4x2.0x
1.5x 1.5x0.7x
3.1x
0.7x
2.5x
2010 2011 2012 2013 2014 2015 TTM Average
7
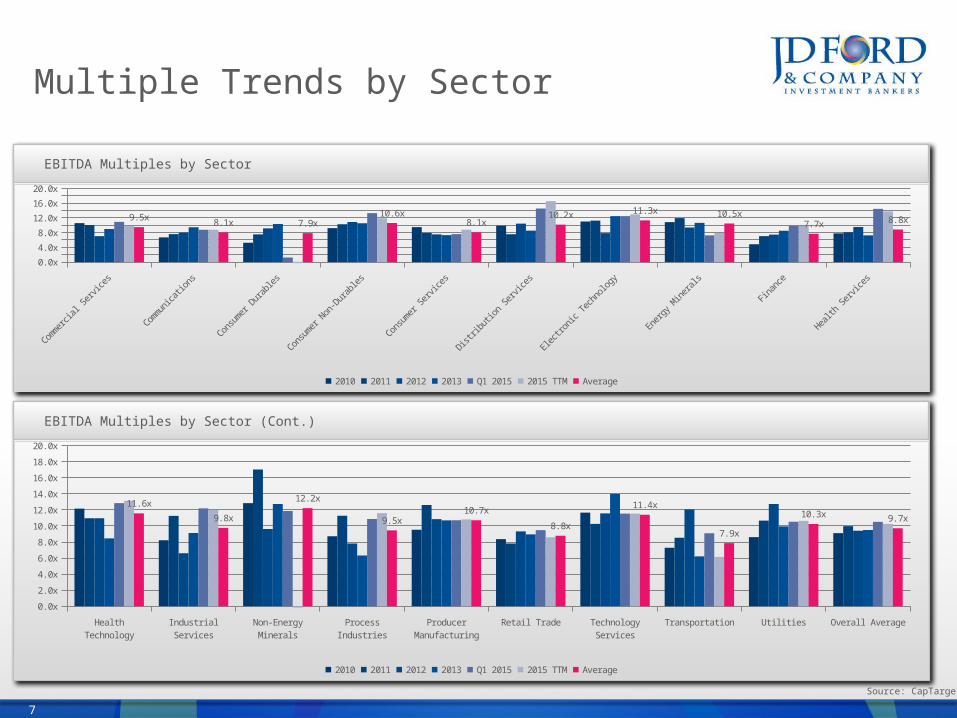
Multiple Trends by Sector
EBITDA Multiples by Sector (Cont.)
EBITDA Multiples by Sector
Source: CapTarget
Commerc
ial Se
rvices
Commun
icatio
ns
Consu
mer Dura
bles
Consu
mer Non
-Durable
s
Consu
mer Se
rvices
Distrib
ution
Servi
ces
Electr
onic T
echno
logy
Energ
y Mine
rals
Finan
ce
Health
Servi
ces0.0x4.0x8.0x
12.0x16.0x20.0x
9.5x 8.1x 7.9x10.6x
8.1x 10.2x 11.3x 10.5x7.7x 8.8x
2010 2011 2012 2013 2014 2015 TTM Average
Health
Techn
ology
Indust
rial S
ervice
s
Non-En
ergy M
ineral
s
Proces
s Indu
stries
Produ
cer Man
ufactu
ring
Retai
l Trad
e
Techn
ology
Servi
ces
Transp
ortati
on
Utilitie
s
Overall
Avera
ge0.0x2.0x4.0x6.0x8.0x
10.0x12.0x14.0x16.0x18.0x20.0x
11.6x9.8x
12.2x9.5x 10.7x
8.8x11.4x
7.9x10.3x 9.7x
2010 2011 2012 2013 2014 2015 TTM Average
8
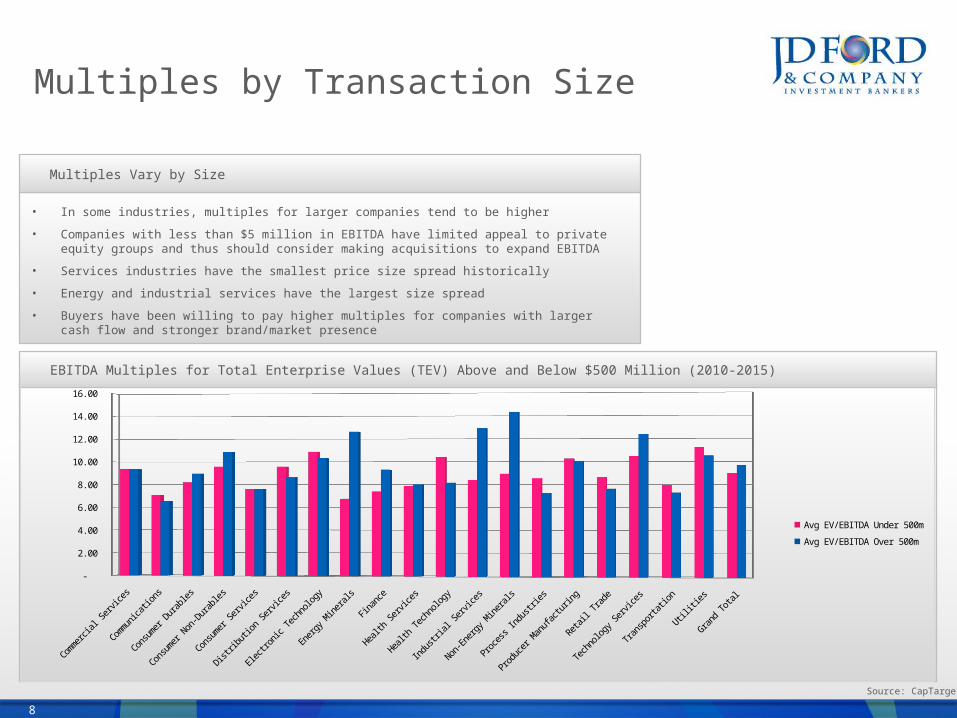
Multiples by Transaction Size
• In some industries, multiples for larger companies tend to be higher• Companies with less than $5 million in EBITDA have limited appeal to private equity groups
and thus should consider making acquisitions to expand EBITDA• Services industries have the smallest price size spread historically• Energy and industrial services have the largest size spread • Buyers have been willing to pay higher multiples for companies with larger cash flow and
stronger brand/market presence
Multiples Vary by Size
EBITDA Multiples for Total Enterprise Values (TEV) Above and Below $500 Million (2010-2015)
Source: CapTarget
Commerc
ial Se
rvices
Commun
icatio
ns
Consu
mer Dura
bles
Consu
mer Non
-Durable
s
Consu
mer Se
rvices
Distrib
ution
Servi
ces
Electr
onic T
echno
logy
Energ
y Mine
rals
Finan
ce
Health
Servi
ces
Health
Techn
ology
Indust
rial S
ervice
s
Non-En
ergy M
ineral
s
Proces
s Indu
stries
Produ
cer Man
ufactu
ring
Retai
l Trad
e
Techn
ology
Servi
ces
Transp
ortati
on
Utilitie
s
Grand T
otal
-
2.00
4.00
6.00
8.00
10.00
12.00
14.00
16.00
Avg EV/EBITDA Under 500mAvg EV/EBITDA Over 500m
9
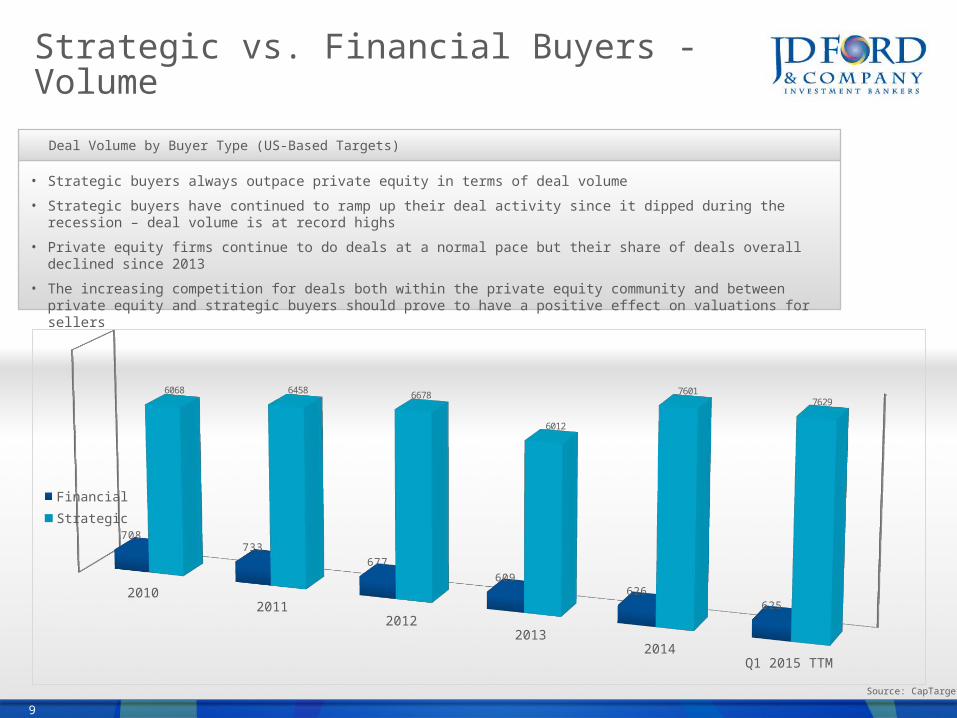
Strategic vs. Financial Buyers - Volume
• Strategic buyers always outpace private equity in terms of deal volume • Strategic buyers have continued to ramp up their deal activity since it dipped during the recession – deal
volume is at record highs• Private equity firms continue to do deals at a normal pace but their share of deals overall declined since 2013• The increasing competition for deals both within the private equity community and between private equity and
strategic buyers should prove to have a positive effect on valuations for sellers
Deal Volume by Buyer Type (US-Based Targets)
Source: CapTarget
20102011
20122013
2014Q1 2015 TTM
708733
677609
626625
6068 6458 6678
6012
76017629
FinancialStrategic
10
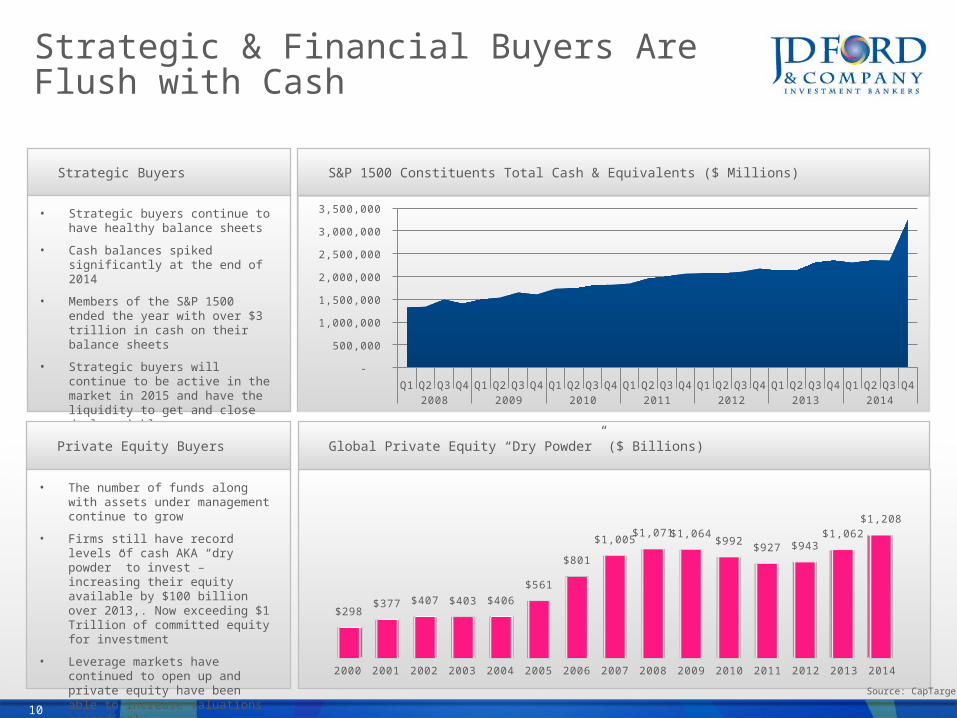
S&P 1500 Constituents Total Cash & Equivalents ($ Millions)
Global Private Equity “Dry Powder” ($ Billions)
Strategic & Financial Buyers Are Flush with Cash
• Strategic buyers continue to have healthy balance sheets
• Cash balances spiked significantly at the end of 2014
• Members of the S&P 1500 ended the year with over $3 trillion in cash on their balance sheets
• Strategic buyers will continue to be active in the market in 2015 and have the liquidity to get and close deals quickly
Strategic Buyers
• The number of funds along with assets under management continue to grow
• Firms still have record levels of cash AKA “dry powder” to invest – increasing their equity available by $100 billion over 2013,. Now exceeding $1 Trillion of committed equity for investment
• Leverage markets have continued to open up and private equity have been able to increase valuations accordingly
Private Equity Buyers
Source: CapTarget
Q1 Q2 Q3 Q4 Q1 Q2 Q3 Q4 Q1 Q2 Q3 Q4 Q1 Q2 Q3 Q4 Q1 Q2 Q3 Q4 Q1 Q2 Q3 Q4 Q1 Q2 Q3 Q42008 2009 2010 2011 2012 2013 2014
-
500,000
1,000,000
1,500,000
2,000,000
2,500,000
3,000,000
3,500,000
2000 2001 2002 2003 2004 2005 2006 2007 2008 2009 2010 2011 2012 2013 2014
$298$377 $407 $403 $406
$561
$801
$1,005 $1,071 $1,064 $992 $927 $943$1,062
$1,208
TwoDealmakers insight – Changes in how deals are structured, financed and won
Joseph Durnford CEO
12
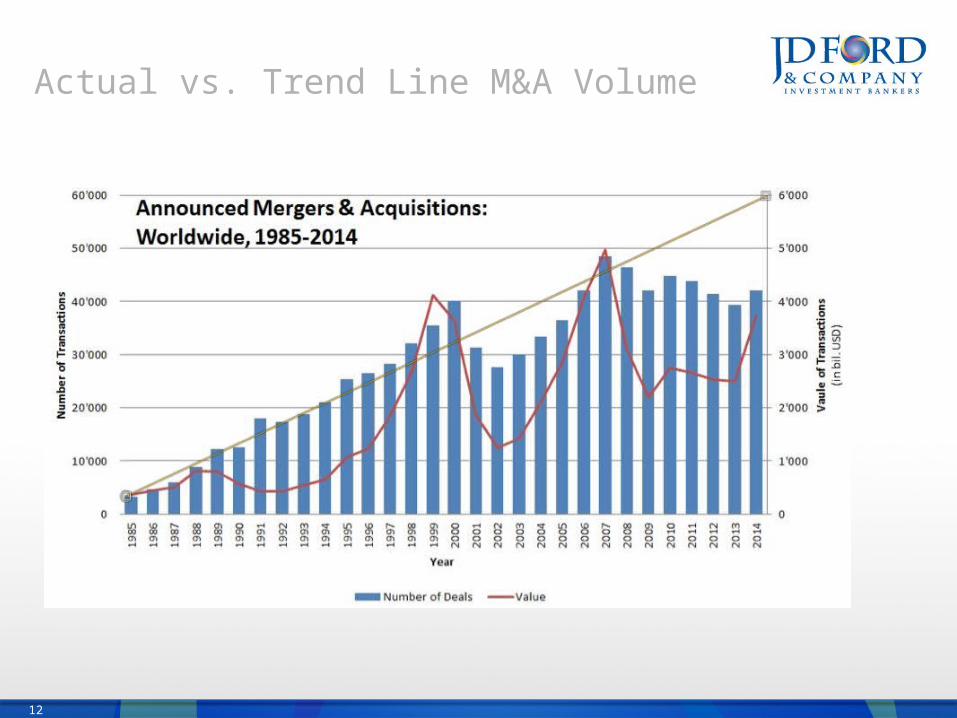
Actual vs. Trend Line M&A Volume
13
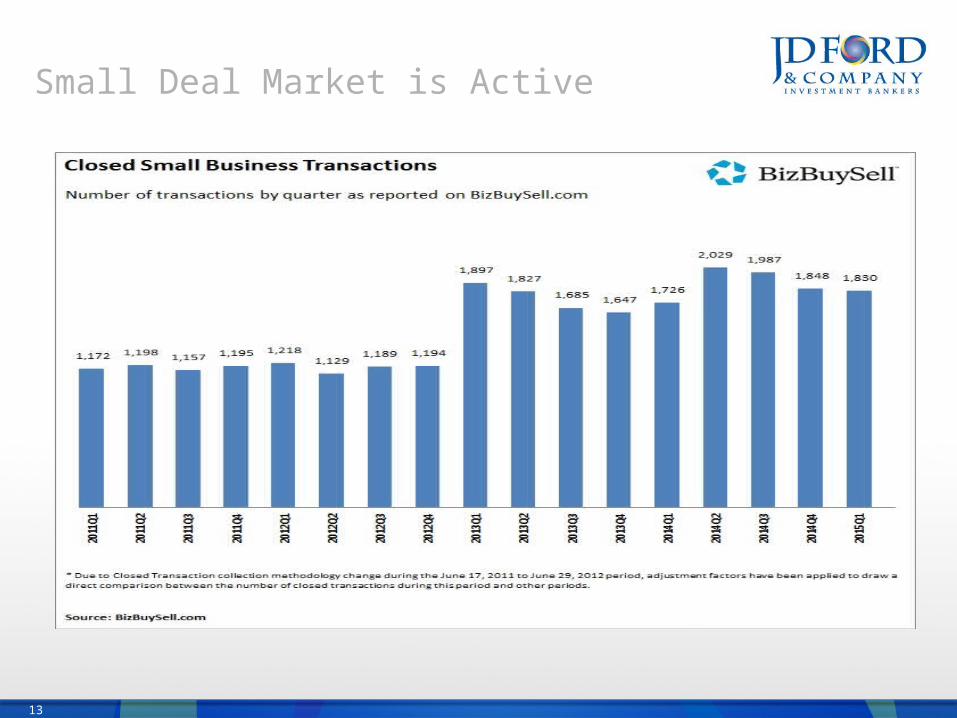
Small Deal Market is Active
14
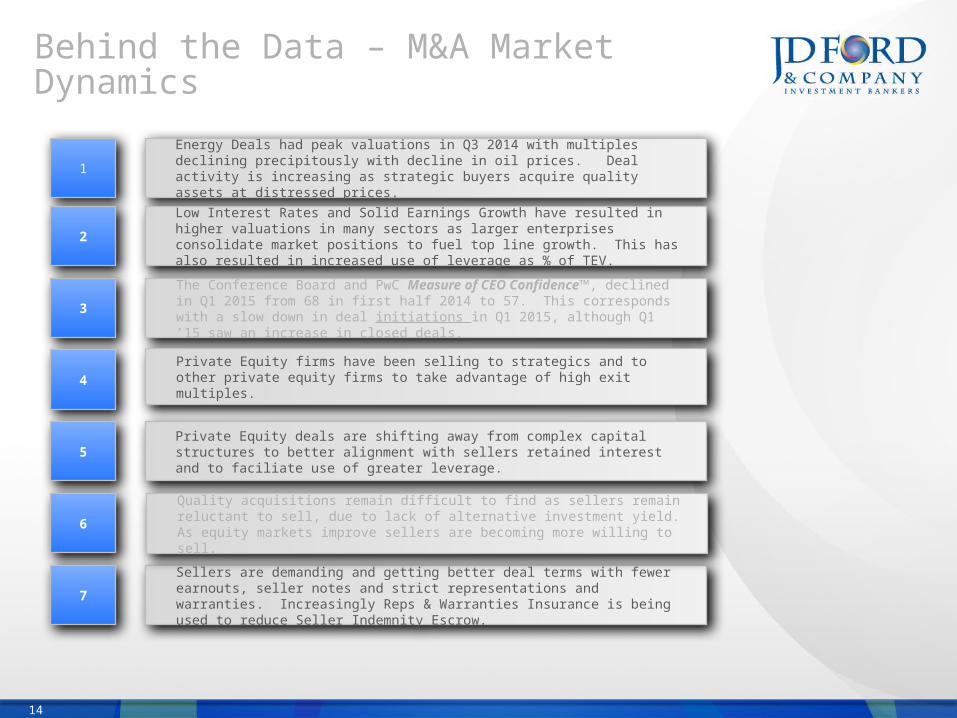
Behind the Data – M&A Market Dynamics
1Energy Deals had peak valuations in Q3 2014 with multiples declining precipitously with decline in oil prices. Deal activity is increasing as strategic buyers acquire quality assets at distressed prices.
2Low Interest Rates and Solid Earnings Growth have resulted in higher valuations in many sectors as larger enterprises consolidate market positions to fuel top line growth. This has also resulted in increased use of leverage as % of TEV.
3
Private Equity deals are shifting away from complex capital structures to better alignment with sellers retained interest and to faciliate use of greater leverage.
4
The Conference Board and PwC Measure of CEO Confidence™, declined in Q1 2015 from 68 in first half 2014 to 57. This corresponds with a slow down in deal initiations in Q1 2015, although Q1 ’15 saw an increase in closed deals.
5
Sellers are demanding and getting better deal terms with fewer earnouts, seller notes and strict representations and warranties. Increasingly Reps & Warranties Insurance is being used to reduce Seller Indemnity Escrow.
6Quality acquisitions remain difficult to find as sellers remain reluctant to sell, due to lack of alternative investment yield. As equity markets improve sellers are becoming more willing to sell.
7
Private Equity firms have been selling to strategics and to other private equity firms to take advantage of high exit multiples.
15
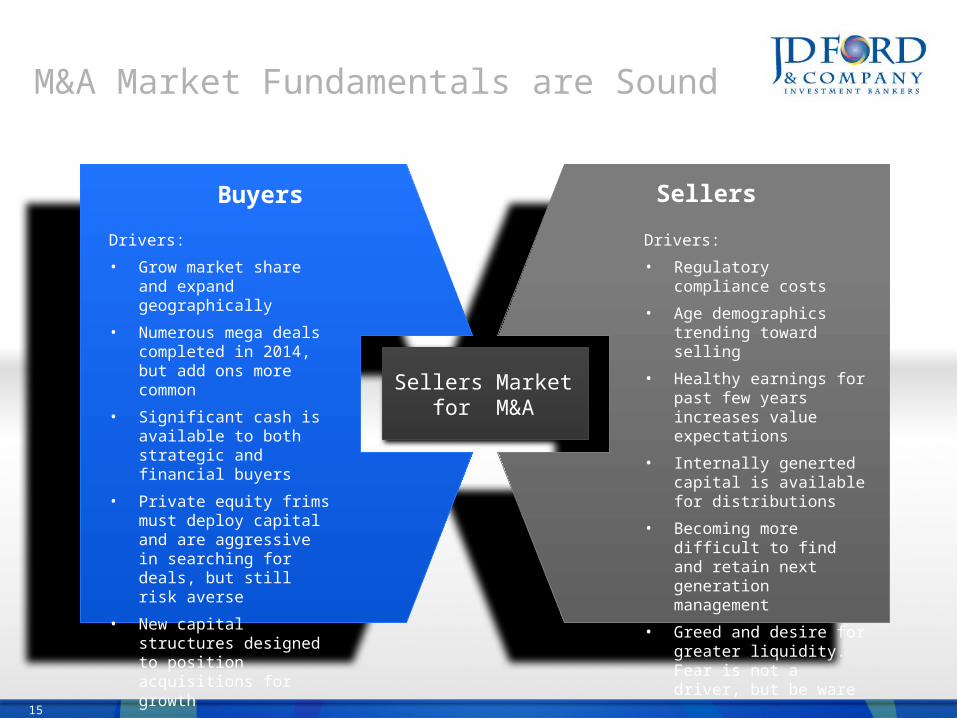
M&A Market Fundamentals are Sound
Sellers Market for M&A
Drivers:• Grow market share and
expand geographically• Numerous mega deals
completed in 2014, but add ons more common
• Significant cash is available to both strategic and financial buyers
• Private equity frims must deploy capital and are aggressive in searching for deals, but still risk averse
• New capital structures designed to position acquisitions for growth
Buyers SellersDrivers:• Regulatory compliance
costs • Age demographics
trending toward selling• Healthy earnings for
past few years increases value expectations
• Internally generted capital is available for distributions
• Becoming more difficult to find and retain next generation management
• Greed and desire for greater liquidity. Fear is not a driver, but be ware
ThreeSell Side Perspective Best Practices
17
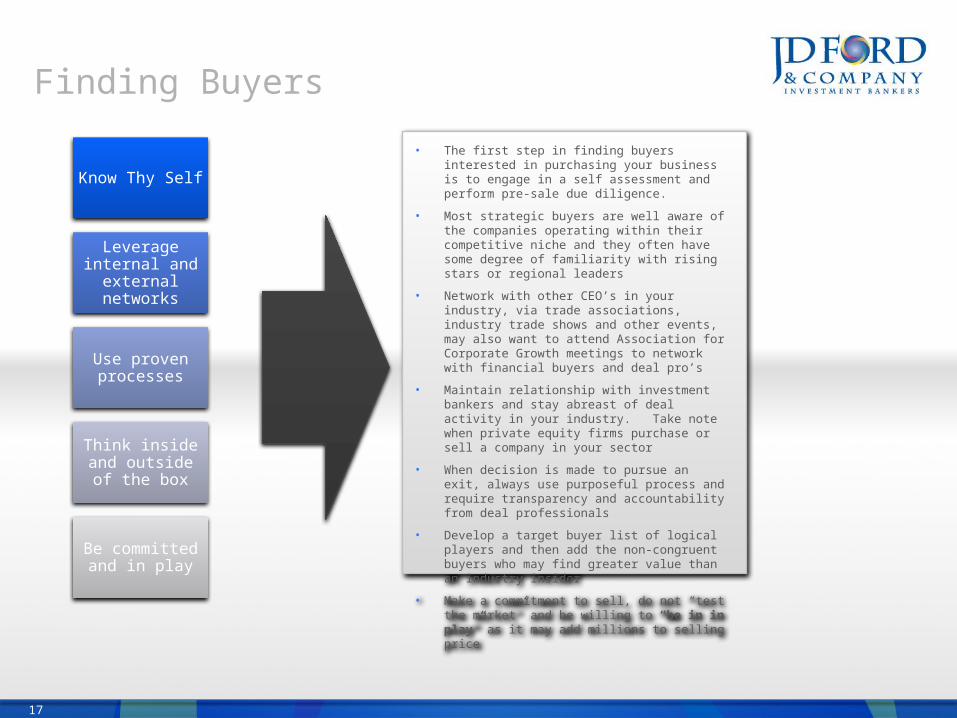
Finding Buyers
Know Thy Self
Leverage internal and
external networks
Use proven processes
Think inside and outside of
the box
Be committed and in play
• The first step in finding buyers interested in purchasing your business is to engage in a self assessment and perform pre-sale due diligence.
• Most strategic buyers are well aware of the companies operating within their competitive niche and they often have some degree of familiarity with rising stars or regional leaders
• Network with other CEO’s in your industry, via trade associations, industry trade shows and other events, may also want to attend Association for Corporate Growth meetings to network with financial buyers and deal pro’s
• Maintain relationship with investment bankers and stay abreast of deal activity in your industry. Take note when private equity firms purchase or sell a company in your sector
• When decision is made to pursue an exit, always use purposeful process and require transparency and accountability from deal professionals
• Develop a target buyer list of logical players and then add the non-congruent buyers who may find greater value than an industry insider
• Make a commitment to sell, do not “test the market” and be willing to “be in in play” as it may add millions to selling price
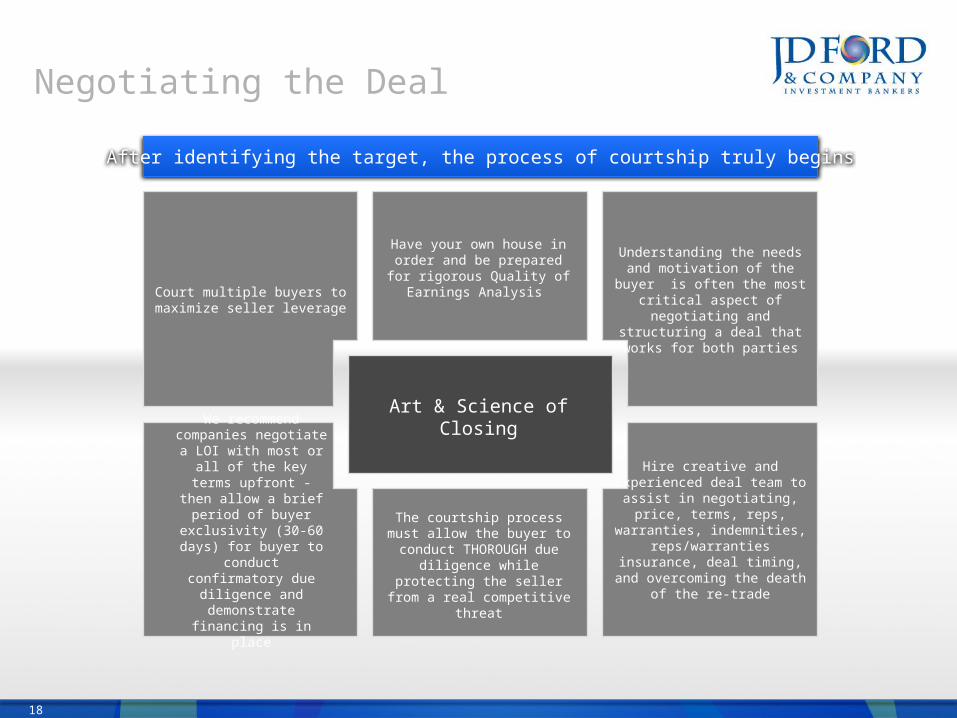
18
Negotiating the Deal
Court multiple buyers to maximize seller leverage
Understanding the needs and motivation of the buyer
is often the most critical aspect of negotiating and
structuring a deal that works for both parties
Hire creative and experienced deal team to
assist in negotiating, price, terms, reps, warranties,
indemnities, reps/warranties insurance, deal timing, and overcoming the death of the
re-trade
Art & Science of ClosingWe recommend
companies negotiate a LOI with most or all
of the key terms upfront - then allow a brief period of buyer
exclusivity (30-60 days) for buyer to
conduct confirmatory due diligence and
demonstrate financing is in place
Have your own house in order and be prepared for
rigorous Quality of Earnings Analysis
The courtship process must allow the buyer to conduct THOROUGH due diligence while protecting the seller
from a real competitive threat
After identifying the target, the process of courtship truly begins
19
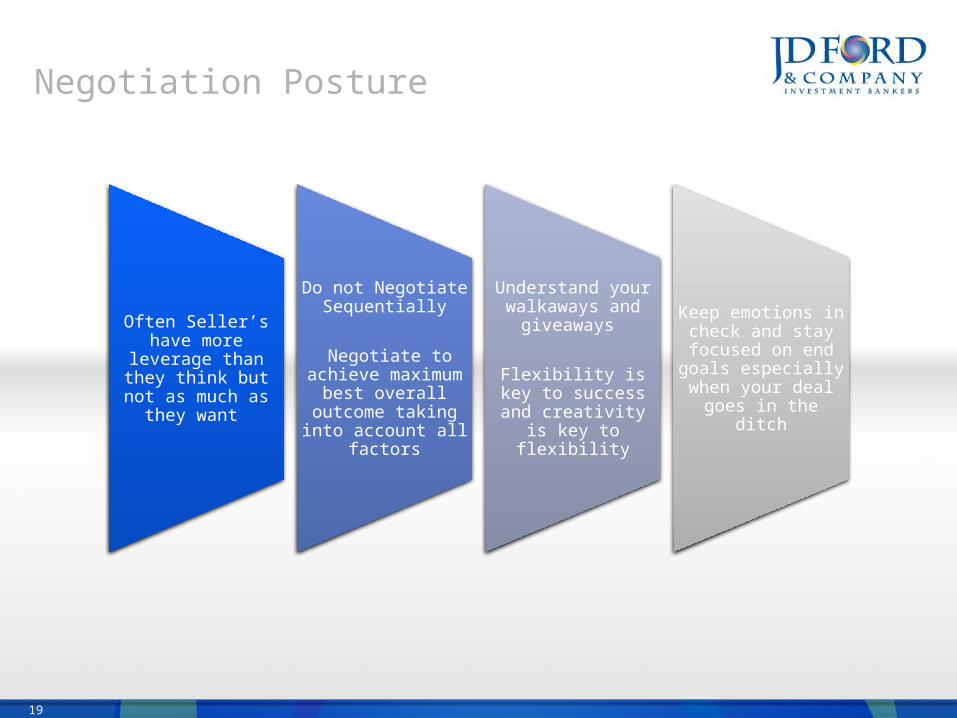
Negotiation Posture
Often Seller’s have more leverage than they think but not as much as they
want
Do not Negotiate Sequentially
Negotiate to achieve maximum
best overall outcome taking into account all factors
Understand your walkaways and
giveaways
Flexibility is key to success and
creativity is key to flexibility
Keep emotions in check and stay focused on end goals especially when your deal
goes in the ditch
20
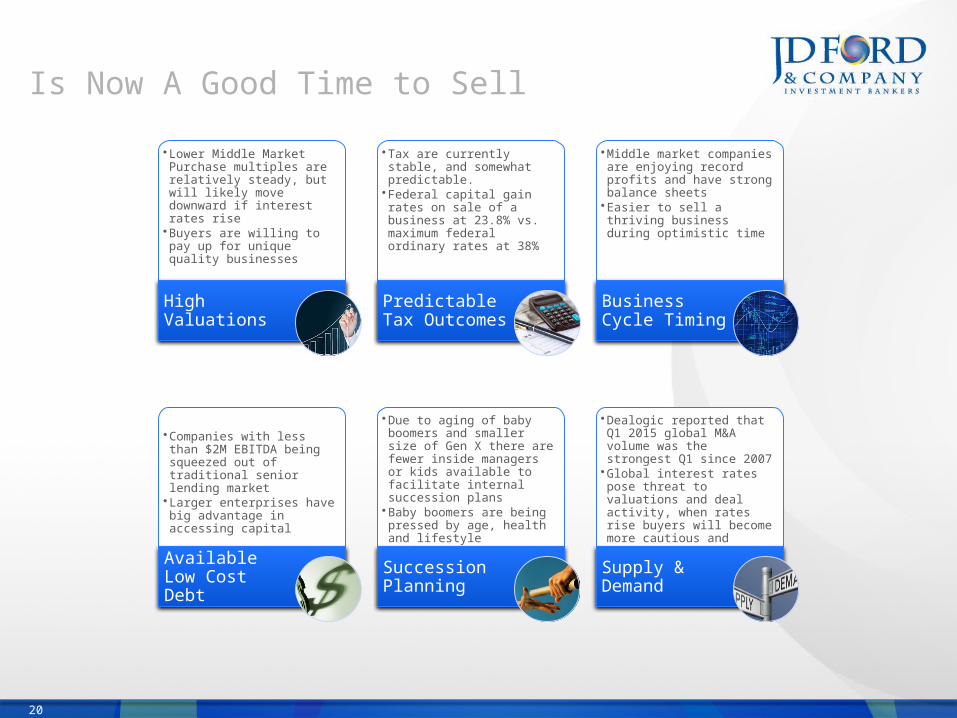
Is Now A Good Time to Sell•Lower Middle Market Purchase multiples are relatively steady, but will likely move downward if interest rates rise
•Buyers are willing to pay up for unique quality businesses
High Valuations
•Tax are currently stable, and somewhat predictable.
•Federal capital gain rates on sale of a business at 23.8% vs. maximum federal ordinary rates at 38%
Predictable Tax Outcomes
•Middle market companies are enjoying record profits and have strong balance sheets
•Easier to sell a thriving business during optimistic time
Business Cycle Timing
•Companies with less than $2M EBITDA being squeezed out of traditional senior lending market
•Larger enterprises have big advantage in accessing capital
Available Low Cost Debt
•Due to aging of baby boomers and smaller size of Gen X there are fewer inside managers or kids available to facilitate internal succession plans
•Baby boomers are being pressed by age, health and lifestyle preferences
Succession Planning
•Dealogic reported that Q1 2015 global M&A volume was the strongest Q1 since 2007
•Global interest rates pose threat to valuations and deal activity, when rates rise buyers will become more cautious and scarce
Supply & Demand
Is Now A Good Time to Sell?
21
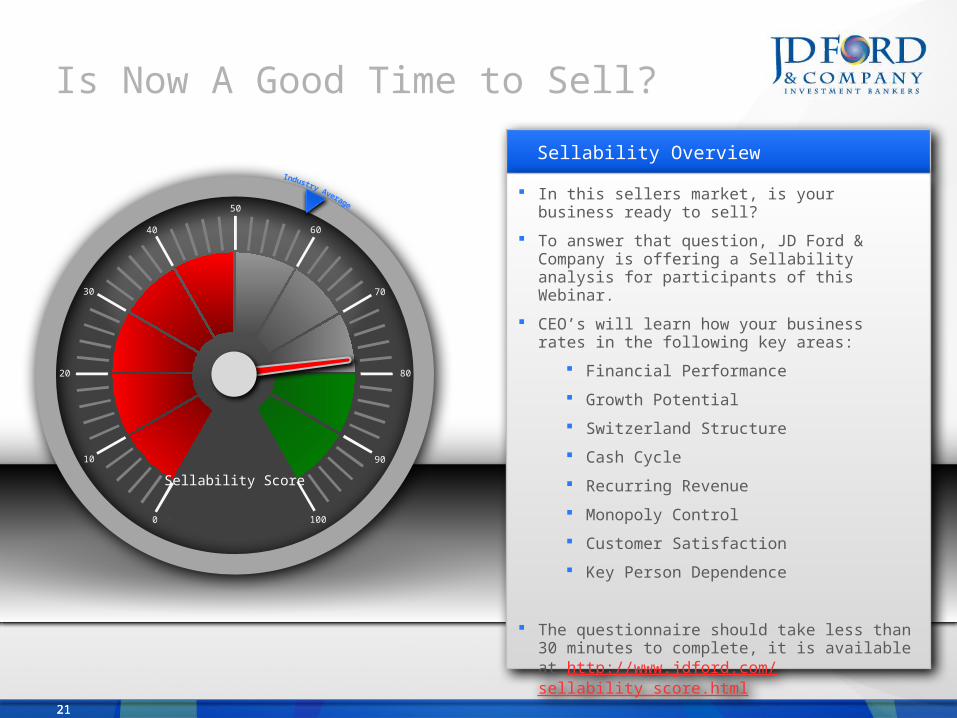
Sellability Overview In this sellers market, is your business ready
to sell? To answer that question, JD Ford & Company is
offering a Sellability analysis for participants of this Webinar.
CEO’s will learn how your business rates in the following key areas:
Financial Performance Growth Potential Switzerland Structure Cash Cycle Recurring Revenue Monopoly Control Customer Satisfaction Key Person Dependence
The questionnaire should take less than 30 minutes to complete, it is available at http://www.jdford.com/sellability_score.html
21
10
20
30
40
50
60
70
80
90
1000
Sellability Score
FourPrivate Equity Update:The Private Equity formula for creating value for buyers and sellers
David Barnes Managing Director
23
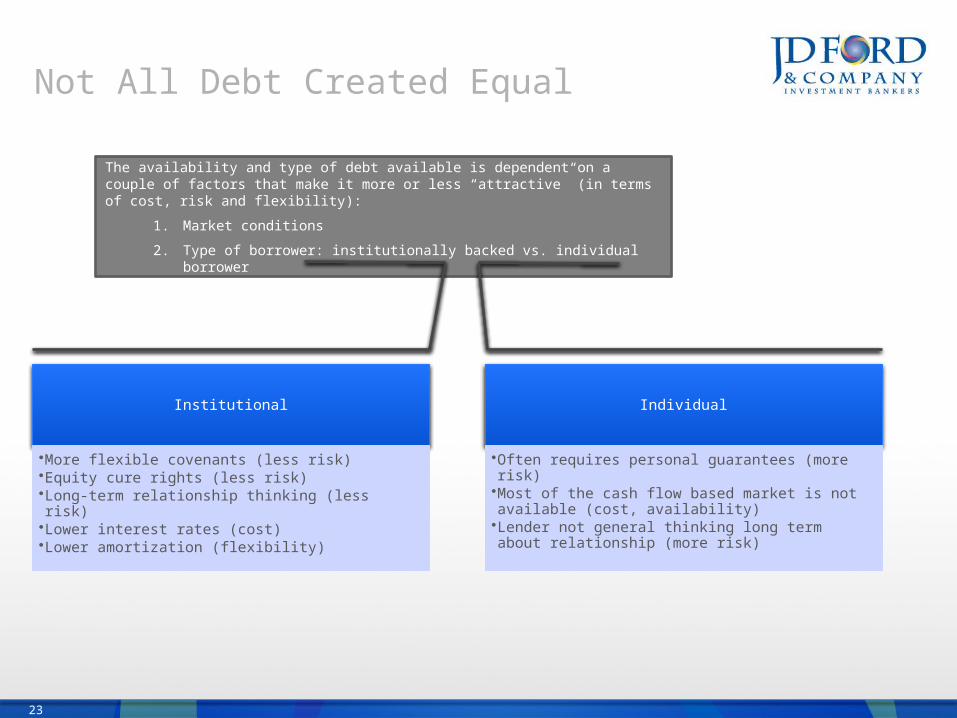
Not All Debt Created Equal
The availability and type of debt available is dependent on a couple of factors that make it more or less “attractive” (in terms of cost, risk and flexibility):
1. Market conditions2. Type of borrower: institutionally backed vs. individual borrower
Institutional
•More flexible covenants (less risk)•Equity cure rights (less risk)•Long-term relationship thinking (less risk)•Lower interest rates (cost)•Lower amortization (flexibility)
Individual
•Often requires personal guarantees (more risk)•Most of the cash flow based market is not available (cost, availability)
•Lender not general thinking long term about relationship (more risk)
24
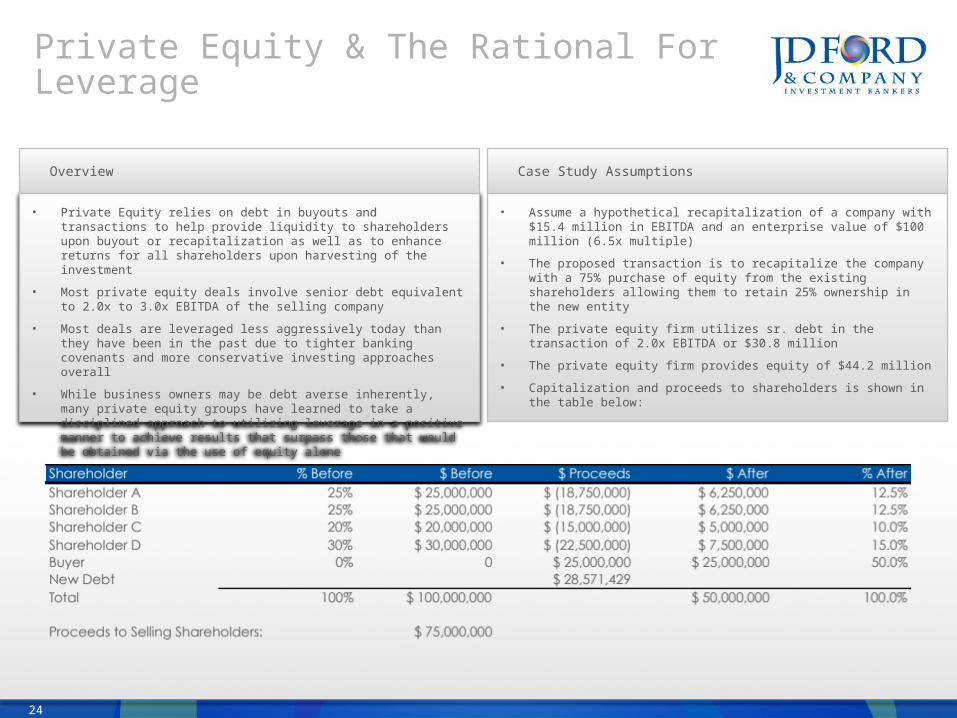
Private Equity & The Rational For Leverage
• Private Equity relies on debt in buyouts and transactions to help provide liquidity to shareholders upon buyout or recapitalization as well as to enhance returns for all shareholders upon harvesting of the investment
• Most private equity deals involve senior debt equivalent to 2.0x to 3.0x EBITDA of the selling company
• Most deals are leveraged less aggressively today than they have been in the past due to tighter banking covenants and more conservative investing approaches overall
• While business owners may be debt averse inherently, many private equity groups have learned to take a disciplined approach to utilizing leverage in a positive manner to achieve results that surpass those that would be obtained via the use of equity alone
Overview
• Assume a hypothetical recapitalization of a company with $15.4 million in EBITDA and an enterprise value of $100 million (6.5x multiple)
• The proposed transaction is to recapitalize the company with a 75% purchase of equity from the existing shareholders allowing them to retain 25% ownership in the new entity
• The private equity firm utilizes sr. debt in the transaction of 2.0x EBITDA or $30.8 million
• The private equity firm provides equity of $44.2 million• Capitalization and proceeds to shareholders is shown in the table
below:
Case Study Assumptions
25
Case Study (Cont.)
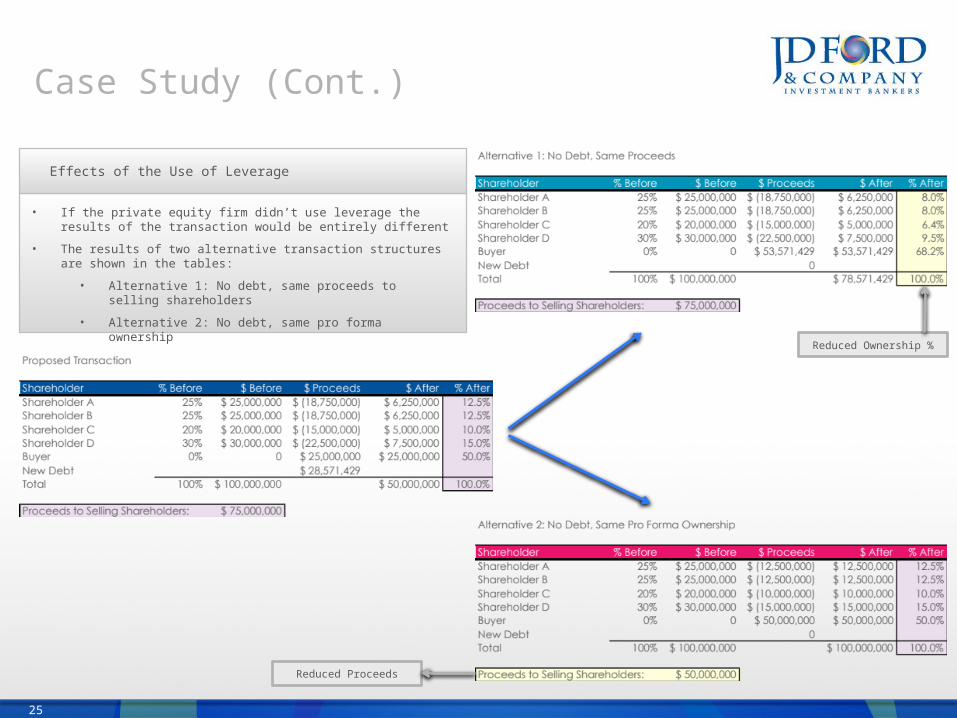
• If the private equity firm didn’t use leverage the results of the transaction would be entirely different
• The results of two alternative transaction structures are shown in the tables: • Alternative 1: No debt, same proceeds to selling
shareholders• Alternative 2: No debt, same pro forma ownership
Effects of the Use of Leverage
Reduced Ownership %
Reduced Proceeds

26
JD Ford & Company
Main:9 Sedgwick DriveThe Consulate Building, Suite 200Englewood, CO 80113Telephone: 888-999-9495 | 303-333-3673 (FORD) x 7749
Southern California:1334 Parkview Avenue, Suite 100Manhattan Beach, CA 90266310.546.8178
E-Mail: [email protected]: www.jdford.com © 2014 JD Ford & Company LLC
Sources:
GF Data Resources
JD Ford & Company Proprietary Data
Prequin
Standard & Poor’s Capital IQ
Captarget