central venous pressure monitoring sheldon magder
TRANSCRIPT
Central venous pressure monitoringSheldon Magder
Purpose of reviewThe proper use of central venous pressure requires a goodunderstanding of basic measurement techniques andfeatures of the waveform.Recent findingsIf attention is not paid to proper leveling of the transducerand consideration of transmural pressure then major errorsare made in the use of central venous pressure. Besides theinformation gained from the relationship of changes incentral venous pressure to changes in cardiac output, thereis also much information to be obtained by examining thewaveforms of the central venous pressure tracing.Examples are given of rhythm disorders, tricuspidregurgitation, cardiac tamponade, cardiac restriction, anddecreased thoracic compliance.SummaryThere is much more to the measurement of central venouspressure than the simple digital value on the monitor and theactual waveform should always be examined.
Keywordscardiac output, respiratory variation, right atrial pressure,volume management, waveforms
Curr Opin Crit Care 12:000–000. ! 2006 Lippincott Williams & Wilkins.
McGill University Health Centre, Royal Victoria Hospital, Division of Critical Care,Montreal, Quebec, Canada
Correspondence to S. Magder, Royal Victoria Hospital, 687 Pine Avenue West,Montreal, Quebec, Canada H3A 1A1Tel: +1 514 487 5918; e-mail: [email protected]
Current Opinion in Critical Care 2006, 12:000–000
Abbreviations
CVP central venous pressurePEEP positive end-expiratory pressure
! 2006 Lippincott Williams & Wilkins1070-5295
IntroductionCentral venous pressure (CVP) measurements are readilyobtainable inmost critically ill patients and are commonlymeasured [1]. I recently discussed the use of CVPmeasurements in this journal [2!!]. In this paper I willfollow up on that discussion and emphasize the monitor-ing aspects of CVP with more discussion on factors thataffect the measurements and wave patterns. First, how-ever, I will review some of the basic rationale for the useof CVP.
Rationale for the use of centralvenous pressureCVP is determined by the interaction of cardiac functionand return function and a change in either can alter theCVP [3,4]. As demonstrated by Ernest Starling [5], theCVP or right atrial pressure (for they are essentiallyequivalent under most circumstances) prior to the onsetof systole determines the preload of the right ventricleand the ultimate output of the heart as a whole. Theshape of the cardiac function curve for any preload isdetermined by afterload, contractility, and heart rate.The CVP also is the back pressure for the return function[3], which is determined by stressed vascular volume,venous compliance, and venous resistance. An increase incardiac function without an increase in return functionresults in a rise in cardiac output with a fall in CVP [2!!].An increase in return function without a change in cardiacfunction results in a rise in cardiac output with a rise inCVP. The converse is true for decrease in cardiac orreturn functions. These simple relationships can be usedto determine the nature of a change in hemodynamicstatus and the choice of appropriate therapy. It needs tobe emphasized that generally CVP values by themselvesdo not provide much useful clinical information. Thevalue must be interpreted in the context of the patient’soverall status and if possible the cardiac output. Forexample, normal CVP in an upright person is usuallybelow zero [6] and, by definition, the vascular volume isnormal. However, high values of CVP indicate patho-logical processes, although – as discussed below – theydo not necessarily indicate that the heart is adequatelyfilled. Another key point for managing fluid status is thatthe cardiac function curve has a plateau [7] and when thisplateau is reached, further increases in CVP will notincrease cardiac output and constitute what I like to callwasted preload. The high cardiac filling pressures inthis situation only increase capillary leak, distort theright ventricle, and potentially worsen the hemodyanmicsituation [4].
MCC 65
1
It is useful to consider the magnitude of changes in CVPrequired for physiological effects. The force driving fluidfrom the periphery to the heart is the elastic recoilpressure from distended small veins and venules [3]and is called the mean circulatory filling pressure.Although are limited data from humans, based on studiesthat have been done [8,9] and the work of Guyton andothers [10] in animals, the normal pressure gradientfor venous return is estimated to be in the range of4–6 mmHg. This means that a sudden increase inCVP of 4–6 mmHg without any reflex adjustments willreduce the return of blood to the heart to zero. On thecardiac side, the cardiac function curve plateaus in mostindividuals at a CVP of <10 mmHg and often even<5 mmHg (based on a reference level 5 cm below thesternal angle as discussed below). If the cardiac output atthe plateau is 5 l/min and a simple tangent is drawn from0 to 10 mmHg, the slope is 500 ml/min per mmHg, whichis an underestimate of the steep part of the cardiacfunction curve. In this case, a 1 mmHg increase inCVP should produce an increase of >500 ml/min cardiacoutput. From this discussion, it should be evident thatthere needs to be great care in making the measurementof CVP. Factors affecting the measurement will be dis-cussed in the next section.
Factors affecting the measurement of centralvenous pressureFactors that affect hydrostatic measurements includezeroing, leveling, where on the waveform to make themeasurement, and actual pressure across an elastic struc-ture (transmural pressure).
ZeroingThefirst and foremost concept that needs tobeunderstoodis the relativenature of hydrostatic pressuremeasurements[11]. To begin, pressure transducers are opened to air so
that an assessment of the deviations from atmosphericpressure can be made. Atmospheric pressure is thus thezero value. This means that a CVP of 10 mmHg at anatmospheric pressure of 760 mmHg is actually 770 mmHg.If the absolute pressure were used rather than the valuerelative to atmosphere, changes in atmospheric pressure ofonly 10 mmHgwouldproduce seemingly largehemodyan-mic changes and one would have to continuously checkwith the weather office to determine if atmospheric pres-sure or the patient’s pressure has changed!
LevelingPressure measurements made with a fluid-filled systemare also relative to an arbitrary reference level (Fig. 1). Onphysical examination, the standard reference level forassessment of jugular venous distension and pressure isthe sternal angle, which in most people is "5 cm verti-cally above the mid-point of the right atrium. This is trueeven when the person sits up at a 608 angle because theright atrium is an anterior and relatively round structureso that the mid-point remains at the same vertical dis-tance below the sternal angle. In our unit we use thisreference level for hemodynamic measurements (Fig. 2).To do this we place a carpenter’s level on the sternalangle and level the transducer 5 cm below the level of thesternal angle. When the patient sits up the transducer isre-leveled to the new position. The proper level to use onthe transducer is the level of the stopcock because this iswhere the transducer is opened to the atmosphere forzeroing and takes into account the fluid column that itnecessary to fill the transducer. The difference betweenthe stopcock and bottom of a standard transducer can bealmost 4 cm, which would result in a pressure variation of"3 mmHg between a pressure referenced to the topcompared with a pressure referenced to the bottom.More commonly, the mid-thoracic position at the fourthinterspace is used to level the transducer. This level gives
2 Cardiopulmonary monitoring
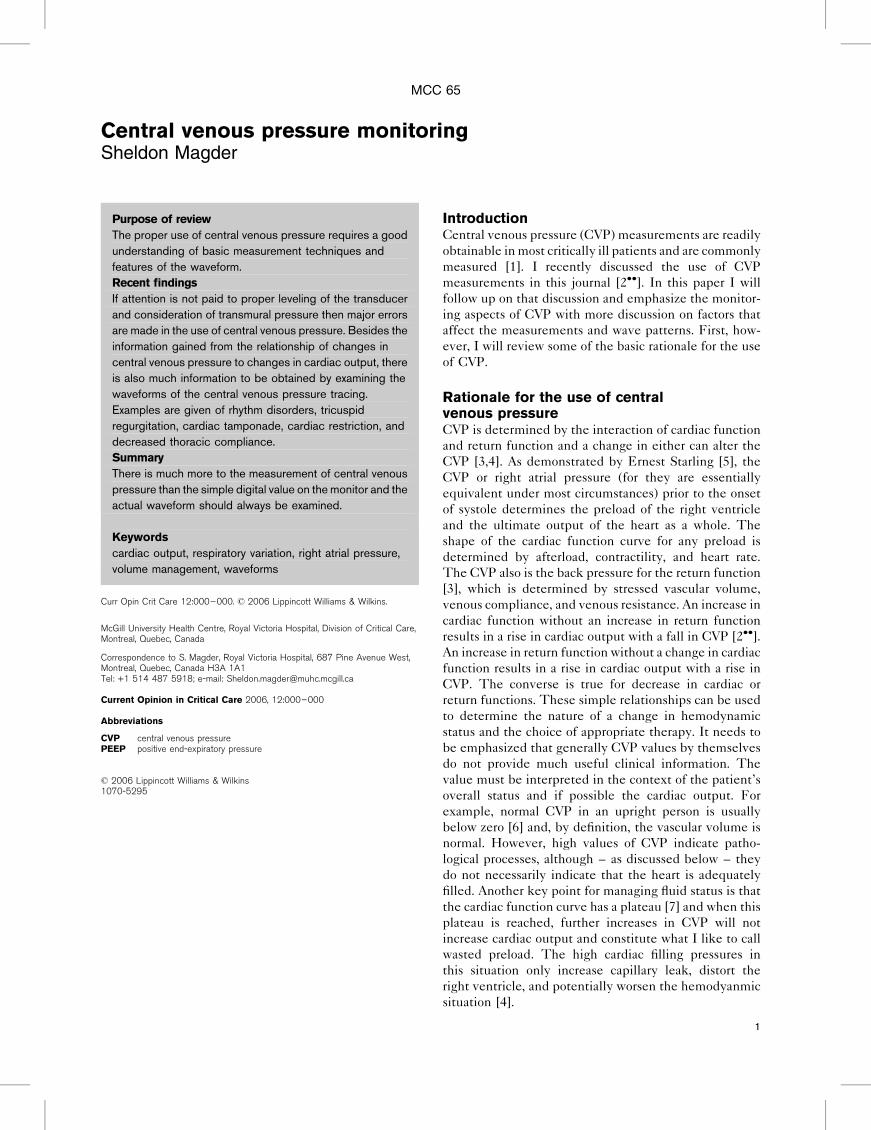
Figure 1 Illustration of the principle of leveling and relative pressure
The level of the measuring device is at thebottom of the tank in A and the pressureis 20 cmH2O. The level is at the top of thetank in B and the pressure is 20 mmHgwhether the channel from the bottom ortop is open. Atmospheric pressurepushes down on all the surfaces so thatwater will be at the same level in the tankand the manometers.
values that are on average 3 mmHg greater than pressuresmeasured relative to 5 cm below the sternal angle. Thisneeds to be considered when comparing results from
different investigators. Furthermore, the mid-axillaryposition should only be used with patients in the supineposition because the relationship of this level to the mid-right atrium varies in different postures.
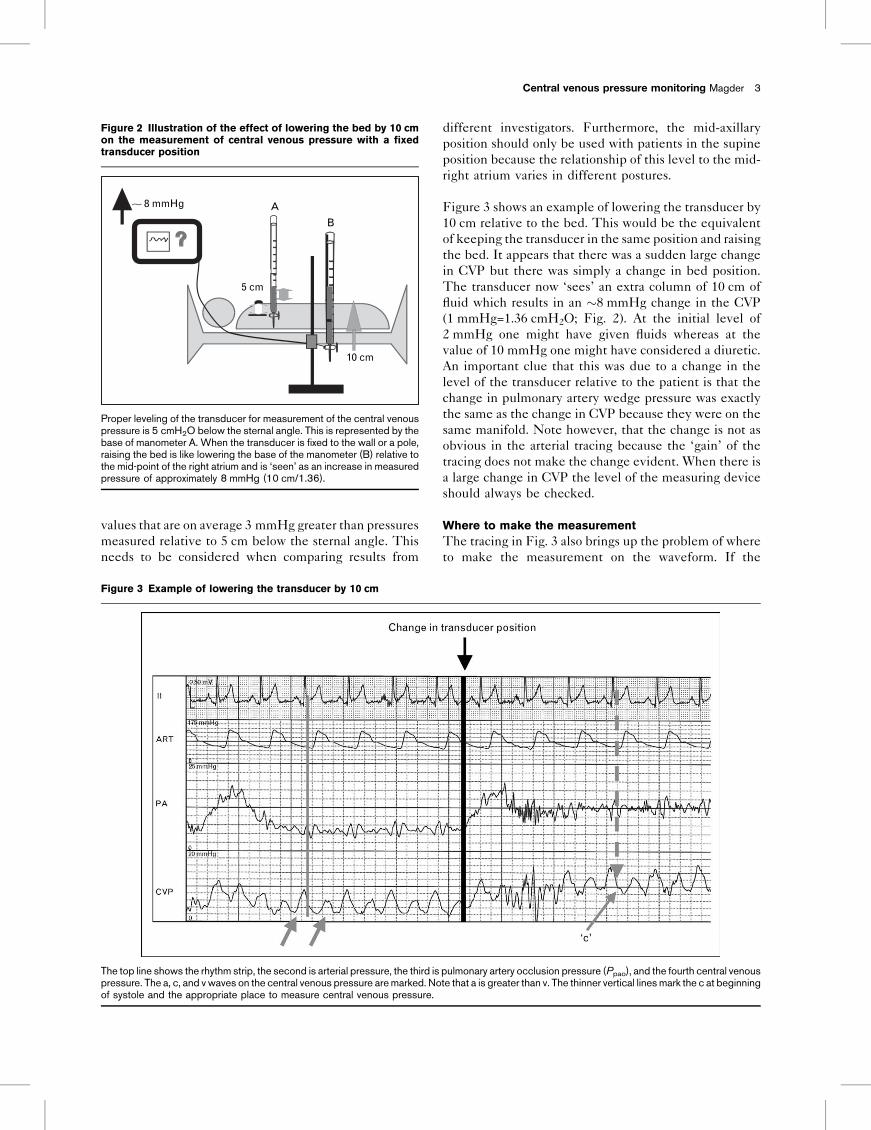
Figure 3 shows an example of lowering the transducer by10 cm relative to the bed. This would be the equivalentof keeping the transducer in the same position and raisingthe bed. It appears that there was a sudden large changein CVP but there was simply a change in bed position.The transducer now ‘sees’ an extra column of 10 cm offluid which results in an "8 mmHg change in the CVP(1 mmHg=1.36 cmH2O; Fig. 2). At the initial level of2 mmHg one might have given fluids whereas at thevalue of 10 mmHg one might have considered a diuretic.An important clue that this was due to a change in thelevel of the transducer relative to the patient is that thechange in pulmonary artery wedge pressure was exactlythe same as the change in CVP because they were on thesame manifold. Note however, that the change is not asobvious in the arterial tracing because the ‘gain’ of thetracing does not make the change evident. When there isa large change in CVP the level of the measuring deviceshould always be checked.
Where to make the measurementThe tracing in Fig. 3 also brings up the problem of whereto make the measurement on the waveform. If the
Central venous pressure monitoring Magder 3
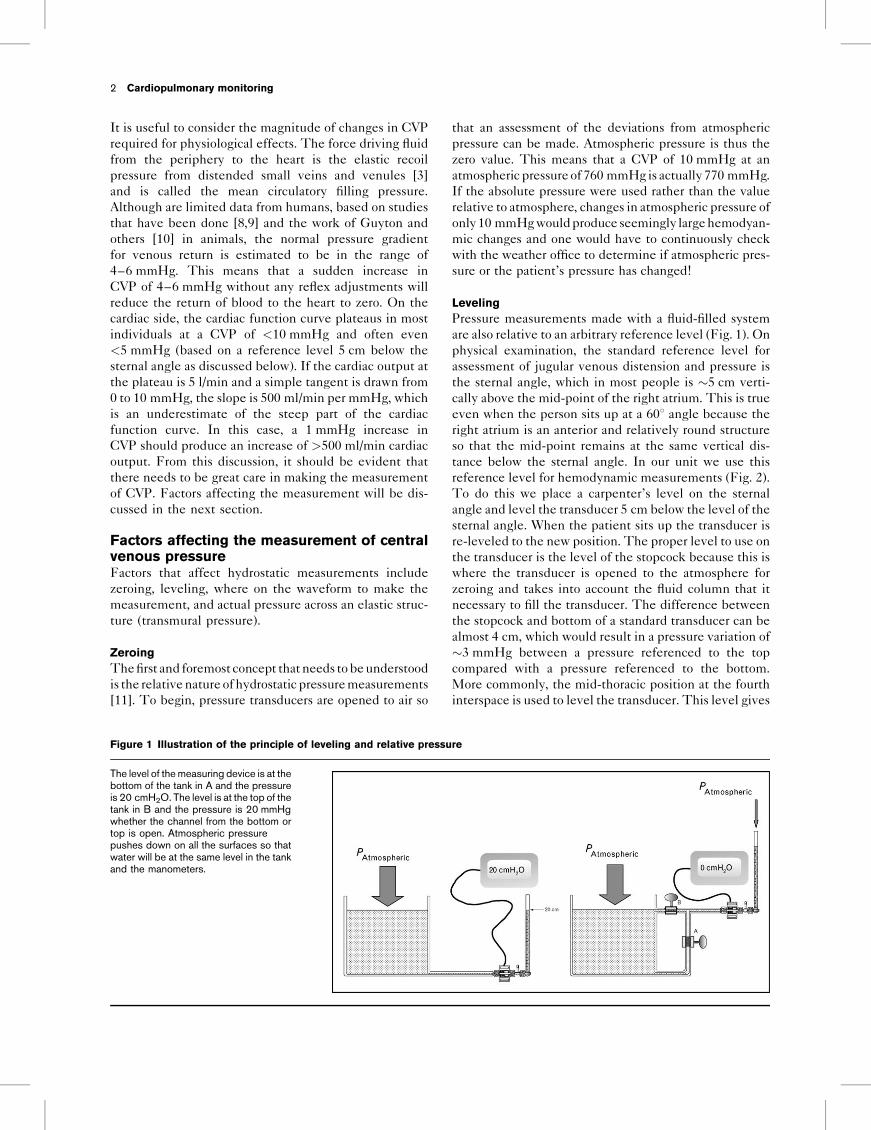
Figure 2 Illustration of the effect of lowering the bed by 10 cmon the measurement of central venous pressure with a fixedtransducer position
A8 mmHg
B
5 cm
10 cm
Proper leveling of the transducer for measurement of the central venouspressure is 5 cmH2O below the sternal angle. This is represented by thebase of manometer A. When the transducer is fixed to the wall or a pole,raising the bed is like lowering the base of the manometer (B) relative tothe mid-point of the right atrium and is ‘seen’ as an increase in measuredpressure of approximately 8 mmHg (10 cm/1.36).
Figure 3 Example of lowering the transducer by 10 cm
The top line shows the rhythm strip, the second is arterial pressure, the third is pulmonary artery occlusion pressure (Ppao), and the fourth central venouspressure. The a, c, and v waves on the central venous pressure aremarked. Note that a is greater than v. The thinner vertical linesmark the c at beginningof systole and the appropriate place to measure central venous pressure.
bottom of the tracing is used at end expiration the value is2 mmHg, if the top is used it is 9 mmHg, and the in themiddle it is 5 mmHg. To answer the question of where tomake the measurement one first needs to identify thewaves. In this example the most prominent positivedeflection is the a wave and the v wave is the smallerpositive deflection. The x and y descents are of similarmagnitude. A primary purpose for measuring CVP is theassessment of cardiac preload. This is best measured atthe base of the c wave which is not readily evident inmostof the beats of this tracing but can be seen in the part ofthe tracing after the transducer was moved. The c waverepresents the buckling of the atrio-ventricular valve intothe atrium during the start of systole. The base of the cwave is used because this is the final pressure in theventricle before the onset of contraction and representsthe final distending force for the ventricle, which ispreload. When the c wave is not evident, the base ofthe a wave usually gives a similar estimate, but in thisexample it is not clear either. The solution then is to usethe QRS wave to time the events and note the CVP valueassociated with the QRS of the electrocardiogram signal(adjustments may have to be made for the delay in thefluid signal compared to the electrical signal). In thisexample, the arterial pressure tracing is a good indicatorof the timing of events. I would have said that the CVP is4 mmHg based on a line drawn from the onset of thearterial pulse and the evident c wave a beat after thetransducer was moved. The ideal solution for such casesis to obtain a paper record so that users can compare theirarbitrary decisions. Changes from this agreed-uponmeasurement are then what is most important.
Transmural pressureAnother key factor to keep in mind is that the pressurethat is important for the distention of an elastic structuresuch as the heart and blood vessels is the transmuralpressure of the structure. This is defined as the pressuredifference between inside and outside the structure. Themeasurement problem is that although the heart is sur-rounded by pleural pressure, which differs from atmos-pheric pressure during the respiratory cycle, we arerestricted to making pressure measurements relative toatmospheric pressure. To minimize this problem, press-ures are made at end expiration when pleural pressure isclosest to atmospheric pressure, but there are importantlimitations that need to be considered. First an increase inpositive end-expiratory pressure raises pleural pressure atend expiration, which means that the measured valuealways deviates from the true transmural value (Fig. 4).
However, it is worthwhile considering some quantitativeaspects which put the clinical significance of this inperspective. In someone with normal lungs about halfthe airway pressure is transmitted to the pleural space andless is transmitted when the lungs are diseased. Thus a
positive end-expiratory pressure (PEEP) of 10 cmH2O,whether extrinsic or instrinsic, would likely increase thepleural pressure by about 4–5 cmH2O and even less insomeone with stiff, diseased lungs. Thus, a PEEP of10 cmH2O, likely increases the measured CVP by lessthan 3 mmHg in most persons. However, the effect ofPEEP can become significant at higher values of PEEP.It should, however, be remembered that the hemody-namic response to a change in CVP does not requireknowledge of the absolute value and the cardiac outputresponse to a change in CVP is still of use. On the otherhand, it is the CVP relative to atmosphere and not thetransmural right atrial pressure that determines the backpressure for venous return and the force determiningcapillary filtration in extrathoracic vessels.
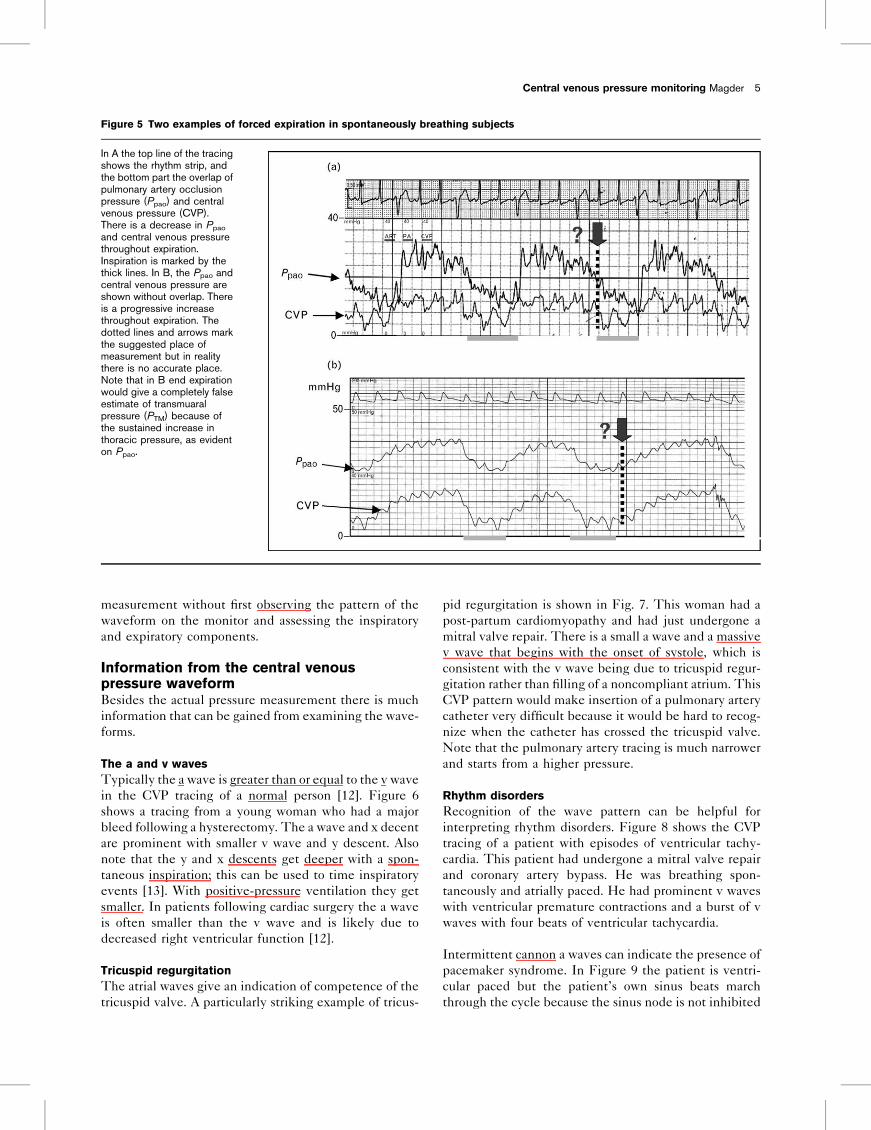
The distinction of transmural pressure versus pressurerelative to atmosphere becomes very important inpatients who breathe with a forced expiration. Forcedexpirations can have two general patterns. In one thepatient forcibly expires from the start of expiration andthe pleural pressure progressively decreases during theexpiration (Fig. 5A). In these cases the CVP value at theend of a long breath gives a good approximation ofthe true CVP. In the second pattern the patient increasesthe force of expiration throughout the expiratory phase sothat the pressure continuously rises during expiration(Fig. 5B). In these patients the end-expiratory valueof CVP gives a completely erroneous estimate of thetransmural CVP. This pattern is very common in criticallyill patients and must be watched for. Because of thisproblem, I would recommend never making a CVP
4 Cardiopulmonary monitoring
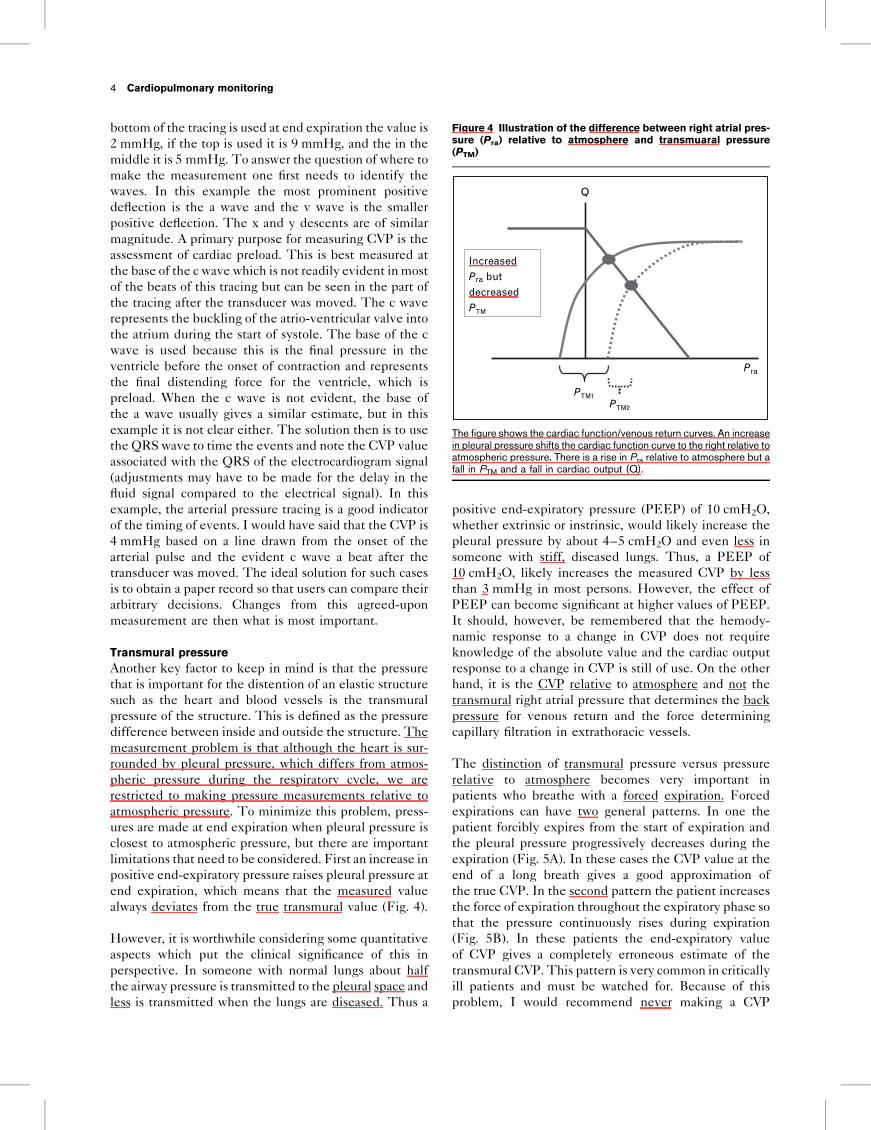
Figure 4 Illustration of the difference between right atrial pres-sure (Pra) relative to atmosphere and transmuaral pressure(PTM)
Q
Pra
PTM1PTM2
Increasedbut Pra
decreasedPTM
The figure shows the cardiac function/venous return curves. An increasein pleural pressure shifts the cardiac function curve to the right relative toatmospheric pressure. There is a rise in Pra relative to atmosphere but afall in PTM and a fall in cardiac output (Q).
measurement without first observing the pattern of thewaveform on the monitor and assessing the inspiratoryand expiratory components.
Information from the central venouspressure waveformBesides the actual pressure measurement there is muchinformation that can be gained from examining the wave-forms.
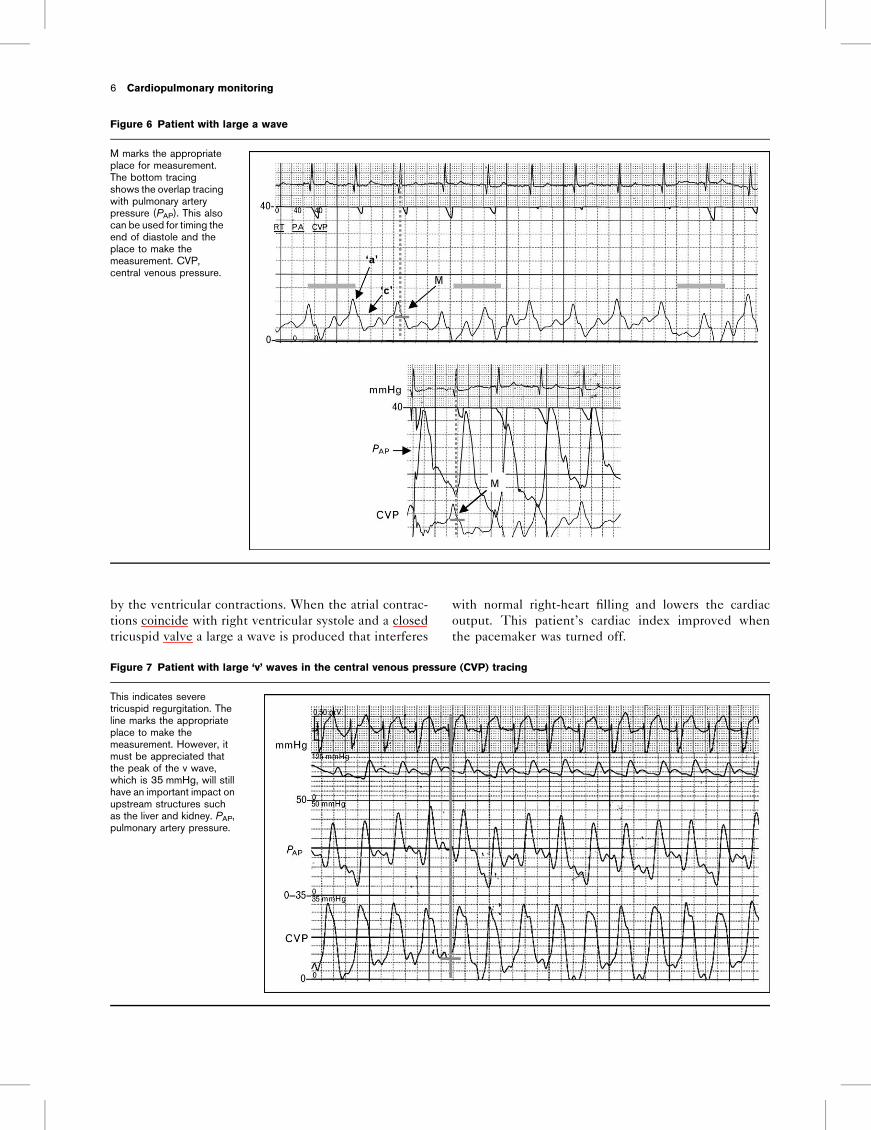
The a and v wavesTypically the a wave is greater than or equal to the v wavein the CVP tracing of a normal person [12]. Figure 6shows a tracing from a young woman who had a majorbleed following a hysterectomy. The a wave and x decentare prominent with smaller v wave and y descent. Alsonote that the y and x descents get deeper with a spon-taneous inspiration; this can be used to time inspiratoryevents [13]. With positive-pressure ventilation they getsmaller. In patients following cardiac surgery the a waveis often smaller than the v wave and is likely due todecreased right ventricular function [12].
Tricuspid regurgitationThe atrial waves give an indication of competence of thetricuspid valve. A particularly striking example of tricus-
pid regurgitation is shown in Fig. 7. This woman had apost-partum cardiomyopathy and had just undergone amitral valve repair. There is a small a wave and a massivev wave that begins with the onset of systole, which isconsistent with the v wave being due to tricuspid regur-gitation rather than filling of a noncompliant atrium. ThisCVP pattern would make insertion of a pulmonary arterycatheter very difficult because it would be hard to recog-nize when the catheter has crossed the tricuspid valve.Note that the pulmonary artery tracing is much narrowerand starts from a higher pressure.
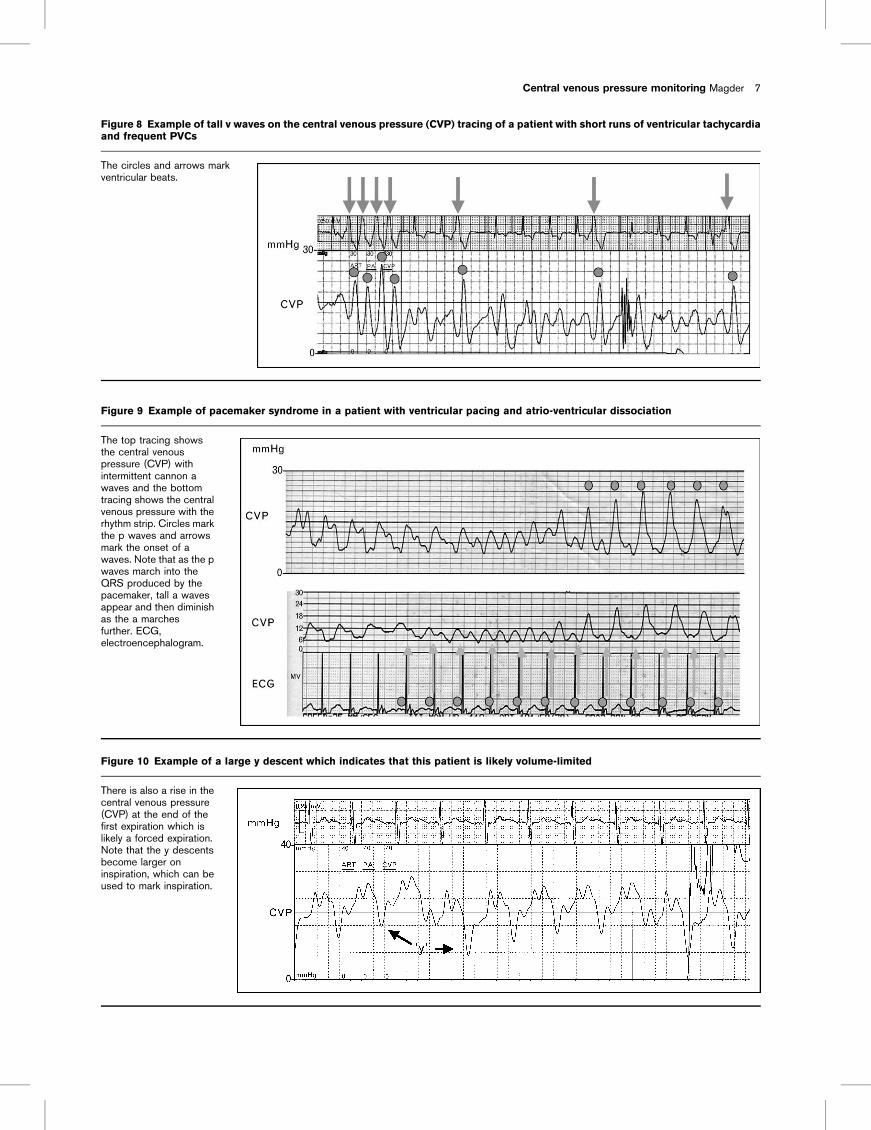
Rhythm disordersRecognition of the wave pattern can be helpful forinterpreting rhythm disorders. Figure 8 shows the CVPtracing of a patient with episodes of ventricular tachy-cardia. This patient had undergone a mitral valve repairand coronary artery bypass. He was breathing spon-taneously and atrially paced. He had prominent v waveswith ventricular premature contractions and a burst of vwaves with four beats of ventricular tachycardia.
Intermittent cannon a waves can indicate the presence ofpacemaker syndrome. In Figure 9 the patient is ventri-cular paced but the patient’s own sinus beats marchthrough the cycle because the sinus node is not inhibited
Central venous pressure monitoring Magder 5
Figure 5 Two examples of forced expiration in spontaneously breathing subjects
In A the top line of the tracingshows the rhythm strip, andthe bottom part the overlap ofpulmonary artery occlusionpressure (Ppao) and centralvenous pressure (CVP).There is a decrease in Ppao
and central venous pressurethroughout expiration.Inspiration is marked by thethick lines. In B, the Ppao andcentral venous pressure areshown without overlap. Thereis a progressive increasethroughout expiration. Thedotted lines and arrows markthe suggested place ofmeasurement but in realitythere is no accurate place.Note that in B end expirationwould give a completely falseestimate of transmuaralpressure (PTM) because ofthe sustained increase inthoracic pressure, as evidenton Ppao.
by the ventricular contractions. When the atrial contrac-tions coincide with right ventricular systole and a closedtricuspid valve a large a wave is produced that interferes
with normal right-heart filling and lowers the cardiacoutput. This patient’s cardiac index improved whenthe pacemaker was turned off.
6 Cardiopulmonary monitoring
Figure 6 Patient with large a wave
M marks the appropriateplace for measurement.The bottom tracingshows the overlap tracingwith pulmonary arterypressure (PAP). This alsocan be used for timing theend of diastole and theplace to make themeasurement. CVP,central venous pressure.
Figure 7 Patient with large ‘v’ waves in the central venous pressure (CVP) tracing
This indicates severetricuspid regurgitation. Theline marks the appropriateplace to make themeasurement. However, itmust be appreciated thatthe peak of the v wave,which is 35 mmHg, will stillhave an important impact onupstream structures suchas the liver and kidney. PAP,pulmonary artery pressure.
Central venous pressure monitoring Magder 7
Figure 8 Example of tall v waves on the central venous pressure (CVP) tracing of a patient with short runs of ventricular tachycardiaand frequent PVCs
The circles and arrows markventricular beats.
Figure 9 Example of pacemaker syndrome in a patient with ventricular pacing and atrio-ventricular dissociation
The top tracing showsthe central venouspressure (CVP) withintermittent cannon awaves and the bottomtracing shows the centralvenous pressure with therhythm strip. Circles markthe p waves and arrowsmark the onset of awaves. Note that as the pwaves march into theQRS produced by thepacemaker, tall a wavesappear and then diminishas the a marchesfurther. ECG,electroencephalogram.
Figure 10 Example of a large y descent which indicates that this patient is likely volume-limited
There is also a rise in thecentral venous pressure(CVP) at the end of thefirst expiration which islikely a forced expiration.Note that the y descentsbecome larger oninspiration, which can beused to mark inspiration.
The y descentThe presence of a large y descent indicates restriction ofright ventricular filling (Fig. 10) [13]. This can be due tointrinsic stiffness of the ventricular wall or occur in aventricle that is excessively volume-loaded. In eithercase, further volume loading is unlikely to changecardiac output. We found that when the y descent is>4 mmHg the patient is unlikely to have a rise incardiac output in response to a volume challenge[13]. Whereas this general observation is likely valid,the sample size was not large so the precise cutoff valuehas yet to be determined.
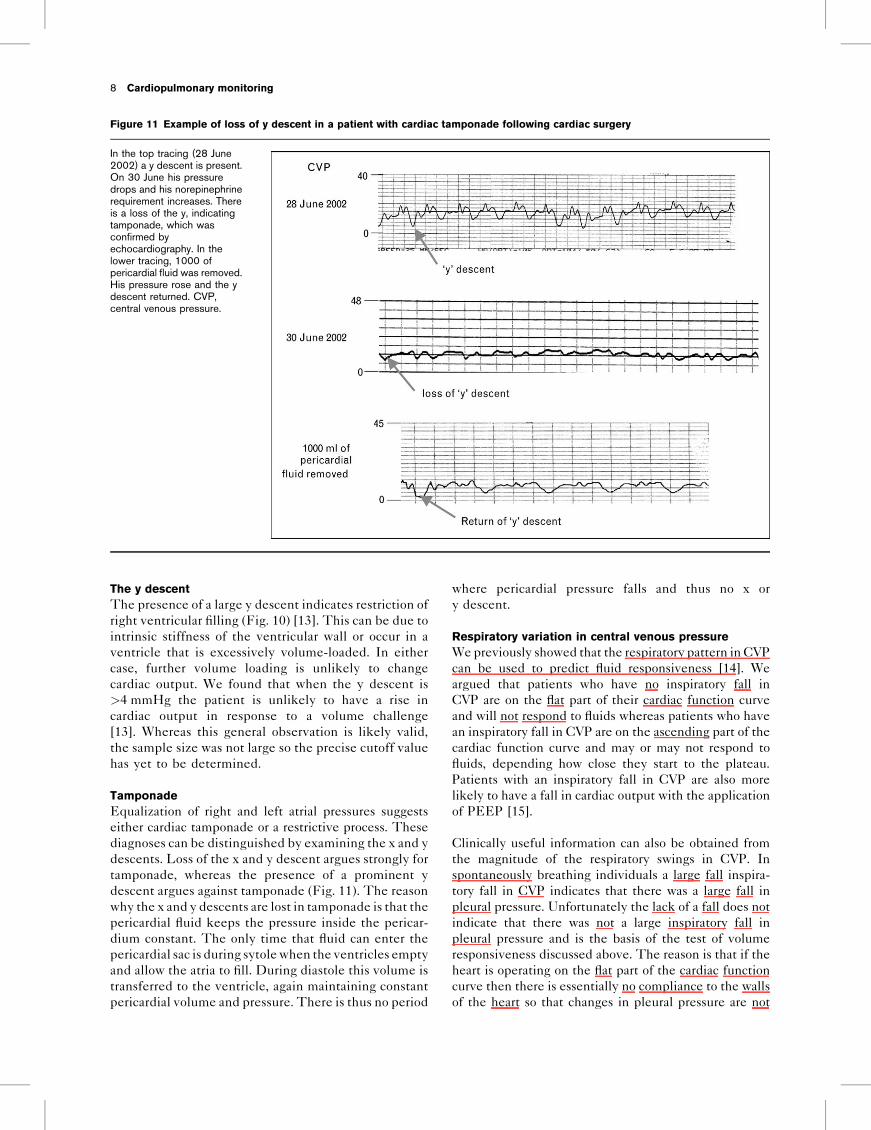
TamponadeEqualization of right and left atrial pressures suggestseither cardiac tamponade or a restrictive process. Thesediagnoses can be distinguished by examining the x and ydescents. Loss of the x and y descent argues strongly fortamponade, whereas the presence of a prominent ydescent argues against tamponade (Fig. 11). The reasonwhy the x and y descents are lost in tamponade is that thepericardial fluid keeps the pressure inside the pericar-dium constant. The only time that fluid can enter thepericardial sac is during sytolewhen the ventricles emptyand allow the atria to fill. During diastole this volume istransferred to the ventricle, again maintaining constantpericardial volume and pressure. There is thus no period
where pericardial pressure falls and thus no x ory descent.
Respiratory variation in central venous pressureWepreviously showed that the respiratory pattern in CVPcan be used to predict fluid responsiveness [14]. Weargued that patients who have no inspiratory fall inCVP are on the flat part of their cardiac function curveand will not respond to fluids whereas patients who havean inspiratory fall in CVP are on the ascending part of thecardiac function curve and may or may not respond tofluids, depending how close they start to the plateau.Patients with an inspiratory fall in CVP are also morelikely to have a fall in cardiac output with the applicationof PEEP [15].
Clinically useful information can also be obtained fromthe magnitude of the respiratory swings in CVP. Inspontaneously breathing individuals a large fall inspira-tory fall in CVP indicates that there was a large fall inpleural pressure. Unfortunately the lack of a fall does notindicate that there was not a large inspiratory fall inpleural pressure and is the basis of the test of volumeresponsiveness discussed above. The reason is that if theheart is operating on the flat part of the cardiac functioncurve then there is essentially no compliance to the wallsof the heart so that changes in pleural pressure are not
8 Cardiopulmonary monitoring
Figure 11 Example of loss of y descent in a patient with cardiac tamponade following cardiac surgery
In the top tracing (28 June2002) a y descent is present.On 30 June his pressuredrops and his norepinephrinerequirement increases. Thereis a loss of the y, indicatingtamponade, which wasconfirmed byechocardiography. In thelower tracing, 1000 ofpericardial fluid was removed.His pressure rose and the ydescent returned. CVP,central venous pressure.
transmitted to the heart. Another way to think of this isthat a trivial increase in the volume of the heart canmaintain the pressure relative to the atmosphere. Afundamental difference between the effects of inspi-ration on the right and left hearts is that the right heartis connected to a reservoir that is surrounded by atmos-phere so that a fall in pleural pressure increases the returnof blood to the right heart. In contrast the left heart is fedby a reservoir that is in the thorax so the environment ofthe left heart does not change relative to its reservoir.
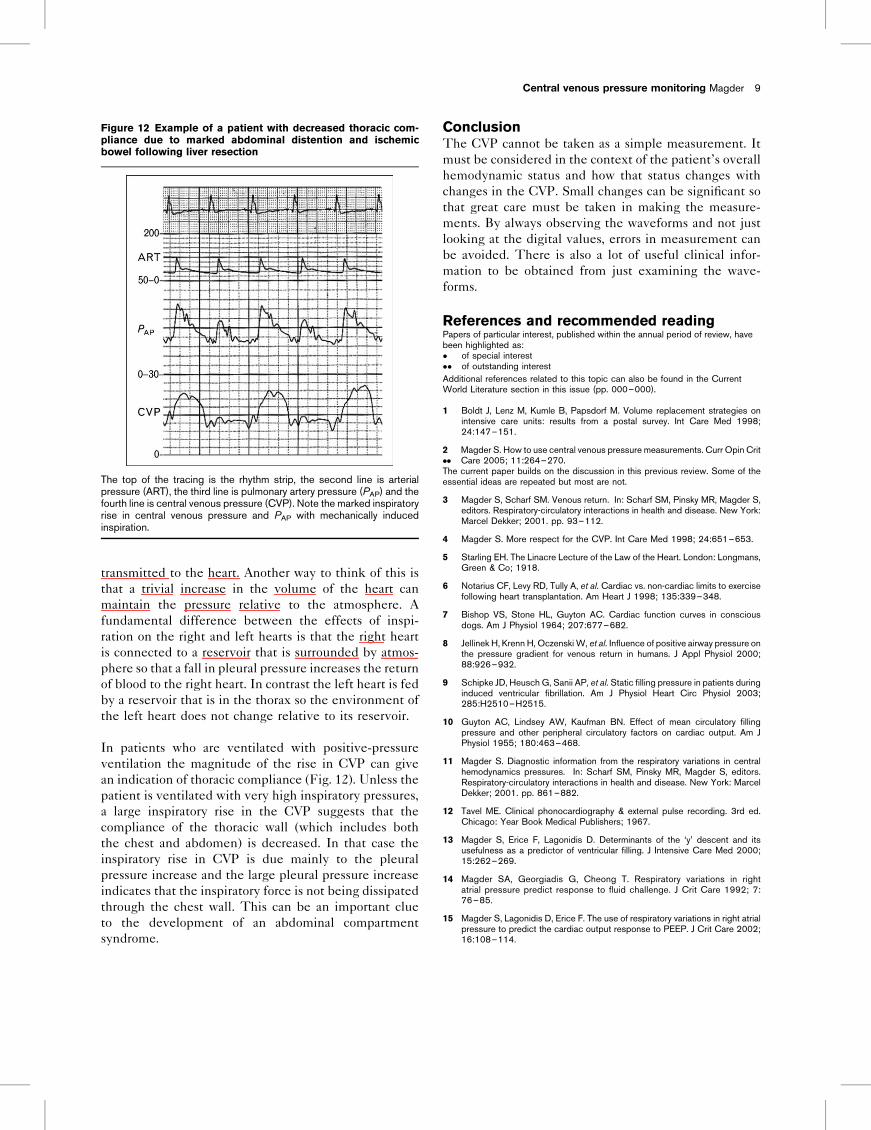
In patients who are ventilated with positive-pressureventilation the magnitude of the rise in CVP can givean indication of thoracic compliance (Fig. 12). Unless thepatient is ventilated with very high inspiratory pressures,a large inspiratory rise in the CVP suggests that thecompliance of the thoracic wall (which includes boththe chest and abdomen) is decreased. In that case theinspiratory rise in CVP is due mainly to the pleuralpressure increase and the large pleural pressure increaseindicates that the inspiratory force is not being dissipatedthrough the chest wall. This can be an important clueto the development of an abdominal compartmentsyndrome.
ConclusionThe CVP cannot be taken as a simple measurement. Itmust be considered in the context of the patient’s overallhemodynamic status and how that status changes withchanges in the CVP. Small changes can be significant sothat great care must be taken in making the measure-ments. By always observing the waveforms and not justlooking at the digital values, errors in measurement canbe avoided. There is also a lot of useful clinical infor-mation to be obtained from just examining the wave-forms.
References and recommended readingPapers of particular interest, published within the annual period of review, havebeen highlighted as:! of special interest!! of outstanding interestAdditional references related to this topic can also be found in the CurrentWorld Literature section in this issue (pp. 000–000).
1 Boldt J, Lenz M, Kumle B, Papsdorf M. Volume replacement strategies onintensive care units: results from a postal survey. Int Care Med 1998;24:147–151.
2!!
Magder S. How to use central venous pressure measurements. Curr Opin CritCare 2005; 11:264–270.
The current paper builds on the discussion in this previous review. Some of theessential ideas are repeated but most are not.
3 Magder S, Scharf SM. Venous return. In: Scharf SM, Pinsky MR, Magder S,editors. Respiratory-circulatory interactions in health and disease. New York:Marcel Dekker; 2001. pp. 93–112.
4 Magder S. More respect for the CVP. Int Care Med 1998; 24:651–653.
5 Starling EH. The Linacre Lecture of the Law of the Heart. London: Longmans,Green & Co; 1918.
6 Notarius CF, Levy RD, Tully A, et al. Cardiac vs. non-cardiac limits to exercisefollowing heart transplantation. Am Heart J 1998; 135:339–348.
7 Bishop VS, Stone HL, Guyton AC. Cardiac function curves in consciousdogs. Am J Physiol 1964; 207:677–682.
8 Jellinek H, Krenn H, Oczenski W, et al. Influence of positive airway pressure onthe pressure gradient for venous return in humans. J Appl Physiol 2000;88:926–932.
9 Schipke JD, Heusch G, Sanii AP, et al. Static filling pressure in patients duringinduced ventricular fibrillation. Am J Physiol Heart Circ Physiol 2003;285:H2510–H2515.
10 Guyton AC, Lindsey AW, Kaufman BN. Effect of mean circulatory fillingpressure and other peripheral circulatory factors on cardiac output. Am JPhysiol 1955; 180:463–468.
11 Magder S. Diagnostic information from the respiratory variations in centralhemodynamics pressures. In: Scharf SM, Pinsky MR, Magder S, editors.Respiratory-circulatory interactions in health and disease. New York: MarcelDekker; 2001. pp. 861–882.
12 Tavel ME. Clinical phonocardiography & external pulse recording. 3rd ed.Chicago: Year Book Medical Publishers; 1967.
13 Magder S, Erice F, Lagonidis D. Determinants of the ‘y’ descent and itsusefulness as a predictor of ventricular filling. J Intensive Care Med 2000;15:262–269.
14 Magder SA, Georgiadis G, Cheong T. Respiratory variations in rightatrial pressure predict response to fluid challenge. J Crit Care 1992; 7:76–85.
15 Magder S, Lagonidis D, Erice F. The use of respiratory variations in right atrialpressure to predict the cardiac output response to PEEP. J Crit Care 2002;16:108–114.
Central venous pressure monitoring Magder 9
Figure 12 Example of a patient with decreased thoracic com-pliance due to marked abdominal distention and ischemicbowel following liver resection
The top of the tracing is the rhythm strip, the second line is arterialpressure (ART), the third line is pulmonary artery pressure (PAP) and thefourth line is central venous pressure (CVP). Note the marked inspiratoryrise in central venous pressure and PAP with mechanically inducedinspiration.