cebra report cover page...cebra report cover page title, id, & output # evaluating the health of...
TRANSCRIPT
CEBRA Report Cover Page
Title, ID, & Output # Evaluating the Health of Australia’s Biosecurity System, Project 1607B – Milestone 6
Project Type Standard CEBRA Project Leader Karen Schneider
Sponsoring Org. Australian Government Department
of Agriculture and Water Resources
(DAWR)
DAWR Project Sponsor Matthew Koval
DAWR Project Leader Paul Pheloung Collaborators Jay Gomboso
Zoltan Lucas
Project Objectives The primary objective of the project is to develop a framework and methodology to measure and report
on the health, or performance, of Australia’s national biosecurity system that can be repeated at regular
intervals. This should capture all elements of the biosecurity system and all participants in the system;
articulate relevant attributes of system performance; and establish qualitative and quantitative
measures of performance and associated performance indicators.
Outputs Key outputs for phase 1 of the project include:
- a comprehensive review of the performance evaluation literature of relevance to the biosecurity system, including performance evaluation of complex systems in the public sector in Australia and internationally;
- a detailed description of Australia’s biosecurity system, using a program logic approach;
- a framework for evaluating the health of the biosecurity system based on ten principles;
- a list and definition of the attributes of biosecurity system health against which the performance of the biosecurity system can be evaluated;
- a case study that demonstrated the application of indicators to measuring attributes of health on the international air passenger pathway and discussed some of the opportunities and challenges associated with collecting and analysing the data that are needed for such exercises.
CEBRA Workplan
Budget
Year 2016-17
$100,000
Project Changes Nil
Research Outcomes N/A
Recommendations N/A
Related Documents Project Business Case
Report Complete Yes
1
Evaluating the Health of Australia’s Biosecurity System
Final report: CEBRA Project 1607B – Milestone 6
Karen Schneider, Hannah Fraser, Aaron Dodd, Andrew Robinson, Edith Arndt
The University of Melbourne
March 2018
2
Acknowledgements
This report is a product of the Centre of Excellence for Biosecurity Risk Analysis (CEBRA). In
preparing this report, the authors acknowledge financial and other support provided by the
Australian Department of Agriculture and Water Resources, the New Zealand Ministry for
Primary Industries and the University of Melbourne.
3
Table of Contents
Acknowledgements.................................................................................................................... 2
Table of Contents ....................................................................................................................... 3
Table of Tables ........................................................................................................................... 4
Table of Figures .......................................................................................................................... 4
Executive Summary .................................................................................................................... 6
1 Introduction ........................................................................................................................ 7
2 Defining the biosecurity system ......................................................................................... 9
2.1 The external context .................................................................................................. 9
2.2 Principles of the national biosecurity system .......................................................... 10
2.3 Participants in the biosecurity system – a partnership approach ........................... 11
2.4 Resourcing the national biosecurity system ............................................................ 13
2.5 Biosecurity is a complex system .............................................................................. 14
2.6 Activities ................................................................................................................... 17
2.7 Influencers and Enablers .......................................................................................... 30
3 How have others evaluated complex systems? ............................................................... 33
3.1 Approaches to evaluating the performance of complex systems ........................... 33
3.2 Using indicators to measure performance .............................................................. 36
3.3 Benchmarking performance .................................................................................... 38
3.4 Evaluation of system health by public sector agencies ........................................... 39
4 Evaluation Framework ...................................................................................................... 46
4.1 Use a program logic/theory of change structure as the basis for the evaluation
framework. ........................................................................................................................... 46
4.2 Define the biosecurity system as complex. ............................................................. 47
4.3 Take a cumulative approach – from individual elements to whole of system ........ 47
4.4 Define the attributes of health against which performance will be evaluated ...... 48
4.5 Develop indicators of system performance ............................................................. 50
4.6 Use quantitative and qualitative indicators of performance .................................. 51
4.7 Have overarching quantitative indicators linked to objectives that provide a high-
level picture of performance................................................................................................ 51
4
4.8 Develop targets and benchmarks for performance indicators in conjunction with
stakeholders ......................................................................................................................... 52
4.9 Build a narrative of the performance story using the selected indicators .............. 52
4.10 Use case studies to build the performance story element by element .................. 52
5 Case Study – screening of international air passengers ................................................... 54
5.1 Introduction ............................................................................................................. 54
5.2 Methods and materials ............................................................................................ 54
5.3 Results ...................................................................................................................... 58
Effectiveness ..................................................................................................................... 58
Efficiency ........................................................................................................................... 60
5.4 Discussion................................................................................................................. 65
Demonstrate the application of indicators to measuring attributes of health. ............... 65
Provide some assessment of the health of an aspect of the biosecurity system. ........... 65
Opportunities and challenges associated with collecting and analysing the data. ......... 65
6 Implementing the evaluation framework ........................................................................ 67
6.1 Next steps ................................................................................................................ 67
7 References ........................................................................................................................ 69
8 Appendix A – ABARES Literature Review ......................................................................... 74
Table of Tables
Table 1: Size of the import task, selected indicators, 2015-16 (DAWR, 2016d). ..................... 21
Table 2: Proposed attributes of system health........................................................................ 49
Table of Figures
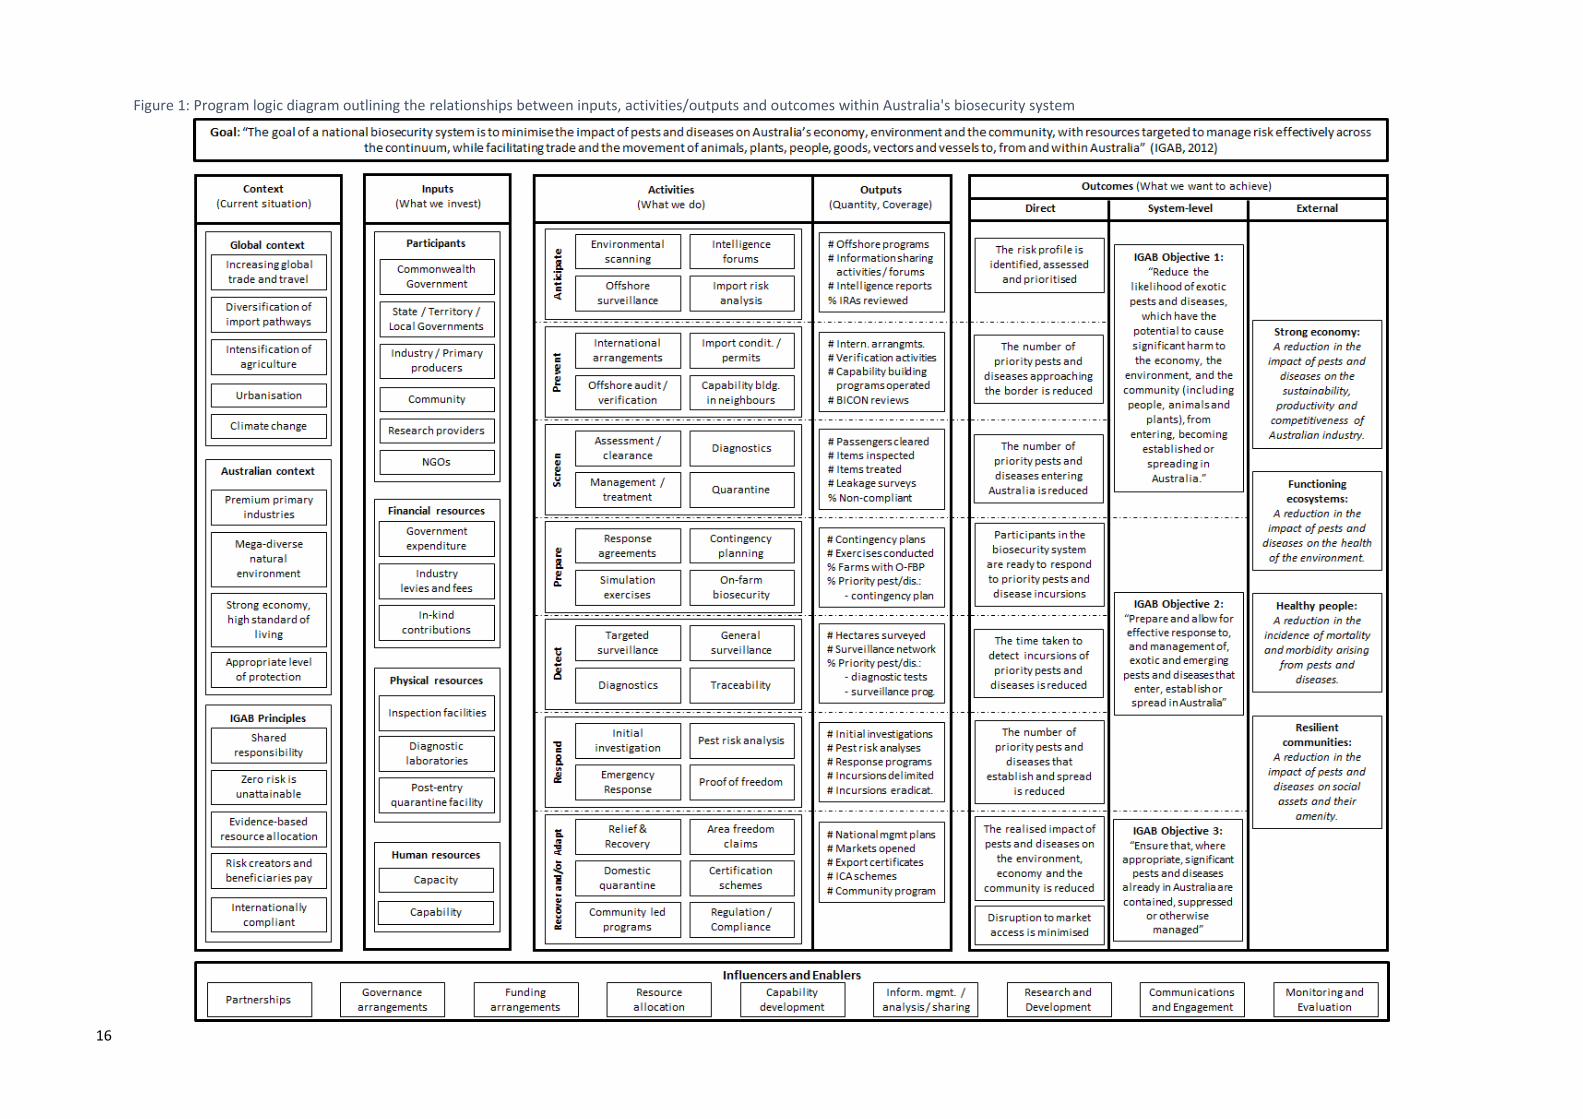
Figure 1: Program logic diagram outlining the relationships between inputs,
activities/outputs and outcomes within Australia's biosecurity system ................................. 16
Figure 2: Key elements of the program logic structure ........................................................... 46
Figure 3: Monthly passenger arrivals by airport, intervention, and declaration status. ......... 56
Figure 4: Annual counts of international passengers intercepted with BRM. ........................ 59
Figure 5: Post-Intervention Compliance for international passenger data. ............................ 62

5
Figure 6: Estimated relative contamination rate of passengers inspected or screened over
the average rate of passengers profiled to Direct Exit and Assess & Release. ....................... 63
Figure 7: Effectiveness of each intervention. Interventions under both Assess and Release
and Direct Exit have zero effectiveness by definition. ............................................................ 64
6
Executive Summary
This is the final report of the first phase of CEBRA project 1607B Evaluating the health of
Australia’s biosecurity system. The report represents the outcomes of the first phase of a
multi-year project designed to develop a rigorous method that can be used repeatedly to
evaluate the health of the national biosecurity system against agreed performance criteria
using appropriate performance indicators. The report was prepared for the Department of
Agriculture and Water Resources (the department) but has relevance to all participants in
the national biosecurity system.
The department currently relies largely on qualitative pathway-specific risk analyses and
reviews to assess and address potentially unacceptable exposures to biosecurity risk. These
analyses and reviews focus mainly on elements of the biosecurity system for which the
Australian government has responsibility. However, the department does not currently have
a means of estimating the health of the national biosecurity system as a whole against
appropriate performance criteria This is a significant business gap that limits the capacity of
the department to evaluate the effectiveness of its investments across the biosecurity
system. Other participants, such as state and territory governments, are equally constrained
in assessing the role they play in meeting the objectives of the overarching biosecurity
system.
The report summarises progress to date on the project. It uses a program logic model to
describe the key elements of the national biosecurity system, including the activities
undertaken in the system by different participants, the resources to support them, the
outputs that are produced by these activities and the outcomes they generate. The report
also identifies the broad attributes of health against which the biosecurity system will be
evaluated. These recognise that the national biosecurity system should be capable of
meeting its objectives in an effective, efficient, robust, resilient and sustainable manner.
A case study is used in the report to measure aspects of biosecurity health against the
framework. The case study is focused on some activities in the biosecurity system that are
designed to prevent biosecurity risk material from entering the country on the air passenger
pathway. The case study provides insights into the challenges and opportunities that will
arise from the measurement of national biosecurity system health. It also explores the
accessibility of data necessary to underpin effective performance evaluation and identifies
gaps in current data availability.
The capacity to articulate the health of the national biosecurity system in clear terms against
appropriate criteria provides a sound basis on which all participants can identify where
system improvements can be made, either individually or on a collective, system-wide basis.
7
1 Introduction
The overarching objective of Australia’s national biosecurity system is to minimise the
harmful impacts of exotic pests and diseases on Australia’s economy, environment and
community. In doing so, it underpins access to international markets for agricultural
commodities, protects native flora and fauna, and helps preserve the amenity of the
community’s natural and social assets. The combined value of the economic, environmental
and social benefits of the system are considerable, although as yet unmeasured in an
aggregate sense.
The national biosecurity system is complex, comprising multiple actions undertaken by a
range of participants at different points along the biosecurity continuum – off-shore or pre-
border, at the border, and on-shore or post-border. These actions are designed to achieve
three broad objectives: (i) to reduce the likelihood of exotic pests and diseases that have the
potential to harm the economy, environment and community entering, establishing and
spreading in Australia; (ii) to prepare for and respond to incursions of harmful exotic pests
and diseases; and (iii) to ensure that significant pests and diseases already in Australia are
appropriately managed.
Key players in the national biosecurity system are the Australian, state, territory and local
governments, industry, landholders and producers, and the general community. Each of
these has different roles and responsibilities, although the concepts of partnership and
shared responsibility have underpinned the system for some time.
A fundamental principle of the biosecurity system is that activity is based on sound science
and underpinned by a risk management approach. Risk management is designed to ensure
that resources invested in the system are allocated to the areas of highest risk where the
returns on investment are likely to be maximised. It recognises that achieving zero risk is
unattainable but aims to reduce risk to a very low level – defined as Australia’s appropriate
level of protection (ALOP). This definition of ALOP is consistent with Australia’s obligations
under the World Trade Organisation and the associated Agreement on the Application of
Sanitary and Phytosanitary Measures, which sets the international rules for managing
biosecurity risk.
The biosecurity risks facing Australia are not static. Over time the scale of biosecurity risks
will increase with growing volumes of trade and passenger movements. Pressures on the
biosecurity system will also change as the origin and destination of trade and passenger
movements shift; the global distribution of pests and diseases changes in response to
factors such as climate; and supply chains become more complex. At the same time,
innovation and technological advances are providing opportunities to manage biosecurity
risks in new ways. The long-term sustainability of the national biosecurity system will be
influenced by these pressures and responses to them by the multiple players in the system,
including through the provision of sustainable funding mechanisms.
8
The national biosecurity system represents a significant investment by all participants, with
expenditure totalling almost $1 billion in 2015-16. The Australian government currently
spends approximately $624 million a year on its biosecurity responsibilities. State, territory
and local governments collectively spend in the order of $375 million a year. Of these
amounts, industry participants contribute levies on production and fee for service payments
of approximately $575 million. Industry, landholders and community groups also make
substantial in-kind contributions (Craik et al., 2017).
Given the important objectives of the national biosecurity system and the significant
investment involved it is imperative to evaluate the overall performance of the system. The
Australian and state and territory governments have a strong focus on performance
evaluation and require that performance frameworks are in place to assess the
effectiveness and efficiency of their activities, including biosecurity. Performance evaluation
supports the accountability of agencies and can be used to identify risks in the system and
areas of potential improvement, as well as supporting investment decision making.
Evaluation of components of the national biosecurity system occurs on a regular basis. The
Australian and state and territory governments, for example, articulate performance
measures in corporate plans, strategy documents and annual reports, although their
coverage and sophistication vary widely (Craik et al., 2017). Jurisdictional auditors-general
undertake reviews of aspects of the biosecurity system from time to time and have been
influential in driving system reform in some jurisdictions.
Several independent reports have provided ‘one-off’ overviews of the biosecurity system.
These include the Nairn review (Nairn et al., 1996), which established the principle of shared
responsibility and the Beale review (Beale et al., 2008), which built on this principle, moved
from consideration of quarantine to the broader concept of biosecurity, and underscored
the importance of a risk based management approach. In 2011, the Matthews review
assessed Australia’s preparedness for the threat of foot-and-mouth disease, including the
capacity to prevent and respond to an outbreak (Matthews, 2011).
There has not, however, been a consistent, rigorous approach to evaluating the
performance, or the health, of the biosecurity system at the national level. This gap has
been identified by the review into the Intergovernmental Agreement on Biosecurity, which
notes that it is not possible to ‘roll up’ individual jurisdictional performance measures to
capture the national system and assess national performance (Craik et al., 2017). The review
recommends the development of a performance framework and performance measures for
the national biosecurity system.
This report into the health of Australia’s biosecurity system responds to that
recommendation by proposing a performance evaluation framework and candidate
measures that can be used to assess performance of Australia’s biosecurity system at the
national level. Regular, objective and evidence based reporting of the health of the
biosecurity system would benefit all participants in the system by providing a sound basis on
which to assess the impacts of investments in different elements of the biosecurity system
and in the system as a whole.
9
2 Defining the biosecurity system
The Australian biosecurity system is complex, comprising multiple actions undertaken by a
range of participants at different points along the biosecurity continuum – off-shore or pre-
border, at the border, and on-shore or post-border. The broad goal of the system is
articulated in the Intergovernmental Agreement on Biosecurity (IGAB), an agreement
between the Commonwealth, state and territory governments, with the exception of
Tasmania. The goal is defined as being to ‘minimise the impacts of pests and diseases on
Australia’s economy, environment and the community, with resources targeted at managing
risk effectively across the continuum, while facilitating trade and the movement of animals,
plants, people, goods, vectors and vessels to, from and within Australia’ (COAG, 2012).
Beneath this overarching goal the objectives of the national biosecurity system are
identified in the IGAB as being to provide arrangements, structures and frameworks that:
• reduce the likelihood of exotic pests and diseases, which have the potential to cause
significant harm to the economy, the environment and the community, from
entering, establishing or spreading in Australia;
• prepare and allow for effective responses to, and management of, exotic and
emerging pests and diseases that enter, establish or spread in Australia; and
• ensure that, where appropriate, significant pests and diseases already in Australia
are contained, suppressed or otherwise managed (COAG, 2012).
Through meeting these objectives, the biosecurity system helps to deliver some important
outcomes for Australia’s economy, environment and people. By reducing the impacts of
pests and diseases, an effective biosecurity system supports the sustainability, profitability
and competitiveness of Australia’s agriculture, fisheries and forestry industries, which, in
turn, helps drive a stronger Australian economy. The reduction in pest and disease impacts
also contributes to the health of the environment through better functioning ecosystems. It
supports a healthier population by reducing the incidence of mortality and morbidity arising
from pests and diseases, and underpins resilient communities through its protection of
social assets in natural and built environments and the amenity value they create.
2.1 The external context
The Australian biosecurity system does not operate in isolation – global and domestic
factors define the context within which biosecurity activities take place. Changes in these
factors change the biosecurity risks facing Australia. For example, over time, the scale of
biosecurity risks will increase with growing volumes of trade and passenger movements.
Containerised imports to Australia are forecast to grow by 50 per cent between 2013 and
2025 and non-containerised imports by 27 per cent (DIRD, 2014). Passenger arrivals by air
are expected to increase by more than 90 per cent by 2030, and there is a significant
increase forecast in the movement of passengers by sea, including on cruise vessels to
remote locations (DIRD, 2014).
10
Pressures on the biosecurity system will also change as the origin and destination of trade
and passenger movements shift, leading to increasingly diverse and potentially higher risk
import pathways (Hulme, 2009; Dodd et al., 2015). Similarly, international supply chains are
expected to become more complex over time with final goods made up of components from
multiple origins that may involve different risk profiles, while the growing use of online
shopping requires new approaches to risk management. Other global trends with
implications for biosecurity risk are the intensification of agricultural industries and the
expansion of monocultures that can concentrate the impacts of pests and diseases, and
urbanisation that brings biosecurity risks closer to agriculturally sensitive areas (Craik et al.,
2017). The global distribution of pests and diseases is also likely to change in response to
factors such as climate. At the same time, technological advances are bringing new
opportunities to manage biosecurity risk in innovative and cost-effective ways.
In the domestic context, there is much to protect. Australia’s agriculture, fisheries and
forestry industries generate significant value and have a reputation for quality and safety
that supports their access to international markets. Australia also has a mega-diverse
natural environment with many unique native animals and plants (Mittermeier et al., 1997;
Mittermeier et al., 2011). Together these characteristics contribute to a strong economy
and high standard of living, including access to a rich natural environment. While the
immediate impact of biosecurity management is to regulate imports to protect Australian
primary industries from unwanted pests and diseases, it also directly underpins export
market access and the quality of the environment.
Consistent with its international obligations under the World Trade Organization, Australia
has defined its tolerance to biosecurity risk, or its appropriate level of protection (ALOP), as
being very low but not zero. This definition is included in the Biosecurity Act 2015 and has
been reached with the agreement of all states and territories. It recognises that a zero-risk
stance is impractical because it would mean that Australia would have no tourists, no
international travel and no imports. It also ignores the potential for pests and diseases to be
introduced through natural processes such as wind. Australia’s biosecurity risk management
measures established in import risk analyses are designed to achieve the broad objective of
ALOP.
2.2 Principles of the national biosecurity system
There are a number of principles that underpin the operation of the national biosecurity
system that are outlined in the IGAB. These are that:
• biosecurity is a shared responsibility between all participants in the system, including
governments; industry; natural resource managers, custodians or users; and the
community;
• the attainment of zero biosecurity risk is impossible in practical terms;
• the biosecurity continuum is managed to minimise the likelihood of biosecurity
incidents and to minimise their impacts;
11
• the biosecurity continuum is managed through a nationally integrated system that
recognises and defines the roles and responsibilities of all sectors and sets out
cooperative activities;
• activity in the system is undertaken and investment is allocated on a cost-effective,
science based and risk management approach that prioritises the allocation of
resources to the areas of greatest return;
• relevant parties contribute to the cost of biosecurity activities, with governments
contributing in proportion to the public good accruing from those activities;
• governments, industry and other relevant parties are involved in decision-making
according to their roles, responsibilities and contributions; and
• Australia’s national biosecurity arrangements comply with its international rights and
obligations.
These principles provide a guiding framework for the operation of the biosecurity system
and strengthen the collaborative approach between the Australian, state and territory
governments and other participants.
2.3 Participants in the biosecurity system – a partnership approach
Given the broad ranging objectives of the national biosecurity system, encompassing
economic, environmental and social dimensions, there are many participants. These are,
principally, the Australian government, state, territory and local governments, industry
representative groups, land holders and producers, research providers, relevant non-
government organisations (NGOs) and the general community. Each of these has different
roles and, in some cases, formal responsibilities. While these can be articulated individually,
it is the cooperation and relationships between these participants that underpin the
national biosecurity system. The shared responsibility or partnership approach articulated in
the IGAB is fundamental to the effective performance of the system.
Governments, as regulators, have prime responsibility for the development,
implementation, monitoring and enforcement of the system (Beale et al., 2008). The
Australian government is responsible largely for the pre-border and border elements of the
biosecurity system. It also conducts some specific post-border activities such as the
Northern Australia Quarantine Strategy (NAQS) and shares funding with the states and
industry for other pest and disease control and surveillance programs, including those
conducted through Animal Health Australia and Plant Health Australia.
State and territory governments are responsible for animal and plant health within their
jurisdictions, and participate with the Australian government and industry to coordinate
national programs. They share enforcement activities with the Commonwealth. There are
formal institutional arrangements under the National Biosecurity Committee (NBC) and its
subcommittees that provide a forum for Commonwealth and state and territory
collaboration and decision making on priority biosecurity issues (see Box 1).
12
Local governments provide biosecurity-relevant services, including controls on domestic and
feral animals, weeds and wildlife, and are essential participants in emergency responses to
pest and disease incursions (Beale et al., 2008). In some jurisdictions, local governments
may have a regulatory role to direct landholders to control noxious weeds.
Farmers and industry groups manage biosecurity within their areas of operation, including
developing biosecurity plans and adopting measures that reduce biosecurity risk. Animal
Health Australia and Plant Health Australia are important partnerships between industry
and governments that work to achieve biosecurity outcomes through a range of projects
and programs (see Box 2).
Other businesses and individuals participate in the biosecurity system. These include those
directly engaged in biosecurity activities, such as those involved in importing goods to
Australia, including importers, customs brokers, freight forwarders, managers of facilities
under approved arrangements, retailers and others along the supply chain, as well as those
in ancillary activities such as travel and shipping (Beale et al., 2008). Other community
Box 1: National Biosecurity Committee
The National Biosecurity Committee (NBC) provides advice to the Agriculture Senior Officials’
Committee and the Agriculture Ministers’ Forum on national biosecurity and on progress on
implementing the Intergovernmental Agreement on Biosecurity. The NBC is also responsible for
managing a national, strategic approach to biosecurity threats relating to animal and plant diseases
and pests, marine pests and aquatics, and the impacts of these on agricultural production, the
environment, community well-being and social amenity. A core objective of the committee is to
promote cooperation, coordination, consistency and synergies across and between Australian
governments. The NBC is supported by four sectoral committees (Animal Health Committee, Plant
Health Committee, Marine Pest Sectoral Committee and the Invasive Plants and Animals Committee)
that provide policy, technical and scientific advice on matters affecting their sector. The NBC also
forms expert groups and short-term task specific groups from time to time to provide advice and
deliver key initiatives.
Box 2: Animal Health Australia and Plant Health Australia
Animal Health Australia and Plant Health Australia are not-for-profit companies that facilitate
partnerships between the Commonwealth and state and territory governments and industry. Animal
Health Australia facilitates improvements in Australia’s animal health policy and practice in
partnership with the livestock industries, governments and other stakeholders; builds capacity to
enhance emergency animal disease preparedness; ensures that Australia’s livestock health systems
support productivity, competitive advantages and preferred market access; and contributes to the
protection of human health, the environment and recreational activities (AHA, 2017). The purpose of
Plant Health Australia is for government and industry to have a strong biosecurity partnership that
minimises pest impacts on Australia, enhances market access and contributes to industry and
community sustainability (PHA, 2017a).
13
members and groups, including NGOs, contribute to the biosecurity effort in diverse ways,
including through coordinated or individual passive surveillance activities, and general
awareness raising efforts.
The research community is another essential element of the biosecurity system and
supports Australia’s science based approach to biosecurity risk management. Biosecurity
relevant research is delivered through a range of funding mechanisms and by multiple
providers, including the CSIRO, universities, the Rural Research and Development
Corporations (RDCs), Cooperative Research Centres (CRCs) and government agencies. Many
organisations that are involved in biosecurity risk management, including AHA, PHA, the
Invasive Plants and Animals Committee and Rural RDCs have developed research and
development strategies. The National Biosecurity Committee has endorsed overarching
national biosecurity Research, Development and Extension priorities that are intended to
provide a strategic and unified guide to investment in high priority research activities
(DAWR, 2016c; Craik et al., 2017).
The concept of ‘shared responsibility’ or partnership across the many participants in the
national biosecurity system has underpinned the system for some time and is a core
principle of the IGAB. However, as the recent review of the IGAB identifies, the roles and
responsibilities of participants in the national biosecurity system are not well articulated and
have not been agreed formally. This limits the broad understanding and effectiveness of the
‘shared responsibility’ concept (Craik et al., 2017).
2.4 Resourcing the national biosecurity system
A diverse range of inputs is required to ensure the effective and efficient operation of the
national biosecurity system. In financial terms, the system represents a significant
investment by participants with expenditure totalling nearly $1 billion in 2015-16. The
Australian government currently spends approximately $624 million a year on its biosecurity
responsibilities. States and territories collectively spend in the order of $375 million each
year. Of these amounts, industry participants contribute levies on production and fee for
service payments of approximately $575 million. Industry, landholders and community
groups also make substantial in-kind contributions (Craik et al. 2017).
The most important element of resourcing in the biosecurity system is the human resource,
encompassing both the number, or capacity, of people who work within the system and
their capability. A diverse range of skills is required to ensure the effective operation of the
system. These include veterinary and plant sciences, taxonomy, diagnostics, epidemiology,
and entomology. Advanced skills in statistics, data analytics and risk analysis are becoming
increasingly important inputs to effective biosecurity risk management. The human
resources in the biosecurity system also include government officers who perform policy,
management and operational functions, in offices and in the field. Also critical are the skills
of those participants in the system that provide in-kind support such as producers who
manage on-farm biosecurity and community groups that undertake and report on passive
14
surveillance activities. Skills shortages in some key science-based areas are an emerging
concern in the biosecurity system.
There are also extensive physical resources that support the biosecurity system. These
include inspection facilities at major points of entry to Australia – airports, sea ports and
international mail centres; diagnostic facilities, including laboratories, equipment and
taxonomic collections that support activities at the border and post border; post-entry
quarantine facilities to screen high risk materials before they are cleared for entry to
Australia; and information technology (IT) systems that facilitate the collection,
management and analysis of the significant amounts of data generated by the biosecurity
system. While many of these resources are managed and operated by the Australian and
state and territory governments, industry also contributes physical resources, including
approved premises for quarantine purposes and facilities and IT infrastructure operated by
customs brokers and freight forwarders.
2.5 Biosecurity is a complex system
A characteristic of the biosecurity system is the complex interactions that occur between
different participants at different stages of biosecurity risk management. This reflects the
different relationships that exist between participants at different levels of the system and
the need for a partnership approach to ensure the effective and efficient operation of the
system.
The many components of the biosecurity system are interconnected and interdependent
and can interact with each other in unpredictable ways such that outcomes of the system
cannot necessarily be forecast on the basis of known components. Some interactions are
non-linear in nature so that small changes in inputs, for example surveillance effort, can
have large impacts on outcomes, such as detection of invasive species, and vice versa.
There are also multiple feedback loops in the system that may not be readily apparent (see
Box 3). Consequently, the outcomes of risk management interventions may be highly
dependent on the context in which they are implemented – the same action may lead to
different outcomes in different sets of circumstances.
15
Adding to the complexity of the system is that the external environment is dynamic and
evolving rapidly over time. For example, the recent growth in new channels for trade such
as e-commerce has been swift and has required the implementation of new rules and
practices, including the development of new relationships, to manage the changing
pathways of biosecurity risks. A further complicating factor is increasing incidents of
deliberately non-compliant behaviour by importers, including those who are beneficiaries of
the biosecurity system. Designing systems that incentivise compliant behaviour without
imposing undue efficiency costs on system participants is an ongoing challenge.
The existence of complexity and the lack of precision around the roles and responsibilities of
participants mean that it is difficult to succinctly and clearly define the overall biosecurity
system. However, developing a framework for evaluating the performance or measuring
the value of the system requires an appropriate balance between the detail inherent in the
system and the practical requirements of implementing a meaningful evaluation, or
valuation, framework.
The following draws on the broad outline of the national biosecurity system in the IGAB, as
well as the detailed descriptions contained in the Risk Return Resource Allocation model
developed by the Department of Agriculture and Water Resources. It uses a program logic
model to describe the key inputs to the system, the main activities that are performed and
the outcomes that are derived from the operation of Australia’s biosecurity system. Such a
model allows the many participants in the system to identify where they ‘fit’ and how and
where they contribute to overall system performance. This can be important in encouraging
ownership of performance evaluation processes.
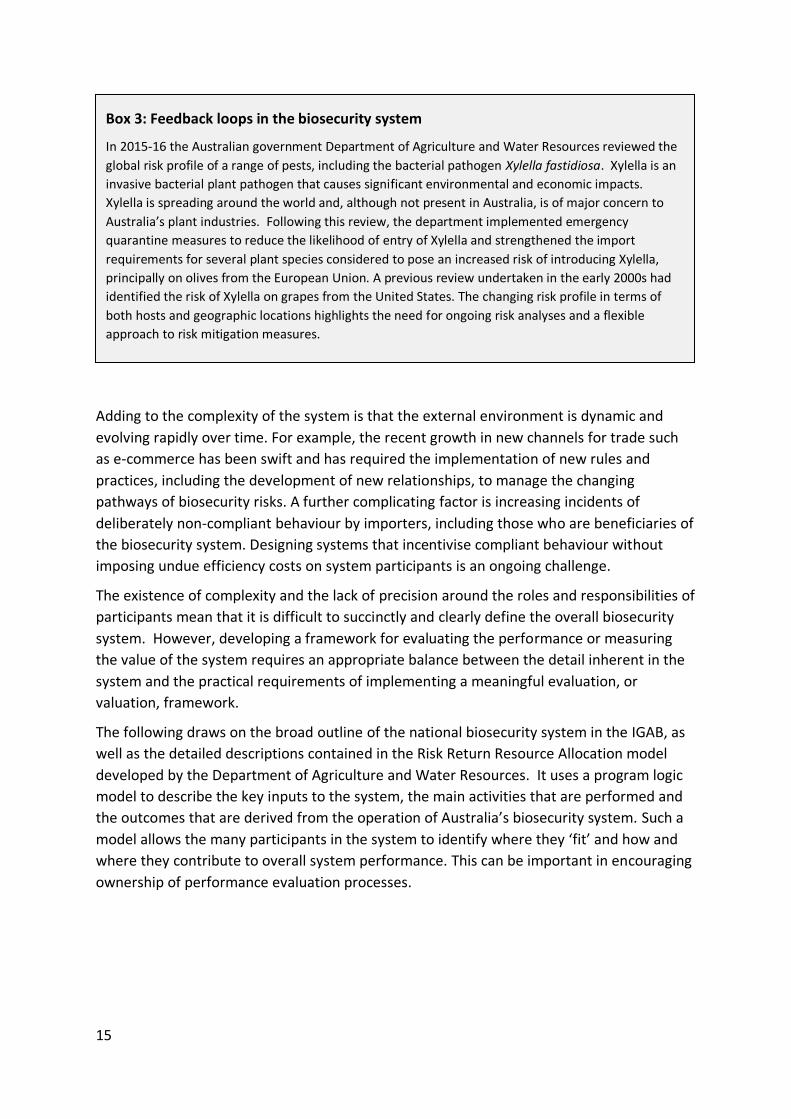
Box 3: Feedback loops in the biosecurity system
In 2015-16 the Australian government Department of Agriculture and Water Resources reviewed the
global risk profile of a range of pests, including the bacterial pathogen Xylella fastidiosa. Xylella is an
invasive bacterial plant pathogen that causes significant environmental and economic impacts.
Xylella is spreading around the world and, although not present in Australia, is of major concern to
Australia’s plant industries. Following this review, the department implemented emergency
quarantine measures to reduce the likelihood of entry of Xylella and strengthened the import
requirements for several plant species considered to pose an increased risk of introducing Xylella,
principally on olives from the European Union. A previous review undertaken in the early 2000s had
identified the risk of Xylella on grapes from the United States. The changing risk profile in terms of
both hosts and geographic locations highlights the need for ongoing risk analyses and a flexible
approach to risk mitigation measures.
16
Figure 1: Program logic diagram outlining the relationships between inputs, activities/outputs and outcomes within Australia's biosecurity system
17
2.6 Activities
The Australian biosecurity system consists of a set of activities that are designed to:
• anticipate biosecurity risk;
• prevent the entry of exotic pests and diseases;
• screen goods, conveyances and people at the border to detect non-compliance;
• prepare for an outbreak or incursion of exotic pests and diseases;
• detect any pest and disease outbreaks or incursions within Australia;
• respond to an incursion of an exotic or established pest or disease; and
• recover from an incursion and adapt to the new circumstances created by an
incursion.
Associated with each of these activities is a range of risk management interventions
undertaken by various participants in the biosecurity system. These are outlined below and
in Figure 1.
Anticipate biosecurity risk
Understanding the context in which Australia’s biosecurity system operates, particularly the
offshore environment, is important because it helps us anticipate biosecurity risk. This helps
us identify the potential biosecurity risks facing Australia. Enhanced anticipation of these
risks increases our capacity to prepare for and manage those risks in a timely and cost
effective manner.
A key activity that contributes to this element of the biosecurity system is environmental
scanning that systematically examines the external environment and detects early signs of
emerging biosecurity risks. Environmental scanning involves understanding trends in global
production, trade and travel and the risks arising from these, including changes in risk
pathways for high risk species. It also includes tracking of global pest and disease spread
and increasing our understanding of the pest and disease status in our near neighbours.
Another activity that enhances our capacity to anticipate biosecurity risk is participation in
intelligence forums that contribute information and assessments of emerging risks. The
Australian government conducts this type of activity across functional areas to identify
changes in the external environment that might lead to changes in risk profiles.
Active surveillance for biosecurity risks in our near neighbours and trading partners is also
designed to enhance our capacity to anticipate risk. Understanding the pest and disease
status in our neighbouring countries contributes to identifying the potential for biosecurity
risks to threaten Australia’s animal and plant health. For example, the Australian
government undertakes regular surveys of animal and plant health in Indonesia, Papua New
Guinea and Timor Leste, in cooperation with the authorities in those countries.
These types of activities – environmental scanning, intelligence forums and offshore
surveillance – generate considerable volumes of data and information. Ensuring that this
translates to robust intelligence that can be used to manage risk effectively requires the
18
capacity to analyse, report and provide timely access to the outputs of these activities to all
relevant participants in the biosecurity system. Although most of the investment in
anticipation activities is undertaken by the Australian government, the intelligence that is
generated is highly valued by state and territory governments, industry and other players in
the system.
Using its understanding of the biosecurity risk context facing Australia, the Australian
government prioritises risks and undertakes biosecurity import risk analyses (BIRAs) or non-
regulated risk analyses (see Box 4). These are designed to assist the Australian government
to consider the level of biosecurity risk associated with the importation of goods into
Australia. If the biosecurity risks exceed the appropriate level of protection, then risk
management measures are proposed to reduce the risks to an acceptable level. If the risks
cannot be reduced to an acceptable level, the goods will not be imported into Australia until
suitable measures are identified (DAWR, 2016a).
The risk measures proposed in import risk analyses must be compliant with Australia’s
international trade and biosecurity obligations and apply Australia’s ALOP in a consistent
manner.
The direct outcomes from the suite of activities that are designed to anticipate the
biosecurity risks facing Australia are that the range and magnitude of risks are identified and
understood, can be prioritised, and then analysed according to their priority. This increases
the capacity to allocate investment across the biosecurity system more efficiently and to
manage risk more effectively.
Prevent entry of risk material
Preventing pests and diseases from entering Australia on goods or conveyances is generally
considered to be the most cost-effective approach to managing biosecurity risk. Along with
anticipation activities, the returns on investment in prevention are believed to be higher
than at other points on the biosecurity continuum (Biosecurity Victoria, 2009, 2010). The
overarching aim of prevention activities is to manage biosecurity risk off shore in order to
prevent threats to Australia’s animal and plant health reaching the border.
Among the activities undertaken to prevent biosecurity threats reaching Australia are
cooperation in international forums such as the World Organisation for Animal Health (OIE),
Box 4: Biosecurity import risk analyses and non-regulated risk analyses
A BIRA is generally undertaken in response to a new import proposal where risk management
measures have not been established or where biosecurity risks could differ significantly from those
associated with the import of similar goods. A BIRA is conducted through a regulated process under
the Biosecurity Act 2015 and Biosecurity Regulations. A non-regulated analysis is undertaken where
the criteria for a BIRA are not met and can include reviews of existing policies or import conditions or
reviews of biosecurity measures in response to new scientific information.
19
the International Plant Protection Convention (IPPC) and Codex Alimentarius to develop
science based standards, guidelines and codes of practice for the safe trade of animal, plant
and food products. Australia has also ratified the International Convention for the Control
and Management of Ships’ Ballast Water and Sediments (the Ballast Water Management
Convention), which came into effect in September 2017 and establishes global regulations
to control the transfer of potentially invasive species. The Biosecurity Act 2015, as amended,
establishes national domestic ballast water requirements that are consistent with the
Convention to reduce the risk of spreading marine pests that establish in Australian seas.
Other international arrangements between governments and importers to agree upon
offshore risk mitigation measures can also be effective mechanisms for managing
biosecurity threats. The Australian Fumigation Accreditation Scheme (AFAS), the
Quarantine Regulators’ Meeting (QRM), the International Cargo Cooperative Biosecurity
Arrangement (ICCBA) and the Sea Container Hygiene Scheme (SHS) are examples of these
mechanisms (Box 5).
A further approach to preventing biosecurity risks arriving at the Australian border is the
development of import protocols that define the conditions under which biosecurity risk
material can be imported to Australia. These conditions are generally based on the BIRAs
and non-regulated import risk analyses undertaken by the Australian government. They are
implemented through the issuing of import permits to individual importers that specify the
conditions under which a commodity is permitted to be imported. In 2015-16, 19,000
import permits were issued by the Australian government (DAWR, 2016b).
The Australian government conducts off-shore audit and verification activities to provide
assurance that import conditions are met and that risks are mitigated prior to arriving at the
border. Periodic audits are undertaken, for example, of pre-export quarantine facilities for
horses and ornamental fish and of approved treatment facilities for imported plant material.
The Australian government also certifies competent authorities in exporting countries to
undertake some pre-export activities. In the case of live animal imports, for example, the
government veterinary service in the country of export will certify that the animal complies
with the requirements described in the import permit.
Box 5: International risk mitigation arrangements
The Australian Fumigation Accreditation Scheme (AFAS) is a management system run by
participating overseas government agencies to ensure compliance of fumigators with Australia’s
treatment requirements as well as a registration system for fumigation companies. The Quarantine
Regulators’ Meeting (QRM) is an annual forum that aims to connect government agencies
responsible for, or involved in, biosecurity and border management. Its focus is to support a
harmonised approach to biosecurity border management relating to cargo. The International Cargo
Cooperative Biosecurity Arrangement (ICCBA) is a voluntary non-binding, multilateral arrangement
that encourages international cooperation on the harmonisation and verification of international
biosecurity activities and processes.
20
An additional measure that reduces the likelihood of risk material arriving at the Australian
border is work undertaken in neighbouring countries to build their capacity to manage
biosecurity risks. The Australian government supports a number of projects in Indonesia,
Papua New Guinea and Timor Leste on issues such as strengthening the capacity of
government veterinary services, enhancing poultry biosecurity, and establishing surveillance
systems that provide early warning of pests and diseases that could potentially enter
Australia. Some state and territory governments and other institutions contribute to this
area of activity.
The intended outcome of this suite of activities is that the majority of biosecurity risks are
managed offshore, leading to a reduction in the number of priority pests and diseases that
arrive at the Australian border.
Screen risk material at the border
Investments by governments and other participants in the biosecurity system to anticipate
and prevent risk material arriving at the border will not be completely effective. This is
consistent with the setting of Australia’s risk tolerance or ALOP to a very low level but not to
zero. As a result, the screening of passengers, cargo, plants, animals and mail at ports and
airports and through mail centres to ensure that they meet import conditions is an
important risk management intervention. The screening of conveyances – vessels and
aircraft – is a further element of the biosecurity system designed to reduce the number of
‘hitchhiker’ pests entering Australia.
The Australian government is largely responsible for activities undertaken at the border.
This includes the assessment of passengers, mail, cargo, vessels, live animals and plant
material for biosecurity risk. Each year, millions of items are assessed at arrival ports (Table
1). Commercial goods are classified before their arrival according to their tariff code as well
as characteristics such as country of origin, supplier and importer. This classification, called
profiling, is used as a screening step to determine if further biosecurity management
intervention, such as inspection, is necessary.
Many imported goods are not of biosecurity concern. For those that are, clearance without
inspection, using declarations and information provided by the importer, is common. Goods
may be released from biosecurity control or directed for further assessment. This could
include inspection, diagnostic testing, and, where a biosecurity concern is identified,
management such as treatment, export or destruction. Some goods that would not typically
be directed for inspection will be randomly selected for inspection as part of the Cargo
Compliance Verification Scheme.
The Department of Agriculture and Water Resources operates an ‘approved arrangements’
system that permits authorised entities to perform certain activities with goods under
biosecurity control without the supervision of biosecurity officers. This involves using their
own premises, facilities, equipment and people and is subject to periodic compliance
monitoring and auditing.

21
Where assessment of goods is required, assessment regimes are designed that are based on
sound science and statistics and targeted at highest priority risks. Inspections rely on
investment in the quality and capacity of inspectorate staff supported by border biosecurity
tools and infrastructure such as x-ray machines, detector dogs, and diagnostic capabilities
that are capable of dealing with increasing passenger and goods volumes.
Goods may be cleared following inspection if they comply with import conditions.
Alternatively, they may be directed for diagnostic testing to identify if biosecurity risk
material is present. This relies on the availability and quality of diagnostic facilities,
including laboratories, tests and trained staff. Following assessment, if the goods pose an
unacceptable biosecurity risk then they may be directed for management, which may
involve treatment such as fumigation, export or destruction to manage biosecurity risks.
In the case of imports of live animals, hatching eggs and plant material, import conditions
require that they be quarantined in Australia’s post arrival quarantine facility, or other
approved facilities, for specified periods of time, where they will be observed and tested to
ensure that they do not present a biosecurity threat on release.
Management at the border also involves a range of measures designed to target, assess and
manage non-commodity risks. These are risks that are not specific to the imported goods
but are facilitated through the movement of goods, people and conveyances. The pests and
diseases in this category are commonly referred to as ‘hitchhikers’ and may be attached to a
container carrying the goods, the packaging around the goods, or the vessel or aircraft. The
types of hitchhikers are varied and can include tramp ants, reptiles, bees, beetles, snails,
other animals and dirt. Programs are in place to manage these risks, including targeting at
the border, and industry and community communication and reporting programs.
The outcome of these activities at the border is a reduction in the number of priority pests
and diseases that enter Australia. Post arrival verification activities such as leakage surveys
are undertaken at the border to estimate the success of these intervention strategies.
Table 1: Size of the import task, selected indicators, 2015-16 (DAWR, 2016d).
Indicator Volume
Passenger clearances 19,000,000
International mail articles 138,000,000
Pratique visits – first ports 18,000
Wharf gate sea container inspections 250,000
Import permits issued 17,000
Live animal imports in Post Entry Quarantine 5,700
22
Collectively, the activities undertaken to anticipate biosecurity risk, prevent risk material
arriving at the Australian border and to screen passengers, cargo, plants, animals and mail at
the border to ensure they comply with import conditions contribute to meeting the first
objective of the IGAB, that is, to ‘reduce the likelihood of exotic pests and diseases, which
have the potential to cause harm to the economy, the environment and the community
(including people, animal and plants), from entering, becoming established and spreading in
Australia’.
Prepare for an incursion
Given Australia’s ALOP, it is not expected that pre-border and border activities will
successfully intercept all threats to Australia’s plant and animal health from exotic pests and
diseases – some biosecurity risk material will inevitably cross the border. Across Australia,
18 outbreaks of pests and diseases were being managed in August 2017 (DAWR, 2017).
Considerable investment is undertaken by a range of participants in the biosecurity system
to ensure that Australia is well prepared to respond to incursions of pests and diseases in
order to minimise the likelihood that they establish in Australia and to reduce or contain the
harmful impacts on the economy, the environment and the community caused by those
that do.
A major set of activities that helps participants in the biosecurity system prepare for an
incursion of a potentially harmful exotic pest or disease is the development and
maintenance of emergency response deeds and agreements and contingency plans. These
define the nationally agreed approach that will be taken in an incursion response so that
participants are able to respond quickly and effectively when one occurs.
Animal Health Australia is custodian of the Emergency Animal Disease Response Agreement
(EADRA) and the Australian Veterinary Emergency Plan, or AUSVETPLAN. The EADRA is a
contractual agreement between the Commonwealth, state and territory governments and
livestock industry groups to increase Australia’s capacity to prepare for and respond to
emergency animal disease incursions. In particular, it defines how to manage the costs and
responsibility for an emergency response to an animal disease outbreak. For all EADs listed
in EADRA, there is an agreed initial approach to responding to an outbreak set out in
AUSVETPLAN. AUSVETPLAN consists of a series of technical manuals and supporting
documents that describe the proposed approach to an emergency animal disease incident,
including roles, responsibilities and policy guidelines for agencies and organisations involved
in the response to a disease outbreak (PIMC, 2008).
The equivalent arrangements for emergency plant pest incidents are the Emergency Plant
Pest Response Deed (EPPRD) and PLANTPLAN, both of which are managed by Plant Health
Australia (PHA, 2016, 2017b).
EMPPLAN and AQUAVETPLAN set out the preferred approach to diseases that affect marine
and aquatic animals, respectively. The Department of Agriculture and Water Resources
manages the development and maintenance of both plans.
23
The National Environmental Biosecurity Response Agreement (NEBRA) sets out emergency
response arrangements, including cost sharing arrangements, for responses to biosecurity
incidents that primarily affect the environment and/or social amenity and where the
response is for the public good. It was delivered under the IGAB.
As well as formal agreements and contingency plans, training activities are used to help
participants in the biosecurity system maintain their readiness for a response to an incursion
of an emergency pest or disease. This includes emergency response simulation exercises
that test the capacity of the biosecurity system to respond. Exercise Odysseus, for example,
was a series of more than 40 simulated field activities and discussions in each Australian
state and territory held throughout 2014 and 2015. It was designed to focus on the first
week of a hypothetical outbreak of foot and mouth disease initially detected in Queensland.
Exercise Haryana was conducted in 2015 and 2016 to test the preparedness for, and
capacity to respond to a Karnal bunt detection in Australia. Simulation exercises typically
involve government and industry representatives.
Other activities to prepare for an emergency animal disease (EAD) incursion include training
for government officers, private veterinary practitioners and livestock industry managers in
emergency response functions; the development of national scale modelling capability to
capture complex disease epidemiology, regional variability in transmission, and different
jurisdictional approaches to disease control; and membership in the International Animal
Health Emergency reserve, an arrangement between Australia, Canada, Ireland, New
Zealand, the United Kingdom and the United States to share personnel and resources in an
EAD outbreak (AHA, 2017).
Good on-farm biosecurity practices can be a powerful means of reducing the risk that an
exotic pest or disease present in Australia can establish and spread. While good farm
biosecurity is the responsibility of land owners and managers, training programs are
important for raising awareness and disseminating information about good practices. The
Farm Biosecurity Program is a joint initiative of Animal Health Australia and Plant Health
Australia that provides information and on-line resources on a range of farm level
biosecurity issues.
The intended outcome of activities that increase our preparedness for an emergency pest or
disease incursion is that participants in the biosecurity system are ready to respond to new
incursions, with the appropriate arrangements, tools and training to maximise the
effectiveness of the response action. In this way, the potential harm from newly detected
pests and diseases is minimised.
Detect an incursion post border
Early detection of an exotic pest or disease incursion can significantly improve the outcomes
of response activities. Targeted, or active, and general surveillance programs to ensure
timely detection of pests and diseases are important components of the biosecurity system.
Effective surveillance requires cooperative partnerships between the Australian and state
and territory governments, industry and the community and is part of the shared

24
responsibility concept described in the IGAB. The Australian government is responsible for
reporting surveillance outcomes to the OIE and the IPPC. State and territory governments
run many surveillance programs targeting exotic pests and diseases, as well as extensive
general surveillance activities. By underpinning Australia’s claims to pest and disease
freedom, surveillance activities facilitate access to international markets, as well as
supporting the management of established pests and diseases.
In 2016, the Animal Health Committee endorsed the National Animal Health Surveillance
and Diagnostics Business Plan 2016-2019 (DAWR, 2016d), developed collaboratively by the
Australian, state and territory governments and livestock industries. Under this business
plan, Animal Health Australia coordinates several active or targeted surveillance programs,
including the National Arbovirus Monitoring Program, the National Sheep Health Monitoring
Program, the National Transmissible Spongiform Encephalopathies Surveillance Project and
the Screw-worm Fly Freedom Assurance Program. Other programs use targeted and
general surveillance activities to provide early detection of diseases, including the National
Significant Disease Investigation Program and the National Avian Influenza in Wild Birds
Surveillance Program (Box 6).
Surveillance activities are undertaken by jurisdictional veterinary authorities, private
practitioners, industries and non-government organisations under a range of partnership
agreements. Collectively, state and territory governments invest in more than 100 field
veterinarians with district surveillance responsibilities, supported by seven government
veterinary laboratories, veterinary pathology staff, abattoir veterinarians and inspectors and
stock inspectors (Craik et al., 2017) .
In addition, the Australian Government funds the Northern Australia Quarantine Strategy
(NAQS), which undertakes surveillance for targeted animal diseases in coastal areas of
northern Australia from Broome to Cairns.
Plant pest surveillance activities are, similarly, undertaken on a collaborative basis between
the Australian, state and territory governments, industry and the community. Current
surveillance activities are outlined in the National Plant Biosecurity Surveillance Strategy
2013-2020 (PHA, 2013). They include the National Plant Health Surveillance Program
Box 6: National Avian Influenza in Wild Birds Surveillance Program
The National Avian Influenza in Wild Birds Surveillance Program is conducted Australia-wide and
comprises two components: targeted surveillance via sampling of apparently healthy and hunter-
killed birds, and general surveillance via investigation of significant unexplained morbidity and
mortality events in wild birds, including captive and wild birds within zoo grounds. Sources for
targeted wild bird surveillance data include state and territory government laboratories, universities
and samples collected through the NAQS program. Samples from sick birds are sourced from
members of the public, private practitioners, universities, zoos and wildlife sanctuaries. The program
is managed by Wildlife Health Australia.
25
(NPHSP) coordinated by the Australian Department of Agriculture and Water Resources.
The objective of the NPHSP is to ‘develop and implement a nationally consistent, multi-
jurisdictional approach to plant pest surveillance that incorporates pest surveillance
activities in the vicinity of ports as well as in urban areas that have a relatively high risk of
pest presence based on pathway and host considerations’ (PHA, 2013). Its three main
components are ports of entry trapping, multiple pest surveillance and surveillance
information management. The Australian government also undertakes surveillance for
plant pests through the NAQS program.
State and territory governments run a number of surveillance programs targeting a range of
exotic and established plant pests. General surveillance is also used, involving the
development and dissemination of awareness information relating to pest threats, as well
as maintaining systems for public reporting. Agricultural participants also invest in
surveillance, either directly or through the purchase of services from private or government
providers, primarily to manage established pests on an ongoing basis (PHA, 2013).
Early detection of exotic incursions also relies on having sound diagnostic capability and
capacity available to support identification of pests and diseases. Diagnostic services (i)
underpin the identification of exotic, emerging and nationally significant endemic pests and
diseases; (ii) assist in assessing the magnitude of an incursion, which helps determine
whether a pest or disease is eradicable; and (iii) provide evidence to support any claim that
a pest or disease has been eradicated. They provide the necessary information to support
pest and disease control programs and reporting requirements (Craik et al., 2017).
Australia’s animal disease diagnostic capacity is well developed. Facilities include the
Australian Animal Health Laboratory, state and territory government veterinary laboratories
and university and private veterinary laboratories. Institutional arrangements support the
effective operation of the laboratory system. For example, the Laboratories for Emergency
Animal Disease Diagnosis and Response (LEADDR) network plays an important role in
ensuring quality assurance for targeted emergency animal diseases through standardising or
harmonising the relevant testing performance in all member laboratories. All government
laboratories and the major private laboratories in Australia are accredited by the National
Association of Testing Authorities (NATA) for testing of various emergency animal diseases.
Plant pest diagnostic facilities are distributed across all states and territories, including in
major agricultural and horticultural regions. Services are delivered by a range of agencies,
including the Australian government, state and territory governments, private laboratories,
museums, the CSIRO and universities. Services are provided on an ad hoc, commercial or
nationally coordinated basis. Diagnostic operations are often performed as part of
collaborative research activities that focus on specific pests of concern (PHA, 2017a).
The Subcommittee on Plant Health Diagnostics was established in 2004 by the Plant Health
Committee to improve the quality and reliability of plant diagnostics in Australia. Its role
includes to develop diagnostic policies, protocols and standards; to develop strategies to
address national capability and capacity issues; to endorse national diagnostic protocols;
and to drive the development and uptake of accreditation and quality management systems
26
for diagnostic laboratories. Unlike the animal system, not all plant diagnostic laboratories
are accredited by NATA to the appropriate international standard. The plant pest diagnostic
system is underpinned by the National Plant Biosecurity Diagnostic Strategy (PHA, 2012) and
a national network of diagnosticians. The latter improves capacity by facilitating
communication between experts and sharing of diagnostic resources. Together these
initiatives are designed to build an integrated national network that can provide efficient
delivery of services, including the provision of surge capacity during incursions (PHA, 2017a).
Not all exotic pest and disease incursions are initially identified at source. A diseased
animal, for example, might have been moved from its property before identification occurs
at a saleyard or abattoir, or an infected plant might have been sold from an importer to a
retail chain before detection occurs. The capacity to trace the source of an incursion is an
important part of the detection element of the biosecurity system.
Animal traceability systems in Australia are well developed under the National Livestock
Identification System (NLIS). The NLIS was developed to meet the National Livestock
Traceability Performance Standards (NLTPS) endorsed in 2004 by the former Primary
Industries Ministerial Council (PIMC). The NLTPS outline the requirements and timeframes
for livestock to be traced quickly and reliably if needed (ABARES, 2014).
Under the NLIS all cattle, goat, pig and sheep producers must identify their stock and record
their movements onto and off properties in the NLIS database. All movements to and from
saleyards and abattoirs must also be recorded. When fully implemented for a type of
livestock, NLIS is a permanent, whole-of-life system that allows animals to be identified –
individually or by mob – and tracked from property of birth to slaughter, for the purposes of
food safety, product integrity and market access (AHA, 2017). Box 7 summarises the status
of animal traceability systems in Australia.
State and territory governments are responsible for the legislation governing animal
movements, the implementation of NLIS and monitoring of compliance with NLIS
requirements throughout the livestock supply chain. NLIS Limited administers the NLIS
database on behalf of industry and government stakeholders (AHA, 2017).
Tracing the source of a plant pest incursion is a more ad-hoc process than occurs in the
animal system, partly because plant pests move independently of their hosts. Hence there
is no feasible equivalent of the NLIS and tracing activities are conducted on a case-by-case
Box 7: Status of national animal traceability systems
NLIS (Cattle) is an electronic identification system for individual animals. NLIS (Sheep and Goats) is a
mob-based system using visually readable ear tags labelled with property identification codes.
Victoria is currently transitioning to an individual electronic identification system for sheep and goats.
Australian Pork Limited is continuing to develop NLIS (Pigs), or PigPass, and voluntary movement
reporting occurs through the PigPass portal. The development of legislation for NLIS (Pigs) is
progressing. An NLIS (Alpaca and Llama) tracing system is also under development (AHA, 2017).
27
basis. An incursion of Mexican feather grass in Victoria in 2008 is an example of the types of
actions undertaken to trace an incursion back to its source (see Box 8). The capacity to
implement a successful tracing exercise in these circumstances relies on sound relationships
between participants in the biosecurity system, the willingness of all participants to
contribute to the tracing effort and effective communication.
The intended outcome of the surveillance activities, the provision of sound diagnostic
services and the capacity to trace an incursion to its source is that the time taken to detect
incursions of priority pests and diseases is reduced. This contributes to minimising the costs
of response activities and maximising the effectiveness of eradication or containment
efforts.
Respond to an incursion
Following the detection of an exotic pest or disease, response actions are implemented
collaboratively between governments, industry and other stakeholders. Broad response
actions are outlined in the response agreements and contingency plans discussed above –
EADRA and AUSVETPLAN; EPPRD and PLANTPLAN; and EMPPLAN and AQUAVETPLAN, and
NEBRA. These are supported by detailed industry specific or pest/disease specific response
plans. The agreements and plans are designed to ensure rapid and effective responses to
detections and to provide certainty regarding the management and funding of the response.
Coordination of response activities is enhanced by the use of established management
groups and consultative committees. The National Management Group (NMG) is
responsible for making the key decisions in a response to an emergency pest or disease
incursion. It is formed in response to a detection and comprises representatives from the
Australian and state and territory governments, AHA/PHA, and affected industries. The
NMG is responsible for approving a response plan, including the budget, if it is agreed that
eradication is technically feasible and cost beneficial. The NMG is advised on technical
matters by the relevant Consultative Committee (CC). The CC comprises the Australian
Chief Plant Protection Officer/Chief Veterinary Officer, their state and territory
counterparts, AHA/PHA, and industry representatives. It assesses the grounds for
eradication and provides technical advice on which the NMG can base decisions.
Box 8: Tracing of a Mexican feather grass incursion in Victoria, May 2008
Following a detection of Mexican feather grass in a large retail chain, tracing was conducted by the
state government back along the supply chain to the seed importer and forward through distribution
channels to discover more than 10,000 plants for sale in Victorian retail outlets. Statewide product
recalls were initiated, instructing retail chains to recover as many plants as possible. Sales
information, including credit card transactions, was used to help assess where plants had been
planted. New building-permit information from local governments provided locations for targeted
public awareness campaigns. Community weed spotters were alerted to support the surveillance
effort. Source: Biosecurity Victoria (2009)
28
Operational responsibility for the response to an emergency incursion lies with the relevant
state or territory.
Once a detection has been advised to a government party, the deeds require that the
relevant government advises the CC within 24 hours. There follow sequential phases of
response activities, as outlined in the relevant deeds. These are:
i) The incident definition phase where an initial investigation is undertaken by the
relevant government authority. On the basis of a pest risk analysis, the CC
advises the NMG if the incident relates to an emergency incursion and is capable
of being eradicated or contained. In this case, an emergency response plan (ERP)
is agreed by the NMG;
ii) The emergency response phase during which the ERP is implemented. The
control measures used may evolve as new information about the outbreak
becomes available. This phase continues until the NMG, on advice from the CC,
determines that the incursion has been contained or eradicated, or cannot be
contained or eradicated.
iii) The proof of freedom phase following a declaration by the NMG that an outbreak
has been contained or eradicated. This period may include research and/or
surveillance activities and will end when the NMG determines that the ERP has
been successful.
iv) In the case of plant pests, where containment or eradication is not feasible, a
transition to management phase may be determined by the NMG where it
considers that transition to management is achievable within a reasonable
timeframe not exceeding 12 months.
In the small number of cases where an exotic pest or disease incursion affects an industry
that is not covered by a deed, the state or territory where the outbreak occurs is responsible
for the response plan and the negotiation of funding arrangements. Currently, more than 90
per cent of the value of Australia’s agricultural production is covered by the relevant deeds.
Having mechanisms in place that support rapid and effective responses to pest and disease
incursions, including decisions about eradication and containment, ensures that the number
of priority pests and diseases that establish and spread in Australia is reduced.
Collectively, the activities undertaken to prepare for an incursion, detect an incursion post-
border and respond to an incursion once detected contribute to meeting the second
objective of the IGAB, that is, to ‘prepare and allow for effective response to, and
management of, exotic and emerging pests and diseases that enter, establish or spread in
Australia’.
Recover and/or Adapt to an incursion
A number of activities undertaken as part of the biosecurity system are designed to reduce
the ongoing impacts of introduced pests or diseases on the environment, the economy and
the community. These can be short term actions that occur immediately after an incursion
as part of the recovery strategy or they may become long term activities that help the
29
system adapt to changed circumstances. These activities are undertaken by a range of
participants, including the Australian, state and territory governments, producers and
industry and community groups.
Following pest or disease eradication or containment efforts, there is generally a need to
provide evidence of success in order to underpin future interstate or international trade.
Area freedom claims are based on surveillance activities and surveys that may be
undertaken for a specific time or may become ongoing activities. Re-opening of
international markets is a particularly important recovery strategy for trade dependent
industries and requires certification by the Australian Department of Agriculture and Water
Resources to verify that goods for export meet importing country requirements.
Part of the process of recovering from a pest or disease incursion is the provision of
information and support to affected parties to facilitate their financial and non-financial
recovery. These activities are provided by a range of participants in the biosecurity system
and can be subject to agreements already in place, for example under the EADRA and the
EPPRD.
Not all pests and diseases that enter Australia will be successfully eradicated. This might
occur because the pest or disease was not detected sufficiently early or because it is
technically infeasible to eradicate. Containment of pests and diseases to specific areas or
regions can be used to minimise their negative impacts. In the case of plants, pests can be
contained at a local, regional or state level, depending on their current distribution and the
ability to implement cost beneficial measures for containment (PHA, 2017a). Domestic
quarantine and movement restrictions on high risk material that are implemented under
state and territory legislation are used to limit the spread of pests nationally. Interstate
certification systems exist to govern the movement of plant products under the quarantine
regulations in each state and territory.
In some cases, long-term management strategies will be implemented that seek to reduce
the adverse impacts of the pest or disease. These plans might include changes in regional or
local biosecurity practices to reduce the chance of a pest or disease spreading. The (Draft)
National Fruit Fly Strategy is an example of a coordinated approach to managing the impacts
of endemic fruit fly species on productivity and market access through the strategic use of
containment, exclusion and other local management practices (PHA, 2008)
The biosecurity system also comprises a range of long term activities that are designed to
ensure that those pests and diseases that have established and spread following incursions
that occurred sometime in the past are managed effectively. These include community led
programmes that coordinate action targeting established weeds, such as serrated tussock,
where collective action has a social benefit (for example, the Serrated Tussock Working
Party).
A substantial proportion of the activity that occurs at the state and territory level – up to 60
per cent – is directed at ensuring that relevant participants in the biosecurity system comply
with jurisdictional biosecurity regulations. One common example is the targeting of
30
enforcement activities at landowners who fail to control noxious weeds on their property.
These activities are often delivered in conjunction with local community led programs and
are another example of ‘shared responsibility'.
Part of recovering from and adapting to pest or disease incursions is evaluating outcomes of
emergency response activities, including eradication and containment actions. Evaluation
processes are used to update response tools, plans and procedures and to encourage the
application of best practice across biosecurity sectors nationally.
The cumulative impact of activities in the national biosecurity system to recover from and
adapt to incursions is that the realised impact on the economy, environment and
community of pests and diseases that establish and spread in Australia is reduced and that
disruptions to international market access are minimised. This contributes directly to
meeting the third IGAB objective to ‘ensure that, where appropriate, significant pests and
diseases already in Australia are contained, suppressed or otherwise managed’.
2.7 Influencers and Enablers
In addition to the specific elements of the biosecurity system outlined above, there are
activities undertaken as part of the system that are fundamental to its performance and the
value it creates. These enablers and influencers underpin some, or all, of the biosecurity
system’s elements.
A key characteristic of the biosecurity system that underpins its performance at the national
level is the shared responsibility or partnerships approach that strengthens relationships
between its participants. While a somewhat abstract concept, it reflects the fact that the
national biosecurity system does not exist as a single physical or legal entity (Craik et al.
2017) but is built on a complex set of relationships and interactions that link multiple
participants. It is the effective cooperation and collaboration between these participants
that helps ensure that the biosecurity system is more than the sum of its individual
elements.
Governance arrangements define how each participant in the system will behave, including
the relationships between participants. At the highest level, each jurisdiction has
implemented biosecurity legislation that provides the overarching framework for the
operation of the system. Key inter-governmental governance arrangements in the national
biosecurity system are the IGAB and the National Biosecurity Committee and its sub-
committees and working groups. These arrangements support the development of national
policy on key biosecurity issues. Other important governance settings are provided in the
emergency response deeds managed by Animal Health Australia, Plant Health Australia and
the Department of Agriculture and Water Resources.
Because of the significant investment required to operate the biosecurity system, funding
arrangements are important to the sustainability of each of its elements, as is ensuring the
optimal allocation of resources across the system. This is particularly the case given the
ongoing financial challenges faced by governments at all levels. The IGAB outlines principles
31
for the funding of biosecurity activities and the prioritisation of resources to the areas of
highest return. However, existing financial arrangements are complex and multi-faceted,
and in some cases lack transparency (Craik et al., 2017).
An effective biosecurity system requires a high level of skill and experience from its staff
across all levels and areas of operation. A sustainable supply of relevant skills requires
ongoing capability development, delivered through the general education system, specialist
training and on-the-job experience.
Also critical to operations across the entire biosecurity system is the capacity for
information management and analysis. Ready access to comprehensive and reliable data
and information is essential for anticipating, responding to and managing national
biosecurity risks, substantiating Australia’s claims to pest and disease free status, and for
decision making, policy development, and performance measurement (Craik et al., 2017). All
jurisdictions, industries and relevant NGOs hold data of relevance to the national biosecurity
system but these data holdings cannot easily be integrated to derive maximum benefit.
Agreed data standards and formats are generally lacking as are interoperable technology
platforms. However, recent developments across jurisdictions are addressing these issues.
For example, the Victorian government’s MAX system, which is designed to collect, manage
and report data, is being used by five other jurisdictions for routine and emergency
biosecurity activities. Plant Health Australia’s AUSPestCheck is capable of providing and
receiving national surveillance information on weeds and plant pests from a wide range of
stakeholders. And the Australian government is investing significantly in sophisticated data
capture, use and analysis through its Biosecurity Integrated Information System Analytics
program (BIISA).
Because Australia’s biosecurity system is based on sound science, research and innovation is
a critical element that enables technological solutions to be delivered to biosecurity
problems and helps drive down the cost of many biosecurity operations. Biosecurity
relevant research and innovation is funded principally by the Australian and state and
territory governments, the Rural Research and Development Corporations (RDCs) and
Cooperative Research Centres (CRCs). The latter two of these receive funding from both
government and industry, although from June 2018 there will be no biosecurity relevant
CRCs. Research is delivered by multiple providers, including the CSIRO, universities, state
and territory research agencies and private consultants.
The allocation of investment in research and innovation is guided by several strategies that
are framed within the national research priorities outlined in the National Science and
Research Priorities and the National Rural R&D priorities. These include the Animal
Biosecurity RD&E Strategy and the Plant Biosecurity RD&E Strategy that have been
developed under the IGAB and the Invasive Plants and Animals Research and Development
Strategy. There are also a few industry specific research and innovation strategies. In July
2017, the National Biosecurity Committee endorsed overarching national biosecurity
Research, Development and Extension priorities that are intended to provide a strategic and
unified guide to investment in high priority research activities (DAWR, 2016c).
32
Because of the many participants in the biosecurity system, the complex nature of their
interactions, and the rapidly evolving nature of the system effective communications and
engagement are important to achieve outcomes. Communication encompasses general
strategies to inform and educate those who play a direct role in the biosecurity system such
as producers and other landholders, as well as more peripheral participants such as
travellers, traders and port workers. Communication between governments and industry is
critical in an emergency response situation and can be central to building community
resilience in the period following an outbreak.
There are numerous effective communication mechanisms are in place in the Australian
biosecurity system that facilitate communication at different levels. These include the Farm
Biosecurity program operated by AHA and PHA to raise awareness of producers about on-
farm biosecurity and prevention of animal diseases and plant pests. It uses many channels
to communicate its messages about biosecurity, including electronic media, educational
materials and direct stakeholder engagement. DAWR coordinates an annual Biosecurity
Roundtable that provides biosecurity stakeholders and government agencies with a forum
to exchange perspectives on priority biosecurity issues. DAWR also has a dedicated
communications section that coordinates communication between governments and
industry during biosecurity incidents. The Biosecurity Incident National Communication
Network produces nationally consistent public information in response to pest and disease
outbreaks. It has members from the Australian and state and territory governments and
from Animal Health Australia and Plant Health Australia. DAWR also produces a bi-monthly
newsletter, Biosecurity Matters, as well as brochures on travel, biosecurity and citizens’
awareness.
A further important element of the biosecurity system is the capacity to undertake
monitoring and evaluation of its performance. This provides a basis on which all
participants can identify what improvements in investment allocation can be made, either
individually or on a collective, system-wide basis. Evaluation of components of the national
biosecurity system occurs on a regular basis. The Australian and state and territory
governments, for example, articulate performance measures in corporate plans, strategy
documents and annual reports, though their coverage and sophistication vary widely (Craik
et al., 2017). Jurisdictional auditors-general undertake reviews of aspects of the biosecurity
system from time to time and have been influential in driving system reform in some
jurisdictions. However, there is no current framework for monitoring or evaluating the
performance of the biosecurity system at the national level. This gap has been identified by
the review into the IGAB, which notes that it is not possible to ‘roll up’ individual
jurisdictional performance measures to capture the national system and assess national
performance (Craik et al., 2017).
33
3 How have others evaluated complex systems?
The interim report for this project was delivered in January 2017 and provided a
comprehensive overview of the peer-reviewed literature relating to the evaluation of the
performance or ‘health’ of complex systems. The learnings from that review that are of
direct relevance to this project are summarised here. (For the interim report and
bibliography see CEBRA Project 1607B Deliverable 3). Following the delivery of the interim
report, CEBRA contracted ABARES to undertake a further and more detailed review of the
experience of Australian and international governments in evaluating complex systems. This
included reviews of performance evaluation approaches in the health, education and
defence sectors. CEBRA contributed to this review by examining the Department of
Finance’s guidance for performance evaluation in Commonwealth agencies, as well as
performance evaluation frameworks in New Zealand’s health, education, defence and
primary industries sectors. This review of the ‘grey’ literature is also summarised below and
is attached in full at appendix A.
3.1 Approaches to evaluating the performance of complex systems
The peer reviewed literature on performance evaluation methods and frameworks is
extensive and a diverse set of evaluation frameworks is reported. Evaluations can be
conducted at different levels of a system (system-wide, sub-system, individual action); in
different time frames (annual, decadal); at different geographical scales (regional, national,
international). They can be conducted at different stages (ex-ante, interim, ex-post); by
various sources of expertise (internal, external, mixed); and for different purposes (to
evaluate only, or to evaluate, learn and improve).
Two alternative frameworks for evaluation are those that focus on outcomes or results,
known as summative evaluation, and those that focus on the processes of a system, or
formative evaluation. Summative evaluations are mainly performed when an action has
been completed or when it has matured to the point of impact. The approach focuses on
evaluation as the endpoint, with less consideration of what could be learned or how the
system could be improved. Formative evaluations are generally ongoing and focus on
regularly evaluating the processes of the system. These evaluations often allow for systems
to be updated and improved over time.
The complexity of a system has particular implications for the level at which evaluation
should be conducted – single action, program, or whole of system – and for the timeframe
of the evaluation – short-term or long-term. Glouberman and Zimmerman (2002)
distinguish between simple, complicated, and complex systems. A simple system usually
comprises a single action; complicated systems typically include multiple actions but
respond in predictable ways; and complex systems have multiple components but may
respond unpredictably.
While there is no universally accepted definition of complexity, the following have been
proposed as characteristics of a complex system (Ladyman et al., 2013):
34
• contains many components
• exhibits emergent behaviour such that the outcome of a system cannot be readily
predicted based on known components
• contains some degree of spontaneous order, or self-organisation, and robustness of
order, which allows it to withstand failures and perturbations
• contains non-linearity of interactions, such that small inputs may have large effects
and vice versa
• contains interacting components
• contains feedback loops, and mechanisms of self-regulation
• exhibits context dependency, where outcomes of similar components vary from one
context to another.
In a simple system, the appropriate scale of evaluation is the individual action. If several
measures of health are used, then they can typically be summed together or averaged to
evaluate system health (for example Almahmoud et al., 2012; Gupta & Dokania, 2014;
Blondeau et al., 2015; Wu et al., 2016). A similar approach can be taken for complicated
systems, except that indicators are used to measure performance of multiple actions (for
example EC Directorate-General for Regional and Urban Policy, 2013; Agriculture and Agri-
Food Canada, 2015; European Commission, 2015a; Canada Border Services Agency, 2016).
In both simple and complicated systems, it is often possible to evaluate health over
relatively short time frames because the causal relationships between the components are
simple and behave consistently over time.
In contrast, it is not sufficient to understand the behaviour of isolated components in
complex systems and then aggregate these to measure system health. This is because
complex systems often contain interactions between components of the system and exhibit
non-linearity and emergent behaviour (Shiell et al., 2008; Walton, 2014), which can result in
unexpected outcomes at varying time scales. Therefore, evaluation procedures for complex
systems typically require identifying all interactions that may exist within a system, between
components within a system, and between the system and its context.
A practical consequence of this is that most evaluation procedures for complex systems are
conducted at multiple levels of a system, for example individual actions and whole-of-
system; in multiple contexts; and over long time frames to ensure that any possible
emergent behaviour is detected.
A key challenge with system wide and/or long-term evaluations of complex systems is the
difficulty in establishing causality between the outcome and changes in the system
components. As highlighted by Liu et al. (2014), the strength of inferred causal relationships
decreases with: (i) the scale of the evaluation (i.e., from action to system); and (ii) the time
between implementation and evaluation of an action/system. This is a particular issue for
complex systems, which can involve multi-scale evaluations and long evaluation time
frames. For example, in trying to measure the effect of increasing the proportion of
shipment containers screened on the number of insect pest establishments over a 20-year
period it would be important to determine whether decreases in pest establishments were
35
the outcome of increases in screening or the result of changes in weather conditions, import
regulations or the origin of shipments over that period.
There are various tools to aid in evaluating the health of complex systems, including theory-
driven approaches such as logic models, and systems thinking. Theory-driven evaluations aid
the design and implementation of complex system evaluations using a conceptual
framework. Specifically, they assist in describing the various objectives, inputs, outputs,
outcomes, assumptions and components of the system. There are several types of theory-
driven approaches, including logic models and theory-of-change evaluations.
A logic model is a diagrammatic representation of how a system functions and what it
achieves. The most basic format of a logic model involves the intervention—output—
outcome—impact structure, and includes a description of resources/inputs needed to
undertake interventions. The purpose of a logic model is to provide clarity about the
components of a system and how these help achieve the system’s objectives.
The theory of change focuses on inputs, activities and outcomes, but also specifies the order
of activities, and the relevant assumptions and context, which typically are not included in
logic models. It requires a deeper understanding and explanation of the system and as a
result is often more narrative than diagrammatic, and there is less standardisation in its
format. Theories of change often take a system’s goal as the starting point, and work
backward to articulate how and why the practices will lead to the goal. Producing theories
of change is likely to involve more time and effort and a larger set of stakeholders than a
logic model.
Theory-driven approaches are generally used in both complex and complicated systems. For
example, the majority of evaluations performed by governmental and inter-governmental
organisations such as the Canadian border services or the European Union use a theory-
driven approach (EC Directorate-General for Regional and Urban Policy, 2013; Agriculture
and Agri-Food Canada, 2015).
In the past decade there has been increasing recognition in the evaluation literature that in
order to be effective, the evaluation of complex systems must take into account features
such as emergent outcomes and non-linearity (Walton, 2016). Systems thinking is a recent
term that has been used in public health and social sciences for advocating new approaches
that explicitly consider complexity properties when evaluating complex systems
(Glouberman & Zimmerman, 2002; Forss et al., 2011; Patton, 2011; Westhorp, 2012;
Lamont et al., 2016).
Systems thinking is defined as ‘an approach to problem solving that views problems as part
of a wider dynamic system. Systems thinking involves more than a reaction to present
outcomes or events. It demands a deeper understanding of the linkages, relationships,
interactions and behaviour among the elements that make up a system.’ (World Health
Organization, 2009). Many concepts found in the systems thinking literature already existed
in the evaluation literature, for example, understanding linkages and relationships, or
evaluating a system from multiple scales (Cabrera et al., 2008). Yet, systems thinking is a
36
paradigm shift in how evaluations are traditionally constructed (World Health Organization,
2009). It frames the problem in terms of patterns of behaviour over time; views causality as
an ongoing process not a fixed relationship; and emphasises the need to understand the
context of relationships.
Despite its recent popularity within the evaluation literature, systems thinking remains only
peripheral in evaluation practice (Walton, 2016). On the basis of interviews with 41
evaluation practitioners, Walton (2016) identified several barriers to the use of systems
thinking. These included resource constraints; time and data requirement of the method;
the dominance of existing approaches; expectations of evaluation funders and users; limited
practitioner knowledge; and limitations in complexity-informed methods. Several
participants reported the difficulty of translating complexity thinking into practical tools. For
example, despite academic definition it is still difficult to know how to implement the
concepts of emergence or boundaries in a practical sense.
The choice among these various evaluation tools depends on the characteristics and
complexity of the system. However, all these tools emphasise the importance of developing
indicators of performance that reflect different elements of a system, the attributes of
performance that are considered relevant and the scales of the evaluation.
3.2 Using indicators to measure performance
Indicators form the basis of any evaluation framework. Indicators are measurable aspects of
a system that allow assessment of whether the objectives of an action or system are being
met. Indicators can:
• measure an output, outcome or impact of the system or action;
• address an average behaviour, or the outliers (for example the average versus the
maximum number of border interceptions); and
• examine changes at the system level or at a specific action level.
Indicators can be quantitative – reported in terms of a number or a percentage – or
qualitative – requiring description. Quantitative indicators are typically easier to collect and
interpret than qualitative indicators but they may tell only part of the performance story.
Qualitative indicators provide complementary and valuable insights into the attitudes,
perceptions and beliefs underlying the behaviour of participants in a system (Victorian DEPI,
2014). Using a combination of quantitative and qualitative data can improve performance
evaluation by ensuring that the limitations of one type of information are balanced by the
strengths of another. This helps to ensure that understanding is improved by engaging
different ‘ways of knowing’ (BetterEvaluation, www.betterevaluation.org).
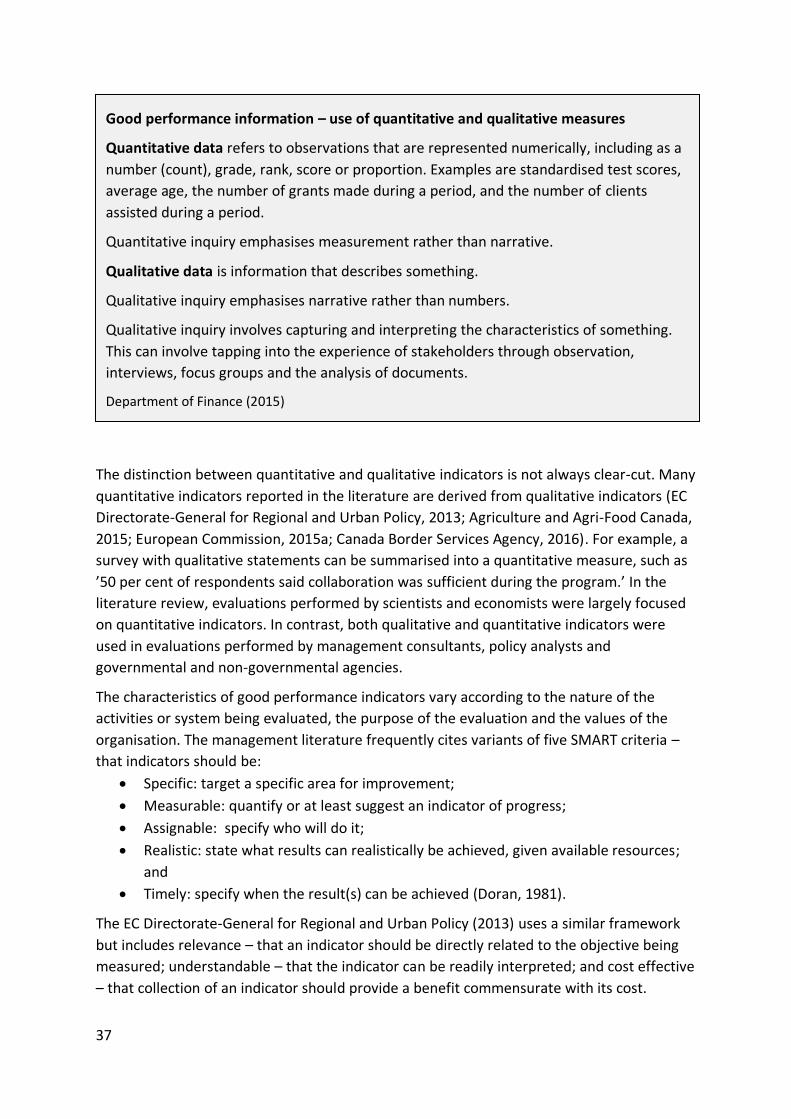
37
The distinction between quantitative and qualitative indicators is not always clear-cut. Many
quantitative indicators reported in the literature are derived from qualitative indicators (EC
Directorate-General for Regional and Urban Policy, 2013; Agriculture and Agri-Food Canada,
2015; European Commission, 2015a; Canada Border Services Agency, 2016). For example, a
survey with qualitative statements can be summarised into a quantitative measure, such as
’50 per cent of respondents said collaboration was sufficient during the program.’ In the
literature review, evaluations performed by scientists and economists were largely focused
on quantitative indicators. In contrast, both qualitative and quantitative indicators were
used in evaluations performed by management consultants, policy analysts and
governmental and non-governmental agencies.
The characteristics of good performance indicators vary according to the nature of the
activities or system being evaluated, the purpose of the evaluation and the values of the
organisation. The management literature frequently cites variants of five SMART criteria –
that indicators should be:
• Specific: target a specific area for improvement;
• Measurable: quantify or at least suggest an indicator of progress;
• Assignable: specify who will do it;
• Realistic: state what results can realistically be achieved, given available resources;
and
• Timely: specify when the result(s) can be achieved (Doran, 1981).
The EC Directorate-General for Regional and Urban Policy (2013) uses a similar framework
but includes relevance – that an indicator should be directly related to the objective being
measured; understandable – that the indicator can be readily interpreted; and cost effective
– that collection of an indicator should provide a benefit commensurate with its cost.
Good performance information – use of quantitative and qualitative measures
Quantitative data refers to observations that are represented numerically, including as a
number (count), grade, rank, score or proportion. Examples are standardised test scores,
average age, the number of grants made during a period, and the number of clients
assisted during a period.
Quantitative inquiry emphasises measurement rather than narrative.
Qualitative data is information that describes something.
Qualitative inquiry emphasises narrative rather than numbers.
Qualitative inquiry involves capturing and interpreting the characteristics of something.
This can involve tapping into the experience of stakeholders through observation,
interviews, focus groups and the analysis of documents.
Department of Finance (2015)
Source: Department of Finance 2015
38
Reflecting the purpose of its activities, the United States Agency for International
Development (USAID) requires that its performance indicators be, among other things,
objective – unambiguous about what is being measured and what data are being collected;
useful for management – able to provide a meaningful measure of change over time for
management decision making; and able to be disaggregated to the appropriate level, for
example by age or gender – to manage for sustainable project impact (USAID, 2010).
There are many other examples of organisations defining the types of indicators useful for
their specific purposes. Key considerations for all organisations are that the indicator set
chosen should, when interpreted together, be capable of providing a more effective picture
of the impacts of interventions than any individual indicator. The set of indicators should
also reflect different points along the pathway to long term outcomes and impacts to
provide an understanding of how results are linked to activities and identify areas that might
require further investigation (Peersman, 2017).
Diverse sources of data and other information are required to assess the outcomes of
activities. These can include reviews of reports, previous evaluations and audits (Lauras et
al., 2010; European Commission, 2015a; Wu et al., 2016); statistical sources such as national
and regional statistics; program and system monitoring data sets (Gupta & Dokania, 2014);
experiments (Susaeta et al., 2016); case studies (Wu et al., 2016); interviews (Agriculture
and Agri-Food Canada, 2015); surveys (European Commission, 2015b) and reviews of the
academic literature or media (Agriculture and Agri-Food Canada, 2015). The literature
review shows that indicators used by government or intergovernmental agencies were
mainly based on data gathered from previous reports as well as from interviews and surveys
(EC Directorate-General for Regional and Urban Policy, 2013; Agriculture and Agri-Food
Canada, 2015; European Commission, 2015a; Canada Border Services Agency, 2016).
It is worth remembering that good performance reporting is not about the volume of data;
it is about using quality data to support better decision making and better assessment of
performance (Department of Finance, 2015).
3.3 Benchmarking performance
Good performance in a system is a relative concept. While performance indicators are
essential to understanding the links between activities in a system and outcomes, they do
not of themselves define whether a system is healthy. An essential step towards evaluating
system performance is defining what a ‘healthy’ system looks like. This can involve defining
indicator thresholds, or benchmarks, that are deemed ‘healthy’. These targets and
benchmarks might be considered minimum levels of performance required for a system to
be considered healthy, or levels required to be considered ‘best practice’. Most benchmarks
in the literature are established on the basis of industry-level agreed standards, for example
those developed by the International Organization for Standardization.
39
3.4 Evaluation of system health by public sector agencies
Governments internationally, including in Australia, have developed a strong focus on
performance evaluation and require that performance frameworks are in place to assess the
effectiveness and efficiency of their activities. The following summarises the review
undertaken by ABARES of emerging trends in public sector performance evaluation in
Australia and internationally, supplemented with additional information and interpretation
from CEBRA.
Emerging trends in public sector performance evaluation in Australia
In Australia, performance evaluation of Commonwealth agencies is guided by the
Department of Finance. In its guide to developing good performance information
(Department of Finance, 2015), the Department of Finance articulates that accurate and
reliable performance information helps officials, ministers, the parliament and the public
form judgments about whether a Commonwealth entity is delivering on its intended results.
Such information underpins the accountability of agencies to the parliament and the public.
Performance information can also be used for strategic decision making that supports
government consideration of how to best allocate limited public resources to achieve its
policy objectives, and can be used at an agency level to support tactical and operational
decisions.
While the Department of Finance guidance material is intended to support good
performance reporting in the corporate plans and annual performance statements of
Commonwealth agencies under the Public Governance, Performance and Accountability Act
2013, it provides sensible and pragmatic advice for performance reporting and evaluation in
a wide range of contexts. The following draws on information relevant to the assessment of
biosecurity system health.
The guide takes a flexible approach to performance measurement, noting the following key
points:
• if well designed and reported, key performance indicators (KPIs) can be a powerful
source of non-financial performance information that can be easily understood and
related to the efficiency and effectiveness of an activity;
• KPIs alone may not give a full performance picture – particularly when the
effectiveness of activities is hard to measure quantitatively, for example policy
advice; when activities are complex; when outcomes are best observed over the
medium to long term; and when activities require collaboration across diverse
entities, including other jurisdictions;
• Good performance reporting is not about the volume of data – it is about using
quality data to support better decision making and better assessment of
performance;
• Performance reporting must be cost effective; and
• Performance measures should be informed by the nature of the activities they are
trying to assess and the key stakeholders involved in the activity.
40
The Department of Finance (2015) notes that there is no general rule for what constitutes a
good performance measure. It provides principles to assist in determining measures that
are fit for purpose:
• focus on a small number of well targeted and defined performance measures rather
than a large number of loosely framed performance measures;
• the form and content of the performance measures should provide sufficient
evidence to show whether an activity is achieving or adequately progressing towards
desired outcomes;
• the performance measures should be carefully worded to ensure that the results
being monitored are specific enough to allow a meaningful discussion of
performance;
• performance measures should drive behaviours that deliver the desired outcomes of
the activity; and
• a comprehensive and balanced set of performance measures should compare actual
performance with expected results.
Practical considerations raised by the Department of Finance include that data should be of
the appropriate quality to ensure that performance information is meaningful and
consistent. Performance measurement must also be cost effective – that is, the effort
required to collect and manage the information should be commensurate with the
significance of an activity and should not detract from an agency’s ability to deliver activities
and achieve its purpose. Performance information should also provide the appropriate link
between an activity or intervention and an outcome. This can be difficult where activities
are delivered in complex environments that are constantly changing and where there is
limited control over external factors. There is also recognition that different entities often
work together to achieve a common purpose. Although the entities may deliver discrete
components of a broader undertaking, the performance information of interest will identify
whether the common purpose is being achieved. This observation is of particular relevance
to the biosecurity system where there are multiple participants across linked activities that
are designed to deliver common objectives.
The Department of Finance also notes that many activities will deliver different results at
different times. Long term results can be difficult to measure as they may only be
observable once an activity has ended, or has been going for many years. In such cases, it is
important to use results observable in the short to medium term to provide confidence that
long term results will follow. It is also important to ensure that performance information is
based on durable data or data that is stable over time. If the types of information used to
evaluate performance vary significantly over time, the ability to make meaningful
comparisons between different time periods will be compromised.
The Department of Finance guidance is also clear that meaningful performance reporting
will be supported by both quantitative and qualitative information. Quantitative and
qualitative information make different contributions to an assessment of performance and
when used to complement each other can provide a more complete performance picture.
41
In addition, the Department of Finance provides guidance on how to use performance
information to tell a meaningful performance story that is targeted to the appropriate
audience. A small set of relevant and high quality performance measures that generates
information that tells a coherent story about the achievements of activities directed at
satisfying a particular objective is preferred over larger amounts of poorly focused and
messaged performance information. Because it is likely to be a combination of quantitative
and qualitative data, performance information will often be presented through a mix of
graphics and narrative descriptions.
The ABARES review of literature identified different approaches to system wide
performance evaluation used in defence, education, environment, finance, forestry, health,
Indigenous and social justice, and science. The assessment focused on the work undertaken
by public sector agencies to evaluate and provide measures of the health of their system
using performance indicators and other criteria.
The ABARES review identified emerging trends in the way entities approach performance
reporting in Australia:
• Some entities are moving away from a reliance on Key Performance Indicators (KPIs)
that measure performance solely in terms of inputs (measuring the quantity of
resources provided) and outputs (the volume of products or services provided), to
include other types of indicators of performance such as:
• process indicators (measuring what happened during implementation)
• efficiency indicators (relationship of outputs to inputs)
• effectiveness indicators (extent to which planned activities are realised and
planned results achieved)
• impact and outcome indicators (that measure short and long term effects,
respectively)
• indirect indicators (used when direct measures are not available or feasible).
• Performance reporting tends to focus on a small set of well targeted, high level (or
core) indicators to evaluate performance, rather than an in-depth review of many
indicators.
• Although the use of quantitative measures (such as indicators that measure values
or counts, expressed as numbers or frequencies) is core to evaluating the
performance of a department or system, there has been movement towards using a
mix of quantitative and qualitative measures that, together, provide more complete
and insightful information about performance at the level of an entity’s purpose.
• There is evidence of reporting information at different time scales, and at a level
appropriate to measuring long-term outcomes.
• While indicators comprise the bulk of a review, agencies are now supplementing this
type of measure with a range of other tools, including: benchmarking (against
relevant best practice); stakeholder surveys (to provide firsthand data on the results
of activities on the intended recipients); peer review (to provide assessments against
the experience of those with proven records of delivering similar activities); and
42
comprehensive evaluations (to provide a better understanding of the overall impact
of an activity).
• There are clear linkages in reported departmental and system strategic objectives
(particularly those identified in corporate plans, and key strategies and action plans)
and the core measures selected in performance reporting.
• The need for transparency, honesty and integrity was identified by a number of
government departments as being an important attribute of performance reporting.
The ABARES report reviews contemporary examples of performance reporting of three
complex systems – national Indigenous health and well being; forestry; and defence. These
are reported in Appendix A.
The New Zealand experience
The New Zealand Government State Services Commission and the Treasury (2008) provides
advice on performance evaluation that has been adopted across government agencies. The
most recent annual reports from New Zealand ministries demonstrate a consistent
evaluation framework. This involves describing the agency’s key goals and how they are
achieved using a program logic structure: resources, outputs, impacts and outcomes. In this
context, resources are the staff or finances allocated to activities, outputs are the direct
results of particular activities, impacts represent what the activities achieve immediately,
and outcomes represent what the activities achieve collectively or over the long term.
In the case of the Ministry of Education, the overall objectives are stated as contributing to
‘social and cultural participation and wellbeing’ and ‘economic prosperity and growth’.
Outcomes that contribute to that objective include: ‘the education system is relevant and
reaches all children and students’, and ‘every child and student reaches academic success
(Ministry of Education, 2016: 9). Certain impacts contribute to these outcomes, for example
‘responsive educational services that meet the needs and raise the aspirations of all children
and students’ are achieved by implementing activities such as ‘provide tailored services and
support to raise achievement’.
Evaluation of systems using this framework involves identifying changes in impacts and
outcomes through time. This usually means quantitative evaluation of the effectiveness or
efficiency of impacts and outcomes, plotting them through time and reporting on the
difference between the current performance and a benchmark, which is often set according
to government priorities. This is accompanied by quantitative indicators of key outputs and
financial resources and a qualitative narrative about the activities that are undertaken and
why they may or may not have been successful, plans for the future and any other highlights
or concerns that are poorly covered by the quantitative metrics.
Although the reports from different Ministries follow a similar format, they differ in how
much emphasis they place on the different aspects of their system, the emphasis they place
on the effectiveness and efficiency of the system, and how the main indicators are chosen
and grouped.
43
The international context
The ABARES review also considered approaches to evaluation of health and education
systems in an international context, with an emphasis on literature from Canada and the
OECD (see Appendix A). The review summarises the use of indicators to track change in
performance over time and across geographic regions or sectors of the population. In the
reports reviewed, the criteria used to select indicators included the importance of what is
being measured in terms of impact and policy relevance; the scientific soundness of the
measure in terms of its validity, reliability and the explicitness of the evidence base; and the
feasibility and cost of obtaining data for the measures (Kelly & Hurst, 2006; UNESCO, 2016).
OECD (2015) uses similar criteria of policy relevance, data availability and data
interpretability.
All the systems evaluated had clearly defined goals that were aligned to the strategic
priorities of system stakeholders, including government, policy makers and the general
public. For example, CIHI (2012) lists three ‘ultimate goals’ of Canada’s health system that
are largely consistent with other international frameworks:
• to improve the health status of the population;
• be responsive and provide services in a way that meets needs and expectations; and
• to deliver value for money by balancing resource allocation to obtain the best
outcomes for the resources used.
Education systems reviewed had similar high-level goals aligned with policy objectives, for
example to improve education status, be responsive and deliver value.
The ABARES review identified that evaluation frameworks measure system performance by
first defining a number of performance dimensions – or key aspects – under which
performance indicators and measures are grouped. For example, common dimensions used
when evaluating health system performance include accessibility, effectiveness, efficiency,
equity and patient-centeredness, which can be tailored according to need.
The majority of international reports reviewed contained a moderate to large number of
mostly quantitative indicators, ranging from 20 to more than 200 and grouped under a
variable number of dimensions. Five to seven dimensions was a typical number, although
some reports had just four dimensions. Dimensions themselves can be grouped if necessary,
as demonstrated by a performance measurement framework for the Canadian health
system proposed by the Canadian Institute for Health Information in 2012. That framework
included four quadrants composed of a number of performance dimensions linked through
expected causal relationships (CIHI, 2012).
Most reports presented performance indicators and measures throughout the body of the
report, grouped under the different dimensions, together with an analysis of that
dimension’s key results. An alternative to this format was to keep the amount of
performance data in the body of the report to a minimum and to include most performance
information in an appendix.
44
The approach taken by most reports reviewed was to include a relatively large number of
indicators and measures in the body of the report or the appendices, from which
conclusions were drawn about a smaller number of performance dimensions. For example,
OECD (2015), Health at a Glance 2015 presented around 200 pages of health indicators from
which conclusions were drawn in the executive summary in five selected areas:
pharmaceutical spending, life expectancy, number of doctors and nurses per capita, out-of-
pocket expenses, and quality of care. The report also presented a series of five dashboards
showing relative country rankings on five dimensions of healthcare: health status, risk
factors, access to care, quality of care, and healthcare resources—all of which depend
strongly on the availability of underpinning data.
Performance targets or benchmarks were a strong feature in some reports. In Canada,
waiting times for surgery are considered a major indicator of health system quality by
consumers. As a result, six waiting time targets or benchmarks were established by
government for specific procedures in four high-priority areas and are reported annually in
Canada by each province. An example of a waiting time target or benchmark is 48 hours for
surgical repairs of hip fractures (Marchildon, 2013; CIHI, 2017). Similarly, the New Zealand
government reports annually against a set of six high-priority health targets, including life
expectancy and health expectancy; rates of death from cancer; rates of death from
cardiovascular disease; childhood and adult obesity; immunisation rates; and smoking rates
(Gericke, 2014).
The ABARES report notes that average or median results for indicators in cross-country
comparative reports such as those prepared by the OECD can act as targets against which
countries can benchmark their performance. Within a country, targets can be used to
identify disparities in performance between different geographic areas, socioeconomic
groups or demographic groups.
The reports reviewed by ABARES contained a mix of static or point measures for a single
year as well as trend data. Trend data make it possible to identify if areas are improving or
declining over time, or if performance targets such as increasing the level of educational
attainment in the population, reducing waiting times for surgery, moving closer to the OECD
average on selected indicators, or reducing Indigenous disadvantage in the population, are
being achieved.
Most reports on the health system reviewed by ABARES describe a number of factors
outside the health system that influence system performance (Murray & Frenk, 2000; Arah
et al., 2006; CIHI, 2012; Marchildon, 2013; OECD, 2015; Squires & Anderson, 2015). These
provide the context in which the system operates, and include the physical environment in
which people live, individual lifestyles and behaviours, level of adult obesity and diabetes,
drug consumption, socioeconomic status, health insurance status, and rates of accidents
and violence. Understanding these contextual factors can be important in interpreting
system performance indicators.
The ABARES report also comments on the use of different forms of indicators in the one
report to provide a broader picture of system performance. It notes the use in the 2014 US
45
Commonwealth Fund report (Davis et al., 2014) of different types of data. Survey results
from patients and doctors on care experiences and ratings on various dimensions of their
countries’ healthcare systems were used, as well as three objective health outcome
indicators—mortality amenable to medical care, infant mortality, and life expectancy at age
60. Country rankings based on survey results did not necessarily align with country rankings
based on the objective health outcome indicators. The authors concluded that the
healthcare system is just one of many factors, including social and economic well-being that
influence the health of a nation.
Summary performance indicators can also be effective. A 2013 Canadian health system
review included an index that was used as a summary measure for the quality of the
Canadian health system, based on 8 quality indicators (Marchildon, 2013). Plotting the index
over time showed that overall health system quality had improved over a decade.
The ABARES report also notes the importance of ensuring that there is a well-integrated
evaluation and assessment framework that is designed as a whole, rather than one based
on individual elements of a system that may have been developed independently of each
other over time. This is important in a complex system such as biosecurity where there are
multiple elements and participants at different levels of the system.
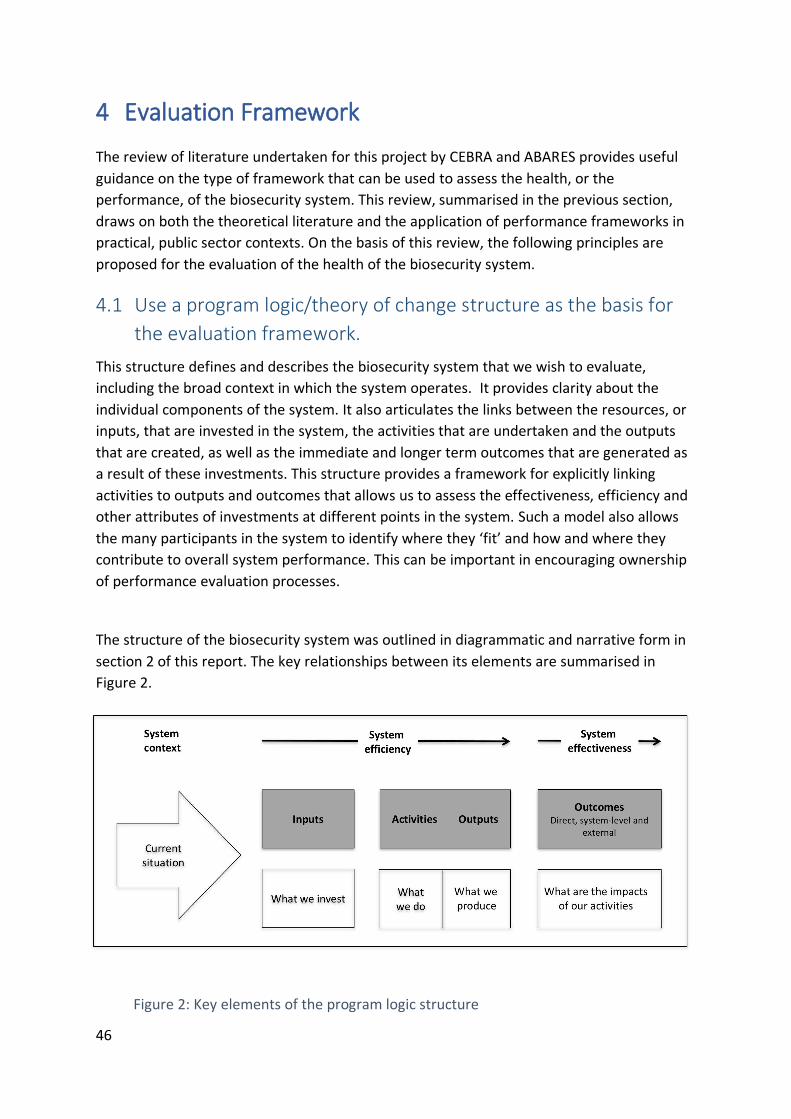
46
4 Evaluation Framework
The review of literature undertaken for this project by CEBRA and ABARES provides useful
guidance on the type of framework that can be used to assess the health, or the
performance, of the biosecurity system. This review, summarised in the previous section,
draws on both the theoretical literature and the application of performance frameworks in
practical, public sector contexts. On the basis of this review, the following principles are
proposed for the evaluation of the health of the biosecurity system.
4.1 Use a program logic/theory of change structure as the basis for
the evaluation framework.
This structure defines and describes the biosecurity system that we wish to evaluate,
including the broad context in which the system operates. It provides clarity about the
individual components of the system. It also articulates the links between the resources, or
inputs, that are invested in the system, the activities that are undertaken and the outputs
that are created, as well as the immediate and longer term outcomes that are generated as
a result of these investments. This structure provides a framework for explicitly linking
activities to outputs and outcomes that allows us to assess the effectiveness, efficiency and
other attributes of investments at different points in the system. Such a model also allows
the many participants in the system to identify where they ‘fit’ and how and where they
contribute to overall system performance. This can be important in encouraging ownership
of performance evaluation processes.
The structure of the biosecurity system was outlined in diagrammatic and narrative form in
section 2 of this report. The key relationships between its elements are summarised in
Figure 2.
Figure 2: Key elements of the program logic structure
47
4.2 Define the biosecurity system as complex.
Australia’s biosecurity system shares many of the characteristics of complex systems
outlined in the literature review. Key among these are that the system:
• has many components. These include multiple participants, extensive resource
inputs, many separate but frequently linked activities, and multi-layered objectives;
• displays emergent behaviour, such that the outcomes generated by the system
cannot be readily predicted on the basis of known components, that is, there is some
uncertainty in the interactions within the system;
• contains some degree of spontaneous order or self-organisation that allows it to
withstand failures and perturbations over time;
• is characterised by non-linear relationships between inputs and outputs – small
changes in inputs can have large changes on outputs and impacts and vice versa;
• has interacting components;
• contains feedback loops between different elements of the system; and
• is context dependent such that the same intervention can lead to different outcomes
and impacts depending on external factors.
There are elements and activities in the biosecurity system that can be characterised as
simple – well defined and predictable – and complicated – having many components and
needing expertise and coordination. But at the overarching system level, the biosecurity
system is characterised by complexity. Hence, understanding how complexity influences the
operation of the biosecurity system is important to framing an appropriate performance
assessment system. As observed in the literature review, most evaluation procedures for
complex systems are conducted at multiple levels of a system – from individual activities to
whole of system; in multiple contexts; and over long time frames. These layers of the
evaluation framework will be developed in the second phase of the project.
4.3 Take a cumulative approach – from individual elements to whole
of system
The proposed performance evaluation framework will build a picture of performance of
each element, or set of activities, in the biosecurity system individually, and then seek to
build the links between the elements. The elements of the system are outlined in the
program logic model and consist of activities to anticipate and prevent biosecurity risks
approaching the Australian border; to screen biosecurity risk material at the border; to
prepare for and detect any incursions of exotic pests and diseases; and to respond to,
recover from and adapt to pests and diseases that establish and spread in Australia.
The framework recognises that biosecurity risk management is a sequential, or cumulative,
process, such that activities under one element of the system have an impact on outcomes
of subsequent elements. For example, activities to better anticipate biosecurity risk will also
contribute to preventing risk material arriving at the Australian border. Similarly, activities
designed to enhance the capacity to detect incursions of pests and diseases will support
48
more efficient and effective responses to incursions. These links between elements of the
system and the achievement of system outcomes will be made explicit in the performance
evaluation framework.
4.4 Define the attributes of health against which performance will be
evaluated
In order to evaluate the health of the biosecurity system it is necessary to define the
characteristics, or attributes of the system that are considered desirable, that is, those
attributes that will contribute to achieving the desired outcomes of the system. This is partly
subjective – different stakeholders in the system might have different views about the key
attributes of health. It is worth noting that efficiency outcomes in the biosecurity system
may be driven by non-technical issues, including political considerations that may affect the
allocation of resources.
Table 2 proposes five broad attributes of a healthy biosecurity system that will be used to
inform the evaluation framework. These are the effectiveness of the system, its efficiency,
its robustness and resilience to external stress, its capacity and its sustainability over time.
Not each of these attributes of health will be relevant to each element of the system.
The effectiveness of the biosecurity system is an overarching measure of its health and seeks
to address whether the investments and interventions in the system are delivering
appropriate outputs and achieving their intended outcomes. Effectiveness can be measured
for each element of the system and for the system as a whole. It can also be measured at
different levels – at the output level and at the direct, system-wide and external outcomes
levels. It is conceptually easier to link the effectiveness of activities to outputs or direct
outcomes than it is to higher level outcomes. For example, relatively direct links can be
made between the activities designed to anticipate biosecurity risk and the outputs defined
in the project logic structure such as the number of intelligence reports generated and the
number of import risk assessments that are reviewed. It is also reasonably straightforward
to link activities to the direct outcome that the risk profile is identified, assessed and
prioritised. It is more difficult to attribute causality between activities undertaken and the
system level objective to reduce the likelihood of exotic pests and diseases entering,
establishing or spreading in Australia. The difficulty is amplified when seeking to link
activities to the external outcomes of a stronger economy, functioning ecosystems, healthy
people and resilient communities. This is because there are many more influences on the
higher level outcomes than the activities undertaken to anticipate biosecurity risk.
At the broadest level, a measure of the effectiveness of the biosecurity system might be the
extent to which all risk management interventions across all elements of the system reduce
the residual risk in the biosecurity system to a level at or below Australia’s appropriate level
of protection.
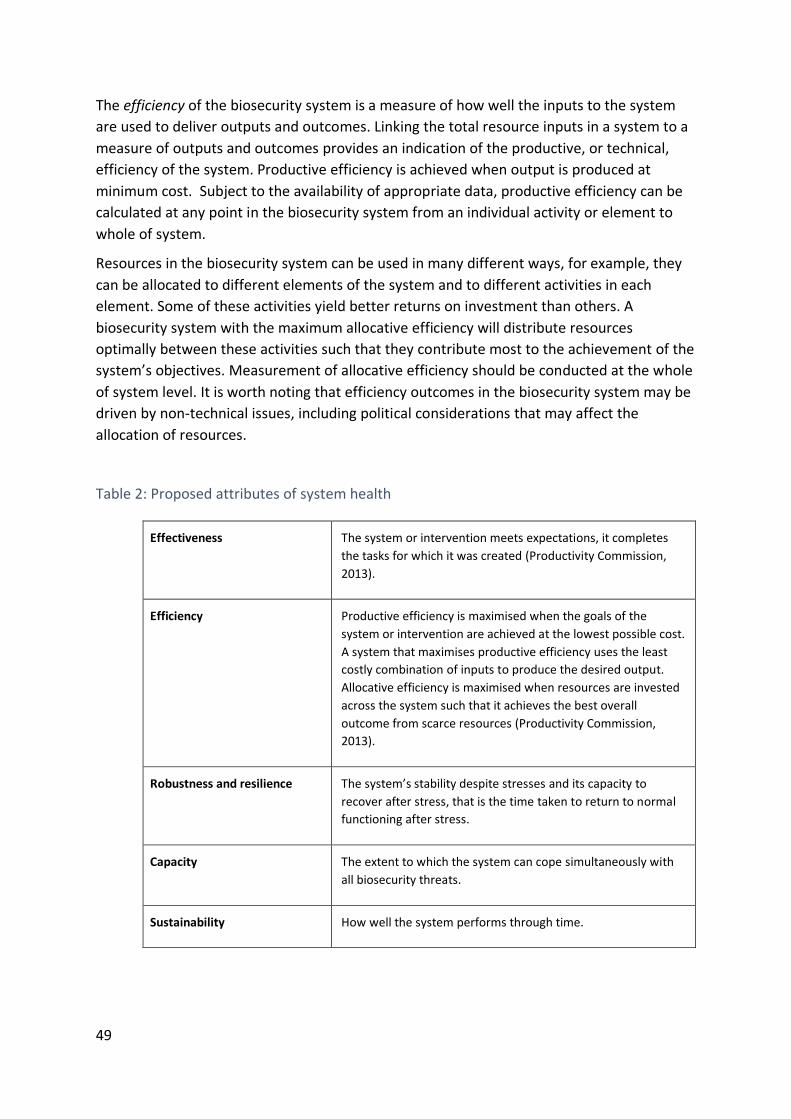
49
The efficiency of the biosecurity system is a measure of how well the inputs to the system
are used to deliver outputs and outcomes. Linking the total resource inputs in a system to a
measure of outputs and outcomes provides an indication of the productive, or technical,
efficiency of the system. Productive efficiency is achieved when output is produced at
minimum cost. Subject to the availability of appropriate data, productive efficiency can be
calculated at any point in the biosecurity system from an individual activity or element to
whole of system.
Resources in the biosecurity system can be used in many different ways, for example, they
can be allocated to different elements of the system and to different activities in each
element. Some of these activities yield better returns on investment than others. A
biosecurity system with the maximum allocative efficiency will distribute resources
optimally between these activities such that they contribute most to the achievement of the
system’s objectives. Measurement of allocative efficiency should be conducted at the whole
of system level. It is worth noting that efficiency outcomes in the biosecurity system may be
driven by non-technical issues, including political considerations that may affect the
allocation of resources.
Table 2: Proposed attributes of system health
Effectiveness The system or intervention meets expectations, it completes
the tasks for which it was created (Productivity Commission,
2013).
Efficiency Productive efficiency is maximised when the goals of the
system or intervention are achieved at the lowest possible cost.
A system that maximises productive efficiency uses the least
costly combination of inputs to produce the desired output.
Allocative efficiency is maximised when resources are invested
across the system such that it achieves the best overall
outcome from scarce resources (Productivity Commission,
2013).
Robustness and resilience The system’s stability despite stresses and its capacity to
recover after stress, that is the time taken to return to normal
functioning after stress.
Capacity The extent to which the system can cope simultaneously with
all biosecurity threats.
Sustainability How well the system performs through time.
50
The robustness and resilience of the biosecurity system refers to how well the system
operates – how stable it is – under conditions of stress and how quickly it reverts to ‘normal’
operations after a period of stress. For example, pest and disease incursions create stress in
the biosecurity system – they require resources to be diverted from their usual activities to
address the stress and they may require additional resources to be made available to cope
with the circumstances. A robust and resilient system will absorb these perturbations with
minimal impact on other elements of the system and will revert to normal activity in the
shortest time possible after the stress has been resolved. Measuring the robustness and
resilience of the biosecurity system should be conducted on the basis of observation of the
system after a period of stress. The nature of the observed stress will determine at what
level of the system the performance evaluation should be conducted.
A related attribute is the capacity of the biosecurity system to respond to multiple stresses
at the same time. At any time, the biosecurity system may be subject to more than one
event that requires a response. For example, global circumstances may change and require
additional investment in environmental scanning to understand the implications for
Australia’s risk profile. One or several incursions may occur at the same time that occupy
the same resources, such as diagnostic facilities or scientific capability. Having the surge
capacity to manage simultaneous events without over investment in the system helps
ensure that the system can cope with multiple stress events. The capacity of the system can
be measured for different inputs, for example, diagnostic capacity, veterinary capacity. It is
also desirable to develop an aggregate measure of capacity at the whole of system level.
The sustainability of the system refers to its ability to meet its objectives over the medium
to long term. Over time the pressures on the biosecurity system are expected to grow with
increasing volumes of trade and passenger movements and increasingly diverse import
pathways. The global distribution of pests and diseases is also likely to change in response to
factors such as climate, while international supply chains are expected to become more
complex over time. These contextual factors will have an impact on the biosecurity risk
profile facing Australia and the volume of risk that needs to be managed. A sustainable
system will have the appropriate support mechanisms in place to ensure that the objectives
of the biosecurity system can be met in the face of these pressures. These support
mechanisms will include, among others, sustainable funding processes to ensure the
appropriate allocation of resources to the system, effective training processes to develop
the human resource capability necessary to operate the system, and the research and
development effort to generate innovative and cost effective solutions to biosecurity
problems. The sustainability of the system can be measured for different elements of the
system as well at the whole of system level.
4.5 Develop indicators of system performance
Performance indicators are a critical component of the evaluation framework for the
biosecurity system as they seek to link changes in activities with the achievement of outputs
and outcomes – if well designed and implemented they provide objective evidence of the
51
impacts of system activities. Many organisations have adopted criteria for performance
indicators that meet their specific needs but good performance indicators possess some
common characteristics across organisations.
The literature review in this report identified five fundamental qualities of good
performance indicators that are used by the European Commission Directorate-General for
Regional and Urban Policy. These are that indicators should be:
• relevant: be directly related to the objective being measured
• measureable: be directly and reliably measured
• timely: be measurable at time intervals relevant to objectives
• understandable: be readily interpreted;
• cost-effective: provide a benefit commensurate with the cost.
Other related qualities of indicators used by organisations are that they should be clear –
able to be articulated as simply as possible to ensure common understanding by all
stakeholders; achievable – can be realistically gathered and interpreted; limited – as few as
required to achieve the objectives; useful for management – provide a meaningful measure
of change over time to inform management decision making; and practical – able to be
collected on a timely basis and at reasonable cost.
These criteria will be used to inform the development of appropriate performance
indicators for the biosecurity system.
4.6 Use quantitative and qualitative indicators of performance
Good performance indicators can be quantitative or qualitative in nature. Quantitative
measures are numerical and include objective and replicable measures such as counts of
activities and quantifiable changes in outputs and outcomes. Qualitative indicators require
some subjective evaluation. Qualitative data can sometimes be reported in quantitative
form but these numbers do not have arithmetic meaning on their own. An example might
be the number of positive answers to a qualitative statement in a survey. When developing
quantitative or qualitative indicators it is important that the indicator be constructed in a
way that permits consistent measurement over time. The use of both quantitative and
qualitative indicators can add richness to the evaluation framework.
4.7 Have overarching quantitative indicators linked to objectives that
provide a high-level picture of performance
While a mix of quantitative and qualitative indicators will be developed for each element of
the biosecurity system, there will be a number of high level summary indicators that link
activities to direct and system level outcomes. For example, the first high level indicator will
link activities under the anticipate and prevent activities to the biosecurity risk approach
rate. The second high level indicator will link screening activities to the border leakage rate.
Together, these indicators will be used to assess how well the biosecurity system is meeting
IGAB objective 1 – to reduce the likelihood of exotic pests and diseases from entering,
52
becoming established or spreading in Australia. Similar levels of indicators will be developed
to link activities to direct outcomes and the system level outcomes expressed as IGAB
objectives 2 and 3. As referred to above, at the very highest level, the health of the
biosecurity system might be measured as the extent to which all risk management
interventions across all elements of the system reduce the residual risk in the system to a
level at or below Australia’s appropriate level of protection. Inferring a value for Australia’s
ALOP and forming judgements about whether residual risk is at or below this level would be
subjective and require extensive consultation with stakeholders.
4.8 Develop targets and benchmarks for performance indicators in
conjunction with stakeholders
While performance indicators are essential to understanding the links between activities in
a system and outcomes, they do not of themselves define whether a system is healthy.
Establishing targets for performance and benchmarking them against an appropriate
comparison point is a way of understanding the relative performance of the system. These
targets or benchmarks might be considered minimum levels of performance required for a
system to be considered healthy, or levels required to be considered ‘best practice’.
Defining targets and benchmarks will require consultation with stakeholders. An external
agency such as CEBRA is not in a position to define targets and benchmarks as the desired
level of system performance should be defined by system participants who have an
understanding of the constraints around the operation of the system such as its financing.
Different participants may have different initial views regarding target performance and
appropriate benchmarks in a healthy system but it is important that, through consultation,
they are accepted as valid by the broad stakeholder community. Consultation on targets and
benchmarks will be undertaken in the third phase of this project.
4.9 Build a narrative of the performance story using the selected
indicators
The evaluation of the biosecurity system should be presented as a narrative that
incorporates relevant quantitative indicators and qualitative information that together
provide a coherent and integrated performance story. The narrative is designed to enhance
and enrich the evaluation information provided in quantitative form.
4.10 Use case studies to build the performance story element by
element
Case studies will be used to develop the indicators of performance for each element of the
biosecurity system. The first case study addresses quantitative indicators of the
effectiveness of preventing and screening biosecurity risk material on the interational air
passenger pathway and is reported in the following section. Subsequent case studies will

53
address other elements of the system in order to link these to the objectives of the system
articulated in the IGAB.
54
5 Case Study – screening of international air passengers
5.1 Introduction
Air travel presents a substantial risk of introducing biosecurity risk material (BRM) to
Australia. Managing the risk of the air passenger pathway is challenging. In the financial
year 2015-16, 19 million passengers arrived in Australian ports, and the scope for
biosecurity intervention is limited by issues of space and time: the area for staging and
processing passengers is limited in each airport, and stakeholders invariably prefer speedy
outcomes. Nonetheless, regular interceptions are made of materials that present a clear
biosecurity risk.
Australia has nine international airports, one in each state and territory capital except
Hobart, and one each in Cairns and Coolangatta. Here we omit the statistics from Canberra,
because its relatively recent introduction prevents a useful analysis of performance data or
comparison with other airports. Other airports do provide international flights on an ad-hoc
basis but they lack the infrastructure for biosecurity processing.
The purpose of this case study is threefold:
(i) to demonstrate the application of indicators to measuring attributes of health,
(ii) to provide some assessment of the health of an aspect of the biosecurity system,
and
(iii) to discuss opportunities and challenges associated with collecting and analysing
the data that are needed for such exercises. It is not intended to provide a
definitive analysis of the data.
5.2 Methods and materials
This case study is constructed from international passenger inspection and interception data
provided by DAWR. Briefly, the activity at the airport that is germane to these data is as
follows. Passengers arrive at the airport on international flights and are profiled by various
means, which may include questioning and may use the passenger’s data provided on the
incoming passenger card, which includes their declaration of whether they are carrying any
potential BRM. The outcome of the profiling is the direction of the passenger to one or
more intervention channels, as listed below. After intervention, an endpoint, or leakage,
survey is carried out. This survey involves the selection of a random passenger and the
recording of the passenger’s details and the inspection of one article that has not previously
been opened. The purpose of the endpoint survey is two-fold: first, to verify that passenger
profiles are correct and being applied appropriately; and second, to form an estimate of the
effectiveness of the different kinds of intervention.
The data are monthly passenger counts by airport (each of nine international ports),
passenger declaration status (declarant/non-declarant); and intervention channel:
55
1. Direct Exit, meaning the release of passenger with no assessment by biosecurity
officer;
2. Assess & Release, meaning the release of passenger after assessment by biosecurity
officer, which may include viewing their incoming passenger card (IPC) and/or asking
questions to establish the risk of them carrying goods of biosecurity concern;
3. Border, meaning manual inspection by Border Protection officials;
4. Detector Dog Unit;
5. X-ray; and
6. Manual inspection.
The passengers were counted in the following groups: (i) all passengers, (ii) passengers with
goods seized, (iii) passengers who subsequently undergo an endpoint survey (previously
called a leakage survey, see CEBRA Project 1301b), and (iv) passengers who undergo an
endpoint survey and have goods seized. The data are the same as are used by Compliance
Division to compute performance indicators that are used to manage the pathway risk. The
data have undergone pre-processing, but still contain minor errors.
Figure 3 provides a snapshot of the airport system activity in terms of the number of
declarant and non-declarant passengers processed by each different intervention method in
each international airport for the financial years 2012/13 to 2016/17.
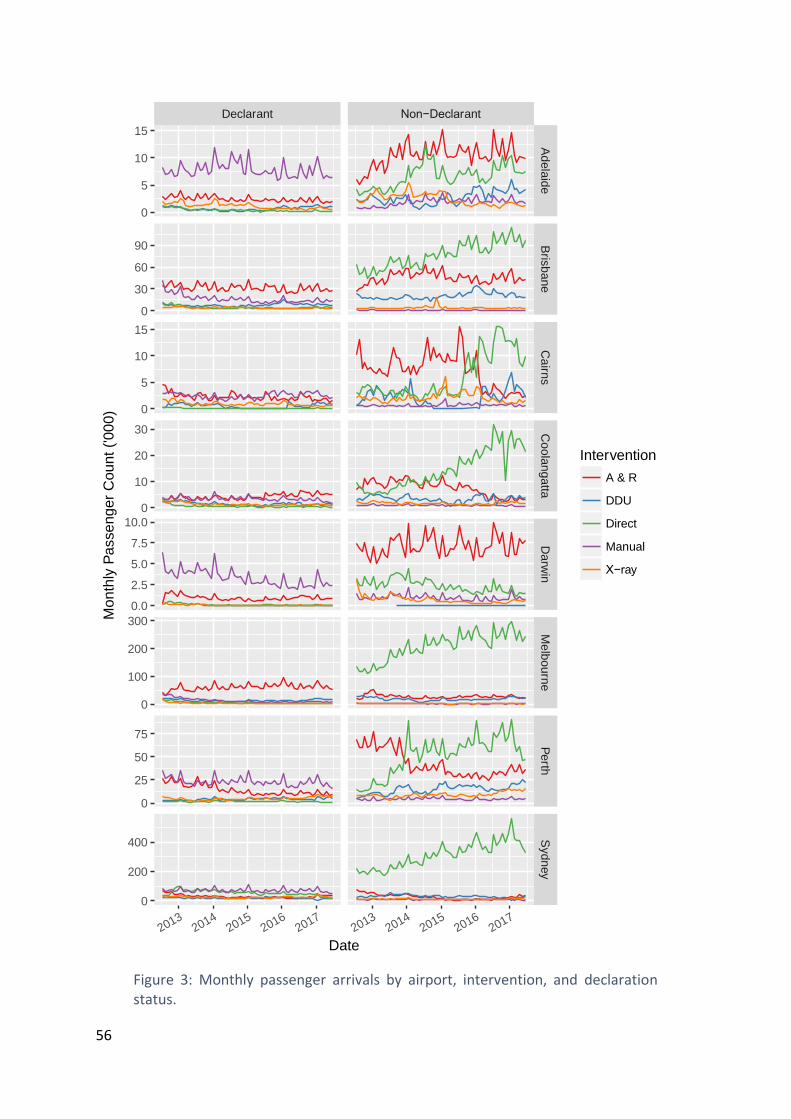
56
Figure 3: Monthly passenger arrivals by airport, intervention, and declaration status.
Declarant Non−Declarant
Ad
ela
ide
Bris
ba
ne
Ca
irns
Co
ola
ng
atta
Da
rwin
Me
lbou
rne
Perth
Sydn
ey
20132014
20152016
20172013
20142015
20162017
0
5
10
15
0
30
60
90
0
5
10
15
0
10
20
30
0.0
2.5
5.0
7.5
10.0
0
100
200
300
0
25
50
75
0
200
400
Date
Mon
thly
Passe
ng
er
Cou
nt
('00
0)
Intervention
A & R
DDU
Direct
Manual
X−ray
57
As can be expected, passenger counts are increasing over time, most notably in the larger
airports, namely Melbourne and Sydney. However, the increase is only in non-declarant
passenger counts. Declarant passengers are reasonably constant over time.
All but Adelaide and Darwin have managed the surge in non-declarant passenger counts by
increasing the profiling rates to Direct Exit; Adelaide (after 2014) and Darwin’s passenger
numbers are fairly constant and are managed mainly via Assess and Release. Perth and
Coolangatta switched from emphasis on Assess and Release to Direct Exit for non-declarant
passengers in 2013. The airports each differ in the rates at which declarant passengers are
inspected. Melbourne and Brisbane assess and release the largest proportion of declarant
passengers, whereas the other ports – including Sydney – apply manual inspection.
This case study focuses on two attributes of system health: effectiveness and efficiency.
These attributes are assessed using quantitative measures and qualitative arguments.
Effectiveness – the objective of the system is to intercept BRM that is carried by
international passengers. To assess its effectiveness, or whether it is achieving its intended
objective, we report the number of passengers that are intercepted with BRM, across time
(Figure 4). We assume that the more BRM that is intercepted, the more effective the system
is. The system is also intended to have a net effect of ensuring that international passengers
show high compliance with Australia’s biosecurity regulations. We assess the post-
intervention compliance (PIC, also called residual compliance) against this objective (Figure
5). The PIC is documented in ACERA reports 1001i and 1101d. We assume that the closer PIC
is to 1, the more effective the system is.
Efficiency – the system uses profiling to increase the efficiency with which passengers can
be processed. We assess the efficiency of the system by showing whether passengers that
are profiled to screening or inspection (cost intensive forms of intervention) are more likely
to carry BRM than those that are profiled to Direct exit or Assess and Release (Figure 6). The
system also uses various devices for screening and inspecting passengers, such as the DDU,
X-ray, and manual inspection. We will assess the efficiency of these devices using a metric
called (unfortunately) effectiveness, which is defined as the proportion of the BRM that is
presented to an intervention that is correctly screened or found by the intervention (Figure
7).
These indicators of efficiency are proxies for the productive efficiency attribute defined in
section 4 of this report.
The analyses reported here are intended to be indicative rather than definitive. More
appropriate results might be possible if more complex modelling is applied, and the
selection of different statistics may lead to more useful insights
58
5.3 Results
Effectiveness
A representation of the effectiveness of the international air passenger biosecurity system
can be found by examining Figures 4 and 5. Figure 4 shows that substantial quantities of
BRM are seized annually from declarant passengers, and also large amounts from non-
declarant passengers. DDU units consistently caught the largest quantity of non-declared
BRM in Melbourne and Brisbane, and in Sydney until 2017. X-ray intercepted the highest
quantity of non-declared BRM in the other cities. Manual inspection yielded the highest
return for declarant passengers across all pathways. In Sydney, Cairns, and Adelaide, the X-
ray performed better than the DDU for declarant passengers. Regardless of the detail, it is
clear that large quantities of BRM are routinely seized from passengers.
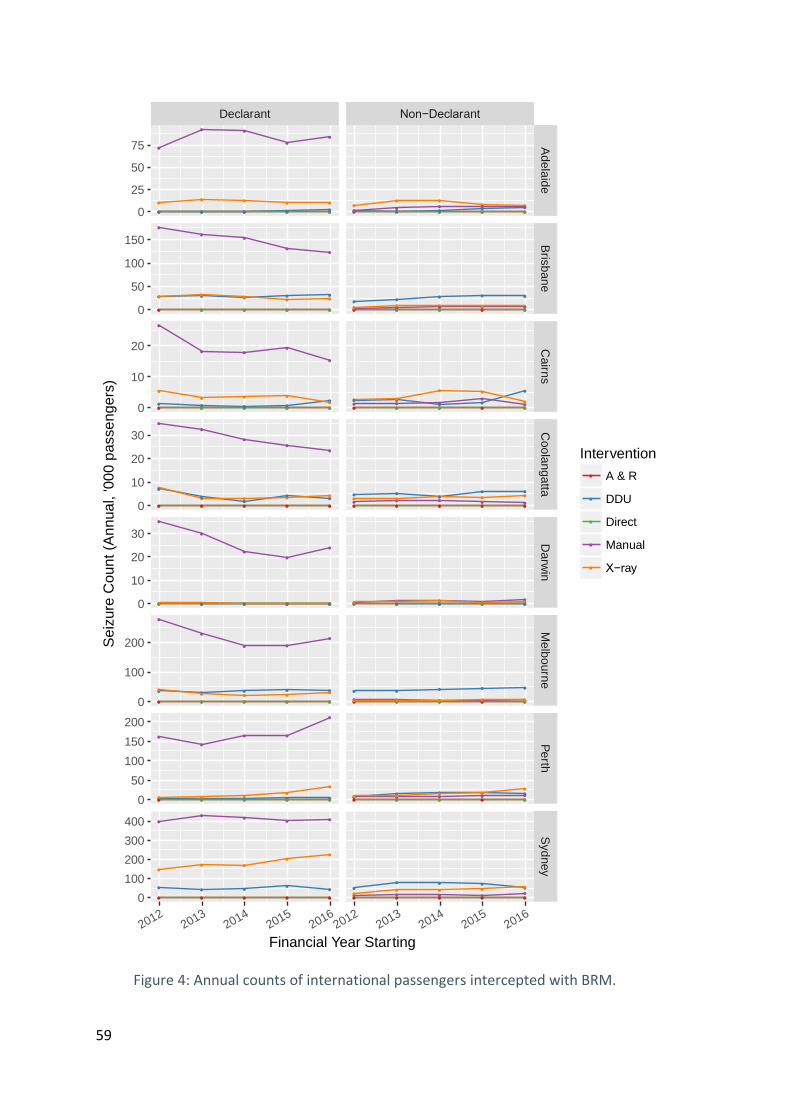
59
Figure 4: Annual counts of international passengers intercepted with BRM.
●
●
●●
●
●
●
●●
●
●
●
●●
●
●
●
●●
●
●
●
●●
●
●●
●
●●
●
●
●
●
●
●
●
●
●
●
●
●
●
●
●
●
●
●
●
●
●
●
●
●●
●●●
●
●
●●●
●
●
●●●
●
●
●●●
●
●
●
●●
●●
●
●●●●
●
●●●●
●
●●●●
●
●●
●●
●
●●●
●
●●●●
●
●●●●
●
●●●●
●
●●●●
●
●
●
●
●
●
●
●
●●
●
●
●
●●
●
●
●
●●
●
●
●
●
●
●
●
●●● ●●●
●
● ●●●
●
● ●●●
●
●●●●
●
●
●
●
●●
●
●
●
●●
●
●
●
●●
●
●
●
●●
●
●
●
●●
●
●●●●● ●
●
●●●
●
●
●●●
●●●●●
●●●●●
●●●●● ●
●
●●● ●
●
●●● ●●●
●
●●
●
●●●
●●●●●
●●●●●
●●●●
●
●
●●
●●
●●
●
●●
●●●●●
●●●●●
●●●
●●●●●●●
●●●
●●
●●●● ●●●●● ●●●●● ●●●●●●●●●
●
●
●●● ●
●
●●● ●
●
●●● ●
●
●●● ●
●
●●●
●●●●●
●●●●● ●
●●●● ●●
●●●
●●●●●
●●●●●
●
●●●●
●
●●●●
●
●●●
● ●●●●
●
Declarant Non−Declarant
Ad
ela
ide
Bris
ban
eC
airn
sC
oo
lan
gatta
Da
rwin
Me
lbo
urn
eP
erth
Syd
ney
20122013
20142015
20162012
20132014
20152016
0
25
50
75
0
50
100
150
0
10
20
0
10
20
30
0
10
20
30
0
100
200
0
50
100
150
200
0
100
200
300
400
Financial Year Starting
Se
izure
Co
un
t (A
nnua
l, '00
0 p
asse
ng
ers
)
Intervention
●
●
●
●
●
A & R
DDU
Direct
Manual
X−ray
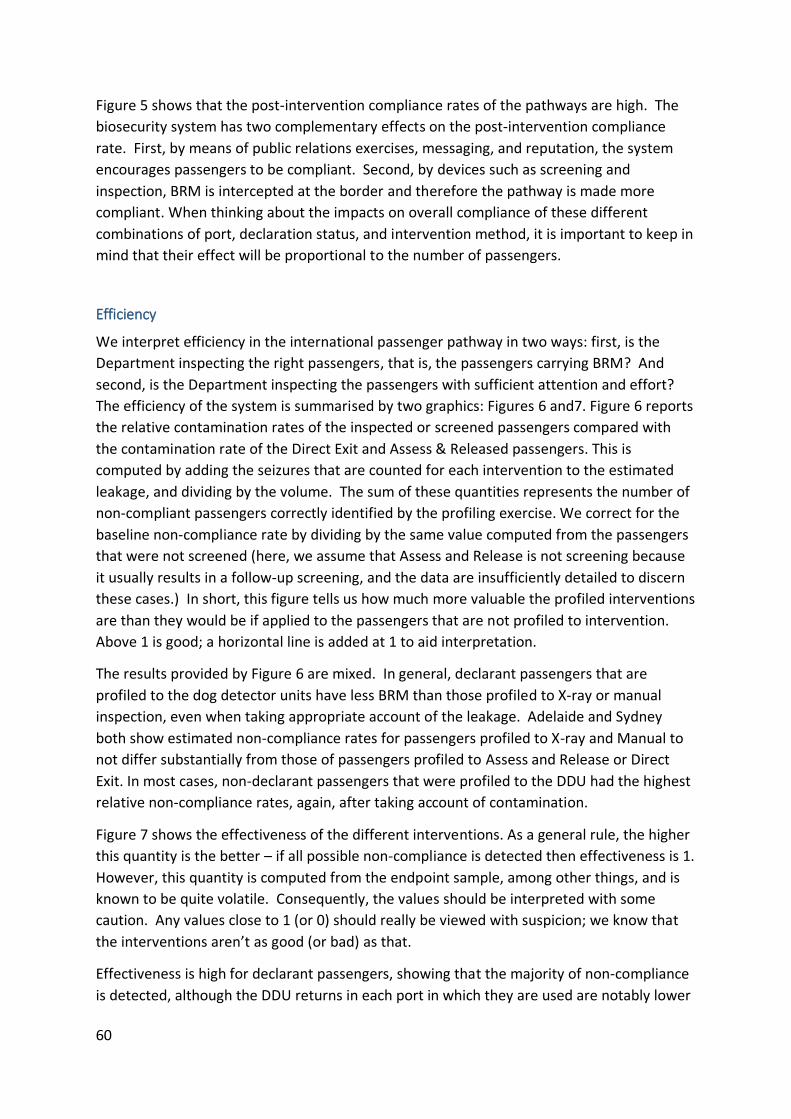
60
Figure 5 shows that the post-intervention compliance rates of the pathways are high. The
biosecurity system has two complementary effects on the post-intervention compliance
rate. First, by means of public relations exercises, messaging, and reputation, the system
encourages passengers to be compliant. Second, by devices such as screening and
inspection, BRM is intercepted at the border and therefore the pathway is made more
compliant. When thinking about the impacts on overall compliance of these different
combinations of port, declaration status, and intervention method, it is important to keep in
mind that their effect will be proportional to the number of passengers.
Efficiency
We interpret efficiency in the international passenger pathway in two ways: first, is the
Department inspecting the right passengers, that is, the passengers carrying BRM? And
second, is the Department inspecting the passengers with sufficient attention and effort?
The efficiency of the system is summarised by two graphics: Figures 6 and7. Figure 6 reports
the relative contamination rates of the inspected or screened passengers compared with
the contamination rate of the Direct Exit and Assess & Released passengers. This is
computed by adding the seizures that are counted for each intervention to the estimated
leakage, and dividing by the volume. The sum of these quantities represents the number of
non-compliant passengers correctly identified by the profiling exercise. We correct for the
baseline non-compliance rate by dividing by the same value computed from the passengers
that were not screened (here, we assume that Assess and Release is not screening because
it usually results in a follow-up screening, and the data are insufficiently detailed to discern
these cases.) In short, this figure tells us how much more valuable the profiled interventions
are than they would be if applied to the passengers that are not profiled to intervention.
Above 1 is good; a horizontal line is added at 1 to aid interpretation.
The results provided by Figure 6 are mixed. In general, declarant passengers that are
profiled to the dog detector units have less BRM than those profiled to X-ray or manual
inspection, even when taking appropriate account of the leakage. Adelaide and Sydney
both show estimated non-compliance rates for passengers profiled to X-ray and Manual to
not differ substantially from those of passengers profiled to Assess and Release or Direct
Exit. In most cases, non-declarant passengers that were profiled to the DDU had the highest
relative non-compliance rates, again, after taking account of contamination.
Figure 7 shows the effectiveness of the different interventions. As a general rule, the higher
this quantity is the better – if all possible non-compliance is detected then effectiveness is 1.
However, this quantity is computed from the endpoint sample, among other things, and is
known to be quite volatile. Consequently, the values should be interpreted with some
caution. Any values close to 1 (or 0) should really be viewed with suspicion; we know that
the interventions aren’t as good (or bad) as that.
Effectiveness is high for declarant passengers, showing that the majority of non-compliance
is detected, although the DDU returns in each port in which they are used are notably lower

61
than the other interventions. Manual inspection and X-ray are reasonably comparable with
one another for non-declarant passengers. Overall these figures show that the department
is quite consistently finding a significant proportion of the non-compliant passengers that
are being correctly profiled into one of the interventions.
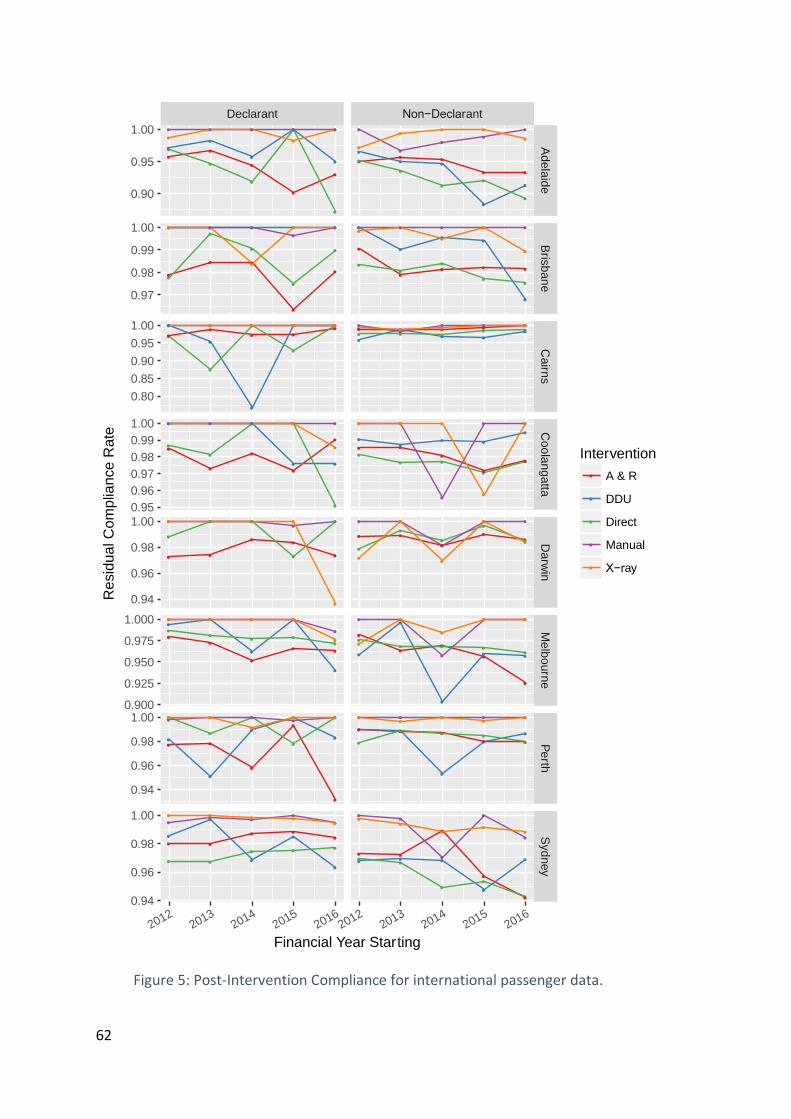
62
Figure 5: Post-Intervention Compliance for international passenger data.
●
●
●●
●
●
●
●
●
●
●
●
●
●
●
●
●
●●●
●
●
●
●
●
●●
●●●
●
●●●●
●
●
●
●
●
●
●
●
●●
●
●
●
●●
●
●●
●
●●
●
●
●●
●
●
●
●●
●
●
●●● ●●●●●
●
●●
●● ●
●
●
●● ●●
●
●● ●●
●
●
●
●
●
●●
●
●
●
●
●
●
●
●● ●
●
●●●
●
●
●
●
●
●
●
●●
●
●●
●
●●
●
●
●
●
●
●
●
●
●●
●
●
●
●
●
●●
●
●●●
●
●
●
●
●●
●
●
●●
●
●●
●
●●
●
●
●●●
●
●
●
●
●●●
●
●
●
●
●
●
●
●
●
●
●
●
●
●
●
●
●
●
●
●
●
●
●
●
●
●
●
●
●
●
●
●
●
●
●
●
●
●
●
●
●
●
●
●
●
●●●
●
●
●
●●
●
●
●
●
●
●
●
●
●
●
●
●
●
●
●
●●●●
●
●●●●● ●
●●
●● ●●●●
●
●●●●●
●
●●
●
●
●
●
●
●
●
●
●●
●
●
●
●●
●
●
●
●●
●
●
●
●
●
●
●
●
●
●
●●
●
●
●
●
●●
●
●●●
●
●
●
●
●●
●●
●
●
●
●
●
●
●
●●●
●●
●
●
●
●
●
●
●
●
●
● ●●●
●●
●
●●
●●
●
●
●
●
●●
●●
●●
●
●
●●
●
●
●
●●
●
●●
●
●●
●
●
●●
●
●
●
●●
●
Declarant Non−Declarant
Ad
ela
ide
Bris
ban
eC
airn
sC
oo
lan
gatta
Da
rwin
Me
lbo
urn
eP
erth
Syd
ney
20122013
20142015
20162012
20132014
20152016
0.90
0.95
1.00
0.97
0.98
0.99
1.00
0.80
0.85
0.90
0.95
1.00
0.95
0.96
0.97
0.98
0.99
1.00
0.94
0.96
0.98
1.00
0.900
0.925
0.950
0.975
1.000
0.94
0.96
0.98
1.00
0.94
0.96
0.98
1.00
Financial Year Starting
Re
sid
ual C
om
plia
nce
Rate
Intervention
●
●
●
●
●
A & R
DDU
Direct
Manual
X−ray
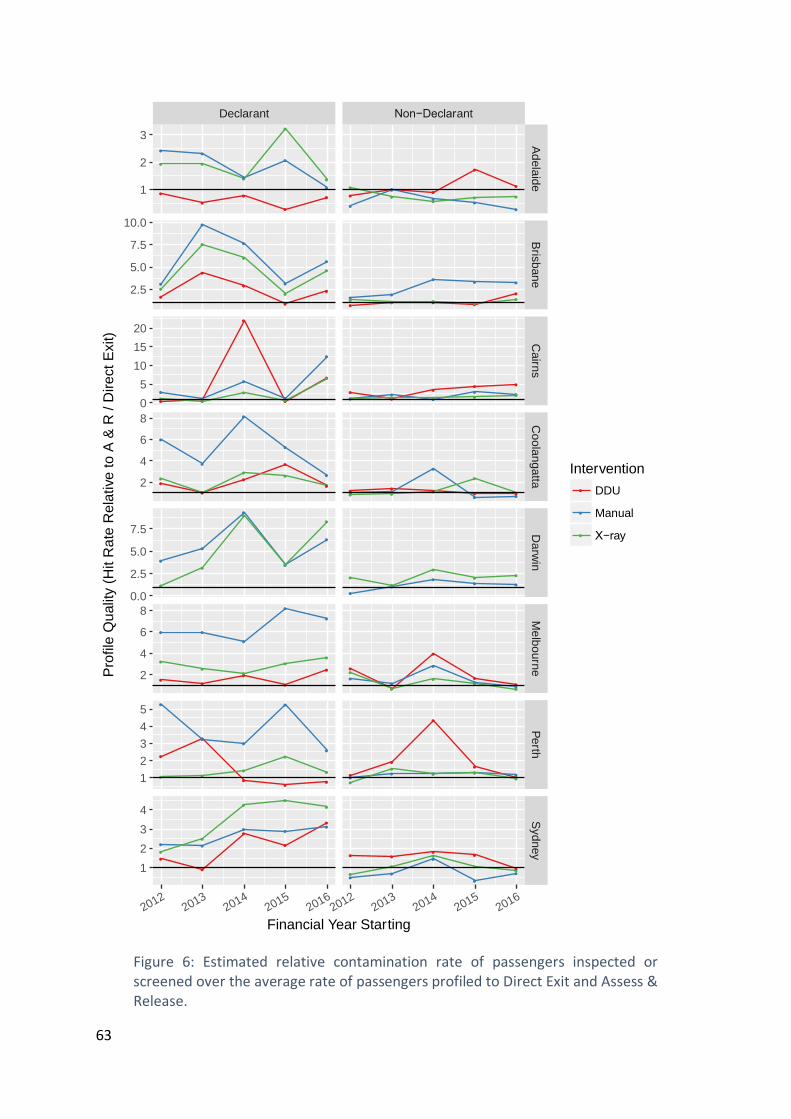
63
Figure 6: Estimated relative contamination rate of passengers inspected or screened over the average rate of passengers profiled to Direct Exit and Assess & Release.
●
●
●
●
●
●
●
●
●
●
●
●
●
●
●
●
●●
●
●
●
●
●
●
●
●
●●
●
●
●●
● ●●●
●
●
●
●●●
●
●
●
●
●●
●
●●
●
●●
●
●
●
●
●●
●
●
●
●
●●
●●
●
●
●
●
●
●
●
●●
●
●
●
●
●●
●
●
●
●
●
●●
●●
●
●
●
●
●
●
●
●
●
●●
●
●●
●●
●
●
●
●
●●
●
●●
●
●●●
●
●● ●
●
●●
●
●
●●● ●●
●●●
● ●
●●
●●
●
●●●
●●●
●
●● ●●● ●
●●
●●● ●●
●
●
●●●
●
● ●●●
●
●
●●●
●
●●
●
●
●
●●
●●●
●
●
● ●●● ●●●
●●●
●
●●
●
●●●●●
●●●
●
●●
●
●●
●●●
●
●
● ●●●
Declarant Non−Declarant
Ad
ela
ide
Bris
ban
eC
airn
sC
oo
lan
gatta
Da
rwin
Me
lbo
urn
eP
erth
Syd
ney
20122013
20142015
20162012
20132014
20152016
1
2
3
2.5
5.0
7.5
10.0
0
5
10
15
20
2
4
6
8
0.0
2.5
5.0
7.5
2
4
6
8
1
2
3
4
5
1
2
3
4
Financial Year Starting
Pro
file
Qu
alit
y (
Hit R
ate
Rela
tive
to
A &
R / D
ire
ct
Exit)
Intervention
●
●
●
DDU
Manual
X−ray
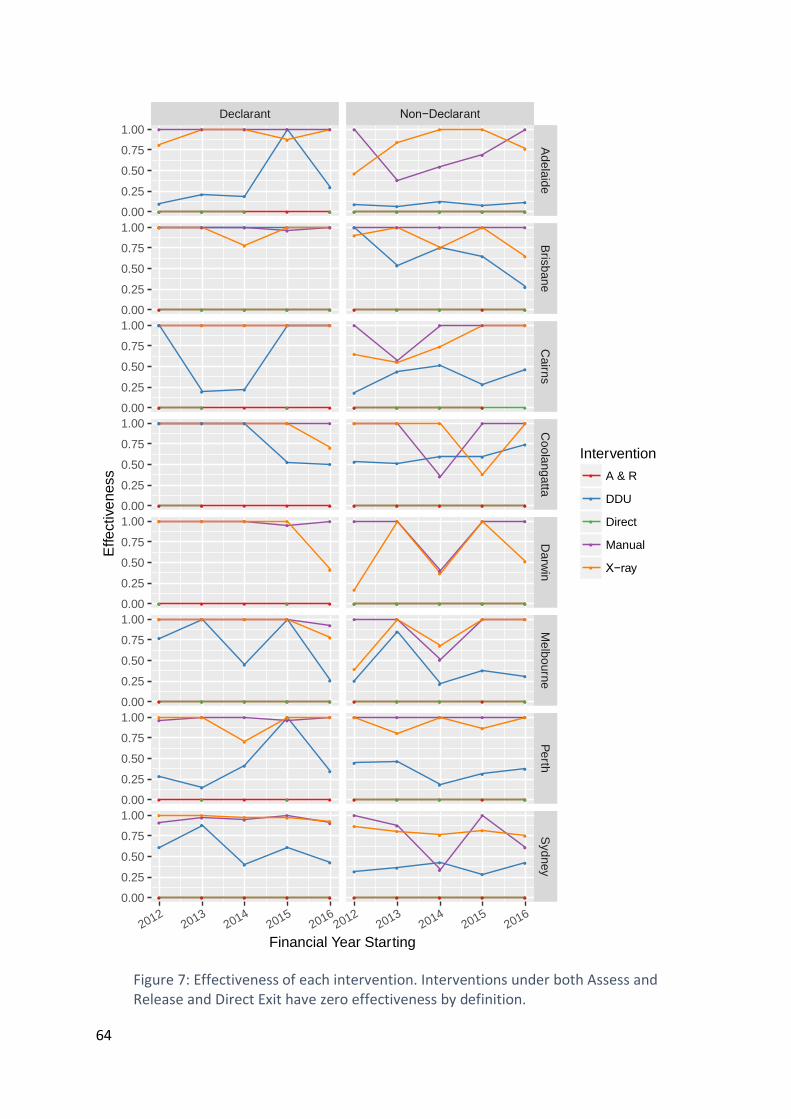
64
Figure 7: Effectiveness of each intervention. Interventions under both Assess and Release and Direct Exit have zero effectiveness by definition.
●
●
●●
●
●
●
●
●
●
●
●
●
●
●
●
●
●●
●
●
●
●
●
●●
●●●
●
●
●
●●
●
●
●
●
●
●
●
●
●●
●
●
●
●●
●
●●
●
●
●●
●
●●
●
●
●●
●●
●●●
●
●●●
●
●●
●● ●
●●
●● ●
●
●● ●
●
●
●
●
●●
●
●
●
●
●
●
●
●
● ●
●
●●
●
●
●
●
●
●
●
●
●
●●
●
●●
●
●
●
●
●
●
●
●
●●
●
●
●
●
●
●
●
●
●●
●
●
●●
●●
●
●
●
●
●
●●
●●
●
●
●●
●
●
●●
●
●●
●●
●
●
●
●●
●
●
●
●●
●
●
●
●●
●
●
●
●●
●
●
●
●●
●
●
●
●
●
●
●
●
●●
●
●
●
●
●
●
●●
●●●
●
●
●
●●
●
●
●
●
●
●●
●
●
●
●
●
●
●
●
●
●
●
●
●
●●
●
●●
●●
●
●
●
●
●●
●
●
●
●
●●
●
●●
●
●
●
●●
●
●
●
●●
●
●
●
●●
●
●
●
●●
●
●
●
●
●
●
●
●
●
●
●
●
●
●
●
●
●
●
●
●
●
●
●
●
●
●
●
●
●
●
●
●
●
●
●
●
●
●
●
●
●●
●
●
●
●
●
●
●
●
●
●
●
●●
●
●
●
●●
●●
●
●
●
●
●
●
●●
●●
●
●
●●
●
●
●
●●
●
●●
●●
●
●
●
●●
●
●
●
●●
●
Declarant Non−Declarant
Ad
ela
ide
Bris
ban
eC
airn
sC
oo
lan
gatta
Da
rwin
Me
lbo
urn
eP
erth
Syd
ney
20122013
20142015
20162012
20132014
20152016
0.00
0.25
0.50
0.75
1.00
0.00
0.25
0.50
0.75
1.00
0.00
0.25
0.50
0.75
1.00
0.00
0.25
0.50
0.75
1.00
0.00
0.25
0.50
0.75
1.00
0.00
0.25
0.50
0.75
1.00
0.00
0.25
0.50
0.75
1.00
0.00
0.25
0.50
0.75
1.00
Financial Year Starting
Effe
ctive
ne
ss
Intervention
●
●
●
●
●
A & R
DDU
Direct
Manual
X−ray
65
5.4 Discussion
This section covers the three points introduced as the rationale for this case study.
Demonstrate the application of indicators to measuring attributes of health.
Here we measured two attributes of health, namely effectiveness and efficiency, using
various indicators. We assessed the effectiveness by asking whether the system is
performing as designed – namely to intercept BRM and to affirm that the pathways are
acceptably compliant after border intervention has been performed. We assessed efficiency
by asking whether the system is making best use of its resources – does it direct the
expensive interventions, such as manual inspection, appropriately, and when they are
carried out, are they carried out successfully?
Provide some assessment of the health of an aspect of the biosecurity system.
Based purely on the two attributes discussed, namely effectiveness and efficiency, and
keeping in mind the caveats below, we assess the health of the international passenger
system as being reasonable. The system is operating in a somewhat predictably fluctuating
environment (Figure 3), intercepting a substantial amount of risk material (Figure 4),
affirming that the pathways are in reasonably high compliance (Figure 5), generally
inspecting many of the right passengers, although there is apparent scope for improvement
(Figure 7), and performing the relevant interventions with reasonable effect (Figure 6).
The methodological challenges raised by the case study include how to aggregate measures
of health across multiple pathways and in what circumstances it is meaningful to do so. The
case study focuses on the international air passenger pathway only but similar analyses can
be undertaken on other pathways, subject to data quality and availability. A second
challenge is how to apply and interpret qualitative conclusions regarding health. In this case
study we have assessed the health of the international passenger system as ‘reasonable’. In
the absence of performance benchmarks, some calibration of a qualitative statement is
required in order to make comparisons across elements of the biosecurity system and to
draw conclusions about the health of the system as a whole. These issues will be explored
further as additional case studies are undertaken.
Opportunities and challenges associated with collecting and analysing the data.
This case study shows that activities on some pathways managed by the Department are
captured with sufficient detail that reasonable indicators can be computed and interpreted
from the point of view of system health. Indeed, this study was greatly assisted by the fact
that the Department collects and reports these data routinely. The data were largely clean
and had few obvious inconsistencies. Had we been required to analyse the data from raw
sources then the analysis would have taken far longer.
A shortcoming of the data is that we don’t know how risky the seized goods were. Items
such as fruit are seized because they may be a vector for fruit fly, for example, but unless
infestation is obvious the fruit is likely just discarded. From the point of view of regulation,
the passenger who carried an apple was non-compliant, but this does not mean that they
66
presented a clear biosecurity risk. This distinction calls for a nuanced interpretation of the
statistics presented. Ideally, follow-up analysis would be available for all or a sample of the
seized goods to more closely determine the material risk of the pathway.
A further shortcoming is that the endpoint survey does not provide a complete picture of
the quality of the intervention. This is because the endpoint survey requires the manual
inspection of one unopened bag.
As noted above, the simple analyses reported here are not intended to be definitive. Future
work by interested parties may try some statistical smoothing of the noisy signals, such as
the statistics that are based on the endpoint survey, by means of fitting a statistical model
such as a generalised linear model. Furthermore, it may be worth trying to represent the
uncertainty that is a consequence of the fact that the endpoint survey is a sample, rather
than the whole population. It is also possible that we have misinterpreted some aspect of
the data or the processes, and we welcome feedback as to the fidelity and suitability of our
analyses.
67
6 Implementing the evaluation framework
Year one of CEBRA project 1607B Health of Australia’s Biosecurity System has delivered:
- a comprehensive review of the performance evaluation literature of relevance to the biosecurity system, including performance evaluation of complex systems in the public sector in Australia and internationally;
- a detailed description of Australia’s biosecurity system;
- a framework for evaluating the health of the biosecurity system based on ten principles;
- a list and definition of the attributes of biosecurity system health against which the performance of the biosecurity system can be evaluated; and
- a case study that demonstrates the application of indicators to measuring attributes of health on the international air passenger pathway and discusses some of the opportunities and challenges associated with collecting and analysing the data that are needed for such exercises.
Together, these deliverables provide guidance on developing a framework and methodology to evaluate the health of Australia’s biosecurity system that can be used repeatedly at the national and sub national level to support decision making, particularly in relation to the quantity and allocation of investment in the system.
6.1 Next steps
The CEBRA Advisory Board and the DAWR Biosecurity Research Steering Committee have agreed to a set of deliverables in the second year of the project. These are to:
- propose a preferred framework for the performance evaluation of the national biosecurity system;
- resolve technical and conceptual difficulties identified in year 1, including how to aggregate measures of health across various layers of a complex system; how to integrate information from indicators at different temporal or spatial scales; and, generally, how to present data in a way that answers the question “how healthy is the biosecurity system” as well as providing information about where it could be improved;
- provide preliminary estimates of those measures for which the department holds sufficient data; and
- make recommendations for capturing and analysing the data required for those measures for which insufficient data are available.
68
The project will progress these deliverables through a series of case studies on each element
of the biosecurity system, separately or collectively where appropriate. The case studies will
be:
- anticipate biosecurity risk and prevent the entry, establishment and spread of exotic pests and diseases;
- screen goods and people at the border to detect potential incursions of pests and diseases;
- prepare for an outbreak or incursion of exotic pests and diseases;
- detect any pest and disease outbreaks or incursions within Australia;
- respond to an incursion of an exotic or established pest or disease; and
- recover from an incursion and adapt to the new circumstances created by an incursion.
These case studies will be undertaken sequentially. They will be based on desk top reviews
supported by stakeholder workshops.
The intention of the case studies is to demonstrate the links between activities in each
element of the biosecurity system, as described in the program logic documents, the outputs
they deliver and the outcomes they generate. Indicators of health will be developed at
appropriate levels of the system that link activities and outputs to direct and system level
outcomes. The intention is to develop a number of key quantitative indicators that are
supported by both quantitative and qualitative assessments, and reported in both numerical
and narrative form. Methodological issues identified in the case study undertaken for this
report will be examined and addressed progressively.
Progress on each case study will be dependent on the availability and quality of data and
other forms of information. A key output of each case study will be an assessment of the
data, identification of critical data gaps and recommendations for how data might be
captured to support the evaluation framework.
The results of each case study will be submitted to the department for review on its
completion. The learnings from each case study will inform subsequent work.
The above approach does not include the development of an evaluation framework for the
enabling functions that support the biosecurity system. As outlined in the program logic
documents, these include its governance arrangements, information management, funding
arrangements and research and development strategy. The final stage in the project will
include an assessment of how to evaluate the performance of these components of the
biosecurity system.
69
7 References
ABARES (2014) Implementation of improvements to the National Livestock Identification System for sheep and goats: Decision Regulation Impact Statement. Australian Bureau of Agricultural and Resource Economics and Sciences, Canberra.
Agriculture and Agri-Food Canada (2015) Evaluation of the control of diseases in the hog industry. Office of Audit and Evaluation, Government of Canada.
AHA (2017) Animal health in Australia 2016. Animal Health Australia, Canberra.
Almahmoud, E.S., Doloi, K.h. & Panuwatwanich, K. (2012) Linking project health to project performance indicators: Multiple case studies of construction projects in Saudi Arabia. International Journal of Project Management, 30, 296-307.
Arah, O.A., Westert, G.P., Hurst, J. & Klazinga, N.S. (2006) A conceptual framework for the OECD health care quality indicators project. International Journal for Quality in Health Care, September 2006, 5-13.
Beale, R., Fairbrother, J., Inglis, A. & Trebeck, D. (2008) One Biosecurity. A working partnership. The independent review of Australia’s quarantine and biosecurity arrangements. Report to the Australian Government.
Biosecurity Victoria (2009) Biosecurity Strategy for Victoria. Department of Primary Industries, Melbourne.
Biosecurity Victoria (2010) Invasive Plants and Animals Policy Framework. Department of Primary Industries, Melbourne.
Blondeau, V., Anquetil, N., Ducasse, S., Cresson, S. & Croisy, P. (2015) Software metrics to predict the health of a project? An assessment in a major IT company. IWST 15 International Workshop on Smalltalk Technologies, Brescia, Italy.
Cabrera, D., Colosi, L. & Lobdell, C. (2008) Systems thinking. Evaluation and Program Planning, 31, 299-310.
Canada Border Services Agency (2016) Evaluation of the Canada Border Services Agency targeting program. Internal Audit and Program Evaluation Directorate, Government of Canada.
CIHI (2012) A performance measurement framework for the Canadian health system. Canadian Institute for Health Information.
CIHI (2017) Wait times for priority procedures in Canada, 2017. Canadian Institute for Health Information, Ottawa ON.
COAG (2012) Intergovernmental Agreement on Biosecurity. Council of Australian Governments, Canberra.
Craik, W., Palmer, D. & Sheldrake, R. (2017) Priorities for Australia’s biosecurity system. An independent review of the capacity of the national biosecurity system and its underpinning Intergovernmental Agreement. Department of Agriculture and Water Resources, Canberra.

70
Davis, K., Stremikis, K., Squires, D. & Schoen, C. (2014) Mirror, mirror on the wall: how the performance of the U.S. health care system compares internationally. 2014 Update. The Commonwealth Fund 2014.
DAWR (2016a) Biosecurity risk analysis guidelines 2016: managing biosecurity risks for imports into Australia. Department of Agriculture and Water Resources, Canberra.
DAWR (2016b) Annual Report 2015-16. Department of Agriculture and Water Resources, Canberra.
DAWR (2016c) National Environment and Community Biosecurity Research, Development and Extension Strategy 2016 to 2019. Department of Agriculture and Water Resources, Canberra.
DAWR (2016d) National Animal Health Surveillance and Diagnostics Business Plan 2016-19. Department of Agriculture and Water Resources, Canberra.
DAWR (2017) National pest and disease outbreaks. Available at: www.outbreak.gov.au (accessed June 2017).
Department of Finance (2015) Resource Management Guide No. 131: Developing good performance information, Commonwealth of Australia. ISBN: 978-1-925205-17-6 (online).
DIRD (2014) Transport Security Outlook to 2025. Department of Infrastructure and Regional Development, Canberra.
Dodd, A.J., Burgman, M.A., McCarthy, M.A. & Ainsworth, N. (2015) The changing patterns of plant naturalization in Australia. Diversity and Distributions, 21, 1038-1050.
Doran, G.T. (1981) There’s a S.M.A.R.T. way to write management’s goals and objectives. Management Review (AMA FORUM), 70, 35-36.
EC Directorate-General for Regional and Urban Policy (2013) EVALSED: The resource for the evaluation of socio economic development - evaluation guide. European Commission.
European Commission (2015a) Ex-post evaluation of the External Borders Fund 2011-2013. Evaluation and fitness check roadmap.
European Commission (2015b) Mid-term evaluation of the 3rd Health Programme 2014-2020. Evaluation and fitness check roadmap.
Forss, K., Marra, M. & Schwartz, R. (eds.) (2011) Evaluating the complex. Attribution, contribution, and beyond. Comparative policy evaluation, Volume 18. Transaction Publishers, New Brunswick, NJ.
Gericke, C. (2014) New Zealand: Health system review. Health Systems in Transition, 2014, Vol. 4, No. 2. World Health Organisation (WHO)
Glouberman, S. & Zimmerman, B. (2002) Complicated and complex systems: what would successful reform of Medicare look like? Discussion paper no. 8. Commission on the Future of Health Care in Canada.
71
Gupta, S. & Dokania, N.K. (2014) Predicting health of a project using metric generator. Confluence The Next Generation Information Technology Summit (Confluence), 5th International Conference.
Hulme, P.E. (2009) Trade, transport and trouble: managing invasive species pathways in an era of globalization. Journal of Applied Ecology, 46, 10-18.
Kelly, E. & Hurst, J. (2006) Health care quality indicators project: conceptual framework paper, OECD health working papers, No. 23, OECD Publishing, Paris.
Ladyman, J., Lambert, J. & Wiesner, K. (2013) What is a complex system? European Journal for Philosophy of Science, 3, 33-67.
Lamont, T., Barber, N., Pury, J.D., Fulop, N., Garfield-Birkbeck, S., Lilford, R., Mear, L., Raine, R. & Fitzpatrick, R. (2016) New approaches to evaluating complex health and care systems. BMJ, 352, i154.
Lauras, M., Marques, G. & Gourc, D. (2010) Towards a multi-dimensional project performance measurment system. Decision Support Systems, 48, 342-353.
Liu, S., Cook, D., Walker, I., Barry, S., White, B. & Paul, D.B. (2014) How do you measure biosecurity impact? Technical report, Plant Biosecurity Cooperative Research Centre, Department of Agriculture and Food, Western Australia.
Marchildon, G.P. (2013) Canada: Health system review. Health Systems in Transition, 2013, vol. 15, no. 1: pp. 1-179. World Health Organisation (WHO).
Matthews, K. (2011) A review of Australia’s preparedness for the threat of foot-and-mouth disease. Australian Government Department of Agriculture, Fisheries and Forestry, Canberra.
Ministry of Education (2016) The Ministry of Education annual report. Wellington, New Zealand.
Mittermeier, R.A., Robles Gil, P. & Mittermeier, C.G. (1997) Megadiversity: Earth’s Biologically Wealthiest Nations. Agrupacion Sierra Madre, Mexico City.
Mittermeier, R.A., Turner, W.R., Larsen, F.W., Brooks, T.M. & Gascon, C. (2011) Global biodiversity conservation: the critical role of hotspots. Biodiversity hotspots: distribution and protection of conservation priority areas (ed. by F.E. Zachos and J.C. Habel). Springer, Heidelberg.
Murray, C. & Frenk, J. (2000) A framework for assessing the performance of health systems. Bulletin of the World Health Organisation, 78, 717-731.
Nairn, M.E., Allen, P.G., Inglis, A.R. & Tanner, C. (1996) Australian quarantine, a shared responsibility. Department of Primary Industries and Energy, Canberra.
OECD (2015) Health at a Glance 2015: OECD Indicators. OECD Publishing, Paris.
Patton, M.Q. (2011) Developmental evaluation: applying complexity concepts to enhance innovation and use. Guilford Press, New York.
Peersman, G. (2017) Making the most of performance indicators. ANZSOG course, August 2017.
PHA (2008) Draft National Fruit Fly Strategy. Plant Health Australia, Canberra.
72
PHA (2012) National Plant Biosecurity Diagnostic Strategy. Plant Health Australia, Canberra.
PHA (2013) National Plant Biosecurity Surveillance Strategy 2013-2020. Plant Health Australia, Canberra.
PHA (2016) PLANTPLAN: Australian Emergency Plant Pest Response Plan, Version 3.0. Plant Health Australia, Canberra.
PHA (2017a) The national plant biosecurity status report. Plant Health Australia, Canberra.
PHA (2017b) Government and Plant Industry Cost Sharing Deed in respect of Emergency Plant Pest Responses. Plant Health Australia, Canberra.
PIMC (2008) Australian Veterinary Emergency Plan, AUSVETPLAN, Summary Document, Version 3.1. Primary Industries Ministerial Council, Canberra.
Productivity Commission (2013) On efficiency and effectiveness: some definitions. Staff Research Note, Canberra.
Shiell, A., Hawe, P. & Gold, L. (2008) Complex interventions or complex systems? Implications for health economic evaluation. BMJ, 336, 1281-1283.
Squires, D. & Anderson, C. (2015) U.S. Health care from a global perspective: spending, use of services, prices, and health in 13 countries. Issues in International Health Policy. October 2015 Update. The Commonwealth Fund.
State Services Commission and the Treasury (2008) Performance measurement advice and examples on how to develop effective frameworks. Wellington, New Zealand.
Susaeta, A., Adams, D.C., Carter, D.R. & Dwivedi, P. (2016) Climate change and ecosystem services output efficiency in southern loblolly pine forests. Environmental Management, 58, 417-430.
UNESCO (2016) Designing effective monitoring and evaluation of education systems for 2030: A global synthesis of policies and practices (preliminary version, not for quotation). United Nations Educational, Scientific and Cultural Organization.
USAID (2010) Performance monitoring and evaluation tips. Selecting performance indicators. Number 6, 2nd edition.
Victorian DEPI (2014) Biosecurity Evidence Framework (internal document). Victorian Department of Environment and Primary Industries.
Walton, M. (2014) Applying complexity theory: A review to inform evaluation design. Evaluation and Program Planning, 45, 119-126.
Walton, M. (2016) Expert views on applying complexity theory in evaluation: Opportunities and barriers. Evaluation, 22, 410-423.
Westhorp, G. (2012) Using complexity-consistent theory for evaluating complex systems. Evaluation, 18, 405-420.
World Health Organization (2009) Systems thinking, for health systems strengthening. Alliance for health policy and systems research.

73
Wu, J., Yin, P., Sun, J., Chu, J. & Liang, L. (2016) Evaluating the environmental efficiency of a two-stage system with undesired outputs by a DEA approach: An interest preference perspective. European Journal of Operational Research, 254, 1047-1062.
Productivity Commission 2013, On efficiency and effectiveness: some definitions, Staff
Research Note, Canberra.

74
8 Appendix A – ABARES Literature Review
Please refer to separate pdf file for the ABARES literature review on Australian public sector
agencies’ evaluation of system-wide health.