cces - denver climate study group · • unique industry–academia–government collaborations ......
TRANSCRIPT

Current CO2 Capture Technology Optionsand Advanced R&D Pathway Solutions
Jared Ciferno, Technology ManagerExisting Plants Program
CCESColorado Clean Energy
Solutions
Carbon Capture Rountable and Symposium
October 1, 2009

2
• Only government owned & operated DOE national lab• Dedicated to energy RD&D, domestic energy resources• Fundamental science through technology demonstration• Unique industry–academia–government collaborations
National Energy Technology LaboratoryWhere Energy Challenges Converge and Energy Solutions Emerge
West VirginiaPennsylvaniaOregon

3
Existing Coal
New CoalNatural Gas Petroleum
78% of year 2030 CO2
Emissions from
Existing Coal Plants
Values Calculated from Energy Information Administration’s Annual Energy Outlook ARRA Reference Case Scenario, AEO Does not consider PC with CCS
U.S. Electricity GenerationCO2 Emissions Forecast
Mill
ion
Met
ric T
ons
CO
2/Yea
r
3,000
2,500
2,000
1,500
1,000
500
02005 2010 2015 2020 2025 2030

4
CO2 Capture Experience
1930 19801970196019501940 20001990
Natural Gas SweeteningFood & Chemical Grade CO2
Gasifiers
Coal-Fired Boilers
HydrogenAmmonia
Hydrocarbon RefiningChemical Synthesis
DehydrationGas ProcessingAir Separation
NitrogenEnhanced Oil Recovery
Air SeparationChemical Plants
Carbon DioxideNatural Gas ProcessingEnhanced Oil Recovery
Time
Technology Enablers1. Comparatively small volumes
200 to 4,000 TPD CO2
2. High value products3. Specialized operating
environments
GAS ABSORPTIONPhysical Solvents
GAS ABSORPTIONChemical Solvents
GAS ADSORPTION
GAS SEPARATIONMEMBRANES

5
1. Scale-up• Current PC capture ~200 tons/day
• 550 MWe plant produces 13,000 tons/day
2. Energy Demand• 20% to 30% in power output
3. Cost• Increase Cost of Electricity (COE)
4. Regulatory framework• Transport — pipeline network
• Storage
Deployment Barriers for CO2 Capture on New and Existing Coal Plants Today

6
Fossil Energy CO2 Capture Options
Source: Cost and Performance Baseline for Fossil Energy Power Plants study, Volume 1: Bituminous Coal and Natural Gas to Electricity; NETL, May 2007.
Pulverized Coal (PC)Post-combustion
PC Oxy-combustion
Gasification (IGCC)Pre-combustion

7
Fossil Energy CO2 Capture Solutions
Time to Commercialization
Advanced physical solventsAdvanced chemical solventsAmmoniaCO2 com-pression
Amine solventsPhysical solventsCryogenic oxygen
Chemical loopingOTM boilerBiological processesIonic liquids
Metal organic frameworksEnzymatic membranes
Cos
t Red
uctio
n B
enef
it
PBI membranes Solid sorbentsMembrane systemsITMsBiomass co-firing
Post-combustion (existing, new PC)
Pre-combustion (IGCC)
Oxycombustion (new PC)
CO2 compression (all)
202020152010
OTM – O2 Transport Membrane (PC)ITM – O2 Ion Transport Membrane (PC or IGCC)

8
Supercritical PC Power PlantAmine Scrubbing CO2 Capture
Reference: Pulverized Coal Oxycombustion Power Plants—Volume 1 Bituminous Coal to Electricity, U.S. Department of Energy/National Energy Technology Laboratory, Revision 2 Final Report, August 2008
TPD: Short Ton per DayTPY: Short Ton per Year
*CO2 Capture Process Flow Diagram in Appendix
Amine scrubbing Advantages:• Proven Technology Petroleum
refining, NG purification• Chemical solvent High loadings at low
CO2 partial pressure• Relatively cheap chemical ($2-3/lb)• Tunable to 0 to 90+% capture
Steam: 3500 psig/1110°F/1150°FNOx: LNB, OFA and SCRSOx: Wet limestone FGDPM: Baghouse

9
0
5
10
15
20
25
30
35
40
45
50
Existing New 30% CO2Capture
50% CO2Capture
70% CO2Capture
90% CO2Capture
Net
Effi
cien
cy (%
HH
V)
33%
39%
35%
25 - 35%
31%28%
PC CO2 Capture Efficiency ImpactNew Plant, Bituminous Coal, Amine Scrubbing
Without CO2 Capture With CO2 Capture
CO2 Capture ’s New PC net efficiency by 4 to 12% pts.
CO2 Capture ’s New PC net efficiency by 4 to 12% pts.
References: Pulverized Coal Oxycombustion Power Plants—Volume 1 Bituminous Coal to Electricity, U.S. Department of Energy/National Energy Technology Laboratory, Revision 2 Final Report, August 2008
Integrated Environmental Control Model 2008

10
0
2
4
6
8
10
12
Existing New 30% CO2Capture
50% CO2Capture
70% CO2Capture
90% CO2Capture
Cos
t of E
lect
ricity
(cen
ts/k
wh)
PC CO2 Capture COE ImpactNew Plant, Bituminous Coal, Amine Scrubbing
Without CO2 Capture With CO2 Capture
References: Pulverized Coal Oxycombustion Power Plants—Volume 1 Bituminous Coal to Electricity, U.S. Department of Energy/National Energy Technology Laboratory, Revision 2 Final Report, August 2008
Integrated Environmental Control Model 2008
CO2 Capture ’s Existing COE by ~ 4 — 5X
CO2 Capture ’s Existing COE by ~ 4 — 5X
To Match CA Proposed 1,100 lb/MWhTo Match CA Proposed 1,100 lb/MWh
To Match New NGCC 800 lb/MWh ~ 65% CaptureTo Match New NGCC 800 lb/MWh ~ 65% Capture
TPC ~ $1,600/kW TPC ~ $2,300 - $2,900/kW

11
Advanced Solvent R&D Focus High CO2 loading capacity Minimize regeneration energy Fast reaction kinetics Non-corrosive No solvent degradation Low cost
Advanced CO2 Solvents
Project Types• Ionic liquids• Novel high capacity oligomers• Potassium carbonate/enzymes• CO2 capture additives
Partners (5 Projects): University of Notre Dame, Georgia Tech., Illinois St. Geological Survey, GE Research Corporation, Lawrence Berkeley Nat. Lab
DesignNew compounds with lower heats
of reaction
New compounds with lower heats
of reaction
1,1-di-isopropyl JEFFAMINE
Heat of reaction = -9.4kcal/mol
1,1-di-isopropyl MEA
Heat of reaction = -10.4kcal/mol
R RNH2+CO2
0.0
Complex TS1
Carbamiczwitterions
+ RNH2
Complex2 TS2
Carbamate
HOCH2
H2C
N
OC O
HH
HOCH2
H2C
N
OC O
HH
HOCH2
H2C
N
OC
O
HH
OHH2C
CH2N
H H
HOCH2
H2C
N
OC
O
H
OHH2C
CH2N
H
HH
-2.1 (-2.6) [-2.4]-2.3 (-3.1) [-4.2]
-8.8 (-12.6)[-14.7]
-15.9 (-20.2)[-20.4]
-1.3 (-2.0)[-2.4]
-7.4 (-9.3) [-12.3]
¦¤E (Kcal/mol)
Italcs for JEFFAMINE ( ) for MEA[ ] for Methylamine
The results from the B3LYP/6-31G(d) level using CPCM model
Reaction pathway computed from density functional theory
DesignNew compounds with lower heats
of reaction
New compounds with lower heats
of reaction
1,1-di-isopropyl JEFFAMINE
Heat of reaction = -9.4kcal/mol
1,1-di-isopropyl MEA
Heat of reaction = -10.4kcal/mol
R RNH2+CO2
0.0
Complex TS1
Carbamiczwitterions
+ RNH2
Complex2 TS2
Carbamate
HOCH2
H2C
N
OC O
HH
HOCH2
H2C
N
OC O
HH
HOCH2
H2C
N
OC
O
HH
OHH2C
CH2N
H H
HOCH2
H2C
N
OC
O
H
OHH2C
CH2N
H
HH
-2.1 (-2.6) [-2.4]-2.3 (-3.1) [-4.2]
-8.8 (-12.6)[-14.7]
-15.9 (-20.2)[-20.4]
-1.3 (-2.0)[-2.4]
-7.4 (-9.3) [-12.3]
¦¤E (Kcal/mol)
Italcs for JEFFAMINE ( ) for MEA[ ] for Methylamine
The results from the B3LYP/6-31G(d) level using CPCM model
Reaction pathway computed from density functional theory
Solvent Screening and Synthesis
Recent chemical formulations show: 50% increase capacity vs. MEA < 48% increase in COE
Laboratory-scale
Source: Novel High Capacity Oligomers for Low Cost CO2 Capture, GE Global Research, GE Energy, University of PittsburghAnnual NETL CO2 Capture Technology for Existing Plants R&D Meeting, March 24-26, 2009

12
Advanced Sorbent R&D Focus • High CO2 loading capacity• Minimize regeneration energy• Fast reaction kinetics• Durable
- Thermally & chemically stable• Gas/solid systems
- Low pressure drop, heat management
Solid CO2 Sorbents
Partners (6 Projects): RTI, UOP, University of Akron, ADA, SRI, TDA
Project Types• Sorbent systems development• Carbonates• Metal organic frameworks• Metal zeolites
Advantages• Low regeneration energy (no water,
low heat capacity, low heat of reaction)
• High equilibrium capacity—high surface area
• Fast kinetics
Challenges• System design
- Pressure drop- Heat integration- Solid transport
• Durability (attrition, chemical stability)
Laboratory-scale

13
Advanced Membrane R&D Focus• High CO2/N2 selectivity & permeability• Durability
- Chemically (SO2), thermally- Physically
• Membrane systems - Process design critical
• Low cost - Capital and energy penalty
CO2 Membranes
Partners: MTR, RTI
Advantages• Simple operation; no chemical reactions, no
moving parts
• Tolerance to high levels of wet acid gases
• Compact and modular with a small footprint
• Relatively low energy use; no additional water used (recovers water from flue gas)
Challenges• Low flue gas CO2 partial pressure
• Particulate matter and potential impact on membrane life
• Cost reduction and device scale-up
• Power plant integration (e.g. sweep gas)
10
20
30
40
50
60
100 1,000 10,000
CO2/N2selectivity
CO2 permeance (gpu)
PolarisTM
Target area identified from
design calculations
Commercial CA membranes
1 TPD CO2 , 6 month testLaboratory to Pilot-scale

14
Pulverized Coal Oxy-combustion
Coal + O2 CO2 + H2OCoal + O2 CO2 + H2O
Reference: Pulverized Coal Oxycombustion Power Plants—Volume 1 Bituminous Coal to Electricity, U.S. Department of Energy/National Energy Technology Laboratory, Revision 2 Final Report, August 2008
PC Oxy-combustion Advantages:• 1st generation plants with existing cryogenic ASU cost
competitive with conventional scrubbing• Plant vs. unit operation—multiple cost reduction
opportunities• Co-sequestration options• Applicable to new and existing PC power plants

15
Pulverized Coal Oxy-combustionAdvanced Oxy-combustion R&D Focus• New oxyfuel boilers
- Advanced materials and burners- Corrosion
• Retrofit existing air boilers- Air leakage, heat transfer, corrosion - Process control
• Low-cost oxygen • CO2 purification • Co-capture (CO2 + SOx, NOx, O2)
Challenges• Existing cryogenic ASUs are capital and energy
intensive
• Excess O2 and inerts (N2, Ar) CO2 purification cost
• Existing boiler air infiltration
• Corrosion and process control
Partners (11 projects): Praxair, Air Products, Jupiter, Alstom, B&W, Foster Wheeler, REI, SRI
0
10
20
30
40
50
60
70
Perc
ent I
ncre
ase
in C
OE
Trans., Stor., & Monit.Compression CapitalASU CapitalCompression PowerASU Power
Parasitic Power COE by 37%
Capital Cost COE by 29%
Laboratory to 5 MWe Pilot-scaleNo-capture base = 6.4 cents/kWh

16
Chemical Looping Combustion
Key Challenges• Solids transport• Heat Integration
Key Partners (2 projects): Alstom Power (Limestone Based), Ohio State (Metal Oxide)
Status2010 Alstom Pilot test (1 MWe) 1000 lb/hr coal flow 1st Integrated operation 1st Autothermal Operation
Red
Ox
Me
Air
Fuel CO2 + H2O
MeO
N2 + O2
Steam
Fuel Reactor (Reducer)
Air Reactor (Oxidizer)Oxy-Firing without Oxygen Plant
Solid Oxygen Carrier circulates between Oxidizer and Reducer
Oxygen Carrier: Carries Oxygen, Heat and Fuel Energy
Carrier picks up O2 in the Oxidizer, leaves N2 behind
Carrier Burns the Fuel in the Reducer
Heat produces Steam for Power

17
Perc
ent I
ncre
ase
in C
OE
ADVANCEDUltra-Supercritical
Cryogenic ASU
ADVANCEDAdv. Boiler
O2 MembraneAdv. Materials
Co-SequestrationUltra-Supercritical
ADVANCEDChemical Looping or
Ultra-SupercriticalAdv. Boiler
Adv. MaterialsCo-Sequestration
O2 Membrane
Supercritical OxyfuelCryogenic ASU
AmineScrubbing
Reference: Pulverized Coal Oxycombustion power Plants, U.S. Department of Energy/National Energy Technology Laboratory, Final Report, August 2008
PC Oxy-combustion Pathway
2009 2015 2017 2019 2020-2025
Steam Conditions (psig/oF/oF)Supercritical: 3,500/1,110/1,150 Ultra-supercritical: 4,000/1,350/1,400Note: As of 2009, most advanced cycles are in Japan . Example (3,685/1,120/1,115)

18
IGCC Power PlantWith Pre-combustion SelexolTM CO2 Scrubbing
IGCC CO2 Capture Advantages:1. High PCO22. Low Volume Syngas Stream
SelexolTM CO2 Capture Advantages:1. Physical Liquid Sorbent2. Highly selective for H2S and CO23. CO2 is produced at “some” pressure4. 30+ years of commercial operation (55
worldwide plants)TPD: Short Ton per DayTPY: Short Ton per Year (at 80% Capacity Factor)
1See Appendix for further design conditions: Coal type, Plant Location,Financial Criteria, etc.
References: Cost and Performance Baseline for Fossil Energy Power Plants--Volume 1 Bituminous Coal to Electricity, U.S. Department of Energy/National Energy Technology Laboratory, Final Report, May 2007

19
0
5
10
15
20
25
30
35
40
45
50
Existing PC New IGCC 40% CO2Capture
60% CO2Capture
70% CO2Capture
90% CO2Capture
Net
Effi
cien
cy (%
HH
V)
35%
39%
36%25 - 35%
34%32%
IGCC CO2 Capture Efficiency ImpactNew Plant, Bituminous Coal, Selexol Scrubbing
Without CO2 Capture With CO2 Capture
CO2 Capture ’s New IGCC net efficiency by 3 to 8% pts.CO2 Capture ’s New IGCC
net efficiency by 3 to 8% pts.
References: Cost and Performance Baseline for Fossil Energy Power Plants--Volume 1 Bituminous Coal to Electricity, U.S. Department of Energy/National Energy Technology Laboratory, Final Report, May 2007
Evaluation of Alternate Water Gas Shift Configurations for IGCC Systems, Draft Internal Report,, December 2007
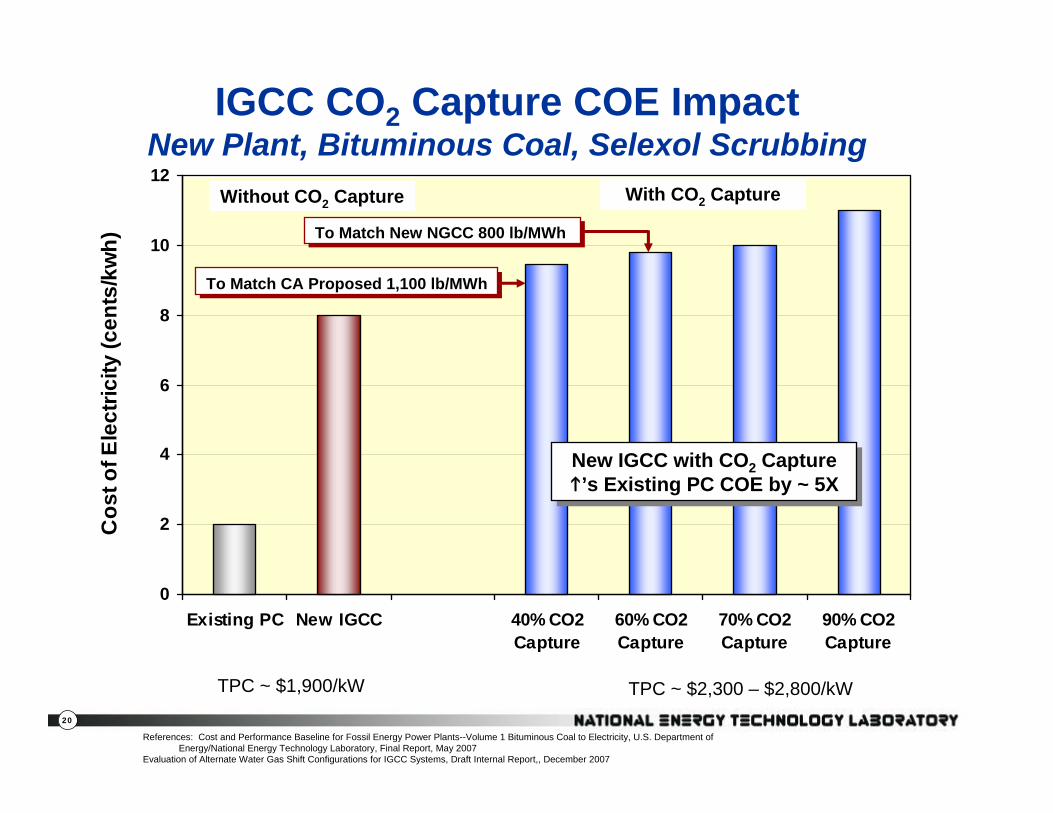
20
0
2
4
6
8
10
12
Existing PC New IGCC 40% CO2Capture
60% CO2Capture
70% CO2Capture
90% CO2Capture
Cos
t of E
lect
ricity
(cen
ts/k
wh)
IGCC CO2 Capture COE ImpactNew Plant, Bituminous Coal, Selexol Scrubbing
Without CO2 Capture
New IGCC with CO2 Capture ’s Existing PC COE by ~ 5X New IGCC with CO2 Capture ’s Existing PC COE by ~ 5X
To Match CA Proposed 1,100 lb/MWhTo Match CA Proposed 1,100 lb/MWh
To Match New NGCC 800 lb/MWh To Match New NGCC 800 lb/MWh
References: Cost and Performance Baseline for Fossil Energy Power Plants--Volume 1 Bituminous Coal to Electricity, U.S. Department of Energy/National Energy Technology Laboratory, Final Report, May 2007
Evaluation of Alternate Water Gas Shift Configurations for IGCC Systems, Draft Internal Report,, December 2007
TPC ~ $1,900/kW TPC ~ $2,300 – $2,800/kW
With CO2 Capture

21
IGCC Pre-combustion CO2 Capture Technologies
IGCC CO2 Capture Advantages:1. High pressure gas stream (High PCO2)2. Low Volume Syngas Stream
CO2 Capture Challenges:1. Integrated power cycles—system
complexity2. Additional water-gas-shift process
10 new projects in 2009• H2/CO2 Membranes
• Solid Sorbents• Advanced Solvents
10 new projects in 2009• H2/CO2 Membranes
• Solid Sorbents• Advanced Solvents

22
Recent Meeting Presentations
http://www.netl.doe.gov/publications/index.html

23
NETL website:www.netl.doe.gov
Annual CO2 Capture Meeting
Jared P. CifernoTechnology Manager, Innovation for Existing PlantsNational Energy Technology LaboratoryU. S. Department of Energy(Tel) 412 [email protected]
Office of Fossil Energy website:ww.fe.doe.gov
For More Information About the NETL Existing Plants Program
Reference Shelf
24
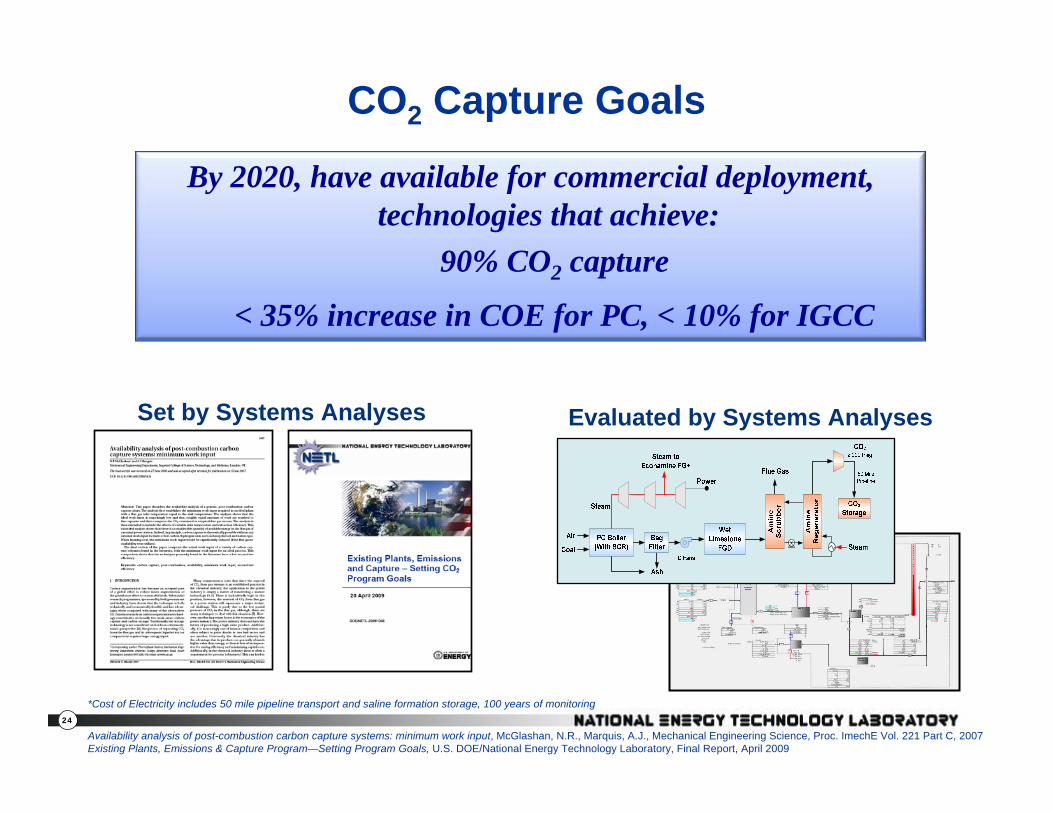
CO2 Capture Goals
By 2020, have available for commercial deployment, technologies that achieve:
90% CO2 capture
< 35% increase in COE for PC, < 10% for IGCC
*Cost of Electricity includes 50 mile pipeline transport and saline formation storage, 100 years of monitoring
Availability analysis of post-combustion carbon capture systems: minimum work input, McGlashan, N.R., Marquis, A.J., Mechanical Engineering Science, Proc. ImechE Vol. 221 Part C, 2007Existing Plants, Emissions & Capture Program—Setting Program Goals, U.S. DOE/National Energy Technology Laboratory, Final Report, April 2009
Set by Systems Analyses Evaluated by Systems Analyses

25
RD&D Timeline to Commercial Deployment
20102008 20162012 2020 2024
Pilot-Scale Field Testing0.5 — 5 MWe
Large-Scale Field Testing5 — 25 MWe
CommercialDeployment
Laboratory-Bench Scale R&D
Large Demonstrations (CCPI) 100+ MWe
*Solvents
*O2 Membrane (2011)
*CO2 Membrane (2012)
*O2 Membrane (2016)*CLC (2016)
*Solvents/Sorbents
- NCCC- Utility sites

26
CO2 Capture from New Coal Plants
2007 “NETL Baseline Study”• Bituminous Coal• ~550 MW net• Subcritical, Supercritical PC• 3 IGCC Types• Selexol and Amine CO2 Capture
2007
2008 “NETL Oxyfuel Study”• Bituminous Coal• 577 MW gross• Supercritical, Ultra-Supercritical P• Cryogenic and Membrane ASU• CO2 Purification Analysis
2008
Source: Cost and Performance Baseline for Fossil Energy Power Plants study, Volume 1: Bituminous Coal and Natural Gas to Electricity; NETL, May 2007.
Source: Pulverized Coal Oxycombustion Power Plants—Volume 1 Bituminous Coal to Electricity, U.S. Department of Energy/National Energy Technology Laboratory, Revision 2 Final Report, August 2008

27
http://www.netl.doe.gov/technologies/carbon_seq/Resources/Analysis/
CO2 Capture from Existing PC Plants
Carbon Dioxide Capture from Existing Coal-Fired Power Plants, U.S. Department of Energy-National Energy Technology Laboratory, Revised Final Report, November 2007
• AEP Plant, Conesville Ohio• Bituminous Coal• 30 Yr. old subcritical PC Plant• 463 MW gross• ESP and Wet Lime FGD• 30, 50, 70 and 90% Capture
2007
• Jim Bridger, Sweetwater Wy• Subcritical PC on PRB coal• 6,700 ft elevation• 577 MW gross• ESP and Wet Soda Ash FGD• 62% and 90% CO2 Capture
2008

28
CO2 Capture Process

29
0
10
20
30
40
50
60
70
80
90Pe
rcen
t Inc
reas
e in
CO
E
Trans., Stor., & Monit.Compression CapitalCapture CapitalCapture OperatingCapture SteamCapture Aux. PowerCompression power
13%
11%
28%
7%
20%
5%2%
Parasitic Power COE by 52%
Operating Cost COE by 7%
Capital Cost COE by 27%
*No Capture Base = 64 mills/kWh*90% CO2 Capture*Compression to 2,200 Psia*50 Mile Pipeline + Saline Formation Storage + 100 Years Monitoring
Source: Cost and Performance Baseline for Fossil Energy Power Plants study, Volume 1: Bituminous Coal and Natural Gas to Electricity; NETL, May 2007.
CO2 Capture Cost of Electricity ImpactNew Plant, Bituminous Coal, Amine Scrubbing

30
CO2 Capture Cost of Electricity ImpactNew Plant, Bituminous Coal, Oxy-combustion
Reference: Pulverized Coal Oxycombustion Power Plants—Volume 1 Bituminous Coal to Electricity, U.S. Department of Energy/National Energy Technology Laboratory, Revision 2 Final Report, August 2008
0
10
20
30
40
50
60
70Pe
rcen
t Inc
reas
e in
CO
E
Trans., Stor., & Monit.Compression CapitalASU CapitalCompression PowerASU Power
24%
13%
20%
5%
4%
Parasitic Power COE by 37%
Capital Cost COE by 29%
*No-capture Base = 64 mills/kWh*90% CO2 Capture*Compression to 2,200 Psia*50 Mile Pipeline + Saline Formation Storage + 100 Years Monitoring

31
0
5
10
15
20
25
30
35
40
45
50
Existing New MEA Capture Oxycombustion
Net
Effi
cien
cy (%
HH
V) 39% 25 - 35%
28% 29%
PC Oxycombustion Efficiency ImpactNew Plant, Bituminous Coal
Without CO2 Capture With 90% CO2 Capture
References: Pulverized Coal Oxycombustion Power Plants—Volume 1 Bituminous Coal to Electricity, U.S. Department of Energy/National Energy Technology Laboratory, Revision 2 Final Report, August 2008
Integrated Environmental Control Model 2008
TPC ~ $1,600/kW TPC ~ $2,600 - $2,900/kW

32
0
2
4
6
8
10
12
Existing New MEA Capture Oxycombustion
Cos
t of E
lect
ricity
(cen
ts/k
wh)
PC Oxycombustion COE ImpactNew Plant, Bituminous Coal
Without CO2 Capture With 90% CO2 Capture
References: Pulverized Coal Oxycombustion Power Plants—Volume 1 Bituminous Coal to Electricity, U.S. Department of Energy/National Energy Technology Laboratory, Revision 2 Final Report, August 2008
Integrated Environmental Control Model 2008

33
Oxy-Combustion Pilot with CO2 Purification
Alstom Power
Flue GasAir Products
CO2 Purification Slip-Stream Test:• 2-stage compression/purification • Removes SOx, NOx, O2, & Inerts

34
Chemical Looping Combustion
AshCoolers (6)
SolidsHeater
SealpotControlValves (2)
2-StageCyclones (2)
SprayCoolers &Filters (5)
ReducerOxidizer
ProductGasBurner
Challenges• Solids transport• Heat Integration
Key Partners (2 projects): Alstom Power (Limestone Based), Ohio State (Metal Oxide)
Cold Flow Modeling Completed
Kinetic Rates ExceedDesign Requirements
2010 Alstom Pilot test (1 MWe) 1000 lb/hr coal flow 1st Integrated operation 1st Autothermal Operation