cbp performance and accountability report fiscal year 2014
TRANSCRIPT

Performance and Accountability ReportFiscal Year 2014

This page intentionally left blank.

Vigilance is how we ensure the safety of all Americans. We are continuously
watchful and alert to deter, detect, and prevent threats to our Nation. We demonstrate courage and valor in the
protection of our Nation.
Service to country is embodied in the work we do. We are dedicated to defending and upholding the Constitution and the laws of the
United States. The American people have entrusted us to protect the homeland and defend liberty.
Integrity is our cornerstone. We are guided by the highest ethical and
moral principles. Our actions bring honor to ourselves and our Agency.
Vigilence Service To Country Integrity
Core Values
To safeguard America’s borders thereby protecting the public from dangerous people and materials while enhancing the Nation’s global economic competitiveness by enabling legitimate trade and travel.
Mission Statement:
Performance and Accountability Report

This page intentionally left blank.

2014 Performance and Accountability Report • U.S. Customs and Border Protection 12014 Performance and Accountability Report • U.S. Customs and Border Protection
About This Report The United States (U.S.) Customs and Border Protection (CBP) Fiscal Year (FY) 2014 Performance and Accountability Report (PAR) combines CBP’s Annual Performance Report with its audited financial statements, assurances on internal control, accountability reporting, and Agency assessments. CBP’s PAR provides program, financial, and performance information that enables Congress and the public to assess its performance as it relates to the CBP mission.
The CBP PAR discusses the Agency’s strategic goals and objectives and compares its performance targets to actual performance results. The CBP PAR satisfies the reporting requirements of the Reports Consolidation Act of 2000 (Pub. L. No. 106-531), Government Performance and Results Modernization Act of 2010, Chief Financial Officers Act of 1990 (Public Law No. 101-576), Office of Management and Budget (OMB) Circular No. A-136, Financial Reporting Requirements dated September 18, 2014, and other financial management statutes and reports.
The CBP PAR summarizes the Agency’s major mission strategies (i.e. programs and initiatives) under our strategic goals and objectives, as outlined in CBP’s revised strategic plan – CBP Vision and Strategy 2020. Additional information related to specific programs, initiatives, tools, and resources to achieve Agency goals and objectives are in the body of the U.S. Department of Homeland Security (DHS) Congressional Budget Justification for the President’s Budget, which details information by DHS component.
CBP’s FY 2014 PAR and the Summary of Performance and Financial Information will be located on www.cbp.gov after publication.
For more information:U.S. Customs and Border ProtectionOffice of Administration1331 Pennsylvania Avenue, NW, Suite 950Washington, DC 20229-1103
Follow us on:https://twitter.com/CustomsBorderhttps://www.linkedin.com/company/2997?trk=tyahhttps://www.youtube.com/user/customsborderprotecthttps://www.flickr.com/photos/cbpphotos/
Email updates: https://public.govdelivery.com/accounts/USDHSCBP/subscriber/new
U.S. Customs and Border Protection • 2014 Performance and Accountability Report2 U.S. Customs and Border Protection • 2014 Performance and Accountability Report
CBP At A Glance
Established 2003
HeadquartersRonald Reagan Building1300 Pennsylvania Avenue NW, Washington, DC 20004
Commissioner R. Gil Kerlikowske
2014 Total Employees Approximately 60,000
2014 Annual Budget $13.9 billion
ForewordCBP is part of the DHS. By directives, OMB, which implements the Chief Financial Officers Act of 1990, requires CBP to prepare financial statements separate from those of DHS. CBP consolidates key data and information and provides this to DHS to incorporate into its corresponding reports. Although CBP is not required to prepare a separate Annual Financial Report or PAR, the Agency can better demonstrate accountability by presenting performance, management, and financial information using the same statutory and guidance framework used by DHS. For this reason, CBP has produced its own PAR since FY 2003.
CBP’s FY 2014 PAR provides an overview of the Agency’s financial and performance data to help Congress, the President, and the public assess its performance and stewardship of resources. CBP strives to raise the bar with top performance and financial accountability and help DHS and the Federal Government excel in providing high-quality services and products to American taxpayers.
This report and reports from prior years are available on the CBP website at www.cbp.gov.
Links to previous year’s PARs
FY 2010 PAR FY 2011 PAR FY 2012 PAR FY 2013 PAR
CBP At A Glance
2014 Performance and Accountability Report • U.S. Customs and Border Protection 32014 Performance and Accountability Report • U.S. Customs and Border Protection
Table of Contents
1Introduction1 About This Report2 CBP At A Glance
3 Table of Contents 4 Message from the Commissioner
5Management’s Discussion and Analysis6 Overview of CBP8 CBP Statistical Highlights9 CBP Organization15 CBP’s Integrated Planning Framework16 CBP’s Strategic Goals18 Goal 1 Advance National Security and
Public Safety29 Goal 2 Enhance U.S. Economic
Competitiveness by Enabling Lawful Trade and Travel
38 Goal 3 Advance Comprehensive Border Security and Management
49 Goal 4 Promote Organizational Integration, Innovation, and Agility
56 Looking Ahead57 Performance Goals and Results60 FY 2014 Performance by CBP Strategic Goal 62 Management Assurances63 Financial Management
67Performance Section68 Performance Summary
79Financial Section80 Message from the Chief Financial Officer81 Financial Statements89 Notes to Financial Statements117 Required Supplementary Information
123 Auditors’ Report
147Other Information162 Office of Inspector General (OIG) Report on
Major Management Challenges163 Acronyms
Table of Contents

U.S. Customs and Border Protection • 2014 Performance and Accountability Report4 U.S. Customs and Border Protection • 2014 Performance and Accountability Report
Message from the Commissioner
I am pleased to present the Fiscal Year (FY) 2014 Performance and Accountability Report (PAR) for U.S. Customs and Border Protection (CBP). As the guardians of our Nation’s borders, CBP protects the public from dangerous people and materials while facilitating legitimate international travel and trade that is vital to our Nation’s economy.
CBP’s approximate 60,000 dedicated employees led the way in making America a secure and prosperous Nation during FY 2014, overseeing more than 6,900 miles of land borders and 95,000 miles of shorelines. We made significant progress in border security, including increases in illegal narcotics seized and illegal aliens apprehended.
We increased our collaboration with Federal, state, local, tribal, and international partners using a “whole of government” approach to combat individuals and criminal organizations who threaten communities on both sides of the border.
The FY 2014 PAR discusses our challenges, accomplishments, performance results, and financial information, and highlights a few success stories in serving as the premier law enforcement agency.
As an organizational component of the Department of Homeland Security, CBP is not required to prepare a separate PAR; however, as the second largest revenue collector in the Federal government, we owe the public we serve transparency in our stewardship responsibilities. We increased our total revenue by 6.4 percent to $43.5 billion during FY 2014 while facilitating more efficient trade and travel through Trusted Traveler and Trusted Trader programs.
Our goals of the past year, discussed further in the PAR, were based on an integrated planning framework. Beginning in 2014, and carrying through FY 2015, I have revised the framework to focus our efforts to:
� Advance National Security and Public Safety
� Enhance U.S. Economic Competitiveness by Enabling Lawful Trade and Travel
� Advance Comprehensive Border Security and Management
� Promote Organizational Integration, Innovation, and Agility
The goal of the PAR remains to provide Congress and the American public with timely, reliable, and useful financial information and to illustrate the value and impact of CBP’s contributions to U.S. prosperity and security. This same in formation, in the hands of CBP managers, enables them to make sound business decisions to improve our processes and increase our efficiency and effectiveness as we execute our vital missions.
R. Gil KerlikowskeCommissioner
Message from the Commissioner

Management’s Discussion and AnalysisThis section explains CBP’s mission, organization structure, strategic direction, and summarizes program and financial performance.

6 U.S. Customs and Border Protection • 2014 Performance and Accountability Report
Overview of CBP
Following legislation to establish DHS by the Homeland Security Act of 2002, CBP was formed by merging the U.S. Customs Service, the U.S. Border Patrol, the U.S. Department of Agriculture’s Animal and Plant Health Inspection Service, and major elements of the U.S. Immigration and Naturalization Service, including the Immigration Inspection Program. Later, CBP added the Air and Marine Operations Division from U.S. Immigration and Customs Enforcement, and most recently, select functions of DHS’ former U.S. Visitor and Immigration Status Indicator Technology (US-VISIT). As the resulting federal law enforcement agency, CBP provides far greater operational capability than the sum of its parts.
Over the past 12 years, CBP’s greatest strength has come from its diverse workforce with a breadth of experiences. CBP plays a crucial role in supporting its interdepartmental partners and the President’s National Security Strategy by safeguarding and managing America’s borders, maintaining domain awareness to prevent terrorist attacks, intercepting malicious actors and materials, and enforcing U.S. laws at our borders. CBP develops partnerships with public and private sectors and the international community to enhance its responsiveness and unwavering commitment to safety, security, and prosperity.
CBP’s culture is a reflection of its collective history, which is captured in our proclaimed values of vigilance, service to country, and integrity. These core values unify the individual histories and cultures across the Agency. They drive a shared purpose by uniting the beliefs and behaviors of all CBP employees. CBP uses these core values to promote the health and strength of its culture to ensure unity and mission success.
CBP’s MissionWe are the guardians of our Nation’s borders. We are America’s frontline. We safeguard the American homeland at and between our borders.
We protect the American public against terrorists and the instruments of terror.
We steadfastly enforce the laws of the United States while fostering our Nation’s economic security through lawful international trade and travel.
We serve the American public with vigilance, integrity, and professionalism.
CBP’s approximate 60,000 employees manage, control, and protect the Nation’s borders at and between 328 ports of entry. CBP is responsible for protecting more than 5,000 miles of border with Canada, 1,900 miles of border with Mexico, and 95,000 miles of shoreline. While CBP’s missions are complex and diverse, the principal operational requirements can be summarized in three distinct and mutually supporting themes:
� Protect the American people;
� Protect the national economy; and
� Safeguard and manage the U.S. air, land, and maritime borders.
The men and women of CBP pursue these mission themes every day as they safeguard America at its borders with vigilance, selfless service, and unyielding integrity.
Overview of CBP

72014 Performance and Accountability Report • U.S. Customs and Border Protection
CBP’s VisionTo serve as the premier law enforcement agency enhancing the Nation’s safety, security, and prosperity through collaboration, innovation, and integration.
CBP aspires to be a global leader in promoting strong security and trade partnerships that foster a safe, secure, and prosperous America and global community. Through an unyielding commitment to safeguard America’s borders while enhancing global economic competitiveness, CBP’s vision advances the following strategic themes:
� Collaboration - CBP’s complex mission requires it to serve as a global leader in providing border security and expanding strategic partnerships. Improved collaboration throughout CBP and with its stakeholders provides a shared sense of purpose, enhanced understanding of the operating environment, increased trust, and complementary engagement.
� Innovation - CBP must remain innovative to continually advance and transform the Agency into a more agile and adaptable organization. By understanding the evolving global challenges and opportunities in trade, security, and immigration, CBP leverages science, technology, and technological innovation to ensure optimal performance.
� Integration – CBP must develop a seamless global network to integrate border enforcement capabilities within a constantly evolving landscape. A unified CBP with a shared identity and culture promotes a fully-integrated, agile, and adaptable workforce. Integration enables CBP to better leverage enforcement resources through national “whole of government” and international “unity of effort” approaches.
Overview of CBP
8 U.S. Customs and Border Protection • 2014 Performance and Accountability Report
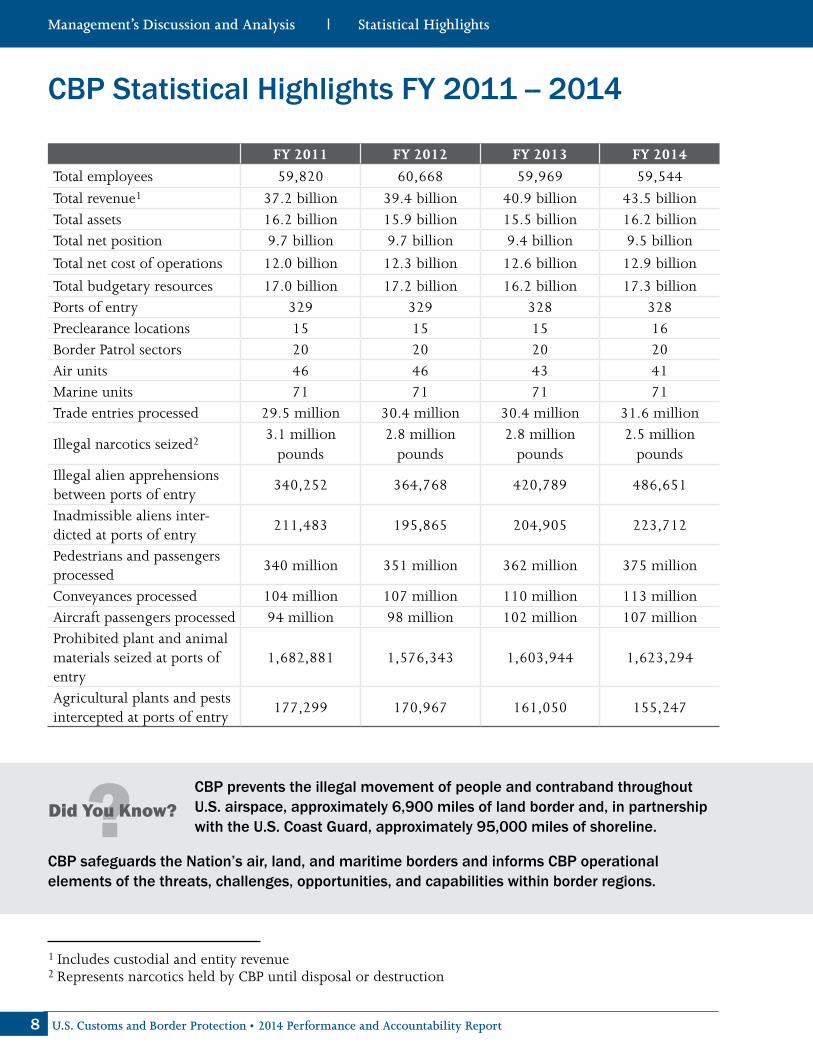
CBP Statistical Highlights FY 2011 -- 2014
FY 2011 FY 2012 FY 2013 FY 2014
Total employees 59,820 60,668 59,969 59,544
Total revenue1 37.2 billion 39.4 billion 40.9 billion 43.5 billionTotal assets 16.2 billion 15.9 billion 15.5 billion 16.2 billionTotal net position 9.7 billion 9.7 billion 9.4 billion 9.5 billion
Total net cost of operations 12.0 billion 12.3 billion 12.6 billion 12.9 billion
Total budgetary resources 17.0 billion 17.2 billion 16.2 billion 17.3 billionPorts of entry 329 329 328 328Preclearance locations 15 15 15 16Border Patrol sectors 20 20 20 20Air units 46 46 43 41Marine units 71 71 71 71Trade entries processed 29.5 million 30.4 million 30.4 million 31.6 million
Illegal narcotics seized2 3.1 million pounds
2.8 million pounds
2.8 million pounds
2.5 million pounds
Illegal alien apprehensions between ports of entry
340,252 364,768 420,789 486,651
Inadmissible aliens inter-dicted at ports of entry
211,483 195,865 204,905 223,712
Pedestrians and passengers processed
340 million 351 million 362 million 375 million
Conveyances processed 104 million 107 million 110 million 113 millionAircraft passengers processed 94 million 98 million 102 million 107 millionProhibited plant and animal materials seized at ports of entry
1,682,881 1,576,343 1,603,944 1,623,294
Agricultural plants and pests intercepted at ports of entry
177,299 170,967 161,050 155,247
CBP prevents the illegal movement of people and contraband throughout U.S. airspace, approximately 6,900 miles of land border and, in partnership with the U.S. Coast Guard, approximately 95,000 miles of shoreline.
CBP safeguards the Nation’s air, land, and maritime borders and informs CBP operational elements of the threats, challenges, opportunities, and capabilities within border regions.
1 Includes custodial and entity revenue2 Represents narcotics held by CBP until disposal or destruction
Statistical Highlights
92014 Performance and Accountability Report • U.S. Customs and Border Protection
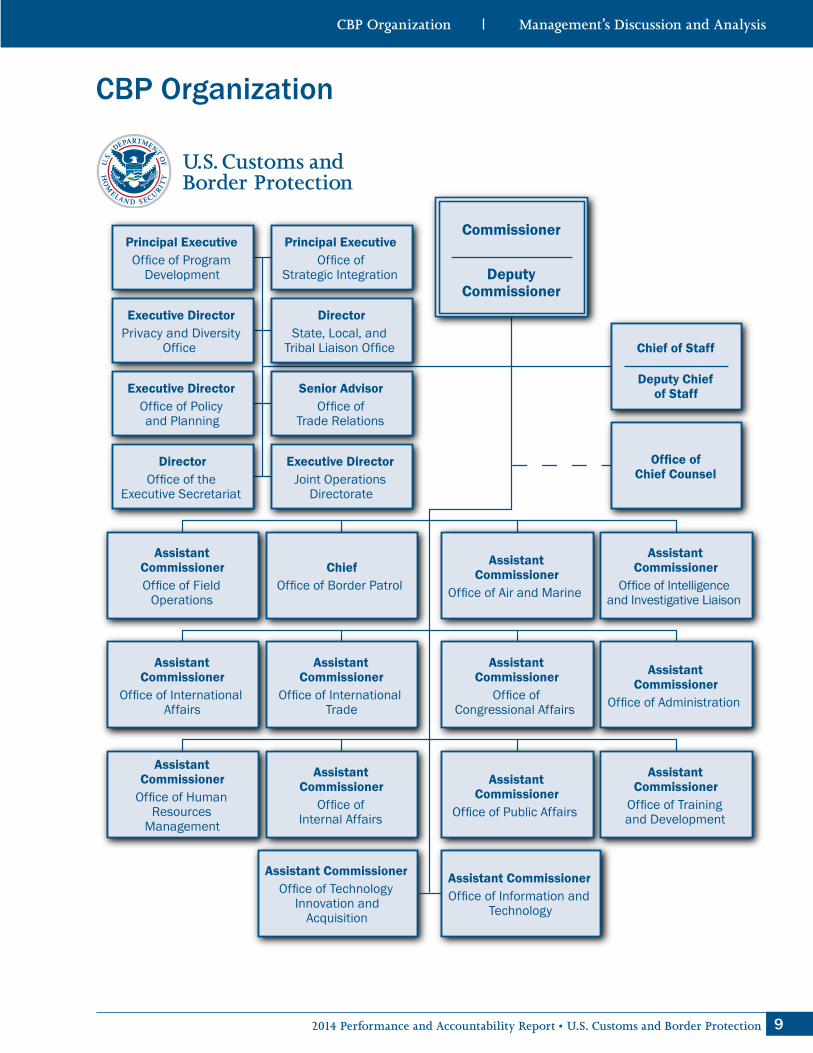
CBP Organization
Executive DirectorOffice of Policy and Planning
Executive DirectorPrivacy and Diversity
Office
Assistant CommissionerOffice of Field
Operations
ChiefOffice of Border Patrol
Assistant Commissioner
Office of Air and Marine
Assistant Commissioner
Office of Intelligence and Investigative Liaison
Senior AdvisorOffice of
Trade Relations
DirectorOffice of the
Executive Secretariat
Office of Chief Counsel
Chief of Staff
Deputy Chief of Staff
Assistant Commissioner
Office of International Affairs
Assistant Commissioner
Office of International Trade
Assistant Commissioner
Office of Congressional Affairs
Assistant Commissioner
Office of Administration
Assistant Commissioner
Office of Human Resources
Management
Assistant Commissioner
Office of Internal Affairs
Assistant Commissioner
Office of Public Affairs
Assistant Commissioner
Office of Training and Development
Assistant CommissionerOffice of Technology
Innovation and Acquisition
Assistant CommissionerOffice of Information and
Technology
Executive DirectorJoint Operations
Directorate
Principal ExecutiveOffice of
Strategic Integration
DirectorState, Local, and
Tribal Liaison Office
Principal ExecutiveOffice of Program
Development
Commissioner
Deputy Commissioner
CBP Organization

10 U.S. Customs and Border Protection • 2014 Performance and Accountability Report
CBP Offices
Headquarters
Office of the Commissioner: The Commissioner is responsible for securing, managing, and controlling the Nation’s borders by advancing CBP’s mission by preventing terrorists and terrorist weapons from entering the U.S. while facilitating legitimate trade and travel.
Deputy Commissioner: The Deputy Commissioner provides leadership and executive-level direction on CBP’s day-to-day operations, including oversight of Agency initiatives that facilitate the international movement of legitimate, low-risk goods and travelers, while promoting effective border security.
Chief of Staff (COS): COS serves as the direct liaison to DHS for all Agency issues. COS assists the Office of the Commissioner in formulating and implementing policies through coordination with other CBP office components, DHS, and other government agencies. COS provides advice and counsel to the Commissioner in defining priorities to accomplish CBP mission and goals.
Office of Chief Counsel (OCC): OCC serves as the chief legal officer of CBP and reports to the General Counsel of DHS. The Chief Counsel serves as the Ethics Officer for the Agency and is the principal legal advisor to the CBP Commissioner. OCC provides legal advice to and legal representation of CBP personnel in matters relating to CBP activities and functions.
Office of Program Development (OPD): OPD is responsible for transitioning CBP from a budget-centric process to a planning and programming process that is driven by goals and objectives. OPD was established in FY 2011 and is responsible for integrating and executing the planning, programming, budgeting, and accountability process within CBP. This includes: establishing repeatable processes and structures; establishing priorities and capabilities required to achieve a strategy; making informed, cross-cutting operational and resource decisions consistent with DHS and Commissioner priorities and goals; increasing transparency through a more detailed, focused budget; and performing and monitoring the achievement of goals and spending plans.
Office of Strategic Integration (OSI): OSI facilitates the development of a mature strategic-integration culture across CBP and among all its stakeholders, both internal and external. OSI was established in FY 2011 and manages the integration of CBP’s portfolio of strategies, maximizing value, balance in approach, alignment to business strategy, and balance in resource requirements.
Privacy and Diversity Office (PDO): PDO develops and administers all CBP programs and activities necessary to comply with the Privacy Act of 1974, the Freedom of Information Act (FOIA), Prison Rape Elimination Act, and with all applicable federal anti-discrimination laws, civil rights and liberties, regulations, and policies necessary to facilitate lawful travel and trade across U.S. borders, while ensuring national security and economic prosperity.
Office of State, Local, and Tribal Liaison (SLT): SLT advises the Commissioner, Deputy Commissioner, and program offices regarding the impact of CBP policies and initiatives on state and local stakeholders. SLT also acts as the primary conduit for information to, and guidance from, the DHS Office of Intergovernmental Affairs. SLT informs state and local stakeholders of current and proposed CBP
CBP Organization

112014 Performance and Accountability Report • U.S. Customs and Border Protection
programs, assists these stakeholders in addressing concerns with CBP programs, and assists in building and maintaining partnerships between CBP and state and local governments.
Office of Policy and Planning (OPP): OPP directly supports the Commissioner and his principal staff officers through deliberate and rapid planning processes to fully inform and influence CBP policies, strategies, integrated planning, and decision support. OPP works closely with the Commissioner, CBP leadership, homeland security partners and stakeholders in defining and advancing agency priorities through the development, review, and implementation of key policy and planning initiatives. The OPP staff facilitates and coordinates the Agency’s strategic, operational, and institutional planning and integrates processes. OPP promotes analytic rigor, strategic foresight, and integrated risk management to empower CBP leadership to make the best informed decisions for safety, security, and prosperity.
Office of Trade Relations (OTR): OTR manages CBP’s outreach and communications with the international trade community. OTR ensures that the trade community and the public understand that trade is an integral part of CBP’s mission to make America safer, stronger, more prosperous, and economically competitive. OTR organizes and presents formal CBP outreach including CBP’s annual trade symposiums, monthly trade day meetings, trade roundtable meetings, and webinars. OTR manages the CBP Advisory Committee on Commercial Operations, a congressionally mandated trade advisory group, and serves as the designated regulatory fairness representative for the Agency, promoting compliance with the Small Business Regulatory Enforcement Fairness Act.
Joint Operations Directorate (JOD): JOD serves as the CBP operational information conduit for the Commissioner, Deputy Commissioner, and component leadership, and supports leadership’s ability to make agency-wide decisions. JOD evolves to meet the needs of CBP by providing incident management and reporting, and engaging in interagency collaboration efforts and field coordination. This includes the Commissioner’s Situation Room, the centralized CBP entity that collects all significant incident reports from all CBP field components. The Situation Room also acts as the focal point for all calls coming into the CBP Washington, D.C., headquarters and serves as the focal point for outgoing messaging to CBP’s national and international components.
Office of Executive Secretariat (OES): OES ensures appropriate and expeditious action on all requests for information, executive correspondence, and official memoranda addressed to the Commissioner and other CBP and DHS senior officials. OES provides direct support to the Commissioner and Deputy Commissioner, as well as related support to leadership and management across the agency.
The Committee on Commerical Operations of CBP meets to discuss trade issues.
CBP Organization

12 U.S. Customs and Border Protection • 2014 Performance and Accountability Report
CBP’s component organizations collaborate and cooperate to achieve the Agency’s mission.
Component Organizations and Field Structure
CBP is organized into 14 separate offices, each of which report directly to the Commissioner. The mission of each office is described briefly below:
Office of Field Operations (OFO): OFO enforces customs, immigration, and agriculture laws and regulations at U.S. borders and has the primary responsibility for preventing terrorists and their weapons from entering the U.S. at ports of entry. OFO maintains programs at 20 field operation offices; 328 ports of entry; 16 preclearance stations in Canada, the Caribbean, Ireland, and the United Arab Emirates; and 60 Container Security Initiative (CSI) ports worldwide. OFO oversees the enforcement of laws and regulations while ensuring the safe and efficient flow of goods and people through ports of entry.
Office of Border Patrol (OBP): OBP serves as the CBP law enforcement organization with the primary responsibility of preventing terrorists, weapons of terrorism, illegal aliens, drugs, and those who smuggle them, from entering the U.S. between ports of entry. Some of the major activities include maintaining traffic checkpoints along highways leading from border areas, conducting city patrol and transportation checks, and anti-smuggling investigations. OBP is organized into 20 sectors along the southwestern, northern, and coastal areas of the U.S.
Office of Air and Marine (OAM): OAM protects the American people and critical infrastructure through the coordinated use of integrated air and marine forces. OAM is the world’s largest aviation and maritime law enforcement organization, with 1,200 federal agents, more than 250 aircraft, and more than 280
CBP Organization
132014 Performance and Accountability Report • U.S. Customs and Border Protection
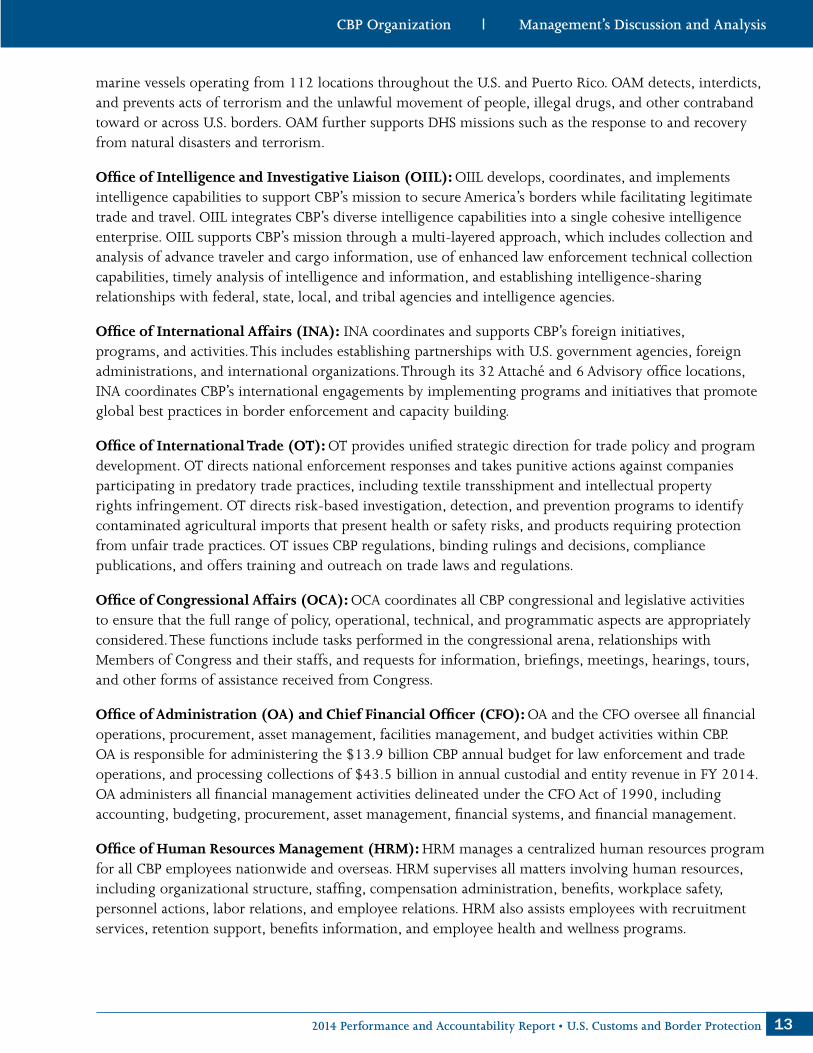
marine vessels operating from 112 locations throughout the U.S. and Puerto Rico. OAM detects, interdicts, and prevents acts of terrorism and the unlawful movement of people, illegal drugs, and other contraband toward or across U.S. borders. OAM further supports DHS missions such as the response to and recovery from natural disasters and terrorism.
Office of Intelligence and Investigative Liaison (OIIL): OIIL develops, coordinates, and implements intelligence capabilities to support CBP’s mission to secure America’s borders while facilitating legitimate trade and travel. OIIL integrates CBP’s diverse intelligence capabilities into a single cohesive intelligence enterprise. OIIL supports CBP’s mission through a multi-layered approach, which includes collection and analysis of advance traveler and cargo information, use of enhanced law enforcement technical collection capabilities, timely analysis of intelligence and information, and establishing intelligence-sharing relationships with federal, state, local, and tribal agencies and intelligence agencies.
Office of International Affairs (INA): INA coordinates and supports CBP’s foreign initiatives, programs, and activities. This includes establishing partnerships with U.S. government agencies, foreign administrations, and international organizations. Through its 32 Attaché and 6 Advisory office locations, INA coordinates CBP’s international engagements by implementing programs and initiatives that promote global best practices in border enforcement and capacity building.
Office of International Trade (OT): OT provides unified strategic direction for trade policy and program development. OT directs national enforcement responses and takes punitive actions against companies participating in predatory trade practices, including textile transshipment and intellectual property rights infringement. OT directs risk-based investigation, detection, and prevention programs to identify contaminated agricultural imports that present health or safety risks, and products requiring protection from unfair trade practices. OT issues CBP regulations, binding rulings and decisions, compliance publications, and offers training and outreach on trade laws and regulations.
Office of Congressional Affairs (OCA): OCA coordinates all CBP congressional and legislative activities to ensure that the full range of policy, operational, technical, and programmatic aspects are appropriately considered. These functions include tasks performed in the congressional arena, relationships with Members of Congress and their staffs, and requests for information, briefings, meetings, hearings, tours, and other forms of assistance received from Congress.
Office of Administration (OA) and Chief Financial Officer (CFO): OA and the CFO oversee all financial operations, procurement, asset management, facilities management, and budget activities within CBP. OA is responsible for administering the $13.9 billion CBP annual budget for law enforcement and trade operations, and processing collections of $43.5 billion in annual custodial and entity revenue in FY 2014. OA administers all financial management activities delineated under the CFO Act of 1990, including accounting, budgeting, procurement, asset management, financial systems, and financial management.
Office of Human Resources Management (HRM): HRM manages a centralized human resources program for all CBP employees nationwide and overseas. HRM supervises all matters involving human resources, including organizational structure, staffing, compensation administration, benefits, workplace safety, personnel actions, labor relations, and employee relations. HRM also assists employees with recruitment services, retention support, benefits information, and employee health and wellness programs.
CBP Organization
14 U.S. Customs and Border Protection • 2014 Performance and Accountability Report
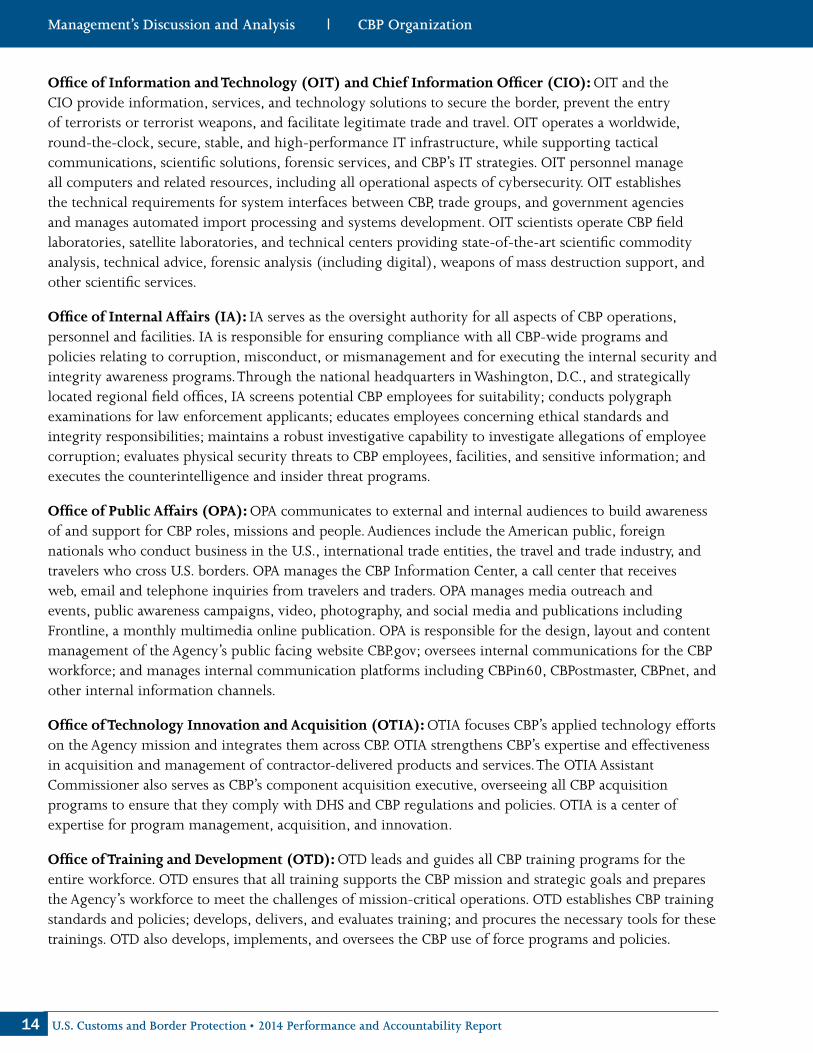
Office of Information and Technology (OIT) and Chief Information Officer (CIO): OIT and the CIO provide information, services, and technology solutions to secure the border, prevent the entry of terrorists or terrorist weapons, and facilitate legitimate trade and travel. OIT operates a worldwide, round-the-clock, secure, stable, and high-performance IT infrastructure, while supporting tactical communications, scientific solutions, forensic services, and CBP’s IT strategies. OIT personnel manage all computers and related resources, including all operational aspects of cybersecurity. OIT establishes the technical requirements for system interfaces between CBP, trade groups, and government agencies and manages automated import processing and systems development. OIT scientists operate CBP field laboratories, satellite laboratories, and technical centers providing state-of-the-art scientific commodity analysis, technical advice, forensic analysis (including digital), weapons of mass destruction support, and other scientific services.
Office of Internal Affairs (IA): IA serves as the oversight authority for all aspects of CBP operations, personnel and facilities. IA is responsible for ensuring compliance with all CBP-wide programs and policies relating to corruption, misconduct, or mismanagement and for executing the internal security and integrity awareness programs. Through the national headquarters in Washington, D.C., and strategically located regional field offices, IA screens potential CBP employees for suitability; conducts polygraph examinations for law enforcement applicants; educates employees concerning ethical standards and integrity responsibilities; maintains a robust investigative capability to investigate allegations of employee corruption; evaluates physical security threats to CBP employees, facilities, and sensitive information; and executes the counterintelligence and insider threat programs.
Office of Public Affairs (OPA): OPA communicates to external and internal audiences to build awareness of and support for CBP roles, missions and people. Audiences include the American public, foreign nationals who conduct business in the U.S., international trade entities, the travel and trade industry, and travelers who cross U.S. borders. OPA manages the CBP Information Center, a call center that receives web, email and telephone inquiries from travelers and traders. OPA manages media outreach and events, public awareness campaigns, video, photography, and social media and publications including Frontline, a monthly multimedia online publication. OPA is responsible for the design, layout and content management of the Agency’s public facing website CBP.gov; oversees internal communications for the CBP workforce; and manages internal communication platforms including CBPin60, CBPostmaster, CBPnet, and other internal information channels.
Office of Technology Innovation and Acquisition (OTIA): OTIA focuses CBP’s applied technology efforts on the Agency mission and integrates them across CBP. OTIA strengthens CBP’s expertise and effectiveness in acquisition and management of contractor-delivered products and services. The OTIA Assistant Commissioner also serves as CBP’s component acquisition executive, overseeing all CBP acquisition programs to ensure that they comply with DHS and CBP regulations and policies. OTIA is a center of expertise for program management, acquisition, and innovation.
Office of Training and Development (OTD): OTD leads and guides all CBP training programs for the entire workforce. OTD ensures that all training supports the CBP mission and strategic goals and prepares the Agency’s workforce to meet the challenges of mission-critical operations. OTD establishes CBP training standards and policies; develops, delivers, and evaluates training; and procures the necessary tools for these trainings. OTD also develops, implements, and oversees the CBP use of force programs and policies.
CBP Organization

152014 Performance and Accountability Report • U.S. Customs and Border Protection
CBP’s Integrated Planning Framework
CBP established an integrated planning framework to ensure a more effective and efficient organization. This framework increases collaboration, enables mission-driven planning, and better aligns mission goals with resource allocation decisions. CBP’s integrated planning framework has redefined the way decision makers, planners, and managers approach problems by providing an agency-wide structure within which all CBP planning is accomplished.
Summarized in the table below, CBP’s integrated planning framework spans four tiers of planning: strategic, functional, operational, and institutional planning. Each tier provides a different view of CBP’s functions, capabilities, and resources, to develop sound, collaborative recommendations to decision makers.
Planning Tier Purpose Issues Addressed Deliverables Timeframe
Strategic (Risk-informed)
To understand the future operating
environment and set clear direction for CBP mission execution and
support.
Defines CBP’s vision, purpose, goals and objectives, culture
and ethos, and value proposition to national
safety, security, and prosperity.
CBP Strategic Plan, operational priorities
and guidance for specified strategic
outcomes and outputs.
~5-15 years
Functional (Capabilities-
based)
To identify capability needs and prioritize
resources, investments, and acquisition
requirements across shared mission space.
Analysis and assessment of capability needs to meet strategic
outcomes using logical groupings of
capabilities.
Capabilities-based portfolio plans to promote and align
programs, activities, and investments to
priorities.
~2-7 years
Operational (Effects-based)
To examine and prescribe how the CBP strategy will
be achieved by CBP offices and its selected
partners.
Mission specific workflow, activities, and tasks to deliver
strategic objectives and goals.
Concept Plans, Operational Plans, Campaign Plans,
Supporting Plans, etc.
~3-24 months
Institutional (Enterprise-
wide)
To promote sound management and effective business
processes to ensure mission success
and organizational efficiencies.
CBP governance, oversight, business
processes, and performance management.
Organizational Structure requirements,
communications strategies, business
process mapping, and resource and asset
management.
Any
CBP’s Integrated Planning Framework to align mission goals with resource allocation.
CBP’s Integrated Planning Framework

16 U.S. Customs and Border Protection • 2014 Performance and Accountability Report
CBP’s Strategic Goals
Four strategic goals guide CBP’s actions to achieve its mission. Under each strategic goal are objectives which are sub-goals taken to achieve the goal and meet operational priorities. The table below lists CBP’s strategic goals and objectives that guided its operations in FY 2014.
Mission Statement: To safeguard America’s borders, thereby protecting the public from dangerous people and materials while enhancing the Nation’s global economic competitiveness by enabling legitimate trade and travel.
Goal 1 - Advance National Security and Public Safety Objective A – Understand the threat environmentObjective B – Enhance procedures and partnerships that will facilitate interagency and international border enforcement coordinationObjective C – Strengthen global supply chain security
Goal 2 - Enhance U.S. Economic Competitiveness by Enabling Lawful Trade and Travel Objective A – Reduce costs for the U.S. government and the trade and travel communities by streamlining processes in collaboration with public and private sector partnersObjective B – Promote harmonization throughout ports of entry and other U.S. Government agenciesObjective C – Expand risk-segmentation through advanced technology to enable low-risk trade and travel
Goal 3 - Advance Comprehensive Border Security and Management Objective A – Increase situational awareness of the air, land and maritime bordersObjective B – Detect, interdict and disrupt illegal cross-border activitiesObjective C – Strengthen comprehensive trade enforcementObjective D – Strengthen processes to conduct outbound enforcement and interdiction of travelers and cargoObjective E – Advance a comprehensive, predictive targeting strategy to identify threats as early as possible
Goal 4 - Promote Organizational Integration, Innovation and Agility Objective A – Mature CBP’s strategic resource management frameworkObjective B – Optimize CBP’s organizational structure to ensure agile and efficient operationsObjective C – Strengthen CBP’s culture of unwavering integrity and professional growthObjective D – Advance CBP mission effectiveness through transformative technologies and innovative business practices
CBP’s strategic goals and objectives (sub-goals) that drive our Integrated Planning Framework.
CBP uses various mission strategies (i.e. programs and initiatives) within each objective to achieve its strategic goals, and ultimately its mission. Strategies include programs, technologies, and partnerships, each with specific performance measures to determine how well the Agency is performing in achieving its strategic goals and objectives. CBP develops performance measure in response to DHS, GAO, and Office of Inspector General (OIG) recommendations, as well as based on internal CBP management. Performance measures inform decision makers on where they should place resources to ensure program effectiveness, results of which are reported to the OMB and DHS.
CBP’s Strategic Goals
172014 Performance and Accountability Report • U.S. Customs and Border Protection
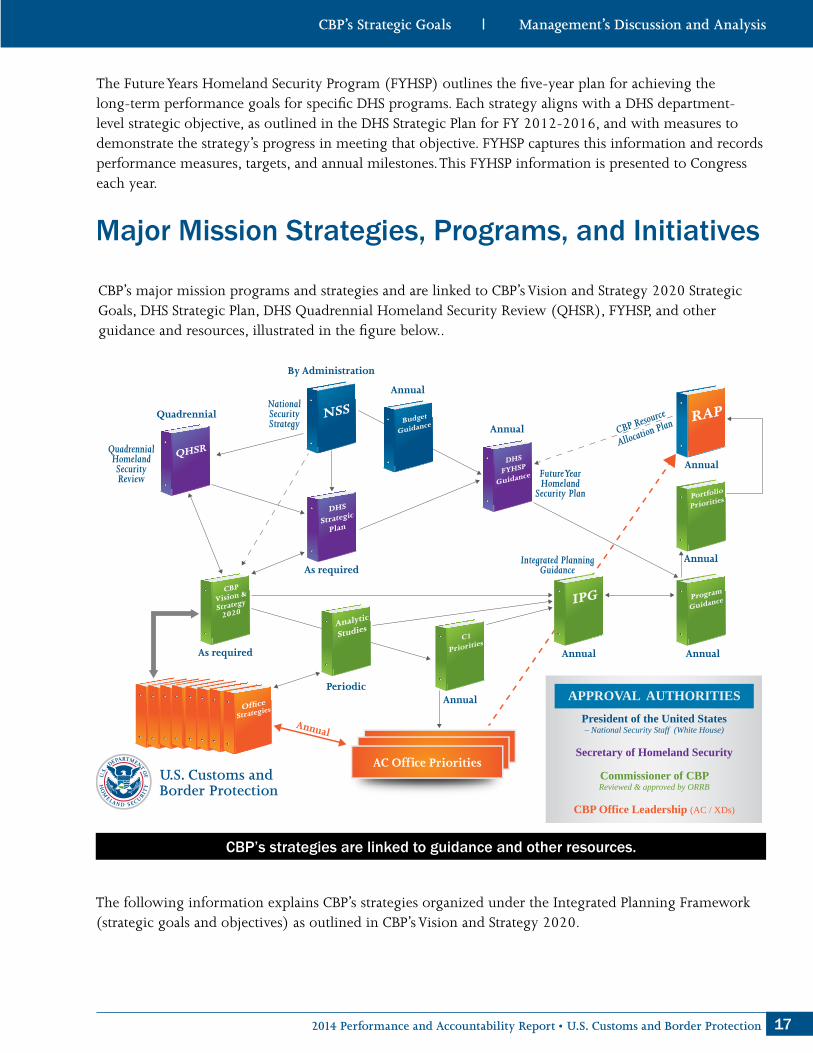
The Future Years Homeland Security Program (FYHSP) outlines the five-year plan for achieving the long-term performance goals for specific DHS programs. Each strategy aligns with a DHS department-level strategic objective, as outlined in the DHS Strategic Plan for FY 2012-2016, and with measures to demonstrate the strategy’s progress in meeting that objective. FYHSP captures this information and records performance measures, targets, and annual milestones. This FYHSP information is presented to Congress each year.
Major Mission Strategies, Programs, and Initiatives
CBP’s major mission programs and strategies and are linked to CBP’s Vision and Strategy 2020 Strategic Goals, DHS Strategic Plan, DHS Quadrennial Homeland Security Review (QHSR), FYHSP, and other guidance and resources, illustrated in the figure below..Linking strategies and priorities to resources for CBP
Annual
Annual
Annual
Annual
Annual
Annual
Annual
By Administration
NationalSecurityStrategy
Future YearHomeland
Security Plan
Integrated PlanningGuidance
QuadrennialHomelandSecurityReview
Quadrennial
As required
As required
Periodic
CBP Resource
Allocation Plan
AnnualPresident of the United States– National Security Staff (White House)
Secretary of Homeland Security
Commissioner of CBPReviewed & approved by ORRB
CBP Office Leadership (AC / XDs)
APPROVAL AUTHORITIES
CBP’s strategies are linked to guidance and other resources.
The following information explains CBP’s strategies organized under the Integrated Planning Framework (strategic goals and objectives) as outlined in CBP’s Vision and Strategy 2020.
CBP’s Strategic Goals
18 U.S. Customs and Border Protection • 2014 Performance and Accountability Report
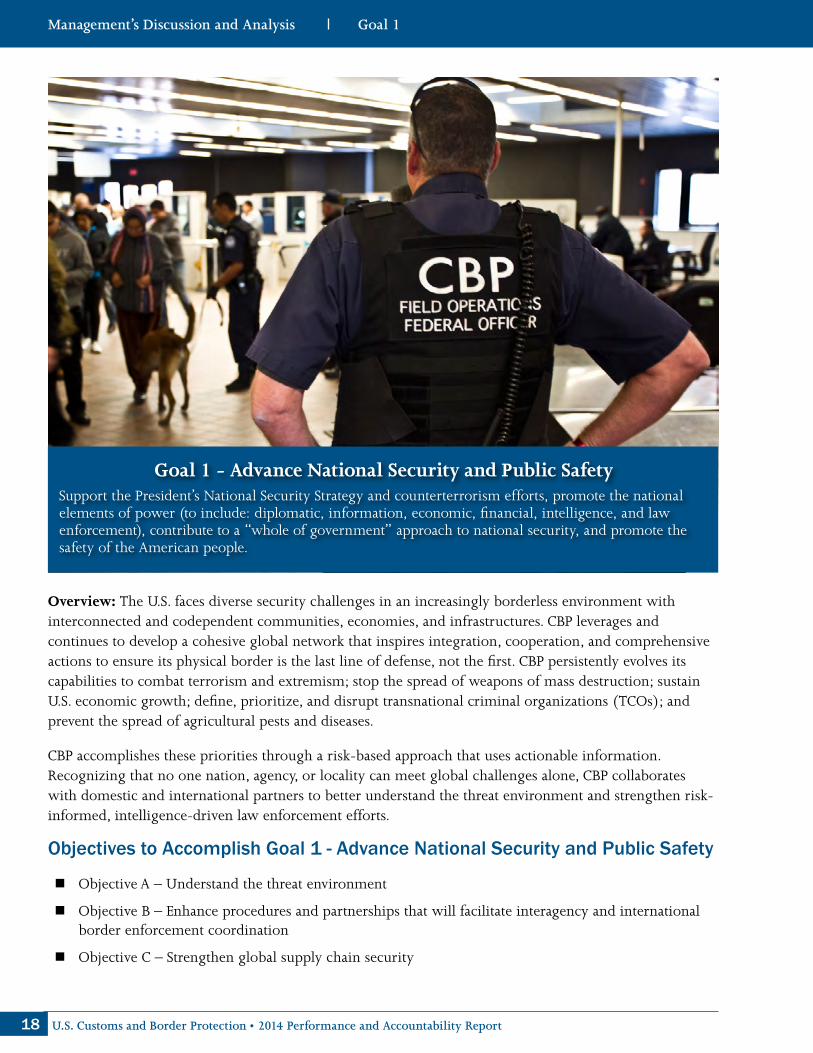
Goal 1 - Advance National Security and Public SafetySupport the President’s National Security Strategy and counterterrorism efforts, promote the national elements of power (to include: diplomatic, information, economic, financial, intelligence, and law enforcement), contribute to a “whole of government” approach to national security, and promote the safety of the American people.
Overview: The U.S. faces diverse security challenges in an increasingly borderless environment with interconnected and codependent communities, economies, and infrastructures. CBP leverages and continues to develop a cohesive global network that inspires integration, cooperation, and comprehensive actions to ensure its physical border is the last line of defense, not the first. CBP persistently evolves its capabilities to combat terrorism and extremism; stop the spread of weapons of mass destruction; sustain U.S. economic growth; define, prioritize, and disrupt transnational criminal organizations (TCOs); and prevent the spread of agricultural pests and diseases.
CBP accomplishes these priorities through a risk-based approach that uses actionable information. Recognizing that no one nation, agency, or locality can meet global challenges alone, CBP collaborates with domestic and international partners to better understand the threat environment and strengthen risk-informed, intelligence-driven law enforcement efforts.
Objectives to Accomplish Goal 1 - Advance National Security and Public Safety
� Objective A – Understand the threat environment
� Objective B – Enhance procedures and partnerships that will facilitate interagency and international border enforcement coordination
� Objective C – Strengthen global supply chain security

192014 Performance and Accountability Report • U.S. Customs and Border Protection
Understand the Threat Environment
CBP uses a whole of government approach to enhance its ability to collect, analyze, and appropriately share intelligence and information, including timely warnings of potential threats and proactive enforcement opportunities to better understand the threat environment. CBP strengthens partnerships with federal, state, local, tribal, territorial, and international stakeholders to enhance intelligence and information sharing. This is accomplished, in part, by developing common intelligence pictures – a common understanding of terrorist and criminal threats including: their tactics, techniques, and procedures; their capabilities and vulnerabilities; and indicators of their potential courses of action.
Central to this objective is the CBP Law Enforcement Intelligence Enterprise, a powerful border security partnership that connects law enforcement and intelligence communities for an enhanced intelligence and targeting strategy to predict threats and better understand the threat environment. This enterprise detects threats beyond our borders, integrates and coordinates intelligence and law enforcement capabilities, and establishes stronger border-centric partnerships to respond to the criminal networks.
Strategies to Understand the Threat Environment
National Targeting Center (NTC): The NTC identifies high-risk people and cargo before they cross U.S. borders, and serves as the single point of reference for CBP antiterrorism efforts. NTC’s functions are divided into two areas: NTC-Passenger (NTC-P) and NTC-Cargo (NTC-C). NTC analysts, called targeters, assess large amounts of data about people, cargo, ports, and flights around the world. Targeters work closely with CBP field personnel and on-site staff from the U.S. Coast Guard, the Federal Bureau of Investigation (FBI), Transportation Security Administration (TSA), and other agencies. NTC-P targeters collaborate with DHS intelligence officers and numerous law enforcement organizations to develop passenger targeting algorithms. NTC-C targeters and DHS intelligence staff jointly refine rule sets for rating cargo risks.
Two days after planting a car bomb in New York’s Times Square, the terrorist boarded a plane for Dubai at JFK International Airport. The National Targeting Center (NTC) discovered him on the no-fly list, and CBP officers arrested the terrorist on May 3, 2010, 53 hours after the attempted attack.
National Targeting Center – Passenger (NTC-P): NTC-P, located in Reston, Virginia, identifies people who pose potential threats before departure by screening, reviewing and prioritizing passengers across international transportation. NTC-P screens inbound and outbound commercial airline passengers, cruise ship passengers and crews, and cargo vessel crews to spot potential high-risk individuals. NTC-P also screens all visa and the Electronic System for Travel Authorizations (ESTA) applicants. NTC-P provides 24/7 antiterrorism tactical targeting and analytical research using automated enforcement data processsing systems, including the Automated Targeting System-Passenger (ATS-P) and the Targeting Framework. These systems screen passenger manifests and related information prior to U.S. arrival. NTC-P adjudicates all U.S. Department of Defense (DoD) biometric matches to derogatory information; coordinates with U.S. Department of State and U.S. Immigration and Customs Enforcement (ICE) to automate vetting of U.S. non-immigrant visa application information prior to the applicant’s interview or visa issuance; supports the Immigration Advisory Program (IAP) and Joint Security Program (JSP) through targeting; improves
20 U.S. Customs and Border Protection • 2014 Performance and Accountability Report
the accuracy and integrity of the Terrorist Watch List in collaboration with the National Counterterrorism Center and the Terrorist Screening Center; and vets valid U.S. nonimmigrant and immigrant visas to identify changes in a traveler’s visa status in near real-time.
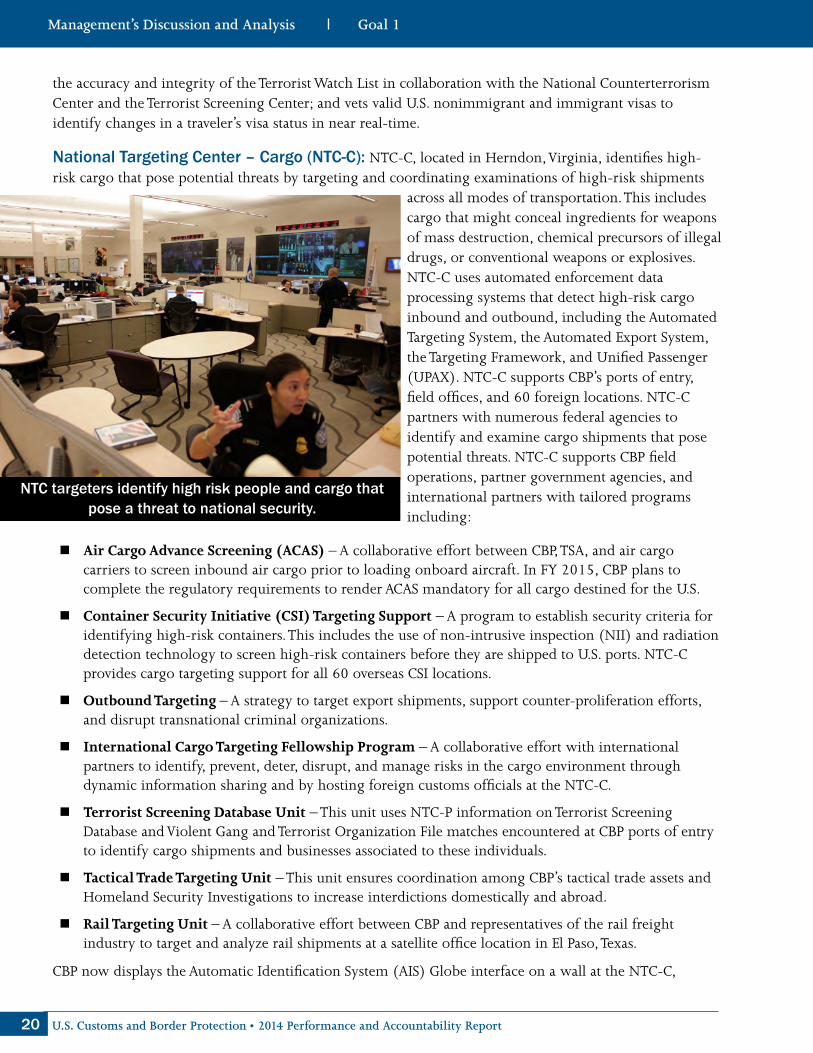
National Targeting Center – Cargo (NTC-C): NTC-C, located in Herndon, Virginia, identifies high-risk cargo that pose potential threats by targeting and coordinating examinations of high-risk shipments
across all modes of transportation. This includes cargo that might conceal ingredients for weapons of mass destruction, chemical precursors of illegal drugs, or conventional weapons or explosives. NTC-C uses automated enforcement data processing systems that detect high-risk cargo inbound and outbound, including the Automated Targeting System, the Automated Export System, the Targeting Framework, and Unified Passenger (UPAX). NTC-C supports CBP’s ports of entry, field offices, and 60 foreign locations. NTC-C partners with numerous federal agencies to identify and examine cargo shipments that pose potential threats. NTC-C supports CBP field operations, partner government agencies, and international partners with tailored programs including:
NTC targeters identify high risk people and cargo that pose a threat to national security.
� Air Cargo Advance Screening (ACAS) – A collaborative effort between CBP, TSA, and air cargo carriers to screen inbound air cargo prior to loading onboard aircraft. In FY 2015, CBP plans to complete the regulatory requirements to render ACAS mandatory for all cargo destined for the U.S.
� Container Security Initiative (CSI) Targeting Support – A program to establish security criteria for identifying high-risk containers. This includes the use of non-intrusive inspection (NII) and radiation detection technology to screen high-risk containers before they are shipped to U.S. ports. NTC-C provides cargo targeting support for all 60 overseas CSI locations.
� Outbound Targeting – A strategy to target export shipments, support counter-proliferation efforts, and disrupt transnational criminal organizations.
� International Cargo Targeting Fellowship Program – A collaborative effort with international partners to identify, prevent, deter, disrupt, and manage risks in the cargo environment through dynamic information sharing and by hosting foreign customs officials at the NTC-C.
� Terrorist Screening Database Unit – This unit uses NTC-P information on Terrorist Screening Database and Violent Gang and Terrorist Organization File matches encountered at CBP ports of entry to identify cargo shipments and businesses associated to these individuals.
� Tactical Trade Targeting Unit – This unit ensures coordination among CBP’s tactical trade assets and Homeland Security Investigations to increase interdictions domestically and abroad.
� Rail Targeting Unit – A collaborative effort between CBP and representatives of the rail freight industry to target and analyze rail shipments at a satellite office location in El Paso, Texas.
CBP now displays the Automatic Identification System (AIS) Globe interface on a wall at the NTC-C,

212014 Performance and Accountability Report • U.S. Customs and Border Protection
providing a “big map” airspace viewer and persons of interest on a map. The AIS Globe interface exploits multiple formats including charts, graphs, heat maps, and time series, which help to identify patterns and provide graphical information to users in the field. In FY 2014, CBP’s OIT updated several capabilities, including the addition of Google Features, which allows the system to show roads, daylight/nighttime, and 3D buildings.
Enhance Procedures and Partnerships that will Facilitate Interagency and International Border Enforcement Coordination
CBP aggressively champions strategic partnerships that facilitate integrated, risk-informed, intelligence-driven law enforcement operations, using a whole of government and international unity of effort approaches. Because no single nation or agency has the authority or resources to unilaterally eradicate cross-border violations, CBP strengthens domestic and international partnerships to provide greater synergy, reduce unintended redundancies, improve communications, and serve as a force multiplier. A critical element of this is integrating intelligence, surveillance, and reconnaissance capabilities into law enforcement operations that require interagency and international coordination. This includes ensuring all partners have access to the same operational information and that CBP has information on other agencies’ activities, initiatives and resources.
CBP serves in operational and advisory capacities to coordinate resources, and identify and stop threats before they reach our borders. This unifies efforts in detecting, interdicting, deterring, and disrupting terrorist, TCOs and transnational criminal networks, and cross-border criminal activity. CBP also helps international partners develop their own capacity to create a strong and resilient enforcement network.
Strategies to Enhance Procedures and Partnerships that will Facilitate Interagency and International Border Enforcement Coordination
Extended Border Operations: Extended border operations allow CBP to increase the effectiveness of interdiction efforts outside U.S. borders. CBP’s OAM P-3 aircraft are an integral part of counternarcotic missions in source and transit zones. In FY 2014, OAM expanded Guardian Unmanned Aircraft System (UAS) operations in the drug source, transit, and arrival zones in cooperation with U.S. Northern Command, U.S. Southern Command, and Joint Interagency Task Force-South. OAM deployed the Guardian system to operate from forward operating locations in El Salvador, Honduras, and the Dominican Republic and will continue to tactically expand the footprint to Curacao.
P-3 aircraft and the Guardian UAS are an integral part of CBP’s OAM operations.

22 U.S. Customs and Border Protection • 2014 Performance and Accountability Report
Air and Marine Operations Center (AMOC): OAM’s AMOC is a state-of-the-art law enforcement Domain Awareness center located at March Air Reserve Base in Riverside, California. AMOC is the Nation’s only federal law enforcement center tasked to coordinate interdiction operations in the Western Hemisphere. AMOC coordinates interdiction operations and provides detection, monitoring, sorting, tracking, and coordination of law enforcement response to suspicious airborne and maritime activity. To expand air domain awareness beyond the U.S. physical borders, AMOC’s hemispheric approach integrates multiple domestic and foreign radars, which feeds into the Air and Marine Operations Surveillance System architecture to fill coverage gaps and increase the OAM’s ability to detect, track and interdict aircraft involved in illicit activity.
In FY 2014, CBP expanded its operational partnerships with Mexico and jointly conducted interdictions and other law enforcement operations. AMOC hosts liaisons from the Secretaría de la Defensa Nacional, Policia Federal, and Procuraduria General de la República. AMOC uses radar feeds from
the Mexican Airspace Navigation Services, the Mexican equivalent of the Federal Aviation Administration, into the Air and Marine Operations Surveillance System. OAM coordinated with Mexico on foreign operations group flights to expand operations in the maritime environment, specifically along the Pacific coast where there is significant illicit drug trafficking. The concept of operations utilizes P-3 and UAS assets, enhances situational awareness in the maritime approaches to Mexico’s Pacific coast, and improves information sharing with Mexico regarding inbound traffic that could potentially carry precursor chemicals and other illegal contraband.
Border Community Liaison Program: This program enhances CBP interaction with communities and promotes Agency understanding of community views, concerns and issues. CBP designates uniformed officers to improve collaboration with local border communities to help CBP’s Border Patrol and OFO more effectively carry out their missions. This engagement at the local level strengthens relationships and provides opportunities for community feedback that CBP shares with DHS and other partners.
Under the guidance of the Border Community Liaison Program in Laredo, Texas, the Rewarding, Education, Attitude, and Leadership mission program addresses a community need to mentor at-risk youth. Students attended a six-week program, meeting with CBP agents and learning ways to build
a better future. The program’s mission is to mentor youth on respect, education, leadership skills, teamwork, and community service.
Regional Coordinating Mechanisms (ReCoMs): ReCoMs are collaborative law enforcement groups operating in the maritime domain that include Border Patrol, ICE-Homeland Security Investigations, U.S. Coast Guard, and other local, state, and federal law enforcement agencies. Regional ReCoMs coordinate maritime operations through integrated planning, information sharing, and intelligence integration. In FY 2014, CBP’s OAM prioritized ReCoM development to better coordinate maritime operations. OAM developed a comprehensive concept of operations to effectively counter the threat from pangas – open hulled, low-profile fishing speedboats that are difficult to spot. CBP works with federal, state, and local law enforcement officials along the California coast to expand detection beyond the reach of OAM patrol assets.

232014 Performance and Accountability Report • U.S. Customs and Border Protection
In February 2014, CBP agents patrolling for the San Diego ReCoM stopped a private recreational boat in Oceanside, California with 540.5 pounds of methamphetamine hidden in a secret compartment. The drugs had an estimated street value of more than $25 million. Smugglers posing as legitimate recreational or commercial boaters continue to be difficult to spot especially in Southern California and Baja, Mexico, where boating is a way of life.
CBP’s OAM developed a concept of operations to counter the growing threat from pangas.
Training and Technical Assistance Programs: In FY 2014, CBP’s INA conducted multiple training and technical assistance programs to enhance international border security and law enforcement efforts to combat terrorism in Africa from groups such as Boko Haram in Nigeria, Al-Shabaab in Kenya and Somalia, and Al-Qaeda in the Islamic Maghreb in the Sahel. Some of these efforts include:
� International Border Interdiction Training: CBP and a delegation from Senegal, Mauritania, and Mali traveled to McAllen, Texas to learn about CBP’s inspectional techniques and methodologies.
� Senegal International Visitors Program: A Senegalese delegation visited Washington, D.C. and the Southwest border to expose African partners to CBP operations where they learned best practices, observed current CBP programs and processes, and engaged with CBP counterparts.
� Cameroon International Visitors Program: A Cameroon delegation visited Washington, D.C. and the Southwest border to learn about strategies to counter border security threats posed by Boko Haram.
� Kenya/Tanzania Targeting and Risk Management Training: CBP officials traveled to Mombasa to train Kenyan border security and law enforcement officials to identify high-risk goods and people and improve targeting capabilities.
International Capacity Building Efforts: CBP’s international capacity building efforts focus on the following areas: international narcotics and crime control, non-proliferation, export control and related border security, commercial enforcement operations, and private sector partnership programs. Each effort includes a border security assessment to determine the type of training and/or equipment needed to improve operations within the host foreign country. During FY 2014, CBP conducted 175 capacity building sessions for foreign partners including 15 International Law Enforcement Academy courses, and provided capacity building support in over 59 countries.
Success Story

24 U.S. Customs and Border Protection • 2014 Performance and Accountability Report
In FY 2014, the South Texas border experienced a surge of unaccompanied migrant children and family units. From May-August 2014, CBP leveraged input from each CBP component to coordinate the reporting of the unaccompanied children and families. This included activating a CBP Headquarters Emergency Operations Center, which maintained daily contact with CBP components to provide timely and consistent information to CBP executives.
International Visitors Program: CBP hosts international partner visits to help develop capacity building functions and long-term sustainable competencies. CBP establishes relationships with foreign partners to improve worldwide border security practices, mitigate the risk of threats entering the U.S., and facilitate legitimate trade and travel. This program informs officials from foreign customs, immigration, border patrols, coast guards, and other enforcement administrations and levels of government about CBP enforcement, trade, and management programs. In FY 2014, CBP hosted 2,276 foreign officials from 94 International Visitors Program countries/locations for briefings on various CBP programs.
On June 25, 2014, the U.S. and Australia signed a Customs Strategic Partnership, a bilateral agreement to pursue activities to enhance our capabilities to disrupt illicit imports, improve compliance with U.S. and Australian laws, and ensure efficient services for legitimate travel and trade.
Success Story
Strengthen Global Supply Chain Security
CBP promotes the efficient flow of legitimate commerce while protecting the global supply chain from a diverse range of threats, including counterfeit and unsafe goods, agricultural pests and diseases, and fraudulent and criminal trade schemes. CBP layers its security efforts throughout the global supply chain to identify high-risk cargo and conveyances while facilitating the swift movement of legitimate trade across our borders, leading to a safer, faster, more resilient, and more economically competitive international trade process. CBP’s approach is aligned with the President’s National Strategy for Global Supply Chain Security, which calls for the protection of a global supply chain system that supports innovation and prosperity by securely, timely, and reliably moving goods across our borders and around the world.
By coordinating with our international partners, CBP develops and maintains a more accurate picture of the threats and trends across the global supply chain. CBP continually gathers information about the global

252014 Performance and Accountability Report • U.S. Customs and Border Protection
supply chain to manage risk and mitigate systemic vulnerabilities to disruption and exploitation. To better identify high-risk shipments, CBP works closely with international and private sector partners to expand the advance shipping information available for commercial and national security targeting.
Strategies to Strengthen Global Supply Chain Security
Non-Intrusive Inspection (NII) Technologies: CBP uses NII technologies such as large-scale X-ray and gamma ray imaging systems, as well as a variety of portable and handheld technologies to detect contraband, e.g., narcotics and weapons, and other materials that pose potential threats. NII technologies allow CBP to scan a larger portion of inbound traffic for contraband in less time. CBP scans cargo containers for radioactive materials as they pass through land border ports, seaports, airports, and express consignment/mail courier facilities. At the end of FY 2014, CBP deployed NII technologies to air, land, and sea ports of entry and to Border Patrol checkpoints including 314 large-scale imaging systems, 1,362 radiation portal monitors, 2,979 radiation isotope identification devices, and 30,305 personal radiation detectors. CBP used these large-scale systems in more than 7.2 million examinations, resulting in more than 2,093 seizures and the interception of more than 249,200 lbs. of narcotics in FY 2014.
Success Story
CBP NII technologies include Vehicle & Cargo Inspection System, a truck-mounted gamma-ray imaging system, and Buster, handheld device used to scan vehicles for
hidden contraband.
In December 2013, CBP officers in Baltimore using NII technologies, discovered two gym bags holding nearly 128 pounds of cocaine in a shipping container of car parts from Colon, Panama. This was the largest cocaine seizure in Baltimore since 2007, with an estimated street value of $4 million.
Approximately 80% of maritime cargo containers destined for the U.S. transit through CSI ports. In FY 2014, more than 11 million cargo containers arrived on ships and were off-loaded at U.S. seaports, representing nearly half of incoming U.S. trade (by value).

26 U.S. Customs and Border Protection • 2014 Performance and Accountability Report
In FY 2014, the Hashemite Kingdom of Jordan joined CSI, which operates at 60 operational ports in Europe, Asia, Africa, the Middle East, North and South America. The Port of Aqaba in Jordan will use near real-time remote imaging of a container examination process, while incorporating a live video transmission/feed to monitor the inspection process. “The success of CBP’s
risked-based approach to security is dependent on the support of our partners,” said CBP Commissioner R. Gil Kerlikowske. “We are pleased to be continuing the success of the Container Security Initiative with the Kingdom of Jordan.”
Success Story
Analytical Framework for Intelligence (AFI): AFI is a system that augments CBP’s ability to gather and develop information about persons, events, and cargo of interest by creating an index of relevant data in existing operational systems. This framework provides a suite of tools to detect trends, patterns, and emerging threats, and identify non-obvious relationships between persons, events, and cargo to generate tactical, operational, and strategic law enforcement intelligence products. In FY 2014, CBP’s OIT released the AFI system’s latest improvements, which include performance enhancements, usability updates, new home-page features, new search capabilities, printing and HTML exports, and IE10 compliance.
Tasking, Operations, and Management Information System (TOMIS): TOMIS is a system that allows multiple branches to coordinate on an event (seizure, arrest, or any major interdiction operation) and then link all the participating branches’ events to each other. In FY 2014 CBP deployed new TOMIS capabilities, making the system available to more than 2,000 OAM personnel nationwide. This system allows OAM agents to process seizures and associated conveyance data and seamlessly update the Seized Asset and Case Tracking System. TOMIS provides greater operational visibility, situational awareness, data integrity, data sharing, and reduces the OAM’s dependence on mainframe applications.
Intellectual Property Rights (IPR) Enforcement: CBP analyzes trade enforcement samples for IPR violations. CBP manages eight U.S. laboratories that provide technical advice, forensics, weapons of mass destruction support, and other scientific services to CBP and other agencies on a wide range of imported and exported commodities and border security enforcement issues. CBP’s scientific evidence and analysis services help protect the U.S. and its citizens from illegal or fraudulent products and criminal activities. In 2014, CBP analyzed IPR samples and found IPR violations in commercial products that included integrated circuits, networking devices, gaming devices, and cell phones of trademarks such as Cisco, Xilinx, Toshiba, Free Scale, Lattice, Analog Devices, Nintendo, Blackberry, and Apple.
Automated Targeting System (ATS): ATS is a computerized decision support tool that CBP uses to compare traveler, cargo, and conveyance information against law enforcement, intelligence, and other
CBP conducts scientific activities to determine the origin of materials.

272014 Performance and Accountability Report • U.S. Customs and Border Protection
data using risk-based targeting scenarios and assessments. ATS identifies individuals and cargo that need additional review in five general areas:
1. Export of cargo2. Import of cargo3. Land borders4. Air/sea borders5. Cross-cutting view of risks across the four previous areas
ATS includes five sub-systems or modules that use slightly different data to conduct risk assessments. In FY 2014, CBP’s OIT enhanced ATS modules as described below:
Automated Targeting System –Anti-Terrorism (ATS-AT): This module evaluates export information, including information filed electronically through the Automated Export System (AES). CBP sorts, reviews for compliance, and scores export data so that CBP officers can identify exports with the greatest safety and security risks, such as smuggled currency, illegal narcotics, and other contraband. The ATS-AT module screens both commodity information on export documents and individuals identified on those documents.
Automated Targeting System – Land (ATS-L): This module evaluates border crossing records as well as internal and external data sources for land border targeting. ATS-L stores vehicle registration and registered owner information for U.S. plated vehicles and biographical information on vehicle occupants collected during land border entry processing. In FY 2014, OIT deployed the new Statistical Analysis System (SAS) predictive model aimed at targeting narcotics smuggled into the country via the Southern land border ports of entry. Recent ATS-L seizures resulting from implementation of the SAS model amounted to approximately $4 million.
Targeters at NTC use ATS to assess information on people and products looking for potential terrorists or
terrorist weapons.
Since the deployment of the new ATS-L predictive model across the Southwest border ports of entry, drug seizures have increased. Results show that the new model is more than five times as effective as the previous model. This success led CBP to deploy the new model beyond the pilot to all
ports of entry across the Southwest border.
Automated Targeting System – Inbound (ATS-N): This module evaluates all inbound cargo to identify high-risk cargo for examinations. It uses numerous rule and weight sets to analyze information from manifest, importer security filing, and entry data, to prioritize shipments for review and recommend targets. The module also screens identified individuals against lookouts and prior violations. In FY 2014,

28 U.S. Customs and Border Protection • 2014 Performance and Accountability Report
OIT deployed the Cargo Enforcement Reporting and Tracking System to Pharr, Texas, and Miami, Florida. This system minimizes manual data entry by CBP agriculture specialists for PPQ280 - the U.S. Department of Agriculture form for agricultural items brought into the country - and places shipments on hot lists to allow targeters to quickly identify shipments with national security risks.
In November 2014 at the Deconcini port of entry in Nogales, Arizona, a Mexican citizen applied for entry into the United States. ATS assisted the acting CBP Officer to refer the Mexican citizen to secondary inspection. Upon search of
the person’s vehicle, the CBP Officer removed 16 packages wrapped in silver bags from the vehicle. The SAS model provided the critical information based on vehicle information to seize 22.15 lbs of methamphetamine.”
Success Story
Automated Targeting System – Passenger (ATS-P): This module identifies potential terrorists, transnational criminals, and other persons who pose a high risk of violating U.S. law. ATS-P helps CBP officers decide whether a passenger or crew member should receive additional screening. The ATS-P hierarchical system allows CBP to focus on potentially high-risk passengers by eliminating labor-intensive manual reviews of traveler information or lengthy interviews with every traveler.
Automated Targeting System – Targeting Framework (ATS-TF): This module searches across data sources in other ATS modules and allows users to initiate research activities, collaborate among analysts, and access past activity logs for intelligence tracking of people and entities of interest. CBP personnel can create ad hoc queries, integrate data from multiple sources, and show possible relationships between entities and data elements. In FY 2014, updates to the National Counterterrorism Center Nomination Tool XML files saved NTC-P users significant time that was previously spent cleaning these files; thus allowing them more time to focus on critical vetting of subjects with possible relationships to terrorism.
Visa Pre-Adjudication (PATRIOT): The Visa Pre-Adjudication system, known as PATRIOT, is a hot list that enables ICE and NTC analysts to manage visa cases in an integrated manner with other NTC hot lists. Hot lists are lists of people and cargo that are prioritized based on their level of risk to more quickly identify current and relevant information. The system provides complete vetting of each PATRIOT record within the Unified Passenger (UPAX) system and automatically pushes each hit to ICE’s Visa Security Program Tracking case management system for final DHS vetting of visa cases and recommendations for visa approvals. This streamlined vetting process completes all vetting within one system before making a final recommendation to the U.S Department of State for approval/denial of the visa application.
Unified Passenger (UPAX): UPAX merges ATS-P (targeting engine) and ATS-TF (case management system) into one user interface that provides better entity resolution, a streamlined vetting process and a consolidation of the traveler and applicant hot lists. Through increased efficiencies, automation of the Primary Lookout Override function, and system-to-system access to external databases, UPAX reduces the average vetting time for a traveler/applicant and allows for expansion of name matching algorithms.
Goal 1
292014 Performance and Accountability Report • U.S. Customs and Border Protection
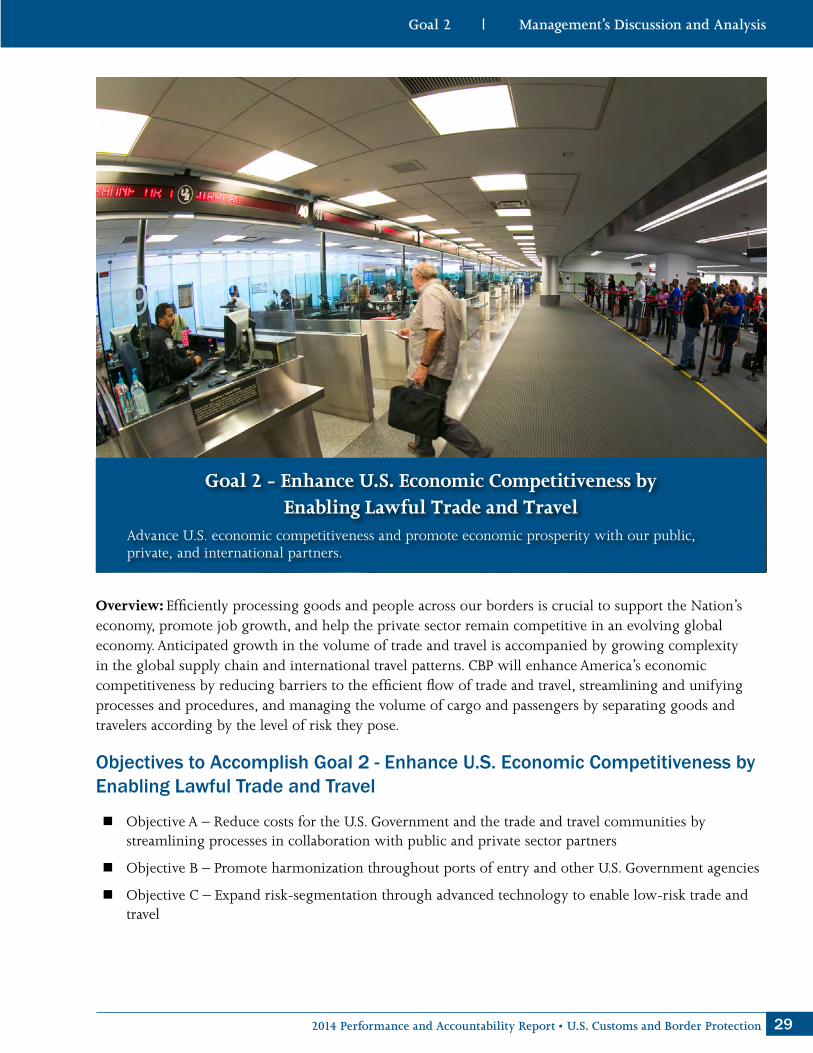
Goal 2 - Enhance U.S. Economic Competitiveness by Enabling Lawful Trade and Travel
Advance U.S. economic competitiveness and promote economic prosperity with our public,private, and international partners.
Overview: Efficiently processing goods and people across our borders is crucial to support the Nation’s economy, promote job growth, and help the private sector remain competitive in an evolving global economy. Anticipated growth in the volume of trade and travel is accompanied by growing complexity in the global supply chain and international travel patterns. CBP will enhance America’s economic competitiveness by reducing barriers to the efficient flow of trade and travel, streamlining and unifying processes and procedures, and managing the volume of cargo and passengers by separating goods and travelers according by the level of risk they pose.
Objectives to Accomplish Goal 2 - Enhance U.S. Economic Competitiveness by Enabling Lawful Trade and Travel
� Objective A – Reduce costs for the U.S. Government and the trade and travel communities by streamlining processes in collaboration with public and private sector partners
� Objective B – Promote harmonization throughout ports of entry and other U.S. Government agencies
� Objective C – Expand risk-segmentation through advanced technology to enable low-risk trade and travel
Goal 2
30 U.S. Customs and Border Protection • 2014 Performance and Accountability Report
Reduce Costs for the U.S. Government and the Trade and Travel Communities by Streamlining Processes in Collaboration with Public and Private Sector Partners
CBP continuously identifies and eliminates barriers to the flow of lawful cargo and passengers by collaborating with the private sector to leverage innovative technology and processes. By automating information collection and dissemination, CBP enhances data quality and streamlines risk-informed decision-making to expedite the flow of legitimate cargo and passengers. To ensure entry decisions are made quickly and accurately, CBP integrates systems and information databases with other U.S. agencies to validate visa eligibility and verify passports.
CBP leads the “One U.S. Government” initiative with a single window for electronic submissions by trade and travel communities of all import, export, and transit-related shipment information. In FY 2014, CBP responded to Executive Order 13659 and helped establish an expanded Border Interagency Executive Council to develop an efficient single window system, the International Trade Data System (ITDS) by December 2016. ITDS will streamline the U.S. Government’s cargo import and export processes by integrating various reporting requirements of the partner government agencies into CBP’s ACE, freeing industry from the burden of submitting data to multiple government agencies. Under the BIEC, CBP and the other partner government agencies will also work with the private sector to leverage innovative supply chain solutions.
Strategies to Reduce Costs for the U.S. Government and the Trade and Travel Communities by Streamlining Processes in Collaboration with Public and Private Sector Partners
Immigration Advisory Program (IAP) and Joint Security Program (JSP): IAP is part of CBP’s pre-departure strategy to prevent terrorists and improperly documented travelers from boarding U.S. bound commercial flights. JSP is a component of the IAP that partners CBP officers with host country law enforcement to disrupt terrorist travel and intercept narcotics, bulk currency, illegal migrants and fugitives. While IAP focuses on screening U.S. bound passengers, JSP targets travelers arriving into and departing from host countries, both U.S. bound and foreign-to-foreign. In FY 2014, IAP and JSP officers, in conjunction with NTC-P, issued 3,696 “no board” recommendations to carriers and host governments, which resulted in an estimated $9.2 million cost savings for CBP.
Entry/Exit Transformation (EXT) Program: This program enables CBP to process more travelers in less time with a higher degree of security and immigration integrity. It improves CBP and ICE immigration enforcement operations and enables DHS to better manage the Visa Waiver Program—a program administered by DHS that enables eligible citizens or nationals of designated countries to travel to the U.S. for tourism or business for stays of 90 days or less without first obtaining a visa. The EXT Program includes a holistic assessment of operational processes; an evaluation of a variety of technologies; testing and deploying new biometric technologies while building on existing biographic data collection; and implementing NII technology. In FY 2014, the EXT Program assumed ownership of the Arrival and Departure Information System database and opened a new facility to test biometric technology in partnership with the DHS Science and Technology Directorate. The program began three experimental projects that will be fielded in 2015: 1. Facial recognition to assist in imposter detection; 2. Outbound
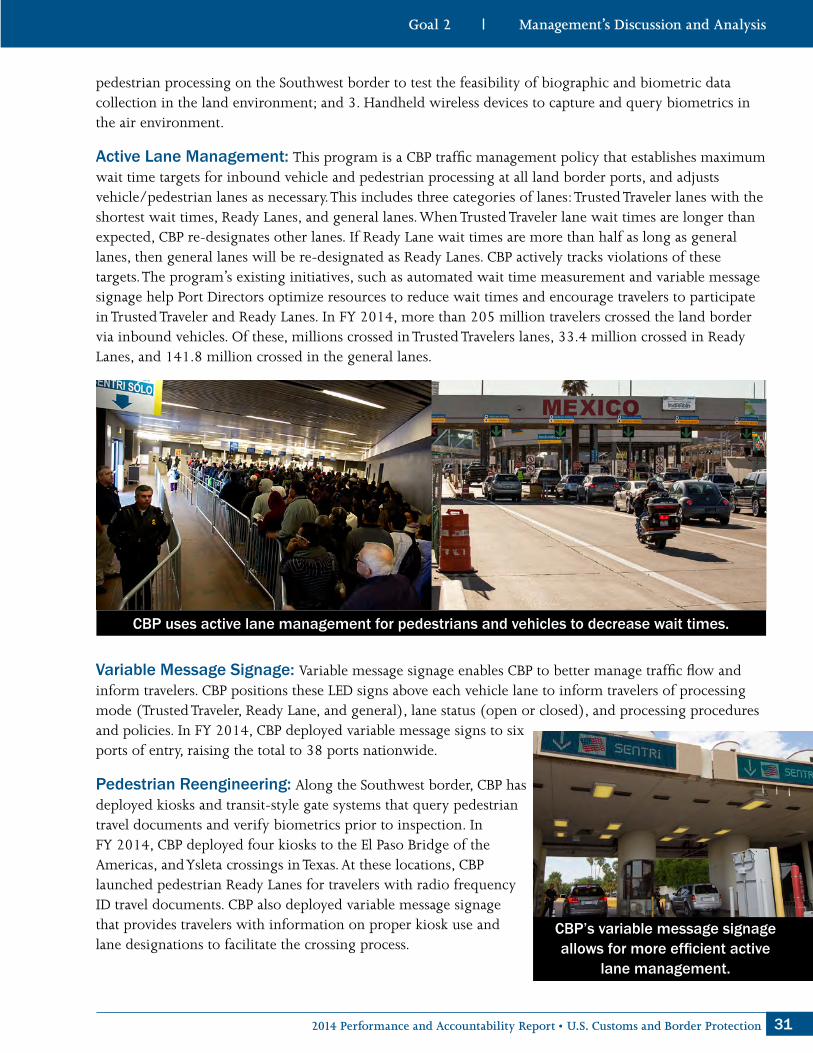
312014 Performance and Accountability Report • U.S. Customs and Border Protection
pedestrian processing on the Southwest border to test the feasibility of biographic and biometric data collection in the land environment; and 3. Handheld wireless devices to capture and query biometrics in the air environment.
Active Lane Management: This program is a CBP traffic management policy that establishes maximum wait time targets for inbound vehicle and pedestrian processing at all land border ports, and adjusts vehicle/pedestrian lanes as necessary. This includes three categories of lanes: Trusted Traveler lanes with the shortest wait times, Ready Lanes, and general lanes. When Trusted Traveler lane wait times are longer than expected, CBP re-designates other lanes. If Ready Lane wait times are more than half as long as general lanes, then general lanes will be re-designated as Ready Lanes. CBP actively tracks violations of these targets. The program’s existing initiatives, such as automated wait time measurement and variable message signage help Port Directors optimize resources to reduce wait times and encourage travelers to participate in Trusted Traveler and Ready Lanes. In FY 2014, more than 205 million travelers crossed the land border via inbound vehicles. Of these, millions crossed in Trusted Travelers lanes, 33.4 million crossed in Ready Lanes, and 141.8 million crossed in the general lanes.
CBP uses active lane management for pedestrians and vehicles to decrease wait times.
Variable Message Signage: Variable message signage enables CBP to better manage traffic flow and inform travelers. CBP positions these LED signs above each vehicle lane to inform travelers of processing mode (Trusted Traveler, Ready Lane, and general), lane status (open or closed), and processing procedures and policies. In FY 2014, CBP deployed variable message signs to six ports of entry, raising the total to 38 ports nationwide.
Pedestrian Reengineering: Along the Southwest border, CBP has deployed kiosks and transit-style gate systems that query pedestrian travel documents and verify biometrics prior to inspection. In FY 2014, CBP deployed four kiosks to the El Paso Bridge of the Americas, and Ysleta crossings in Texas. At these locations, CBP launched pedestrian Ready Lanes for travelers with radio frequency ID travel documents. CBP also deployed variable message signage that provides travelers with information on proper kiosk use and lane designations to facilitate the crossing process.
CBP’s variable message signage allows for more efficient active
lane management.

32 U.S. Customs and Border Protection • 2014 Performance and Accountability Report
In FY 2014, CBP deployed a wireless infrastructure to the Detroit Ambassador Bridge port of entry. This included adding automated license plate readers to allow CBP to process and report on Michigan’s Enhanced Driver License—a federally approved document that allows holders to re-enter the U.S. when
traveling by land or sea from Canada, Mexico, Bermuda, and the Caribbean, and provides CBP officers with more processing speed and accuracy at ports of entry.
Mobile Technology Solutions: These mobile devices capture and query license plate images, enable document machine-readable zone swipes, and provide the results to officers or agents. During FY 2014, CBP supported mobile handheld technology on outbound and Border Patrol checkpoints. This included the Enforcement Link Mobile Operations (ELMO) application that provides real-time tactical targeting data to field personnel via a smartphone or tablet device. ELMO is used by all CBP frontline personnel and has helped intercept undocumented aliens, narcotics, unreported currency, and weapons.
In FY 2014, CBP deployed ELMO to the Seattle Field Office for rail operations, and based on its success, deployed the technology to support maritime operations on the Great Lakes. Also in FY 2014, CBP procured mobile technology to deploy in FY 2015 to support multiple operational environments
including air and marine, agriculture inspections, in-stream boarding, and cargo and inbound passenger processing, including rail and cruise ships.
Border Security Deployment Program: This program is an integrated surveillance and intrusion-detection system—consisting of more than 8,400 cameras and microphones—that provide security, motion detection, and remote monitoring capabilities across every U.S. land port of entry. The system connects via the DHS Wide Area Network to remote monitoring stations called Customs Area Security Centers. These centralized command centers house digital video recorders augmented with analytic software to alert watch officers of a detected alarm or intrusion within a port facility and archive the event as evidence in subsequent investigations and prosecutions.
CBP deploys remote monitoring capabilities across every U.S. land port of entry.

332014 Performance and Accountability Report • U.S. Customs and Border Protection
In FY 2014, CBP installed surveillance capabilities at the Peace Bridge border crossing in Buffalo, New York as part of a public-private partnership to improve border security, relieve congestion, and reduce border wait times. As a part of CBP’s Border Security Deployment Program, CBP collaborates with
private industry, exploring alternative funding streams for mutually beneficial business and mission improvements.
Promote Harmonization throughout Ports of Entry and Other U.S. Government Agencies
CBP harmonizes processes across ports of entry to unify enforcement, and enhance the global economy with reduced transaction costs and an efficient movement of people. Supporting a whole of government approach, CBP unifies federal efforts and develops international common practices. CBP maintains Centers of Excellence and Expertise to develop these common practices and expand CBP’s focus on “Trade in the 21st Century” by aligning the Agency to modern business practices, focusing on industry-specific issues, and tailoring support to unique trading environments.
CBP operations complement private sector practices. This includes Trusted Trader and Traveler programs that enhance CBP’s supply chain and information gathering capabilities to better identify low-risk cargo and passengers and expedite their cross-border movement.
Strategies to Promote Harmonization throughout Ports of Entry and Other U.S. Government Agencies
Trusted Traveler Programs: CBP operates four Trusted Traveler programs: Northern Exchange with the U.S. (NEXUS), Secure Electronic Network for Travelers Rapid Inspection (SENTRI), Fast and Secure Trade (FAST), and Global Entry. These programs expedite the processing of pre-approved, low-risk travelers, allowing CBP to focus on higher-risk travelers. Applicants apply online through CBP’s Global Online Enrollment System (GOES) and undergo a background check, biometrics collection, and an interview with a CBP officer. Participation in these fee-based programs is voluntary, and membership is valid for five years. Once an applicant is enrolled in a program, CBP runs law enforcement checks every 24 hours. All Trusted Traveler members receive radio frequency identification (RFID) cards for use at land borders.
NEXUS is a cooperative effort between CBP and Canada Border Services Agency (CBSA). U.S. citizens and lawful permanent residents, and Canadian citizens and permanent residents are eligible for NEXUS. NEXUS members must be interviewed by both CBP and CBSA officers to receive expedited entry into the U.S. and Canada by land, air, and sea environments. NEXUS Air applicants must have their iris scan collected by CBSA.
SENTRI provides expedited CBP processing from Mexico through dedicated commuter lanes for vehicles and pedestrians. SENTRI has no citizenship requirement and is open to anyone who wants to apply. Members use their RFID-enabled card for identification and to validate their status upon arrival at a U.S. port of entry.

34 U.S. Customs and Border Protection • 2014 Performance and Accountability Report
FAST is a commercial clearance program for known low-risk shipments from Canada and Mexico that expedites processing for commercial carriers who have completed background checks and meet eligibility requirements. FAST vehicle lanes process cargo at land border ports of entry. Participation in FAST requires that every link in the supply chain, from manufacturer to carrier to driver to importer, be certified under the Customs-Trade Partnership Against Terrorism (C-TPAT) program. FAST provides dedicated lanes to facilitate efficient transborder shipment processing, reduces the number of inspections and border delays, and prioritizes front-of-the-line CBP processing.
Global Entry expedites the clearance of pre-approved low-risk air travelers into the U.S. Global Entry members use automated kiosks at designated airports to bypass the regular passport control queues, and enter the U.S. without routine CBP questioning (unless chosen for a selective or random secondary referral). U.S. citizens and lawful permanent residents; and citizens of Mexico, the Netherlands, Panama, and South Korea may apply for Global Entry. CBP is operating pilot programs with Germany, Qatar, and the United Kingdom, allowing limited numbers of their citizens to participate. CBP has also signed joint statements with Australia, Israel, New Zealand, and Saudi Arabia. All NEXUS program members and U.S. citizens and U.S. lawful permanent residents enrolled in SENTRI may also use Global Entry kiosks. In FY 2014, CBP added Global Entry services to repurposed kiosks at Miami International Airport, and kiosks to Montreal Preclearance. CBP also set up a new enrollment center in Pittsburgh to service the enrollments of CBP Trusted Travelers and TSA PreCheck members.
Travel and Tourism Initiatives: Supporting the President’s Travel and Tourism Strategy, CBP examines and improves its business processes to facilitate a more welcoming, interactive, and secure arrivals process. In partnership with the travel and tourism industry, CBP has developed airport action plans at 17 gateway airports with the top international arrival volume. During the summer of 2014, CBP met with travel stakeholders to discuss air travel challenges and steps to improve the international arrivals process. Stakeholders included representatives from airlines, airports, hotels, theme parks, visitor and convention bureaus; and local elected officials, congressional representatives, and representatives from federal agencies such as DHS and the U.S. Department of Commerce. CBP used stakeholder input to develop plans to change infrastructure and improve the airport environment including:
� Automated Passport Control Kiosks
� Mobile Passport Control- Pilot initiated in August 2014
Passengers use Global Entry kiosks that allow expedited clearance for pre-approved, low-risk
travelers.

352014 Performance and Accountability Report • U.S. Customs and Border Protection
� Growth in Trusted Traveler Programs
� Expanded public-private partnerships
� Improved signage and multimedia
� Increased use of traveler surveys to measure satisfaction
Automated Passport Control (APC): APC expedites the entry process for U.S., Canadian, and eligible Visa Waiver Program international travelers via automated processing through CBP’s Primary Inspection area. Travelers use self-service kiosks to submit their customs declaration and biographic information. Instead of filling out a paper customs declaration form, eligible passengers use the APC kiosks for electronic submission. Travelers scan their passport, take a photograph using the kiosk, and answer a series of questions verifying biographic and flight information. This reduces wait times and congestion and speeds processing. By the end of FY 2014, CBP implemented APC at various sites and is now processing more than 90,000 passengers per day, up from 9,000 at the beginning of FY 2014.
Airport Wait Time System: This system shows flight processing times for arriving flights at the busiest international airports, the number of passengers processed on flights arriving in each hour, and how long it took for those passengers to clear passport control. In FY 2014, CBP upgraded the system by accounting for varying flight arrival patterns heavily impacted by time-of-year, day-of-week, and time-of-day metrics, helping travelers plan their next flight.
Expand Risk-Segmentation through Advanced Technology to Enable Low-Risk Trade and Travel
CBP automates the categorization and segmentation of goods and travelers according to the risks they pose to expedite legitimate passengers and cargo. This includes analyzing border traffic using accurate risk assessments for every traveler and cargo shipment that crosses the U.S. border. CBP automates trade and travel processes, increases information sharing and collaboration, and uses advanced data to more quickly and easily identify high-risk cargo and passengers.
CBP cultivates information-sharing partnerships to efficiently and accurately identify and validate low-risk importers and travelers. As CBP refines data collection and more accurately understands the behaviors and actions that indicate risk, it uses advanced analytics to detect and predict trends that identify high-risk passengers and cargo earlier in the transit process.
Global Entry and APC kiosks are located at international airports across the Nation.
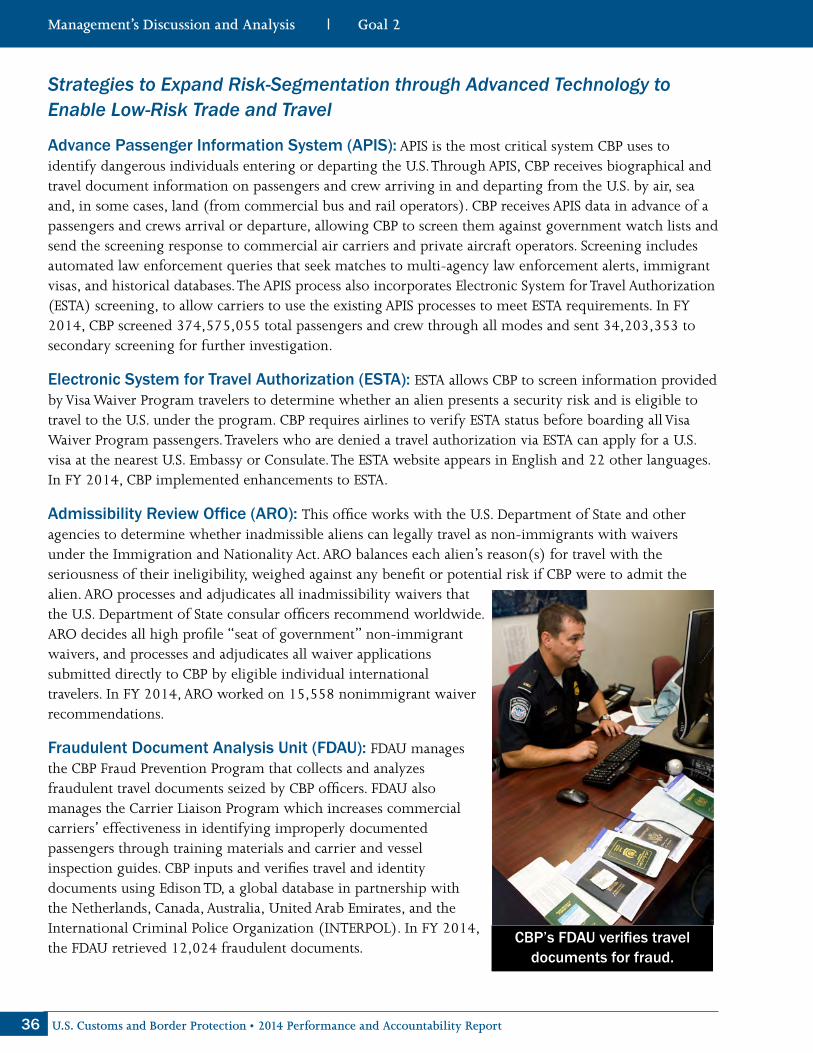
36 U.S. Customs and Border Protection • 2014 Performance and Accountability Report
Strategies to Expand Risk-Segmentation through Advanced Technology to Enable Low-Risk Trade and Travel
Advance Passenger Information System (APIS): APIS is the most critical system CBP uses to identify dangerous individuals entering or departing the U.S. Through APIS, CBP receives biographical and travel document information on passengers and crew arriving in and departing from the U.S. by air, sea and, in some cases, land (from commercial bus and rail operators). CBP receives APIS data in advance of a passengers and crews arrival or departure, allowing CBP to screen them against government watch lists and send the screening response to commercial air carriers and private aircraft operators. Screening includes automated law enforcement queries that seek matches to multi-agency law enforcement alerts, immigrant visas, and historical databases. The APIS process also incorporates Electronic System for Travel Authorization (ESTA) screening, to allow carriers to use the existing APIS processes to meet ESTA requirements. In FY 2014, CBP screened 374,575,055 total passengers and crew through all modes and sent 34,203,353 to secondary screening for further investigation.
Electronic System for Travel Authorization (ESTA): ESTA allows CBP to screen information provided by Visa Waiver Program travelers to determine whether an alien presents a security risk and is eligible to travel to the U.S. under the program. CBP requires airlines to verify ESTA status before boarding all Visa Waiver Program passengers. Travelers who are denied a travel authorization via ESTA can apply for a U.S. visa at the nearest U.S. Embassy or Consulate. The ESTA website appears in English and 22 other languages. In FY 2014, CBP implemented enhancements to ESTA.
Admissibility Review Office (ARO): This office works with the U.S. Department of State and other agencies to determine whether inadmissible aliens can legally travel as non-immigrants with waivers under the Immigration and Nationality Act. ARO balances each alien’s reason(s) for travel with the seriousness of their ineligibility, weighed against any benefit or potential risk if CBP were to admit the alien. ARO processes and adjudicates all inadmissibility waivers that the U.S. Department of State consular officers recommend worldwide. ARO decides all high profile “seat of government” non-immigrant waivers, and processes and adjudicates all waiver applications submitted directly to CBP by eligible individual international travelers. In FY 2014, ARO worked on 15,558 nonimmigrant waiver recommendations.
Fraudulent Document Analysis Unit (FDAU): FDAU manages the CBP Fraud Prevention Program that collects and analyzes fraudulent travel documents seized by CBP officers. FDAU also manages the Carrier Liaison Program which increases commercial carriers’ effectiveness in identifying improperly documented passengers through training materials and carrier and vessel inspection guides. CBP inputs and verifies travel and identity documents using Edison TD, a global database in partnership with the Netherlands, Canada, Australia, United Arab Emirates, and the International Criminal Police Organization (INTERPOL). In FY 2014, the FDAU retrieved 12,024 fraudulent documents.
CBP’s FDAU verifies travel documents for fraud.

372014 Performance and Accountability Report • U.S. Customs and Border Protection
National Agriculture Release Program: A national agricultural cargo release program developed in cooperation with the U.S. Department of Agriculture Animal and Plant Health Inspection Service (APHIS), Plant Protection and Quarantine (PPQ) division. This program identifies high volume imports of regulated agricultural commodities that represent a low risk for exotic plant pest or pathogen introduction. APHIS-PPQ has determined that these high-volume, low-risk commodities can be inspected at reduced rates and would not compromise U.S. agricultural resources.
Automated Commercial Environment (ACE): ACE is CBP’s new import and export processing system that facilitates the movement of legitimate trade through more effective trade account management. By the end of 2016, ACE will become the primary system through which the trade community will report imports and exports, and the Federal Government can determine admissibility. Dubbed the “Single Window,” this system will streamline and automate manual processes by eliminating paper submissions, allowing the international trade community to more easily and efficiently comply with U.S. laws and regulations. CBP continues to develop ACE so it can deliver new capabilities in a secure, paper-free, web-enabled environment. In FY 2014, CBP deployed new ACE capabilities including changes to the ACE Cargo Release, Entry Summary, and participating government agency Integration business processes.
The Executive Order on Streamlining the Export/Import Process for America’s Businesses, signed on February 19, 2014, directs federal agencies with a role in trade to complete development of an electronic “Single Window” by December 31, 2016.
Automated Export System (AES): A component of ACE, AES is the central point where export shipment data is filed electronically, providing an alternative to filing paper electronic export information. The system detects errors in export information and allows users to correct them at the time of filing. AES is a nationwide system at all ports, for all methods of transportation. It assures compliance with and enforcement of export laws, improves trade statistics, reduces duplicate reporting to multiple agencies, and improves customer service. In FY 2014, CBP’s OIT re-engineered AES to provide a new Single Window user interface for CBP and participating government agencies users.
Global Online Enrollment System (GOES): GOES is a system that allows registered users to apply for CBP Trusted Traveler Programs. In FY 2014, CBP’s OIT enhanced GOES in support of the Asia-Pacific Economic Cooperation Business Travel Card (ABTC) project. This enhancement allows U.S. citizens to apply for the Trusted Traveler Program and ABTC at the same time, allows Panamanian citizens to apply for Global Entry, and allows Canadian citizens to apply for the ABTC.
Inbound Radio Frequency Identification (RFID) Saturation: CBP has issued nearly 29 million enabled RFID travel documents since January 2008. Used in CBP Ready Lanes, RFID documents reduce processing time through Active Lane Management. In FY 2014, 35.7 million vehicles crossed the border using RFID-enabled travel documents, with a 46.3 second average Ready Lane wait time.

38 U.S. Customs and Border Protection • 2014 Performance and Accountability Report
Goal 3 - Advance Comprehensive Border Security and ManagementSafeguard and manage the Nation’s air, land, and maritime borders through the active administration of U.S. immigration and trade laws; and develop risk-informed strategies to target enforcement and operational capabilities to meet the highest priority threats in the border environment.
Overview: CBP deploys air, land, and marine assets to patrol and safeguard U.S. border areas, as well as sophisticated systems to detect and interdict potential threats beyond its borders. CBP prevents the illegal movement of people and contraband crossing U.S. airspace; approximately 6,900 miles of land border; and in partnership with the U.S. Coast Guard, approximately 95,000 miles of shoreline. CBP anticipates and responds to diverse illegal activities including terrorism, transnational crime, counterfeit and unsafe goods, agricultural pests and diseases, narcotics smuggling, human trafficking, the unlawful transport of immigrants, and the transfer of prohibited weapons and illicit bulk currency.
In its border management and protection efforts, CBP assesses numerous variables including points of origin, modes of transit, arrival at U.S. borders, as well as routes leading away from the physical border. While enabling the flow of lawful trade and travel, CBP ensures proper revenue collection and prevents the illegal movement of people and contraband through 328 air, land, and maritime ports of entry. CBP partners with federal, state, local, tribal, territorial, and international law enforcement agencies to strengthen its ability to safeguard and manage the border.
Objectives to Accomplish Goal 3 - Advance Comprehensive Border Security and Management
� Objective A – Reduce costs for the U.S. Government and the trade and travel communities by streamlining processes in collaboration with public and private sector partners

392014 Performance and Accountability Report • U.S. Customs and Border Protection
� Objective B – Promote harmonization throughout ports of entry and other U.S. Government agencies
� Objective C – Expand risk-segmentation through advanced technology to enable low-risk trade and travel
� Objective D – Strengthen processes to conduct outbound enforcement and interdiction of travelers and cargo
� Objective E – Advance a comprehensive, predictive targeting strategy to identify threats as early as possible
Increase Situational Awareness of the Air, Land and Maritime Borders
CBP maintains and constantly enhances a comprehensive understanding of the threat environment and current and projected operating conditions at specific border regions. This begins with information collected by CBP’s intelligence, surveillance, and reconnaissance capabilities, combined with a thorough analysis of cross-border trends, especially those concerning illicit trafficking and unlawful border crossings. CBP leverages a wide range of tactics, skills, and technologies to improve data and information collection, formulate actionable intelligence, and enhance situational awareness.
To increase situational awareness, CBP leads efforts to collaborate and coordinate with domestic law enforcement, intelligence, local community, and foreign law enforcement partners. This includes assisting international partners in expanding their resources and capacities through coordinated training and exercises. CBP uses various tactics to gather information and intelligence including periodic reconnaissance patrols, sign-cutting and tracking, UAS patrols, and routine interaction with security partners within local communities. CBP leverages advanced technologies such as biometrics, mobile surveillance systems, radiation detectors, ground sensors, and imaging systems to better detect, identify, monitor, and appropriately respond to threats across U.S. border regions.
Strategies to Increase Situational Awareness of the Air, Land and Maritime Borders
Alliances to Combat Transnational Threats (ACTTs): ACTTs are collaborative, unified command enforcement approaches to target TCOs using the capabilities and resources of federal, state, local, and tribal law enforcement and public safety organizations. CBP works with these strategic partners to develop coordinated operational plans based on their specific mission, capabilities, and jurisdiction.
New Mexico/West Texas ACTT: The New Mexico/West Texas ACTT is the unified command that directs DHS components and other law enforcement entities in intelligence-driven operations within the New Mexico/West Texas corridor. This includes identifying TCO tactics, techniques, and procedures. In FY 2014, the New Mexico/West Texas ACTT identified Mexican drug trafficking organizations critical capability nodes—a capability, element, or position whose disruption immediately degrades the ability to conduct operations—resulting in focused targeting and intelligence collection efforts.
Arizona ACTT: The Arizona ACTT is the unified command that deters, denies, degrades, and disrupts TCO activities in the Arizona corridor by leveraging the resources of law enforcement agencies operating in Arizona and Mexico. This command investigates TCO activities in Tucson and Phoenix and border enforcement operations at and between ports of entry.

40 U.S. Customs and Border Protection • 2014 Performance and Accountability Report
In January 2014, Border Patrol agents and federal police from Mexico, discovered an incomplete, cross-border tunnel during a bi-national border sweep in Nogales, Arizona, west of the DeConcini Port of Entry. After observing freshly disturbed dirt within the channel floor of a drainage system, authorities discovered a tunnel originating in Mexico and extending into the U.S. Tunnels
continue to be used by TCOs attempting to operate in the Southern Arizona Corridor. The Border Patrol continues to work closely with strategic partners in Mexico to detect tunnels being constructed, and to prevent their completion prior to movement of illegal contraband or persons across the border.
Southern Border Bi-National Operations: These are joint operations to target the trafficking of narcotics, weapons, ammunition, humans, and currency along the U.S. border with Mexico. Southern border binational operations improve information gathering and analysis so terrorist and TCO threats can be interdicted outside of U.S. borders. Through the Cross Border Coordination Initiative, the Border Patrol conducts simultaneous operations with the Mexico Federal Police in mutually agreed-upon zones to degrade TCO activity on both sides of the border through the exchange of information, physical officer presence coordinated response, and increased officer training. CBP has established International Liaison Units (ILUs) to coordinate law enforcement activities between CBP and its Mexican counterparts and serve as points of contact when preparing for and/or responding to border violence.
Northern Border Bi-National Operations: These are joint operations between the U.S. and Canada to improve border management and lay the foundation for security and economic prosperity, outlined in the 2011 Beyond the Border Action Plan. These operations address threats early; facilitate trade, economic growth and jobs; enforce laws across the border; and safeguard critical infrastructure and cybersecurity. Some bi-national operations include the Cross Border Crime Forum, established in 1997 that facilitates cooperative U.S.-Canada investigations of cross-border crime; and Integrated Border Enforcement Teams (IBETs) across 15 regions comprised of U.S. and Canadian Federal, state/provincial, tribal and local law enforcement personnel.
CBP Northern Border Bi-national Operations include an Operations Integration Center in Detroit.
In FY 2014, CBP’s OAM executed year two of its Northern Border Realignment Plan. This includes the relocation of 13 personnel who were selected during the previous year, and the selection of 13 additional personnel to relocate from the Northern border region to priority areas.
Success Story
412014 Performance and Accountability Report • U.S. Customs and Border Protection
Detect, Interdict and Disrupt Illegal Cross-Border Activities
CBP is vigilant in anticipating and responding to threats to national security and in ensuring the safety of the U.S. public. CBP employs risk-informed approaches that incorporate intelligence, shared information, and situational awareness protocols to enable rapid response, strengthen integrated operations, and discourage future illegal activities. CBP and its law enforcement partners address cross-border threats in an integrated and efficient manner. CBP provides unified efforts, such as corridor campaigns that involve joint interagency planning, operational design, and execution.
CBP works closely with other federal agencies to support the President’s National Strategy to Combat Transnational Organized Crime. CBP expands mobile and rapid interdiction capabilities to further enable a quick and appropriate response to changing threats, targeting the highest risk regions on and around U.S. borders. When illegal cross-border activity is discovered, CBP administers the most appropriate consequences to discourage recidivist behavior, and degrade TCO and terrorist capabilities.
Strategies to Detect, Interdict and Disrupt Illegal Cross-Border Activities
Replacement of Unattended Ground Sensors (UGS): CBP replaced old UGSs in selected Border Patrol Sectors with new UGS technologies. From June 2014 to December 2014, CBP replaced old UGSs, processing 992 incoming old UGSs from 17 OBP Sectors; and replaced them with more than 1,000 new UGSs. These efforts supported Border Patrol’s initiative to dispose of non-Federal Communications Commission compliant sensor equipment, and increase operational availability of mission-critical surveillance equipment.
In FY 2014, CBP successfully completed the Pedestrian Fence 225 Project, part of DHS’ multi-layered strategy, via the Secure Fence Act of 2006 to construct the necessary infrastructure to deter and prevent illegal entry along the Southwest border.
California Corridor Campaign (C3): C3 is the campaign of the California Corridor Unified Command (CCUC) to collectively target shared threats and priorities to disrupt and dismantle TCOs operating in and around the California/Mexico border. The CCUC is an integrated command comprised of six organizations: CBP Border Patrol, CBP OFO, CBP OAM, ICE Enforcement and Removal Operations (ERO), U.S. Department of Justice (DOJ)/U.S. Attorney’s Office, and the U.S. Department of Justice, Drug Enforcement Administration (DEA).
During FY 2014, C3 components conducted numerous joint operations and investigations that resulted in the successful apprehensions and seizures of: 630 pounds of processed marijuana, 1,574 marijuana plants, 51.3 pounds of methamphetamine, 57.5 pounds of heroin, and 49.6 pounds of cocaine. In
addition, C3 operations resulted in the seizure of: 22 firearms, 13,880 rounds of ammunition, 14 vehicles, U.S. currency in the amount of $9,623, and the arrests of 70 illegal aliens and 48 U.S. citizens.

42 U.S. Customs and Border Protection • 2014 Performance and Accountability Report
As a result of C3 integrated efforts, in April 2014, Mexican Federal Police - working with the San Diego and El Centro Sector Border Patrol arrested the leader of the Diablo TCO in Mexico who was wanted by U.S. officials for smuggling, kidnapping, and extortion in East San Diego County.
Success Story
South Texas Campaign: This campaign is a unified command where CBP works closely with federal, state, and local law enforcement partners in South Texas and Mexican counterparts to collect and assess intelligence for enforcement operations along the South Texas Corridor. This includes regular face-to-face and virtual meetings with leadership from CBP, ICE, FBI, DEA, and other law enforcement partners to synergize efforts to target TCOs. The South Texas Campaign focuses on outcomes, such as apprehensions of key corridor targets, prosecutions, and convictions of major smuggling organization members to disrupt and degrade the ability of TCOs to operate, rather than outputs such as seizures or apprehensions.
The South Texas Campaign patrols and monitors the border across land, sea, and air.
The South Texas Campaign uses intelligence driven collection initiatives to focus corridor intelligence collection efforts. Initiatives in the Rio Grande Valley revealed 98% of targeted or suspected guides were Mexican juveniles. In conjunction with the U.S. Department of Health and Human Services Office
of Refugee Resettlement, the South Texas Campaign developed the Juvenile Referral Program pilot initiative to disrupt this trend.
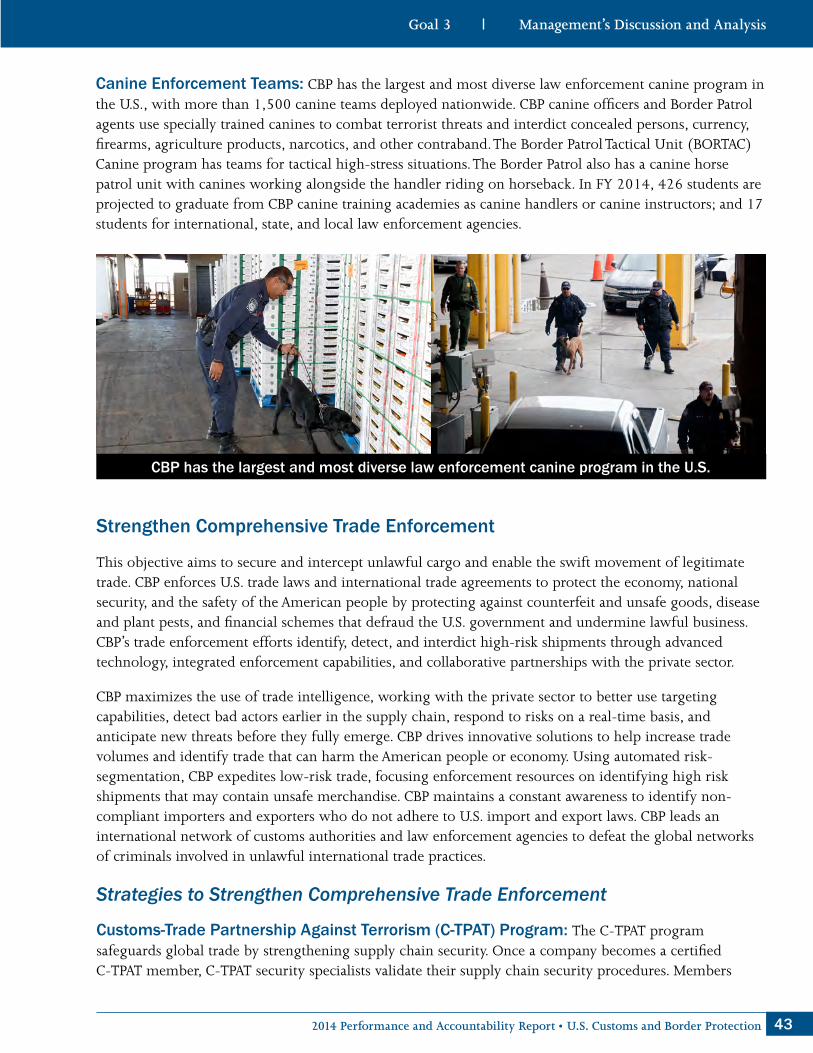
432014 Performance and Accountability Report • U.S. Customs and Border Protection
Canine Enforcement Teams: CBP has the largest and most diverse law enforcement canine program in the U.S., with more than 1,500 canine teams deployed nationwide. CBP canine officers and Border Patrol agents use specially trained canines to combat terrorist threats and interdict concealed persons, currency, firearms, agriculture products, narcotics, and other contraband. The Border Patrol Tactical Unit (BORTAC) Canine program has teams for tactical high-stress situations. The Border Patrol also has a canine horse patrol unit with canines working alongside the handler riding on horseback. In FY 2014, 426 students are projected to graduate from CBP canine training academies as canine handlers or canine instructors; and 17 students for international, state, and local law enforcement agencies.
CBP has the largest and most diverse law enforcement canine program in the U.S.
Strengthen Comprehensive Trade Enforcement
This objective aims to secure and intercept unlawful cargo and enable the swift movement of legitimate trade. CBP enforces U.S. trade laws and international trade agreements to protect the economy, national security, and the safety of the American people by protecting against counterfeit and unsafe goods, disease and plant pests, and financial schemes that defraud the U.S. government and undermine lawful business. CBP’s trade enforcement efforts identify, detect, and interdict high-risk shipments through advanced technology, integrated enforcement capabilities, and collaborative partnerships with the private sector.
CBP maximizes the use of trade intelligence, working with the private sector to better use targeting capabilities, detect bad actors earlier in the supply chain, respond to risks on a real-time basis, and anticipate new threats before they fully emerge. CBP drives innovative solutions to help increase trade volumes and identify trade that can harm the American people or economy. Using automated risk-segmentation, CBP expedites low-risk trade, focusing enforcement resources on identifying high risk shipments that may contain unsafe merchandise. CBP maintains a constant awareness to identify non-compliant importers and exporters who do not adhere to U.S. import and export laws. CBP leads an international network of customs authorities and law enforcement agencies to defeat the global networks of criminals involved in unlawful international trade practices.
Strategies to Strengthen Comprehensive Trade Enforcement
Customs-Trade Partnership Against Terrorism (C-TPAT) Program: The C-TPAT program safeguards global trade by strengthening supply chain security. Once a company becomes a certified C-TPAT member, C-TPAT security specialists validate their supply chain security procedures. Members

44 U.S. Customs and Border Protection • 2014 Performance and Accountability Report
are incentivized to ensure their supply chains meet or exceed C-TPAT security criteria. As of September 2014, C-TPAT had 10,834 program participants. Also in FY 2014, CBP worked with TSA to implement a joint air carrier assessment program which meets TSA Office of Global Strategies and C-TPAT program criteria, reducing redundancies with other agency programs.
In June 2014, C-TPAT signed a mutual recognition arrangement with Israel’s Authorized Economic Operator program. This arrangement links these industry partnership programs to further secure and facilitate global cargo trade, providing C-TPAT and Israel AEO members fewer exams when shipping
cargo and a faster validation process. In addition to Israel, the U.S. also has mutual recognition arrangements with New Zealand, Canada, Japan, Korea, Jordan, the European Union, and Taiwan, and is currently in the process of establishing similar arrangements with Mexico, China, India, and Brazil.
Trusted Trader Program: In June 2014, CBP announced plans to begin an 18-month test of the Trusted Trader program, a program where importers can establish compliance with laws and regulations for secure supply chains and strong internal controls, enforced by CBP, U.S. Consumer Product Safety Commission (CPSC), and the U.S. Food and Drug Administration (FDA). This test of the Trusted Trader program aims to strengthen collaboration between federal agencies and move toward a whole of government approach to supply chain security and trade compliance. CBP encourages importers through incentives) to secure their supply chains and strengthen their internal controls.
Trade Transformation Initiatives: These initiatives expedite the flow of legitimate cargo by creating efficiencies that drive down costs for business and the U.S. Government while securing the global supply chain. Examples of Trade Transformation initiatives include CBP Centers of Excellence and Expertise, ACE, ACAS, and Trade Partnerships. The CBP Centers of Excellence and Expertise help maintain a strong and competitive U.S. economy through innovative trade management techniques. They align CBP trade resources by industry and manage importers by account. By virtually linking trade personnel across the country into industry-based, multi-disciplinary teams, CBP facilitates trade and develops a deeper understanding of industry practices, risk areas, and enforcement issues. Ten Centers of Excellence and Expertise are now open and conducting entry summary activities for participating importers:
� Agriculture & Prepared Products (Miami)
� Apparel, Footwear & Textiles (San Francisco)
� Automotive & Aerospace (Detroit)
� Base Metals (Chicago)
� Consumer Products & Mass Merchandising (Atlanta)
� Electronics (Los Angeles)
� Industrial & Manufacturing Materials (Buffalo)
� Machinery (Laredo)
� Petroleum, Natural Gas & Minerals (Houston)
� Pharmaceuticals, Health & Chemicals (New York)

452014 Performance and Accountability Report • U.S. Customs and Border Protection
Strengthen Processes to Conduct Outbound Enforcement and Interdiction of Travelers and Cargo
CBP enhances the detection of potential threats and the legitimate flow of people and cargo and effectively manages the flow of outbound trade to inhibit the export of illicit currency, weapons, and other illegal products. Supporting a whole of government approach, CBP coordinates with the U.S. law enforcement and intelligence communities to verify outbound travelers and cargo. CBP strengthens its partnerships to share common data and intelligence, deploy innovative and cost-effective solutions, and support unity of effort across a global network of enforcement agencies. CBP creates information sharing programs to enhance outbound enforcement by allowing the exit information from one country to serve as the entry information for the other country, providing a low cost method to validate people and cargo, and alleviate the need for costly new infrastructures or processes.
CBP deploys innovative and cost-effective solutions to enhance validation of outbound cargo and passengers and better identify illegal or illicit activities, including travelers who overstay their lawful admission in the U.S. This includes working with the DHS Science and Technology Directorate to implement biometric capture capabilities to confirm the departure of non-U.S. citizens at airports and seaports and to more efficiently screen travelers entering the U.S.
Strategies to Strengthen Processes to Conduct Outbound Enforcement and Interdiction of Travelers and Cargo
Outbound Mission: CBP’s outbound mission is to interdict the illegal export of unreported currency, firearms, ammunition, and stolen property; prevent international terrorist groups and rogue nations from obtaining sensitive and controlled commodities; arrest fugitives; increase export compliance; and ensure that travelers and commerce departing the U.S. comply with U.S. export laws and regulations. CBP uses experienced CBP officers, canine teams, human and network intelligence, various inspection tools, and cooperation with foreign, federal, state, local and tribal law enforcement agencies. In FY 2014, CBP deployed temporary outbound infrastructure elements to priority Southwest border crossings including canopies for inclement weather, improved lighting for night operations, and traffic control devices for traveler/officer safety. CBP also deployed mobile handheld license plate readers to high risk crossings along the Northern border to assess risk to departing travelers and conveyances.
In FY 2014, CBP’s OIT modified the Advanced Passenger Information System (APIS) to query outbound APIS travelers (non-U.S. Citizens) against INTERPOL’s Stolen Lost Travel Documents (SLTD), including the alert message sent to INTERPOL. APIS improves border security by providing CBP with an
effective method of sharing information regarding the status of lost/stolen travel documents of outbound travelers with other law enforcement organizations.
Operation Stonegarden Grant Program: CBP and the Federal Emergency Management Agency (FEMA) worked together to manage and administer this grant program, aimed at enhancing coordination among federal, state, and local law enforcement agencies to secure the borders with Mexico, Canada, and international waters. Organizations eligible for Operation Stonegarden grant funding include county-level governments and federally recognized tribal governments in the states bordering Canada, Mexico or

46 U.S. Customs and Border Protection • 2014 Performance and Accountability Report
those with international water borders. Promoting a multilateral whole community approach, CBP uses risk-based prioritization to allocate grant funds from the Homeland Security Appropriations Act of 2010 (Public Law 110-83). In FY 2014, CBP and FEMA allocated $55 million in grant funds to 21 border states and territories under Operation Stonegarden.
In September 2014, Luna County Sheriff’s Office Deputies in New Mexico located several individuals walking in the desert using a Forward Looking Infrared Radiometer (FLIR) system obtained through Operation Stonegarden. The deputies contacted the Deming New Mexico Border Patrol Station and
in a joint effort, made contact with the individuals, who were found to be illegal aliens and were subsequently arrested.
Automation at Outbound and Checkpoints: CBP continues to incorporate new technologies for outbound vehicle and Border Patrol checkpoint processing on the southwest border. In FY 2014, CBP upgraded outbound locations and Border Patrol checkpoints with fixed license plate readers and mobile handheld devices. The new outbound technologies on the southwest border facilitated the seizure of more than $15.2 million in currency, 72 firearms, 35,756 rounds of ammunition, and the arrest of nearly 602 wanted fugitives or violators of export laws.
Success Story
In October 2014, Zapata County Sheriff’s Office Deputies in Texas working Operation Stonegarden-funded patrols attempted to stop a vehicle for traffic violations. The driver of the vehicle refused to stop and tried to evade the Deputies. The driver eventually slowed down and jumped out of the
vehicle and absconded. The Deputies seized the vehicles that contained several bundles of marijuana.
Success Story
Advance a Comprehensive, Predictive Targeting Strategy to Identify Threats as Early as Possible
CBP uses an integrated targeting strategy to identify high-risk passengers and cargo and enable international passengers and cargo to move more quickly through the inspection process. CBP uses a multilayered approach that includes partnerships, advanced information, technology, forward deployments, and examinations at the earliest point possible through the transit process. The Agency coordinates with domestic, international, and private sector partners to conduct joint targeting programs to identify high-risk passengers and cargo in real time. This includes working with business partners to align systems, processes, and procedures to efficiently gather information while minimally impacting partners’ operations.

472014 Performance and Accountability Report • U.S. Customs and Border Protection
CBP pursues innovative solutions, techniques, and methodologies to enhance the targeting enterprise to confront a persistently shifting threat environment. This includes updating automated systems with more advanced risk models and algorithms, predictive forms of automation, and adaptive technology that reduces the need for human analysis and speeds the identification of new and emerging threats. CBP applies advanced data analytics to combine shipment data, biographical and biometric data, past importation and travel patterns, and enforcement action information to stay ahead of emerging threats.
Strategies to Advance a Comprehensive, Predictive Targeting Strategy to Identify Threats as Early as Possible
Minotaur Program: The Minotaur program is a shared, multi-domain operating picture that provides continuous tracking of surface ships over wide areas in dense surface environments and disseminates data from airborne assets to command and control centers. The program addresses CBP’s need for complete, persistent, and accurate wide-area surveillance in tactical maritime environments. In FY 2014, CBP’s OAM worked with the U.S. Navy to develop and test a prototype system for the Minotaur program. This system will improve CBP’s capability to detect and track non-cooperative targets, and collect and fuse friendly reporting sources such as AIS information.
Battlespace Visualization Initiative: This initiative is a management tool that fuses disparate DHS systems into a single, comprehensive system of mapping utilities, analysis tools, and visualization. It supports real-time situational awareness, track management, terrain analysis, multi-intelligence fusion, and other critical geographically based functions. In FY 2014, CBP’s OAM and OIIL worked together to evaluate the Battlespace Visualization Initiative’s potential data sharing capability. Used by the U.S. defense and intelligence communities to protect the Nation’s security, the Battlespace Visualization Initiative aids intelligence collection management by matching diverse information requests with available collection resources. The system allows users to view data from several collection disciplines with an integrated 2D and 3D display, allowing users to view all collection operations for a given area.
Vehicle and Dismounted Exploitation Radar (VADER): VADER is a strategic intelligence sensor used on the Predator B UAS that provides comprehensive situational awareness for an expanded target area. Focusing on the Arizona West Desert area, the system allows accurate Ground Moving Target Indicator data and Synthetic Aperture Radar (SAR) imagery to be readily available to ground commanders in real time. The culmination of a wide area aerial surveillance and operational capability enables CBP to better coordinate tactical operations and operational planning, and to better identify and mitigate potential gaps in border security.
Coherent Change Detection (CCD): CCD is a geospatial intelligence technique to collect and compare coherent SAR images from the approximate same location collected at different times. CBP’s OAM supports CCD during day-to-day operations and during disasters, routinely flying “SAR runs” to collect strategic information such as vehicular traffic and patterns of life in remote areas. In FY 2014, the National Air Security Operations Center – Corpus Christi conducted four dedicated flights of multiple SAR runs in the South Texas Campaign area of operations, specifically near the Laredo and Del Rio Border Patrol Sectors, collecting high value intelligence. Along the Northern border, National Air Security Operations Center – Grand Forks conducted 100 SAR runs. CBP uses CCD information for planning, situational awareness, common operating picture, and to vector interdiction assets based on the combined information flow.

48 U.S. Customs and Border Protection • 2014 Performance and Accountability Report
TECS Portal: TECS is a modified version of the former Treasury Enforcement Communications System, and is the principal system used at the border to assist with screening and determining admissibility of arriving persons. TECS is an information sharing platform and data repository that supports law enforcement lookouts, border screening, and reporting for CBP’s primary and secondary inspection processes. CBP officers and Border Patrol agents use TECS to document observations related to an encounter with a traveler, a memorable event, or other noteworthy information that may be indicative of intelligence gathering or planning related to terrorism, criminal, or other illicit intention. In FY 2014, CBP’s OIT accomplished several TECS Modernization projects. This included increased functionality for lookout records, travel documents, encounter data available, as well as operating the Consolidated Secondary Inspection System from a second data center. OIT improved TECS’ primary screening capability by reducing load on the mainframe for ports of entry through modernized query services and modernized databases. Ten of 28 participating government agencies are live on the TECS Portal. OIT expanded TECS Portal functionality to include lookout, travel document, and person encounter queries and the commonly used queries from the National Crime Information Center and National Law Enforcement Telecommunications System
Goal 3
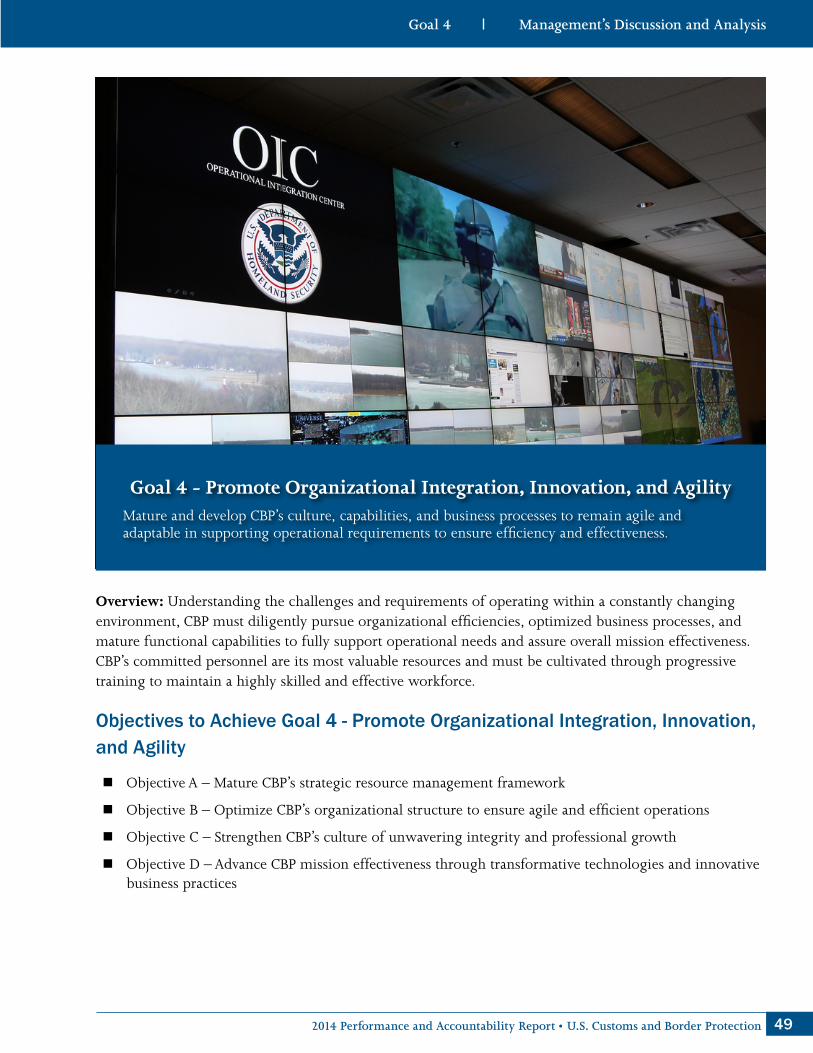
492014 Performance and Accountability Report • U.S. Customs and Border Protection
Goal 4 - Promote Organizational Integration, Innovation, and AgilityMature and develop CBP’s culture, capabilities, and business processes to remain agile andadaptable in supporting operational requirements to ensure efficiency and effectiveness.
Overview: Understanding the challenges and requirements of operating within a constantly changing environment, CBP must diligently pursue organizational efficiencies, optimized business processes, and mature functional capabilities to fully support operational needs and assure overall mission effectiveness. CBP’s committed personnel are its most valuable resources and must be cultivated through progressive training to maintain a highly skilled and effective workforce.
Objectives to Achieve Goal 4 - Promote Organizational Integration, Innovation, and Agility
� Objective A – Mature CBP’s strategic resource management framework
� Objective B – Optimize CBP’s organizational structure to ensure agile and efficient operations
� Objective C – Strengthen CBP’s culture of unwavering integrity and professional growth
� Objective D – Advance CBP mission effectiveness through transformative technologies and innovative business practices
Goal 4

50 U.S. Customs and Border Protection • 2014 Performance and Accountability Report
Mature CBP’s Strategic Resource Management Framework
CBP adjusts its programs to meet the shifting domestic and global conditions and enhance performance through the planning, programming, budgeting and accountability business structure. CBP’s business model is based on the DoD and DHS planning, programming, budgeting and execution systems, customized to meet CBP’s specific needs. This strategic resource management framework ensures the Commissioner’s vision, goals, and objectives are clearly articulated; programs activities, and resources are appropriately aligned; and performance measures are in place to enable the assessment of progress. CBP improves its analytic capability to make well-informed decisions regarding strategy and policy, resource allocation, beneficial investments for DHS and CBP, and the balancing risk against specified performance goals.
CBP develops an effective performance management process that establishes realistic and achievable parameters to systematically achieve its strategic goals. This includes more than simply collecting and reporting information—it aligns strategy to implementation and resource allocation, and assesses the effects. CBP’s shared mission, capabilities-based portfolios align strategy to performance to better integrate all facets of planning, programming, budgeting and accountability throughout the Agency.
Strategies to Mature CBP’s Strategic Resource Management Framework
FY 2014 CBP Business Plan: CBP’s OA developed an integrated plan and monitoring process to assess monthly performance. The plan outlines quarterly reports that include cross-functional data sources, analytics, and processes for improved procurement and spending plans, allowing CBP leadership to target specific types of costs for reduction, rather than order across-the-board cuts. The FY 2014 CBP Business Plan ensures consistent information for CBP leaders when dealing with the operational budget, mandates to maintain staffing levels, and rising costs.
CBP’s OA is responsible for decentralized management and oversight of more than 783,000 disbursed personal property assets (valued at more than $7 billion). OA promotes CBP office accountability and stewardship by ensuring adequate personal property assets are available to support the CBP mission,
reducing the likelihood of financial misstatements, and facilitating compliance with federal mandates, regulations, and policy.
Facilities Management and Engineering Directorate (FM&E): CBP’s FM&E provides a broad range of facilities, infrastructure, and related support services and serves as CBP’s program manager for the Agency’s large, complex, and diverse facilities and tactical infrastructure portfolio, which includes buildings, structures, and towers across the U.S., as well as more than 650 miles of vehicle and primary pedestrian fence on the Southwest border. In support of the Presidential Memo—Disposing of Unneeded Federal Real Estate, FM&E identifies and executes space reduction opportunities nationwide by implementing a variety of mobile work, technology, and policy solutions. These efforts also lower energy and environmental resource usage and reduce CBP’s operating costs.

512014 Performance and Accountability Report • U.S. Customs and Border Protection
Resource Optimization Strategy: CBP uses this strategy to optimize business processes, accurately identify staffing requirements, and explore alternative funding strategies to increase revenue sources. This includes CBP’s Workload Staffing Model, a data-driven tool to identify staffing requirements by accounting for the processes, personnel, and time required of CBP officers to accomplish an operation. It estimates future staffing requirements for new or enhanced facilities, technology deployments, and growth in trade and travel. DHS is pursuing several legislative proposals as alternative funding options for future staffing needs such as increasing traveler fees, maintaining authority to be reimbursed by stakeholders for new or expanded services, and investing in modernization initiatives such as mobile technology and kiosks for travelers at airports and land border ports of entry.
2012-2016 Border Patrol Strategic Plan: The Border Patrol follows its Strategic Plan to focus its operations to meet the challenges of securing a 21st century border against a variety of different threats and adversaries. The principal theme of the Border Patrol Strategic Plan is to use information, integration, and rapid response to meet all threats, placing the greatest capabilities to combat the greatest risks. The Border Patrol prevents the entry of terrorists, weapons, illegal immigrants and contraband along 6,900 miles of land borders with Mexico and Canada, along with 2,000 miles of coast around Florida and Puerto Rico. The plan has two main goals: Secure America’s Borders and Strengthen the Border Patrol. In implementing its strategic plan, the Border Patrol measures the readiness of resources in performing its mission.
Campaign Planning: The Border Patrol uses sector-level Operational Implementation Plans to implement its 2012-2016 Strategic Plan. To facilitate corridor-level campaign planning, the Border Patrol broadened the sector focus to group its sectors into corridors. Sectors that were not in a corridor were arranged into planning partnerships with fellow sectors.
Interdiction Effectiveness Rate (IER): CBP uses the IER along the Southwest border to evaluate the Border Patrol’s ability to apprehend or turn back would-be illegal entrants with a 77% IER target for FY 2014. IER is measured by Apprehensions + Turnbacks / Apprehensions + Turnbacks + Gotaways. OBP exceeded the FY 2014 target with a 79.28% IER by year-end.
Consequence Delivery System (CDS): CDS enhances border security by tracking the progress of each Border Patrol sector in applying consistent and effective consequences to disrupt the smuggling cycle and dissuade illegal re-entry attempts. The recidivism rate is indicative of CBP’s ability to utilize more effective and efficient consequences to influence a person’s desire and ability to attempt future illegal entries. Recidivism has continued to decrease for the fourth year in a row since the implementation of the CDS in January 2011. The consistent and systematic application of consequences to aliens that enter the U.S. illegally has contributed to the reduction of recidivism to 14% in FY 2014, significantly lower than 24% in FY 2010, the year before implementation.

52 U.S. Customs and Border Protection • 2014 Performance and Accountability Report
Optimize CBP’s Organizational Structure to Ensure Agile and Efficient Operations
CBP continues to meet the growing complexities of the future operating environment through agility and innovation. The Agency evolves its organizational design with the right combination of differentiation and integration of operations in response uncertainty in the external environment. CBP’s organizational design is more than an organizational structure or strategic plan - it encompasses all formal and informal systems and processes as well as their inherent interactions. By defining and evolving the optimal hierarchical arrangement of lines of authority, communications, responsibilities and functions of its offices, CBP continuously streamlines command and control over daily operations.
Strategies to Optimize CBP’s Organizational Structure to Ensure Agile and Efficient Operations
Enterprise Agile Project Management: CBP’s OIT continues to implement Agile Project Management practices in support of the Federal CIO’s 25-Point Implementation Plan to Reform Federal Information Technology Management. These efforts help drive common standards and practices and support streamlined process efficiencies in supporting CBP’s IT infrastructure. In an Agile organization, integrated product teams actively engage customers to deploy IT functionality in smaller and less risky increments. In shifting to Agile, CBP provides improved cost management, and better align IT products to mission needs.
Workforce Development: CBP’s OTD provides formal training and education programs through two training academies and three training centers, delivering instructor-led classroom training and online training through CBP’s Virtual Learning Center. OTD develops and implements CBP’s annual training plan and provides career development programs, basic and advanced training to all occupations (e.g., anti-terrorism training to CBP officers, Border Patrol agents, and other occupations), and management and executive development programs. OTD defines and implements evaluation measures, data collection processes, and inspection methods for ongoing assessment of all CBP training programs.
Strengthen CBP’s Culture of Unwavering Integrity and Professional Growth
CBP develops a collaborative culture to ensure continued delivery of its mission to the American people. This includes attracting, hiring, continually developing, and retaining a highly qualified workforce with an enduring commitment to CBP’s highest ideals, especially integrity. CBP provides training and dynamic growth opportunities to strengthen professional skills and capabilities throughout its workforce.
CBP strengthens its culture of unwavering integrity and professional growth by implementing comprehensive programs and capabilities to prevent, detect, investigate, and respond to instances of corruption and misconduct. This includes improving procedures for conducting background investigations, polygraph exams, behavior analysis, investigations, security, covert testing, and inspections to ensure integrity and accountability in the workforce. To retain high-caliber employees and ensure the effectiveness of programs, CBP continues to build a diverse workforce, develop career path roadmaps, promote work-life programs, and maintain a work culture that rewards performance, encourages employee engagement, and provide personal, professional, and organizational growth opportunities.

532014 Performance and Accountability Report • U.S. Customs and Border Protection
Strategies to Strengthen CBP’s Culture of Unwavering Integrity and Professional Growth
Integrity and Personal Accountability Strategy: In FY 2014, CBP issued an integrity and personal accountability document to address the integrity standards of the Agency. The overwhelming majority of the men and women who constitute the CBP workforce serve with honor and integrity, adhering to the high standards demanded of CBP personnel. The comprehensive Integrity and Personal Accountability Strategy establishes a unified and multi-layered approach organized around four integrity related mission areas: prevention, detection, investigation, and response to corruption and misconduct.
Workers’ Compensation Program: CBP restructured the Workers’ Compensation Program to establish an overall strategic case management process that reduces chargeback costs and expedites the return-to-work of CBP employees who are injured while performing their duties. This includes initiating medical case management services such as nurses reviewing new worker’s compensation cases, offering pharmacy benefit plan services to injured workers, and conducting reviews of long-term disability cases using predictive modeling software.
Human Resources Business Engine (HRBE): HRBE is a web-based workflow engine that supports CBP’s complex pre-employment processes in both the Indianapolis and Minneapolis Hiring Centers, for professional and entry-level hiring. In FY 2014, CBP’s HRM implemented the HRBE-Personnel Action Request Tracking System, a system that transformed business practices by speeding-up the hiring process and increasing data integrity. This online system enables offices to submit personnel action requests in a more efficient manner. HRM deployed dashboards for labor and employee relations and financial disclosure to make more informed decisions.
Advance CBP Mission Effectiveness through Transformative Technologies and Innovative Business Practices
CBP promotes organizational excellence and operational agility by leveraging technological advances and innovative practices. This includes optimizing resource allocation with the greatest return on investment and the delivery of prioritized operational capabilities. CBP anticipates and prepares for future organizational requirements by collaborating with partners and promoting an entrepreneurial spirit. CBP implements innovations to reduce costs and provide greater return on investment to the American people by transforming business practices and processes to be more forward-looking and streamlined. This includes implementing Agile Project Management processes and reducing the reliance on burdensome bureaucratic protocols.

54 U.S. Customs and Border Protection • 2014 Performance and Accountability Report
Strategies to Advance CBP Mission Effectiveness through Transformative Technologies and Innovative Business Practices
National Uniform Contract: CBP’s OA awarded department-wide strategic uniform sourcing contracts to create more efficient procurement options and reduce overall program costs through increased buying power. These contracts provide a consolidated acquisition vehicle to support the needs of more than 120,000 uniformed employees across nine DHS Law Enforcement Components.
FY 2015 Fuel Sharing Management Initiative: CBP’s OA developed technical requirements and procurement documentation for the FY 2015 Fuel Sharing Management Initiative that allows DHS components to share fuel facilities for approximately 20,000 vehicles along the Southwest border, Georgia, and Puerto Rico. DHS projects that the initiative will result in $4 million in annual cost avoidance through reduced commercial fuel purchasing, reduced sales tax charges, improved fuel efficiency, automated collection of vehicle metrics and maintenance scheduling, reduced vehicle acquisition costs, and simplified reporting.
FY 2019 CBP Fleet Strategic Plan: This Strategic Plan establishes the organizational priorities for managing and operating the CBP motor vehicle fleet and articulates key programs, objectives, and milestones for improving organizational fleet performance. This includes reducing maintenance costs by directly integrating automotive parts vendors into CBP garages, improving inventory management, and streamlining the parts procurement process. In FY 2014, CBP awarded four contracts for automotive parts facilities, realizing an estimated $1 million in annual cost avoidance upon full implementation.
Fleet Right-Sizing Initiative: This initiative is CBP’s methodology for determining an optimal fleet size and composition based on the number of CBP personnel, mission requirements, and other operational factors, as required by the Presidential Memorandum on Federal Fleet Performance. In FY 2014, OA’s Mobile Assets Program Management Office performed a fleet right-sizing analysis and established fleet inventory targets that will result in an expected 2,241 reduction of vehicles in FY 2015. The FY 2015 reductions will avoid $82.3 million in vehicle replacement acquisitions.
Home-to-Work (HtW) Management and Internal Controls and Compliance Plan: This plan ensures compliance with the HtW Transportation Program policies and processes, educates CBP employees on HtW policies, fosters an ethical environment, and establishes internal mechanisms to prevent, detect, and identify program violations and/or other unethical behavior. In FY 2014, CBP improved compliance with HtW requirements by implementing an HtW communications plan, implementing a standardized HtW web-based training course, and implementing recurring quality assurance processes to query HtW data for completeness and correctness.
CBP provides uniforms for more than 120,000 uniformed employees.

552014 Performance and Accountability Report • U.S. Customs and Border Protection
CBP Overtime Scheduling System (COSS): CBP’s OIT modified the COSS work ticket and billing process to better calculate overtime services, track the expenses in the financial systems, and automate the billing to external customers. CBP partnered with Dallas-Fort Worth International Airport, City of El Paso, South Texas Assets Consortium, Houston Airport System, and Miami-Dade County for overtime reimbursement. These enhancements enable CBP to be reimbursed for services via an alternative funding source, and provide an innovative way to support growing volumes of travel and trade in a challenging budget environment.
Border Security Fencing Infrastructure and Technology (BSFIT) appropriation: This appropriation supports DHS and CBP missions by delivering operationally appropriate, agile, and cost-effective detection and surveillance technology systems, and Tactical Infrastructure (TI), and Tactical Communications Modernization (TACCOM) to border security fences. BSFIT funds several technologies including Integrated Fixed Towers (IFT), Agent Portable Surveillance System (APSS), Mobile Surveillance Capability (MSC), Mobile Video Surveillance System (MVSS), Remote Video Surveillance System (RVSS), Thermal Imaging Device (TID), Unattended Ground Sensors/Imaging Unattended Ground Sensors (UGS/I-UGS), Tethered Aerostat Radar Systems (TARS), and Ultra-Light Aircraft Detection (ULAD). These technologies enhance CBP’s ability to survey the border and detect incursions of various types. In FY 2014, CBP awarded contracts to deploy IFT systems to several Border Patrol areas in the Tucson sector. CBP also delivered an RVSS capability and deployed MSC units to Arizona.
CBP Cloud Computing Environment (C3E): CBP has been “sunsetting” obsolete legacy mainframe technology, modernizing CBP’s overall IT infrastructure, and maintaining/improving systems availability, with a target completion in FY 2015. Moving towards the target C3E—a cloud-based IT infrastructure, CBP’s OIT deletes, retires, or modernizes border enforcement and management system applications. OIT is currently modernizing AES to operate on the cloud with AES applications now migrated to C3E. The retirement of outdated mainframe applications decreases overall IT technology debt, improves efficiency, and increases overall performance of technology.
Mobility Service Implementation: CBP is transitioning off of BlackBerrys and upgrading equipment under the DHS Commercial Wireless Managed Services Blanket Purchase Agreement to support mobility operations. CBP mobility requirements and operational decisions are being supported through the effective use of Agile Scrum teams, an iterative and incremental software development framework, and by leveraging cloud-based project management tools like Atlassian JIRA, a commercial software system to capture and organize issues, assign work, and follow team activity.

56 U.S. Customs and Border Protection • 2014 Performance and Accountability Report
Looking AheadCBP continues to expand and enhance mission effectiveness by its forward-looking approach to secure America’s borders and the vitality of the U.S. economy. CBP will continue to integrate state-of-the-art technologies and traditional security infrastructures at U.S. ports of entry and along the Nation’s borders and to work in collaboration and partnership with the trade community and foreign governments to secure the U.S. against terrorists and terrorist weapons while facilitating world commerce.
Countering Terrorism and Transnational Crime: CBP’s law enforcement initiative must anticipate and respond to criminal networks that engage in diverse conspiracies that include terrorism, the importation of counterfeit or unsafe goods, drug smuggling, human smuggling and trafficking, as well as the outbound transfer of prohibited weapons and illicit bulk currency. Since the number of people and volume of cargo moving across our borders is so large, and border enforcement resources are finite, we must be the Nation’s proactive leader as a well-informed and highly agile law enforcement organization that can anticipate, target, detect and disrupt cross-border criminal violators that threaten national security, economic prosperity and public safety.
Advancing Comprehensive Border Security: CBP plays the preeminent role in securing and managing the air, land, and maritime borders through the active administration of U.S. laws, which includes addressing cross-border criminal activity, inspection and enforcement at ports of entry, and comprehensive trade enforcement. Protecting the U.S. from the illegal entry of people, weapons, drugs, and contraband is vital to homeland security, as well as our economic prosperity. CBP will safeguard and manage the U.S. air, land, and maritime borders through integrated, intelligence-driven, risk-informed strategies and leverage operational capabilities to enhance anticipatory and agile operations against the nodes and paths of adversary networks.
Enabling Trade, Travel, and Exports: Efficient and effective processing of goods and people to and through the U.S. is critical to CBP’s mission of supporting the Nation’s economic competitiveness by enabling legitimate trade and travel, and to the successful implementation of the National Export Initiative and the National Travel and Tourism Strategy. As international trade and travel grow, CBP must create efficiencies, drive down cost, and streamline regulatory policies. This will require sustained transformative and innovative thinking on how to minimize the costs and optimize efficacy in an increasingly competitive and complex global economy.
Promoting Integration and Operational Excellence: In a constantly changing environment, CBP must pursue organizational efficiencies, optimized business processes, and continuous capability development to support operational priorities and ensure organizational effectiveness. CBP’s people and culture are some of its most valuable resources and must be fully supported to ensure a capable, competent, integrated and collaborative CBP.
Advancing International Engagement: While each of the requirements detailed in the major sections above require consistent and committed international partnerships, CBP will seek deeper systematic engagement with global partners through international organizations and broad strategic efforts.
Looking Ahead

572014 Performance and Accountability Report • U.S. Customs and Border Protection
Performance Goals and Results CBP uses performance measures to monitor, report, and improve its programs. DHS has identified several performance measures for release to the public as useful for portraying CBP activities and their contributions to defending the homeland. CBP releases its performance results towards nine performance measures, listed in the table below. The Performance Results section contains full discussions of CBP’s FY 2014 performance and results for each of these measures.
CBP Performance Measure2014 Performance
TargetFY 2014 Year End
ResultTarget Met?
1. Percent of inbound cargo identified by CBP as potentially high-risk that is assessed or scanned prior to departure or at arrival at a U.S. port of entry
100% 99.22%
2. Percent of detected conventional aircraft incursions resolved along all borders of the United States
100% 98.8%
3. Percent of people apprehended multiple times along the Southwest border
<=17% 14%
4. Rate of interdiction effectiveness along the Southwest Border between ports of entry
77% 79.28%
5. Percent of cargo by value imported to the U.S. by participants in CBP trade partnership programs
59% 53.9%
6. Percent of Import Revenue Successfully Collected
100% 99.56%
7. Percent of imports compliant with applicable U.S. trade laws
97.50% 97.99%
8. Amount of smuggled outbound currency seized at the ports of entry (in millions)
$30 $37.7
9. Number of smuggled outbound weapons seized at the ports of entry
400 411
CBP’s FY 2014 results towards its nine releasable performance measures.
Performance Goals and Results

58 U.S. Customs and Border Protection • 2014 Performance and Accountability Report
CBP performance measures improve the efficiency and effectiveness of CBP programs through improved measurement, analysis, and reporting. As an agency within DHS, CBP aligns its performance measures to the DHS Strategic Plan and DHS Quadrennial Homeland Security Review (QHSR) missions, and DHS Future Year Homeland Security Program (FYHSP) mission areas.
DHS Strategic Plan and QHSR Missions CBP FYHSP Mission Areas1. Preventing and Protecting Against Terrorism 1. Securing America’s Borders2. Securing and Managing our Borders 2. Securing and Expediting Trade3. Enforcing and Administering our Immigration Laws 3. Securing and Expediting Travel4. Safeguarding and Securing Cyberspace 4. Intelligence and Targeting5. Ensuring Resilience to Disasters 5. Integrated Operations
The five DHS Strategic Plan and QHSR missions and the five CBP FYHSP mission areas
Derived from the conclusions of the QHSR, the DHS Strategic Plan focuses its efforts towards five key missions and other efforts to provide essential support to national and economic security. The FYHSP requires CBP offices to report their performance results within CBP’s five core mission areas. DHS uses FYHSP performance data to assess how CBP programs performed in meeting its targets and how to efficiently use requested resources to meet performance goals for the following year. CBP reports performance results within the FYHSP intranet-accessible system that include:
� Performance measures of major programs organized by component or mission
� Targets and actual results for each measure
� Trends of performance data from four previous years, the current year, and established measure targets six out years
� Alignment of measures to QHSR mission, goals, and objectives
Measuring performance has many benefits. First, it highlights areas for improvement, which leads to more informed decision-making in establishing priorities and ensuring that resources are allocated to best support mission execution. Secondly, performance measurements can highlight opportunities to increase efficiency and efficacy to improve return on investment for resource allocation decisions. Finally, performance measurements provide critical information to external stakeholders, which can lead to improved oversight and more accurate assessment of organizational effectiveness.
The following table describes how CBP aligns it performance measures to the DHS Strategic Plan and QHSR five missions, and CBP’s FYHSP five mission areas.
Performance Goals and Results

592014 Performance and Accountability Report • U.S. Customs and Border Protection
CBP Performance Measure DHS Strategic Plan and QHSR MissionCBP FYHSP Mission
Area1. Percent of inbound cargo identified by CBP as potentially high-risk that is assessed or scanned prior to departure or at arrival at a U.S. port of entry
Mission 2: Securing and Managing Our Borders
Goal 2.2: Safeguard Lawful Trade and Travel
Objective 2.2.3 Manage the risk of people and goods in transit
Mission Area 4: Intelligence and Targeting
2. Percent of detected conventional aircraft incursions resolved along all borders of the United States
Mission 2: Securing and Managing Our Borders
Goal 2.1: Secure U.S. Air, Land, and Sea Borders
Objective 2.1.1: Prevent Illegal Entry
Mission Area 1: Securing America’s Borders
3. Percent of people apprehended multiple times along the Southwest border
Mission 2: Securing and Managing Our Borders
Goal 2.1: Secure U.S. Air, Land, and Sea Borders
Objective 2.1.1: Prevent Illegal Entry
Mission Area 1: Securing America’s Borders
4. Rate of interdiction effectiveness along the Southwest Border between ports of entry
Mission 2: Securing and Managing Our Borders
Goal 2.1: Secure U.S. Air, Land, and Sea Borders
Objective 2.1.1: Prevent Illegal Entry
Mission Area 1: Securing America’s Borders
5. Percent of cargo by value imported to the U.S. by participants in CBP trade partnership programs
Mission 2: Securing and Managing Our Borders
Goal 2.2: Safeguard Lawful Trade and Travel
Objective 2.2.3 Manage the risk of people and goods in transit
Mission Area 2: Securing and Expediting Trade
6. Percent of Import Revenue Successfully Collected
Providing Essential Support to National and Economic Security
Mission Area 2: Securing and Expediting Trade
7. Percent of imports compliant with applicable U.S. trade laws
Mission 2: Securing and Managing Our Borders
Goal 2.2: Safeguard Lawful Trade and Travel
Objective 2.2.3 Manage the risk of people and goods in transit
Mission Area 2: Securing and Expediting Trade
8. Amount of smuggled outbound currency seized at the ports of entry (in millions)
Mission 2: Securing and Managing Our Borders
Goal 2.1: Secure U.S. Air, Land, and Sea Borders
Objective 2.1.2: Prevent Illegal Export and Exit
Mission Area 3: Securing and Expediting Travel
9. Number of smuggled outbound weapons seized at the ports of entry
Mission 2: Securing and Managing Our Borders
Goal 2.1: Secure U.S. Air, Land, and Sea Borders
Objective 2.1.2: Prevent Illegal Export and Exit
Mission Area 3: Securing and Expediting Travel
CBP’s performance measures as aligned to the DHS Strategic Plan and QHSR five missions, and CBP’s FYHSP five mission areas.
Performance Goals and Results

60 U.S. Customs and Border Protection • 2014 Performance and Accountability Report
FY 2014 Performance by CBP Strategic Goal
CBP’s Integrated Planning Framework provides performance management guidelines to improve the efficiency and effectiveness of CBP programs through improved measurement, analysis, and reporting. CBP links its resources and performance results to accomplish its four strategic goals and associated objectives in the context of their risks and costs. The Integrated Planning Framework aligns CBP strategic goals with DHS mission goals and resource allocation decisions, as well as satisfies the requirements established by the OMB Circular A-11 and the Government Performance and Results Modernization Act of 2010 (P.L 111-352).
CBP is dedicated to continuously refining and improving its performance measures. The goal is to ensure that the data it reports internally and externally is useful to senior executives who make programming and funding decisions. The tables below shows the FY 2014 targets and results of CBPs nine releasable performance measures, as aligned under their respective strategic goal and objective.
Goal 1 - Advance National Security and Public Safety
Performance MeasureFY 2014 Target
FY 2014 Result
Target Met
Objective A – Understand the threat environmentPerformance measures not releasable - - -Objective B – Enhance procedures and partnerships that will facilitate interagency and international border enforcement coordinationPerformance measures not releasable - - -Objective C – Strengthen global supply chain security6. Percent of Import Revenue Successfully Collected
100% 99.56%
Goal 2 - Enhance U.S. Economic
Competitiveness by Enabling
Lawful Trade and Travel
Performance MeasureFY 2014 Target
FY 2014 Result
Target Met
Objective A – Reduce costs for the U.S. government and the trade and travel communities by streamlining processes in collaboration with public and private sector partners5. Percent of cargo by value imported to the U.S. by participants in CBP trade partnership programs
59% 53.9%
7. Percent of imports compliant with applicable U.S. trade laws
97.5% 97.99%
Objective B – Promote harmonization throughout ports of entry and other U.S. government agenciesPerformance measures not releasable - - -Objective C – Expand risk-segmentation through advanced technology to enable low-risk trade and travelPerformance measures not releasable - - -
Performance Goals and Results

612014 Performance and Accountability Report • U.S. Customs and Border Protection
Goal 3 - Advance Comprehensive Border Security
and Management
Performance MeasureFY 2014 Target
FY 2014 Result
Target Met
Objective A – Increase situational awareness of the air, land and maritime bordersPerformance measures not releasable - - -Objective B – Detect, interdict and disrupt illegal cross-border activities2. Percent of detected conventional aircraft incursions resolved along all borders of the United States
100% 98.8%
3. Percent of people apprehended multiple times along the Southwest border
<=17% 14%
4. Rate of interdiction effectiveness along the Southwest Border between ports of entry
77% 79.28%
Objective C – Strengthen comprehensive trade enforcementPerformance measures not releasable - - -Objective D – Strengthen processes to conduct out-bound enforcement and interdiction of travelers and cargo8. Amount of smuggled outbound currency seized at the ports of entry (in millions)
$30 $37.7
9. Number of smuggled outbound weapons seized at the ports of entry
400 411
Objective E – Advance a comprehensive, predictive targeting strategy to identify threats as early as possible1. Percent of inbound cargo identified by CBP as potentially high-risk that is assessed or scanned prior to departure or at arrival at a U.S. port of entry
100% 99.22%
Goal 4 - Promote Organizational
Integration, Innovation and
Agility
Performance Measure FY 2014 Target
FY 2014 Result
Target Met
Objective A – Mature CBP’s strategic resource management frameworkPerformance measures not releasable - - -
Objective B – Optimize CBP’s organizational structure to ensure agile and efficient operations
Performance measures not releasable - - -Objective C – Strengthen CBP’s culture of unwavering integrity and professional growthPerformance measures not releasable - - -Objective D – Advance CBP mission effectiveness through transformative technologies and innovative business practicesPerformance measures not releasable - - -
CBP’s FY 2014 targets and results of its nine releasable performance measures as aligned to its strategic goal and objectives.
Performance Goals and Results
62 U.S. Customs and Border Protection • 2014 Performance and Accountability Report
Management Assurances CBP management is responsible for establishing and maintaining effective internal control to support DHS in providing reasonable assurance that the objectives of the Federal Managers’ Financial Integrity Act (FMFIA) and the Federal Financial Management Improvement Act (FFMIA) are met. CBP activities also support DHS compliance with the Department of Homeland Security Financial Accountability Act. CBP has evaluated its management controls, internal controls over financial reporting, and compliance with federal financial systems standards. In performing the evaluation, CBP considered results from external audit reports, independent reviews, and internal assessments conducted by CBP management.
Federal Managers’ Financial Integrity Act (FMFIA)
In accordance with FMFIA and the Office of Management and Budget (OMB) Circular A-123, Management’s Responsibilities for Internal Control, and in support of DHS’ compliance requirements, CBP provides reasonable assurance that the objectives of Section 2 of the FMFIA (Financial Reporting and Operations) have been achieved, except for the material weakness noted below. CBP conforms to the objectives of Section 4 (Financial Management Systems), except for the non-conformances noted below.
� Drawback Controls: CBP’s Automated Commercial System (ACS) has inherent limitations in detecting and preventing excessive drawback claims. The strengthening of drawback controls is dependent upon legislation to simplify the drawback process, to revise documentation retention requirements for the trade community, and to enhance systems to implement the legislative changes. Until the legislative changes and systems improvements are realized, CBP expects drawback payments to remain a material weakness.
� Financial Systems Security: The DHS Office of Inspector General continues to identify information technology general and application control non-conformance issues at CBP. A number of issues were resolved during FY 2014 but remediation will continue into FY 2015.
� Core Financial Systems: CBP’s ACS does not interface trade-related receivable activity with the accounting system general ledger at the transaction level. Historical activity reports of Office of Air and Marine (OAM) Inventory cannot be generated from CARMAC. Specifically, data can be pulled at a given point in time and retained, but if it is not pulled at that time it is updated and overridden with more recent activity.
� Information Technology Infrastructure: A technical assessment to identify issues and analyze associated mission risks of CBP’s data center and network technology infrastructure was performed in FY 2012. Remediation efforts were initiated in FY 2012 and will continue into FY 2015.
DHS Financial Accountability Act
The Act requires DHS to provide an assertion of internal controls over financial reporting. CBP contributes to the Department’s assertion by performing procedures consistent with OMB Circular A-123 and DHS guidance.
Federal Financial Management Improvement Act (FFMIA)
CBP’s financial management systems contribute to the DHS substantial non-compliance with FFMIA due to Financial Systems Security and Core Financial Systems issues previously discussed.
Management Assurances
632014 Performance and Accountability Report • U.S. Customs and Border Protection
Financial ManagementCBP strives to be a leader in financial management by providing high-quality, cost-efficient services through customer involvement and modern, integrated financial systems. CBP is positioning to become a shared accounting service provider to other DHS components. CBP’s goal is to continuously develop and implement more effective and efficient methods to obtain, manage, and deliver the financial resources, capital assets, and financial services required to meet or exceed the needs of customers and stakeholders. Because CBP is also a revenue-collection agency, it is imperative that it accurately identify amounts owed to CBP and efficiently and effectively collect, report, and account for revenue.
Providing top-quality financial management services includes translating workloads and requirements into budget requests for needed resources, allocating and distributing funds after resources are made available, acquiring and distributing goods and services used to accomplish the CBP mission, managing and paying for those goods and services, and reporting on the costs and use of personnel, goods, and services.
For FY 2014, CBP continues to use SAP as its financial software. SAP is an Enterprise Resource Planning (ERP) solution that integrates budget formulation, budget execution, acquisition through the disposal of assets, requisition through payment, billing to collection of receivables, and business intelligence. SAP integrates business processes and reporting within one system, thereby eliminating unnecessary data entry, ensuring data accuracy, and enabling single system reporting and analytical reporting. SAP ensures that CBP complies with Federal Government standards and regulations for financial management systems. This single integrated solution supports program types eliminating data redundancy and inefficiencies.
Overview of the Financial Statements
The financial statements and footnotes appear in the “Financial Section” of this report. The financial statements have been audited by the independent auditor engaged by the DHS OIG, KPMG LLP, who determined that the financial statements are fairly presented in accordance with GAAP.
Consolidated Balance Sheet
The Consolidated Balance Sheet presents the property owned by CBP (assets), amounts owed by CBP (liabilities), and the amounts of the difference (net position). As of September 30, 2014, total assets were $16.2 billion, a 4% increase from FY 2013. As of September 30, 2014, total liabilities were 6.6 billion, an increase of 9% over FY 2013.
Financial Management

64 U.S. Customs and Border Protection • 2014 Performance and Accountability Report
FY 2014 Assets
FY 2014 Liabilities
Fund Balance with Treasury
Taxes, Duties, and Trade Receivables
General Property, Plant and Equipment
Other
40%$6.4 Million
5%$909 Million
36%$5.7 Billion
19%$3 Million
$16.2 Billion
Total Assets
Due to the Treasury General Fund
Accrued Payroll and Benefits
Other
Accounts Payable
47%$3.1 Billion
9%$596 Million
Refunds Payable
2%$148 Million
15%$993 Million
25%$1.6 Billion
$6.6 Billion
Total Liabilities
Injured Domestic Industries
2%$128 Million

652014 Performance and Accountability Report • U.S. Customs and Border Protection
Consolidated Statement of Net Cost
The Consolidated Statement of Net Cost presents the net cost of the major CBP programs as they relate to the goals of the DHS 2012-2016 Strategic Plan. The gross cost less any offsetting revenue for each program equals net cost of operations. Net cost of operations was $12.9 billion.
FY 2014 Net Cost of Operations
Securing and Expediting Trade
Securing and Expediting Travel
Intelligence and Reporting
Securing America's Borders
21%$2.7 Billion
44%$5.6 Billion
4%$580 Million
31%$3.9 Billion
$12.9 Billion
Net Cost of Operations
Consolidated Statement of Changes in Net Position
The Consolidated Statement of Changes in Net Position represents those accounting transactions that caused the net position of the balance sheet to change from the beginning to the end of the reporting period. CBP’s net cost of operations serves to reduce the net position. Appropriations used totaled $7.8 billion, representing 62% of CBP’s total financing sources. CBP collected and retained $3.9 billion of non-exchange revenue, amounting to 31% of total financing sources, which was used to fund CBP operations.
Combined Statement of Budgetary Resources
The Combined Statement of Budgetary Resources illustrates how budgetary resources were made available, as well as their status at the end of FY 2014. CBP had $17.3 billion in budgetary resources, of which $1.6 billion were unobligated. CBP incurred obligations of $15.7 billion and recorded $15.2 billion in gross outlays by the end of FY 2014.
Consolidated Statement of Custodial Activity
The Consolidated Statement of Custodial Activity presents non-entity (financial activity conducted by CBP on behalf of others) revenue and refunds using a modified cash basis. This method reports revenue from cash collections separately from receivable accruals, and cash disbursements are reported separately from payable accruals. The custodial revenue, using the modified cash basis, for FY 2014 was $39.4 billion.

66 U.S. Customs and Border Protection • 2014 Performance and Accountability Report
FY 2014 Custodial Cash Collections
Limitations of the Financial Statements
The principal financial statements have been prepared to report the financial position and results of the operations of CBP, pursuant to the requirements of 31 U.S.C. 3515(b). While the financial statements have been prepared from the books and records of CBP in accordance with GAAP for Federal entities and the formats prescribed by OMB, the statements are in addition to the financial reports used to monitor and control budgetary resources, which are prepared from the same books and records.
The financial statements should be read with the realization that they are a component of the U.S. Government, a sovereign entity.
Duties
Excise Taxes
Other
User Fees
87%$33.9 Billion
4%$1.5 Billion
1%$293 Million
8%$3.2 Billion
$39.3 Billion
Total Custodial Revenue

Performance SectionThis section provides information on CBP’s progress in achieving performance goals and objectives.

68 U.S. Customs and Border Protection • 2014 Performance and Accountability Report
Performance Summary
The performance data presented in this report is in accordance with OMB guidance provided. The data integrity discussion in the “Systems and Controls” section describes CBP’s commitment to providing quality and timely performance information. CBP managers use this data to demonstrate accountability and improve the quality of program results.
In FY 2014, CBP met five of its nine performance measure targets (56%). Of the four targets CBP did not meet, its performance results were very close to the targets, in some cases less than 1%. The measures are organized by strategic goal and objective. CBP has four overarching strategic goals:
1. Advance National Security and Public Safety
2. Enhance U.S. Economic Competitiveness by Enabling Lawful Trade and Travel
3. Advance Comprehensive Border Security and Management
4. Promote Organizational Integration, Innovation and Agility
The performance measures are established as an integral part of CBP’s Vision and Strategy 2020, the DHS Strategic Plan 2012-2016, the Quadrennial Homeland Security Review (QHSR), and the DHS Future Years Homeland Security Program (FYHSP). The measurement data is collected through various systems and methods and then entered into the FYHSP System for tracking and compiling for management decision-making and year-end reporting.
Individual Performance Measure Results
This section describes the FY 2014 target for each performance measure, a discussion of CBP’s FY 2014 performance results, and, when available, four years of historical trend data. CBP has prepared line graphs for each performance measures to show performance trends.
Although in some cases CBP achieved a result significantly better than the target, CBP did not set the new fiscal year’s target to reflect the prior year’s result. Annual performance is subject to greater variability than long-term performance. Over time, short-term trends tend to balance out and provide a more accurate picture of CBP’s long-term performance. Some annual targets are baselined using data acquired over a multi-year period. Targets are determined to measure the performance toward long-term strategic goals.
Performance Summary
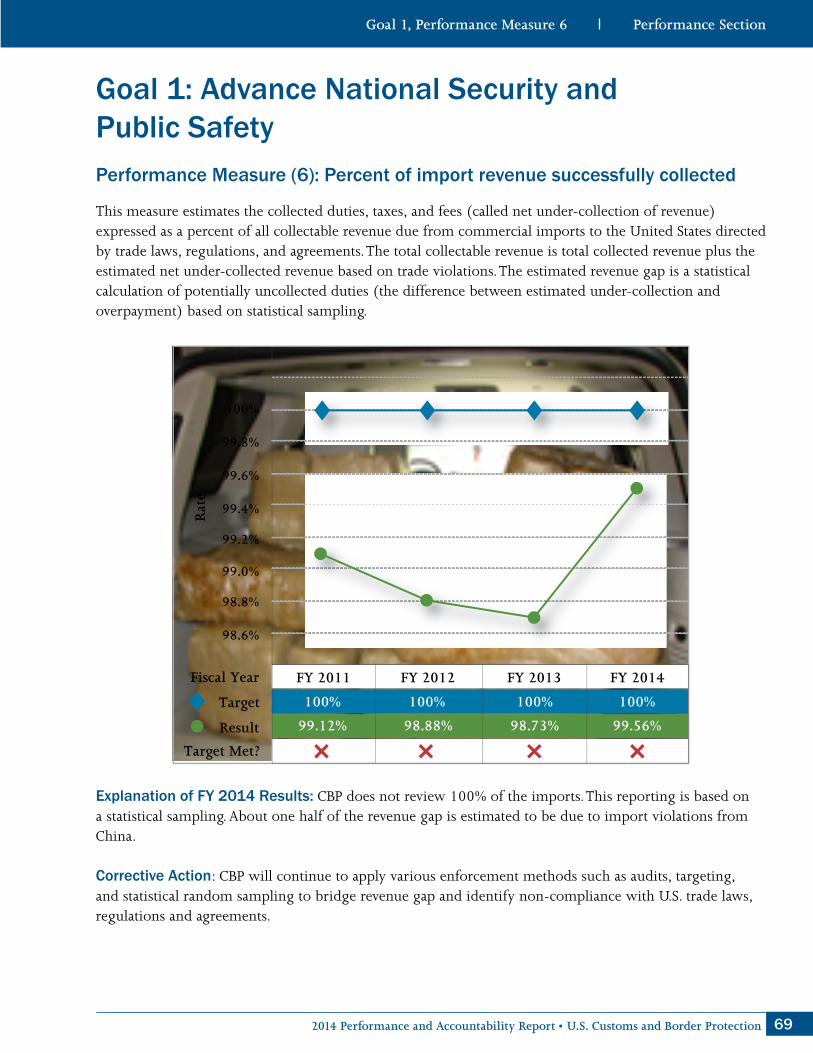
692014 Performance and Accountability Report • U.S. Customs and Border Protection
Goal 1: Advance National Security and Public SafetyPerformance Measure (6): Percent of import revenue successfully collected
This measure estimates the collected duties, taxes, and fees (called net under-collection of revenue) expressed as a percent of all collectable revenue due from commercial imports to the United States directed by trade laws, regulations, and agreements. The total collectable revenue is total collected revenue plus the estimated net under-collected revenue based on trade violations. The estimated revenue gap is a statistical calculation of potentially uncollected duties (the difference between estimated under-collection and overpayment) based on statistical sampling.
Explanation of FY 2014 Results: CBP does not review 100% of the imports. This reporting is based on a statistical sampling. About one half of the revenue gap is estimated to be due to import violations from China.
Corrective Action: CBP will continue to apply various enforcement methods such as audits, targeting, and statistical random sampling to bridge revenue gap and identify non-compliance with U.S. trade laws, regulations and agreements.
Target
Fiscal Year
Target Met?
Result
FY 2011 FY 2012 FY 2013 FY 2014
Rat
e
100%100% 100% 100%
98.88%99.12% 98.73% 99.56%
98.6%
98.8%
99.0%
99.2%
99.4%
99.6%
99.8%
100%
Goal 1, Performance Measure 6

70 U.S. Customs and Border Protection • 2014 Performance and Accountability Report
Goal 2: Enhance U.S. Economic Competitiveness by Enabling Lawful Trade and TravelPerformance Measure (5): Percent of cargo by value imported to the U.S. by participants in CBP trade partnership programs
This measure describes the percent of all cargo that is imported from CBP trade partnership programs based on the value compared to total value of all imports. Partnership programs include both C-TPAT and Importer Self-Assessment (ISA). CBP works with the trade community through these voluntary public private partnership programs, wherein some members of the trade community adopt tighter security measures throughout their international supply chain and in return are afforded benefits. A variety of trade actors are included in these partnership programs, such as importers, carriers, brokers, consolidators/third-party logistic providers, Marine Port Authority and Terminal Operators, and foreign manufacturers.
Explanation of FY 2014 Results: The percent of cargo by value imported by trusted trade partners also remained stagnant, attributed to a policy change associated with Centers of Excellence and Expertise entry processing. CBP policy allows any importer who applies and is approved to have their transactions processed by the Centers of Excellence and Expertise. As a result, an incentive to become a Trusted Trader to participate in the Centers of Excellence and Expertise is diminished and is reflected in the number of applications received.
Corrective Action: CBP will continue to increase its outreach efforts independently and in conjunction with various trade and supply chain security associations.
Goal 2, Performance Measure 5
Target
Fiscal Year
Target Met?
Result
FY 2011 FY 2012 FY 2013 FY 2014
Rat
e
45.00%45.00% 57.00% 59.00%
54.70%55.07% 55.20% 53.90%
46%
44%
48%
50%
52%
54%
56%
58%
60%
62%

712014 Performance and Accountability Report • U.S. Customs and Border Protection
Goal 2: Enhance U.S. Economic Competitiveness by Enabling Lawful Trade and TravelPerformance Measure (7): Percent of imports compliant with applicable U.S. trade laws
This measure reports the percent of imports that are compliant with U.S. trade laws including customs revenue laws. Ensuring that all imports are compliant and free of major discrepancies allows for lawful trade into the U.S.
Explanation of FY 2014 Results: Through C-TPAT and ISA programs and Centers of Excellence and Expertise, CBP closely monitored importers to reduce the non-compliance rates.
Target
Fiscal Year
Target Met?
Result
FY 2011 FY 2012 FY 2013 FY 2014
Rat
e
98.00%98.00% 97.50% 97.50%
96.46%97.67% 97.66% 97.99%
96.4%
96.6%
96.8%
97.0%
97.2%
97.4%
97.6%
97.8%
98.0%
Goal 2, Performance Measure 7

72 U.S. Customs and Border Protection • 2014 Performance and Accountability Report
Goal 3: Advance Comprehensive Border Security and ManagementPerformance Measure (2): Percent of detected conventional aircraft incursions resolved along all borders of the United States
The measure represents the percent of conventional aircraft, once detected visually or by radar that are suspected of illegal cross border activity and are brought to a successful law enforcement resolution. In some cases, CBP’s OAM assets are launched to interdict the aircraft. In most cases, resolution of the aircraft identity is made by AMOC working with interagency partners, such as the Federal Aviation Administration (FAA). If the incursion is deemed legal, OAM considers the incursion resolved. If AMOC could not identify that target in working with our partners, including OAM assets, the incursion is deemed unresolved and is thus considered illegal.
Explanation of FY 2014 Results: FY 2014 totals were 244 of 247 border incursions resolved for an overall 98.79% success rate. Two of the three unresolved aircraft were visually spotted by Border Patrol/OFO agents on the Northern and Texas borders and reported to AMOC who did not have radar data to identify the targets. AMOC did detect the third track crossing the border into Louisiana but responding law enforcement could not locate the target.
Corrective Action: AMOC will continue to increase surveillance capability through integration of FAA and DoD radar technology along the border environment to enhance detection and provide timely law enforcement response to mitigate the threat of low flying aircraft incursions.
Goal 3, Performance Measure 2
Target
Fiscal Year
Target Met?
Result
FY 2011 FY 2012 FY 2013 FY 2014
Rat
e
100%100% 100% 100%
96.0%95.3% 99.3% 98.8%
93%
94%
95%
96%
97%
98%
99%
100%
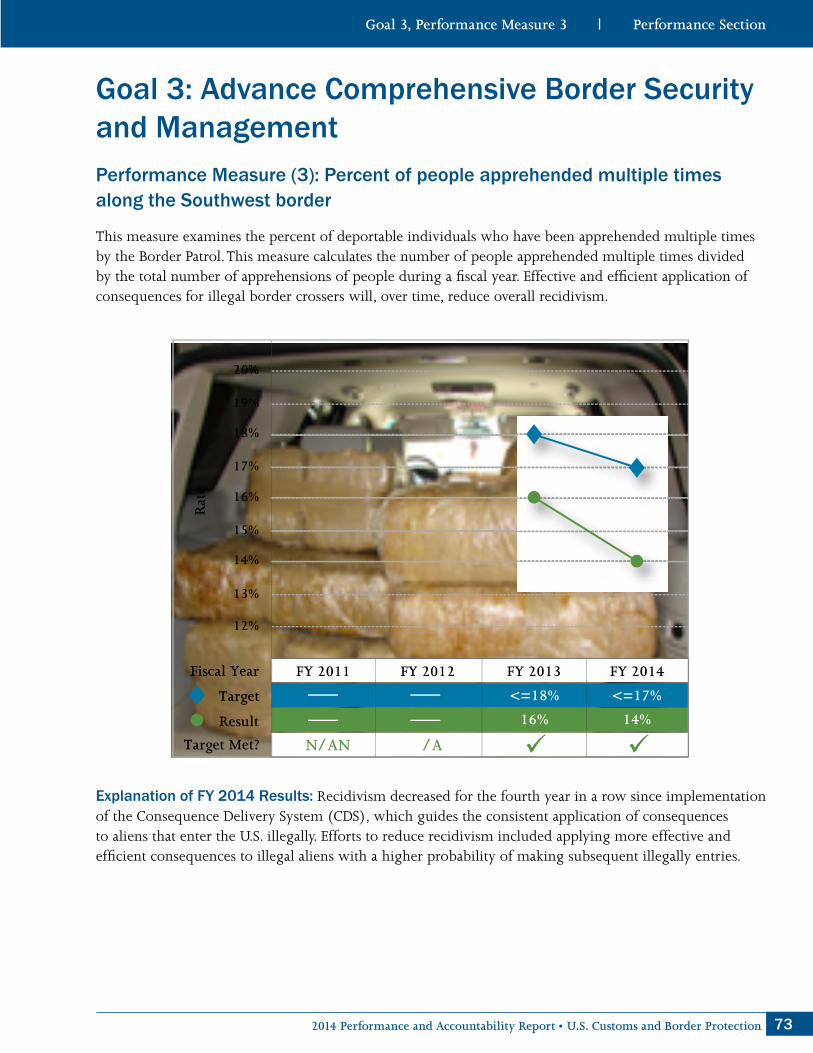
732014 Performance and Accountability Report • U.S. Customs and Border Protection
Goal 3: Advance Comprehensive Border Security and ManagementPerformance Measure (3): Percent of people apprehended multiple times along the Southwest border
This measure examines the percent of deportable individuals who have been apprehended multiple times by the Border Patrol. This measure calculates the number of people apprehended multiple times divided by the total number of apprehensions of people during a fiscal year. Effective and efficient application of consequences for illegal border crossers will, over time, reduce overall recidivism.
Explanation of FY 2014 Results: Recidivism decreased for the fourth year in a row since implementation of the Consequence Delivery System (CDS), which guides the consistent application of consequences to aliens that enter the U.S. illegally. Efforts to reduce recidivism included applying more effective and efficient consequences to illegal aliens with a higher probability of making subsequent illegally entries.
Goal 3, Performance Measure 3
Target
Fiscal Year
Target Met?
Result
FY 2011 FY 2012 FY 2013 FY 2014
Rat
e
<=18% <=17%
16% 14%
12%
13%
14%
15%
16%
17%
18%
19%
20%
N/AN /A

74 U.S. Customs and Border Protection • 2014 Performance and Accountability Report
Goal 3: Advance Comprehensive Border Security and ManagementPerformance Measure (4): Rate of interdiction effectiveness along the Southwest Border between ports of entry
This measure reports the percent of detected illegal entrants who were apprehended or turned back after illegally entering the U.S. between the ports of entry on the Southwest border. The Border Patrol achieves this desired strategic outcome by maximizing the apprehension of detected illegal entrants or confirming that illegal entrants return to the country from which they entered; and by minimizing the number of persons who evade apprehension and can no longer be pursued.
Explanation of FY 2014 Results: Recidivism decreased for the fourth year in a row since implementation of CDS, which guides the consistent application of consequences to aliens that enter the U.S. illegally. Efforts to reduce recidivism included applying more effective and efficient consequences to illegal aliens with a higher probability of making subsequent illegally entries.
Goal 3, Performance Measure 4
Target
Fiscal Year
Target Met?
Result
FY 2011 FY 2012 FY 2013 FY 2014
Rat
e
77.00%
79.28%
76.5%
77.0%
77.5%
78.0%
78.5%
79.0%
79.5%
80.0%
80.5%
N/A N/A N/A

752014 Performance and Accountability Report • U.S. Customs and Border Protection
Goal 3: Advance Comprehensive Border Security and ManagementPerformance Measure (8): Amount of smuggled outbound currency seized at the ports of entry (in millions)
This measure provides the total dollar amount of all currency in millions seized during outbound inspection of exiting passengers and vehicles, both privately-owned and commercial. The scope of this measure covers both the Southwest and Northern borders and includes all modes of transportation (land, air, and sea).
Explanation of FY 2014 Results: This is a cumulative national-level measure with the target specified as the amount of currency to be seized by the end of year. CBP conducted risk-based outbound enforcement activities on an ongoing basis.
Goal 3, Performance Measure 8
Target
Fiscal Year
Target Met?
Result
FY 2011 FY 2012 FY 2013 FY 2014
Rat
e
$35.0$40.0 $30.0 $30.0
$31.9$47.0 $36.9 $37.7
$20.0
$15.5
$25.0
$30.0
$35.0
$40.0
$45.0
$50.0
$50.5

76 U.S. Customs and Border Protection • 2014 Performance and Accountability Report
Goal 3: Advance Comprehensive Border Security and ManagementPerformance Measure (9): Number of smuggled outbound weapons seized at the ports of entry
This measure provides the total number of illegal weapons seized during outbound inspection of exiting passengers and vehicles, both privately-owned and commercial. Weapons are defined as pistols, rifle-shotgun combinations, rifles, revolvers, shotguns, disguised weapons, machine guns, submachine guns, or machine pistols. This includes assembled weapons as well as major pieces of weapons. Seizing weapons being smuggled for criminal purposes strengthens border security by preventing the movement of assault weapons and ammunition.
Explanation of FY 2014 Results: This is a cumulative national-level measure with the target specified as the number of weapons to be seized by the end of the year. CBP conducted risk-based outbound enforcement activities on an ongoing basis.
Goal 3, Performance Measure 9
Target
Fiscal Year
Target Met?
Result
FY 2011 FY 2012 FY 2013 FY 2014
Rat
e
400
411
350
400
450
500
550
600
650
700
750
400
731
N/AN/A

772014 Performance and Accountability Report • U.S. Customs and Border Protection
Goal 3: Advance Comprehensive Border Security and ManagementPerformance Measure (1): Percent of inbound cargo identified by CBP as potentially high-risk that is assessed or scanned prior to departure or at arrival at a U.S. port of entry
This measure gauges the percent of international cargo coming to the U.S. via air, land, and sea identified as potentially high-risk using the Automated Targeting System (ATS) that is assessed or scanned prior to lading or at arrival at a U.S. port of entry. Assessing, resolving, and, when necessary, scanning potentially high-risk cargo prior to lading or at arrival at the ports of entry ensures the safety of the U.S. public and minimizes the impact to the trade, through the effective use of risk-focused targeting.calculation of potentially uncollected duties (the difference between estimated under-collection and overpayment) based on statistical sampling.
Explanation of FY 2014 Results: This measure gauges the percent of inbound cargo identified as potentially high risk by ATS that is examined prior to arrival at a U.S. port of entry. A small percentage of cargo is not reviewed due to status changes en route, information processing and data entry errors, or logistical and scheduling anomalies.
Corrective Action: CBP’s OFO will continue to work with the Targeting and Analysis Systems Program Directorate and shippers and carriers to identify the reasons that shipments are not reviewed, to resolve identified issues, and implement permanent process improvements.
Goal 3, Performance Measure 1
Target
Fiscal Year
Target Met?
Result
FY 2011 FY 2012 FY 2013 FY 2014
Rat
e
100% 100% 100%
98.00% 98.00% 99.22%
N/A
97.0%
96.5%
97.5%
98.0%
98.5%
99.0%
99.5%
100%

78 U.S. Customs and Border Protection • 2014 Performance and Accountability Report
Goal 4: Promote Organizational Integration, Innovation and AgilityCBP does not have performance measures that are releasable to the public that align to this strategic goal.
Goal 4

Financial SectionThis section presents CBP’s audited comparative financial statements, related note disclosures,
and Independent Auditors’ Report.
80 U.S. Customs and Border Protection • 2014 Performance and Accountability Report
Message from the Chief Financial Officer
U.S. Customs and Border Protection (CBP) is firmly committed to financial management excellence. In Fiscal Year (FY) 2014, CBP continued to fulfill its mission of securing our Nation’s borders and facilitating international trade and travel while enforcing U.S. laws and regulations, despite an extremely challenging budget environment. We balance this responsibility with an effective management infrastructure that fosters the highest standards of integrity, while maximizing our partnerships at home and abroad.
The purpose of this report is to provide a comprehensive assessment of our Agency’s financial performance and report on our stewardship of
CBP’s resources through the integration of mission accomplishments.
In FY 2014, CBP received an Unmodified Audit Opinion on its FY 2014 Financial Statements for the ninth year in a row. This unmodified opinion on our financial statements reflects positively on CBP’s demonstrated discipline and accountability in the execution of our fiscal stewardship responsibilities.
CBP can provide reasonable assurance that the Agency has achieved the objectives of Section 2 (Management Controls) and Section 4 (Financial Management Systems) of the Federal Managers’ Financial Integrity Act with certain exceptions as identified in CBP’s Management Assurance Statement. CBP is committed to addressing all of our financial management challenges by continuing to implement corrective measures designed to improve our oversight and accountability. Through our integrated planning framework, we clearly articulate CBP’s vision and mission from our leaders and prioritize financial resources to align with our strategic goals. This provides an improved internal structure and processes that promote collaboration and integration across the Agency.
CBP continues to correct issues identified by the Financial Statement Audit as well as other weaknesses identified through Government Accountability Office, Department of Homeland Security Office of Inspector General, or internal management evaluations.
The diligent work of employees across CBP allows us to maintain our high standards of financial stewardship. I would like to thank the men and women of this organization for the hard work they do every day. Our goals remain to provide timely, reliable, and useful financial management information to the U.S. Congress and the American public to enable the managers across CBP to make smart business decisions.
Jaye M. WilliamsChief Financial Officer
Message from the Chief Financial Officer
812014 Performance and Accountability Report • U.S. Customs and Border Protection
Financial Statements
The financial statements have been audited by the independent auditor engaged by the DHS OIG, KPMG LLP, who determined that the financial statements are fairly presented in accordance with GAAP.
� The Consolidated Balance Sheets present the property owned by CBP (assets), amounts owed by CBP (liabilities), and the amounts of the difference (net position).
� The Consolidated Statements of Net Cost present the net cost of the major CBP programs as they relate to the goals of the DHS 2012-2016 Strategic Plan.
� The Consolidated Statements of Changes in Net Position represent those accounting transactions that caused the net position of the balance sheet to change from the beginning to the end of the reporting period. CBP’s net cost of operations serves to reduce the net position.
� The Combined Statements of Budgetary Resources illustrate how and in what amounts budgetary resources were made available, as well as their status at the end of FY 2014.
� The Consolidated Statements of Custodial Activity present non-entity (financial activity conducted by CBP on behalf of others) revenue and refunds using a modified cash basis.
Financial Statements

82 U.S. Customs and Border Protection • 2014 Performance and Accountability Report
Financial Statements
Customs and Border Protection Consolidated Balance Sheets
As of September 30, 2014 and 2013 (in Thousands)
2014
2013
ASSETS (Note 2) Intra-governmental: Fund Balance with Treasury (Note 3) $ 6,428,244
$ 5,922,817
Accounts Receivable
44,704 26,584 Advances and Prepayments (Note 11) 263,800 133,918
Total Intra-governmental $ 6,736,748
$ 6,083,319
Cash and Other Monetary Assets (Note 4) 3,644 4,966 Accounts Receivable, Net (Note 5) 394,940
363,444
Taxes, Duties and Trade Receivables, Net (Note 6) 3,049,390 2,682,007 Inventory and Related Property, Net (Note 7)
(Note 7) 202,535 198,365
General Property, Plant and Equipment, Net (Note 9) 5,787,086 6,198,917 Other Assets (Note 11) 50 429
TOTAL ASSETS $16,174,393
37,375,688 37,375,6
37,375,688
XX
$15,531,447 37,375,688
37,375,6 37,375,688
XX
Stewardship Property, Plant and Equipment (Note 10) LIABILITIES (Note 12) Intra-governmental:
Accounts Payable $ 161,953
$ 201,859 Other
Due to the Treasury General Fund 3,120,838 2,758,418 Accrued Federal Employees’ Compensation Act Liability (Note 12) 167,449 165,071
Other Employment Liabilities (Note 12) 206 322 Employee Benefits and Taxes 58,797 131,955
Advances From Others 1,570 1,519 Total Intra-governmental $ 3,510,813
$ 3,259,144
Accounts Payable 435,027 347,919
Environmental and Disposal Liabilities (Notes 12 and 14) 20,974 17,524 Other
Accrued Payroll and Benefits (Note 13) 1,621,998 1,475,399 Refunds Payable (Note 15) 148,522 167,524
Deferred Revenue 63,331 45,124 Injured Domestic Industries (Note 15) 128,251 105,052
Liabilities for Deposit Accounts 283,211 250,328 Legal Contingent Liabilities (Note 17) 397,844 381,572
TOTAL LIABILITIES $ 6,609,971 ,,
$ 6,049,586 ,,
Commitments and Contingencies (Note 17) NET POSITION: Unexpended Appropriations – All Other Funds 3,688,692 3,340,275
Cumulative Results of Operations – Funds from Dedicated Collections (Note 18)
768,034 641,492
Cumulative Results of Operations – All Other Funds 5,107,696 5,500,094 TOTAL NET POSITION $ 9,564,422
$ 9,481,861
TOTAL LIABILITIES AND NET POSITION $16,174,393
$15,531,447
The accompanying notes are an integral part of these financial statements.

832014 Performance and Accountability Report • U.S. Customs and Border Protection
Customs and Border Protection Consolidated Statements of Net Cost
For the Years Ended September 30, 2014 and 2013 (in Thousands)
2014 2013 Securing America’s Borders
Gross Cost $ 5,750,055
$ 5,142,124 Less: Earned Revenue
102,039 9,251 Net Program Costs $ 5,648,016
$ 5,132,873
Securing and Expediting Trade
Gross Cost 2,755,931 3,101,084 Less: Earned Revenue
45,866 137,613 Net Program Costs $ 2,710,065
$ 2,963,471
Securing and Expediting Travel
Gross Cost 4,049,378 3,973,194 Less: Earned Revenue
75,745 90,662 Net Program Costs $ 3,973,633
$ 3,882,532
Intelligence and Targeting Gross Cost 586,334 574,881 Less: Earned Revenue
6,339 2,656 Net Program Costs $ 579,995
$ 572,225
Total Gross Cost 13,141,698 12,791,283 Less: Total Earned Revenue 229,989 240,182 Net Cost of Operations (Notes 19 and 20) $12,911,709
$12,551,101
The accompanying notes are an integral part of these financial statements.

84 U.S. Customs and Border Protection • 2014 Performance and Accountability Report
Customs and Border Protection Consolidated Statement of Changes In Net Position
For the Year Ended September 30, 2014 (in Thousands)
FY 2014
Funds from Dedicated
Collections All Other
Funds Consolidated
Total Cumulative Results of Operations: Beginning Balances $ 641,492 $ 5,500,094 $ 6,141,586 Budgetary Financing Sources: Other Adjustments -- 16,779 16,779 Appropriations Used -- 7,783,637 7,783,637 Non-exchange Revenue (Note 21) 822,288 8,062 830,350 Transfers In/Out Without Reimbursement (Note 21)
(2,381,699) 2,630,045 248,346 Other Financing Sources (Non-exchange):
Transfers In/Out Without Reimbursement (390) 42,546 42,156 Imputed Financing -- 685,831 685,831 Other (Note 21) 3,026,203 12,551 3,038,754 Total Financing Sources $ 1,466,402
$ 11,179,451 $ 12,645,853
Net Cost of Operations (1,339,860)
(11,571,849) (12,911,709) Net Change $ 126,542 $ (392,398) $ (265,856) Cumulative Results of Operations 768,034 5,107,696 5,875,730 Unexpended Appropriations: Beginning Balance $ -- $ 3,340,275 $ 3,340,275 Budgetary Financing Sources: Appropriations Received (Note 23) -- 8,315,139 8,315,139 Appropriations Transferred In/Out -- 5,655 5,655 Other Adjustments (Note 23) -- (188,740) (188,740) Appropriations Used -- (7,783,637) (7,783,637) Total Budgetary Financing Sources $ -- $ 348,417 $ 348,417 Total Unexpended Appropriations $ -- $ 3,688,692 $ 3,688,692 Net Position $ 768,034 $ 8,796,388 $ 9,564,422
The accompanying notes are an integral part of these financial statements.
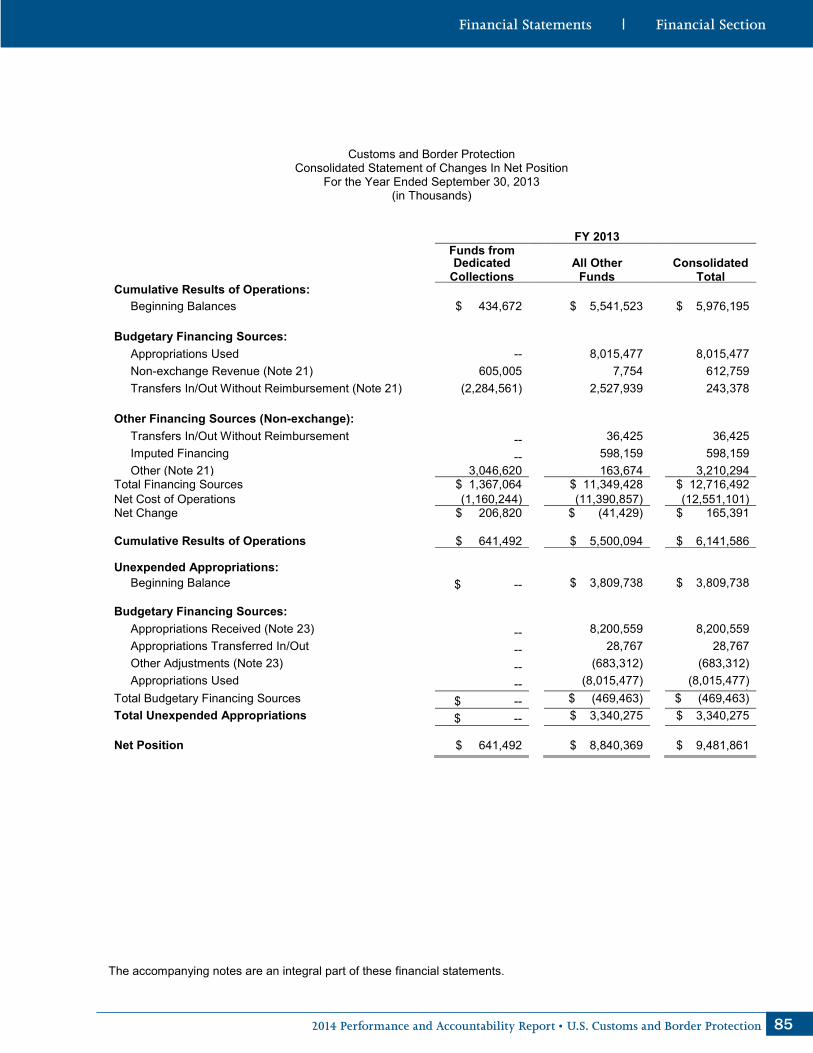
852014 Performance and Accountability Report • U.S. Customs and Border Protection
Customs and Border Protection Consolidated Statement of Changes In Net Position
For the Year Ended September 30, 2013 (in Thousands)
FY 2013 Funds from Dedicated
Collections All Other
Funds Consolidated
Total Cumulative Results of Operations: Beginning Balances $ 434,672 $ 5,541,523 $ 5,976,195 Budgetary Financing Sources: Appropriations Used --
8,015,477
8,015,477
Non-exchange Revenue (Note 21) 605,005
7,754
612,759 Transfers In/Out Without Reimbursement (Note 21) (2,284,561)
2,527,939
243,378
Other Financing Sources (Non-exchange):
Transfers In/Out Without Reimbursement -- 36,425
36,425
Imputed Financing -- 598,159
598,159 Other (Note 21) 3,046,620
163,674
3,210,294
Total Financing Sources $ 1,367,064
$ 11,349,428
$ 12,716,492 Net Cost of Operations (1,160,244)
(11,390,857)
(12,551,101)
Net Change $ 206,820
$ (41,429)
$ 165,391
Cumulative Results of Operations $ 641,492
$ 5,500,094
$ 6,141,586
Unexpended Appropriations: Beginning Balance $ -- $ 3,809,738
$ 3,809,738
Budgetary Financing Sources: Appropriations Received (Note 23) -- 8,200,559
8,200,559
Appropriations Transferred In/Out -- 28,767
28,767 Other Adjustments (Note 23) -- (683,312)
(683,312)
Appropriations Used -- (8,015,477)
(8,015,477) )
Total Budgetary Financing Sources $ -- $ (469,463)
$ (469,463) Total Unexpended Appropriations $ -- $ 3,340,275
$ 3,340,275
Net Position $ 641,492 $ 8,840,369
$ 9,481,861
The accompanying notes are an integral part of these financial statements.

86 U.S. Customs and Border Protection • 2014 Performance and Accountability Report
Customs and Border Protection Combined Statements of Budgetary Resources
For the Years Ended September 30, 2014 and 2013 (in Thousands)
2014 2013 Budgetary Resources: Unobligated balance brought forward, October 1 $ 1,292,312 $ 1,310,864 Recoveries of prior year unpaid obligations 344,049 389,321 Other changes in unobligated balance (115,001) (95,947) Unobligated balance from prior year budget authority, net $ 1,521,360 $ 1,604,238 Appropriations (Note 23) 13,978,189 12,953,010 Spending authority from offsetting collections 1,754,183 1,597,568 Total Budgetary Resources $ 17,253,732 $ 16,154,816 Status of Budgetary Resources: Obligations incurred (Note 22) $ 15,693,839 $ 14,862,504 Unobligated balance, end of year: Apportioned 1,017,432 717,874 Unapportioned 542,461 574,438 Total unobligated balance, end of year $ 1,559,893 $ 1,292,312 Total Budgetary Resources $ 17,253,732 $ 16,154,816 Change in Obligated Balance: Unpaid Obligations: Unpaid obligations, brought forward, October 1 (gross) $ 3,521,005 $ 4,157,480 Obligations incurred (Note 22) 15,693,839 14,862,504 Outlays (gross) (15,219,385) (15,109,658) Recoveries of prior year unpaid obligations (344,049) (389,321) Unpaid obligations, end of year (gross) 3,651,410 3,521,005 Uncollected Payments: Uncollected customer payments from Federal sources, brought forward, October 1 (151,759) (162,620) Change in uncollected customer payments from Federal sources 5,553 10,861 Uncollected customer payments from Federal sources, end of year (146,206) (151,759) Obligated Balance, Start of Year $ 3,369,246 $ 3,994,860 Obligated Balance, End of Year $ 3,505,204 $ 3,369,246 Budget Authority and Outlays, Net: Budget authority, gross $ 15,732,372 $ 14,550,578 Actual offsetting collections (1,759,736) (1,608,429) Change in uncollected customer payments from Federal sources 5,553 10,861 Budget Authority, Net $ 13,978,189 $ 12,953,010
The accompanying notes are an integral part of these financial statements.

872014 Performance and Accountability Report • U.S. Customs and Border Protection
Customs and Border Protection Combined Statements of Budgetary Resources
For the Years Ended September 30, 2014 and 2013 (in Thousands)
2014 2013 Outlays, gross $15,219,385 $15,109,658 Actual offsetting collections (1,759,736) (1,608,429) Outlays, net $13,459,649 $13,501,229 Distributed offsetting receipts (3,919,289) (3,776,910) Agency Outlays, Net $ 9,540,360 $ 9,724,319
The accompanying notes are an integral part of these financial statements.

88 U.S. Customs and Border Protection • 2014 Performance and Accountability Report
Customs and Border Protection Consolidated Statements of Custodial Activity
For the Years Ended September 30, 2014 and 2013 (in Thousands)
2014 2013
Revenue Activity (Note 27): Sources of Cash Collections: Duties $33,903,818 $31,709,053
User Fees 1,556,122 1,567,987 Excise Taxes 3,272,758 3,162,638 Fines and Penalties 57,070 61,265 Interest 59,296 (41,456)
Miscellaneous 177,064 144,392 Total Cash Collections $39,026,128 $36,603,879
Accrual Adjustments (+/-) 328,435 221,931 Total Custodial Revenue $39,354,563 $36,825,810
Disposition of Collections: Transferred to Others: Treasury General Fund Accounts $25,293,394 $23,662,443
U.S. Department of Agriculture 10,338,504 9,694,052 U.S. Army Corps of Engineers 1,510,343 1,523,171
Other Federal Agencies 103,694 97,560
Government of Puerto Rico
-- 6,094 Non-Federal Other
133,540 72,036
(Increase)/Decrease in Amounts Yet to be Transferred 439,396 271,543 Refunds and Drawbacks (Note 27)
1,535,692 1,498,911
Total Disposition of Collections $39,354,563 $36,825,810 Net Custodial Activity $ --
$ --
The accompanying notes are an integral part of these financial statements.
Financial Statements

892014 Performance and Accountability Report • U.S. Customs and Border Protection
Notes to Financial Statements
Customs and Border Protection Notes to Financial Statements
1. Significant Accounting Policies
Reporting Entity U.S. Customs and Border Protection (CBP) was created on March 1, 2003, and is a component of the U.S. Department of Homeland Security (DHS). CBP is the unified border agency whose priority mission is the prevention of terrorists and terrorists’ weapons from entering the U.S. In addition to its priority mission, CBP works to protect America and its citizens by carrying out its traditional missions more effectively using innovative approaches. These traditional missions include enforcing United States trade, immigration and other laws at the borders. Trade-related mission activities include protecting American businesses from theft of their intellectual property and unfair trade practices; regulating and facilitating international trade; collecting import duties; enforcing trade laws related to admissibility; regulating trade practices to collect the appropriate revenue; and maintaining export controls. Other traditional missions include controlling the borders by apprehending individuals attempting to enter the United States illegally; stemming the flow of illegal drugs and other contraband; protecting agriculture and economic interests from harmful pests and diseases; processing all people, vehicles and cargo entering the United States; and coordinating with the Department of Defense and others to protect the National Capital Region. Substantially all duty, tax, and fee revenues collected by CBP are remitted to various general fund accounts maintained by the U.S. Department of the Treasury (Treasury), U.S. Department of Agriculture, and U.S. Army Corps of Engineers. Treasury further distributes these revenues to other Federal agencies in accordance with various laws and regulations. CBP transfers the remaining revenue (generally less than one percent of revenues collected) directly to other Federal agencies, the Government of Puerto Rico and the U.S. Virgin Islands. Refunds of revenues collected from import/export activity are recorded in separate accounts established for this purpose and are funded through a permanent, indefinite appropriation. These activities reflect the non-entity or custodial responsibilities that CBP, as an agency of the Federal Government, has been authorized by law to enforce.
Basis of Accounting and Presentation
These financial statements have been prepared from CBP’s accounting records in conformity with generally accepted accounting principles (GAAP). The Federal Accounting Standards Advisory Board (FASAB), which was designated the official accounting standard-setting body of the Federal Government by the American Institute of Certified Public Accountants, is responsible for identifying the GAAP hierarchy for Federal reporting entities. FASAB has identified the hierarchy to be used in Statement of Federal Financial Accounting Standards (SFFAS) 34, “The Hierarchy of Generally Accepted Accounting Principles, including the Application of Standards Issued by the Financial Accounting Standards Board.” The statements consist of the Consolidated Balance Sheets, Consolidated Statements of Net Cost, Consolidated Statements of Changes In Net Position, Combined Statements of Budgetary Resources, and Consolidated Statements of Custodial Activity. All statements are prepared in accordance with Office of Management and Budget (OMB) Circular A-136.
These financial statements should be read with the understanding that CBP is a component of a sovereign entity; for which budgetary resources cannot be liquidated without the enactment of an appropriation, and that payment of liabilities other than for contracts can be abrogated by the sovereign entity.
These financial statements, with respect to the Consolidated Balance Sheets, Consolidated Statements of Net Cost and Consolidated Statements of Changes In Net Position, are reported using the accrual basis of accounting. Under the accrual basis of accounting, revenues are recognized when earned and expenses are recognized when a liability is incurred without regard to receipt or payment of cash. The Combined Statements of Budgetary Resources are reported using the budgetary basis of accounting. Budgetary accounting facilitates compliance with legal constraints and controls over the use of Federal funds. It generally differs from the accrual basis of accounting in that obligations are recognized when new orders are placed, contracts awarded and services received that will require payments during the same or a future period. CBP non-entity revenue and refunds are reported on the Consolidated Statements of Custodial Activity using a modified cash basis. With this method, revenue from cash collections is reported separately from receivable accruals and cash disbursements are reported separately from payable accruals.
Notes to Financial Statements

90 U.S. Customs and Border Protection • 2014 Performance and Accountability Report
Customs and Border Protection Notes to Financial Statements
In accordance with OMB Circular A-136, intra-CBP transactions and balances have been eliminated from the Consolidated Balance Sheets, Consolidated Statements of Net Cost, and the Consolidated Statements of Changes In Net Position. As provided for by OMB Circular A-136, the Combined Statements of Budgetary Resources is presented on a combined basis; therefore, intra-CBP transactions and balances have not been eliminated from this statement. Funds from Dedicated Collections SFFAS No. 27, Identifying and Reporting Earmarked Funds as amended by SFFAS No. 43, Funds from Dedicated Collections, requires CBP to identify and report separately funds from dedicated collections. See Note 18, Funds from Dedicated Collections, for specific required disclosures related to CBP’s funds from dedicated collections. CBP has program management responsibility for the following funds from dedicated collections:
Appropriation Title 70X4363 Enhanced Inspectional Services 70X5087 Customs and Border Protection, Immigration User Fees 70X5089 Land Border Inspection Fees 70X5451 Enforcement Fines Account 70X5543 International Registered Traveler 70X5569 APEC Business Travel Card Fee 70X5595 Electronic Systems for Travel Authorization Fees 70X5694 Small Airports User Fees 70X5695 Customs User Fees Account 70X8870 Harbor Maintenance Fee Collections
Assets and Liabilities
Intra-governmental assets and liabilities result from activity with other Federal agencies. All other assets and liabilities result from activity with parties outside the Federal Government, such as domestic and foreign persons, organizations or governments. Fund Balance with Treasury
Entity Fund Balance with Treasury represents funds remaining from which CBP is authorized to make expenditures and pay liabilities resulting from operational activity, except as restricted by law. Non-entity Fund Balance with Treasury represents funds available to pay refunds and drawbacks claims of duties, taxes, fees, and other non-entity amounts to be distributed to the Treasury General Fund and other Federal accounts in a future period. Advances and Prepayments Intra-governmental advances and prepayments consist of amounts paid to Federal agencies prior to CBP’s receipt of goods and services. Advances and prepayments to the public consist primarily of travel and salary advances. Accounts Receivable
Intra-governmental accounts receivable represent amounts due from Federal agencies. These receivables are expected to be fully collected. Accounts receivable from reimbursable services and user fees represent amounts due from non-Federal sources for services performed. By law, collections of these receivables can be credited to the appropriation accounts from which the related costs were paid. These receivables are net of amounts deemed uncollectible, which are determined by considering the debtor’s current ability to pay, payment record, as well as the probable recovery of amounts from secondary sources, such as sureties, and an analysis of aged receivable activity. The user fee receivable is based on a calculated estimate using historical user fee collections.

912014 Performance and Accountability Report • U.S. Customs and Border Protection
Customs and Border Protection Notes to Financial Statements
Title 19 of the United States Code, chapter 1, section 58c, authorizes CBP, formerly known as the United States Customs Service, to collect user fees for services provided in connection with the processing of commercial air and commercial vessel passengers, loaded or partially loaded railroad cars carrying passengers or commercial flights arriving into the Customs territory as defined in general note 2 of the Harmonized Tariff Schedule of the United States (some exceptions apply). Title 8 of the United States Code, chapter 12, subchapter II, part IX, section 1356, authorizes CBP to collect immigration user fees for inspection or pre-inspection of passengers arriving at a port of entry in the United States (as defined in Title 8, chapter 12, subchapter I, section 1101) aboard a commercial aircraft and commercial vessel (some exceptions apply). Receivables accrue for commercial airline and commercial vessel user fees on a quarterly basis. Payment is due any time within thirty-one days after the quarter in which the fees are collected, except the July and August fees collected from airline passengers shall be made ten days before the end of the fiscal year. Each quarterly payment shall include any collection made in the preceding quarter that was not remitted with the previous payment. Railroad car fees accrue on a monthly basis and the payments are due to CBP after the end of the applicable month. Taxes, Duties and Trade Receivables
Taxes, Duties and Trade Receivables consist of duties, user fees, fines and penalties, refunds and drawbacks overpayments, and interest associated with import/export activity, that have been established as specifically identifiable, legally enforceable claims that remain uncollected as of year-end. These receivables are net of amounts deemed uncollectible, which were determined by considering the debtor’s payment record and ability to pay, the probable recovery of amounts from secondary sources, such as sureties, and an analysis of aged receivable activity. CBP’s non-entity receivables are described in more detail in Note 6, Taxes, Duties and Trade Receivables, Net.
Inventory and Related Property
Inventory and Related Property consists of aircraft parts, vessel parts, Office of Technology Innovation and Acquisition (OTIA) parts, and CBP uniforms classified as operating materials and supplies to be used in CBP’s operations. Aircraft and OTIA parts and materials are recorded at average unit cost, and vessel parts and uniforms are recorded using the First-In-First-Out valuation method. Both methods approximate actual acquisition costs. CBP accounts for inventory using the consumption method and records an operating expense when inventory is ultimately used in operations.
Seized and Forfeited Property Prohibited seized and forfeited property results primarily from U.S. Immigrations and Customs Enforcement’s (ICE) criminal investigations and from CBP’s seizures during passenger and cargo processing. Seized property is not considered an asset of CBP and is not reported as such in CBP’s financial statements; however, CBP has a stewardship responsibility until disposition of the seized items is determined. Non-prohibited seized property, including monetary instruments, real property and tangible personal property of others in the actual or constructive possession of CBP is transferred to the Treasury Forfeiture Fund and is not presented in the accompanying CBP Consolidated Balance Sheets or Note 8, Seized and Forfeited Property. Forfeited property is property for which title has passed to the U.S. Government. As noted above, non-prohibited forfeited property or currency become assets of the Treasury Forfeiture Fund. However, prohibited forfeited items, such as narcotics, firearms, and counterfeit goods, are held by CBP until disposed or destroyed. In accordance with SFFAS No. 3, Accounting for Inventory and Related Property, an analysis of changes in CBP’s seized and forfeited prohibited property is presented in Note 8, Seized and Forfeited Property.

92 U.S. Customs and Border Protection • 2014 Performance and Accountability Report
Customs and Border Protection Notes to Financial Statements
General Property, Plant and Equipment
CBP capitalizes property, plant and equipment (PP&E), excluding land, with an acquisition value of $50 thousand or greater, and a useful life of two years or greater. CBP capitalizes all land. CBP estimates a portion of the Construction in Progress balance to accrue amounts for work completed but not yet recorded. The estimate is calculated by applying the percentage of work completed on a construction project to the associated undelivered orders. Expenditures for normal repairs and maintenance are charged to expense as incurred. When expenditures greater than $50 thousand extend an asset’s useful life they are capitalized.
Depreciation and amortization are computed using the straight line method over the estimated useful lives of the assets ranging from 4 to 30 years for equipment and software, 2 to 30 years for leasehold improvements, and 5 to 40 years for buildings, structures and land improvements. Amortization of capitalized software begins on the date of acquisition if purchased or when the module or component has been successfully tested if contractor or internally developed. Accounts Payable A portion of the accounts payable balance related to commercial vendors and travel activities is estimated and recorded through an accrual. This estimate is created using a historical ratio of subsequent disbursements to undelivered orders. The ratio is then applied to the year-end undelivered order balance to arrive at estimated accounts payable. Due to the Treasury General Fund Due to the Treasury General Fund is the offsetting liability to non-entity collections and non-entity receivables. Accrued Annual, Sick and Other Leave and Compensatory Time
Annual leave, compensatory time and other leave time are accrued when earned. The accrual is presented as a component of the payroll and benefits liability in the Consolidated Balance Sheets and is adjusted for changes in compensation rates and reduced for annual leave taken. Sick leave is expensed when used. For additional information see Note 13, Accrued Payroll and Benefits.
Pension Costs, Other Retirement Benefits and Other Post-Employment Benefits
Most CBP employees hired prior to January 1, 1984 participate in the Civil Service Retirement System (CSRS). CBP contributes 7 percent of base pay for regular employees, and 7.5 percent for law enforcement agents. Employees hired after December 31, 1983 are automatically covered by the Federal Employees’ Retirement System (FERS) and Social Security. A primary feature of FERS is that it offers a savings plan to which CBP automatically contributes 1 percent of base pay and matches any employee contributions up to an additional 4 percent of base pay. For most employees hired after December 31, 1983, CBP also contributes the employees’ matching share for Social Security. For the FERS basic benefit for employees hired before January 1, 2013, CBP contributes 11.9 percent of base pay for regular employees and 26.3 percent for law enforcement agents. For the FERS basic benefit for employees hired after December 31, 2012, CBP contributes 9.6 percent of base pay for regular employees and 24 percent for law enforcement agents. The pay base for determining CBP contributions to CSRS and FERS for inspectors and canine officers includes regular pay and up to a maximum of $17.5 thousand in certain overtime earnings for FY 2014 and 2013. CBP recognizes the full costs of its employees’ pension benefits including the portion paid by the Office of Personnel Management (OPM) as required by law; however, the liability associated with these costs is recognized by OPM.

932014 Performance and Accountability Report • U.S. Customs and Border Protection
Customs and Border Protection Notes to Financial Statements
Similar to Federal retirement plans, OPM, rather than CBP, reports the liability for future payments to retired employees who participate in the Federal Employees Health Benefits Program and the Federal Employees Group Life Insurance Program. A liability for other post-employment benefits, which includes all types of benefits to former or inactive (but not retired) employees, their beneficiaries, and covered dependents, is also recognized. For additional information see Note 13, Accrued Payroll and Benefits. Workers' Compensation and Unemployment Compensation
A liability is recorded for actual and estimated future payments to be made for workers’ compensation pursuant to the Federal Employees’ Compensation Act (FECA). The FECA program is administered by the U.S. Department of Labor (DOL), which initially pays valid claims and subsequently seeks reimbursement from Federal agencies employing the claimants. Reimbursement to DOL for payments made usually occurs approximately two fiscal years subsequent to the actual disbursement. Budgetary resources for this intra-governmental liability are made available to CBP as part of its annual appropriation from Congress in the year in which the reimbursement takes place. The liability under which unfunded FECA is recorded is entitled Accrued FECA Liability and actuarial FECA is recorded in Accrued Payroll and Benefits in the accompanying Consolidated Balance Sheets. Additionally, the actuarial liability due to the public for estimated future payments includes the expected liability for death, disability, medical and miscellaneous costs for approved compensation cases. The liability is determined using a method that utilizes historical benefit payment patterns related to a specific incurred period to predict the ultimate payments related to that period. Based on information provided by DOL, DHS allocates the actuarial liability to its components and department offices based on the payment history for the components and department offices. The actuarial liability is not covered by budgetary resources and will require future funding. For additional information see Note 13, Accrued Payroll and Benefits. A liability is also recorded for unemployment compensation owed to DOL for payments made to former CBP employees. The Unemployment Compensation for Federal Employees program provides benefits for unemployed former Federal employees and is administered by states as agents for the Federal government. DOL reimburses the states for benefits paid and then charges Federal agencies for reimbursement for their former employees’ benefits payments. The unemployment compensation liability is reported as Intra-governmental Other Employment Liabilities.
Unexpended Appropriations
Unexpended appropriations represent the amount of CBP unexpended appropriated spending authority as of fiscal year-end that is unliquidated or is unobligated and has not lapsed, been rescinded or withdrawn. Cumulative Results of Operations Cumulative Results of Operations primarily represent the excess of user fee revenues over related expenses. It also represents the net investment in Property, Plant and Equipment, Inventory and Related Property, and transfers in of equipment, materials, and supplies from other Federal agencies without reimbursement. Also, included as a reduction in Cumulative Results of Operations, are liabilities incurred, which will require funding from future appropriations, such as accumulated annual and other leave earned but not taken, accrued workers’ compensation and contingent liabilities. The portion of Cumulative Results of Operations attributable to dedicated collections is shown separately on both the Consolidated Balance Sheets and the Consolidated Statements of Changes in Net Position. For additional information see Note 18, Funds from Dedicated Collections. Revenue, Financing Sources and Expense Recognition CBP entity activities are financed principally through appropriations, exchange revenue and non-exchange revenue. Appropriations used are recognized as a financing source when expenses are incurred or assets are purchased. Exchange revenues from reimbursable services and intra-governmental reimbursable activity are recognized as earned when the goods or services are provided and reflect the full cost of the goods or services provided. Non-exchange revenue from user fees is recognized as earned in accordance with the Consolidated Omnibus Budget

94 U.S. Customs and Border Protection • 2014 Performance and Accountability Report
Customs and Border Protection Notes to Financial Statements
Reconciliation Act of 1985, as amended. CBP may retain the user fee revenues and expend them as authorized by law for CBP inspector overtime and other activities directly related to the services to which the fees relate. CBP records deferred revenue for payments received from duties collected in Puerto Rico for which goods or services have not been fully provided to the Government of Puerto Rico. Deferred revenue is reported as a liability on the Consolidated Balance Sheets until earned in a future year. An imputed financing source is also recognized to offset costs incurred by CBP but funded by another Federal source, generally in the period in which the cost was incurred. Expenses are recognized when goods or services are received, when inventory is used, or assets are depreciated or amortized. The activities reported on the Consolidated Statements of Net Cost contain all resource costs assigned from CBP cost centers. An activity-based costing system derives an estimate of the agency’s cost by activity performed. The key driver behind CBP’s allocation of cost to activity is labor hours. Each pay period, all CBP personnel log their time to one or more of several hundred distinct activities. Time recorded by operational cost center is also used to assign mission support and overhead costs to field operational cost center activities. The time and attendance system used to record personnel labor hours is COSS (Customs Overtime Scheduling System). Non-entity Revenue is recognized when the cash CBP is entitled to collect on behalf of the Federal Government is earned. Primarily, these revenue collections result from current fiscal year activities. The significant types of revenues collected and related disbursements are described below:
Duties: amounts collected on imported goods. User fees: amounts collected for certain services as provided by law. Excise taxes: amounts collected on imported distilled spirits, wines and tobacco products, and other
miscellaneous taxes collected. Fines and penalties: amounts collected for violations of laws and regulations. Refunds: payments made to importers/exporters are primarily identified when the import entries are
liquidated, a process in which CBP makes final determination of duties, taxes, fees and interest owed on each entry and compares it to the estimated amount previously determined and paid by the importer/broker. Interest is included in the refund generally for the period of time between when the estimated amounts were received from the importer/broker and the time the entry is liquidated. When a refund is identified prior to liquidation, the refund from this remittance is funded from the duty, tax or fee collections rather than from the Refunds and Drawbacks Account.
Drawbacks: remittances, in whole or in part, of duties, taxes or fees. Drawback occurs when the imported goods on which duties, taxes or fees have been previously paid are subsequently exported from the United States or destroyed prior to entering the commerce of the United States. Depending on the type of claim, the claimant has up to six or eight years from the date of importation to file for drawback.
CBP receives an annual permanent, indefinite appropriation to fund refunds and drawbacks payments. The appropriation is recorded as a liability to Treasury General Fund, which is reduced as payments are made. Any unobligated balance at year-end is returned to Treasury. A transfer to the Treasury General Fund is recognized when the non-entity revenue, collected on behalf of the Federal Government, is deposited into various Treasury receipt accounts designated for the particular type of revenue collected. An accrual adjustment is included to adjust cash collections and refund disbursements with the net increase or decrease of accrued Non-entity Accounts Receivable, net of uncollectible amounts and refunds payable. Use of Estimates Management has made certain estimates and assumptions in the reporting of assets, liabilities and note disclosures in the Consolidated Balance Sheets, Consolidated Statements of Net Cost, Consolidated Statements of Changes in Net Position, Combined Statements of Budgetary Resources, Consolidated Statements of Custodial Activity and accompanying notes. Actual results could differ from these estimates. Significant estimates include: year-end accruals of accounts payable, contingent legal and environmental liabilities, actuarial workers’ compensation,

952014 Performance and Accountability Report • U.S. Customs and Border Protection
Customs and Border Protection Notes to Financial Statements
allowance for doubtful taxes, duties and trade receivables, accruals for construction projects, retirement and post-retirement benefits assumptions, and certain non-entity receivables and payables related to custodial activities.
Taxes CBP, as a Federal entity, is not subject to Federal, state or local income taxes and accordingly, no provision for income taxes has been recorded in the accompanying financial statements.
2. Non-entity Assets
Non-entity assets as of September 30, 2014 and 2013, consist of the following (in thousands):
2014 2013 Intra-governmental: Fund Balance with Treasury (Note 3) $ 621,854 $ 595,684 Public Cash and Other Monetary Assets (Note 4) 3,260 4,580 Accounts Receivable, Net 678 588 Taxes, Duties and Trade Receivables, Net (Note 6) 3,049,390 2,682,007 Total Public $ 3,053,328 $ 2,687,175 Total Non-entity Assets 3,675,182 3,282,859 Total Entity Assets 12,499,211 12,248,588 Total Assets $16,174,393 $15,531,447
Non-entity Fund Balance with Treasury as of September 30, 2014 and 2013 includes approximately $273.2 million and $238.6 million (deposit funds) in duties collected by CBP for U.S. Virgin Islands, U.S. Department of Agriculture and antidumping/countervailing duties and $199.3 million and $181.4 million (special funds) for Injured Domestic Industries as of September 30, 2014 and 2013, respectively. These assets are directly offset with liabilities as of September 30, 2014 and 2013. Non-entity Fund Balance with Treasury consists of special and deposit funds, permanent appropriations, and miscellaneous receipts that are available to pay non-entity liabilities. Taxes, Duties and Trade receivables from the public represent amounts due from importers for goods and merchandise imported to the United States. Upon collection of these receivables, the funds will be available to pay the accrued intra-governmental liability Due to the Treasury General Fund, which equaled $3.1 billion and $2.8 billion as of September 30, 2014 and 2013, respectively.
3. Fund Balance with Treasury
Fund Balance with Treasury as of September 30, 2014 and 2013 consists of the following (in thousands):
2014 Entity Non-entity Total Trust Funds $ 1,183 $ -- $ 1,183 Special Funds 620,994 199,325 820,319 General Funds 4,163,456 149,333 4,312,789 Other Funds 1,012,197 -- 1,012,197 Deposit Funds 8,560 273,196 281,756 Total $5,806,390 $621,854 $6,428,244
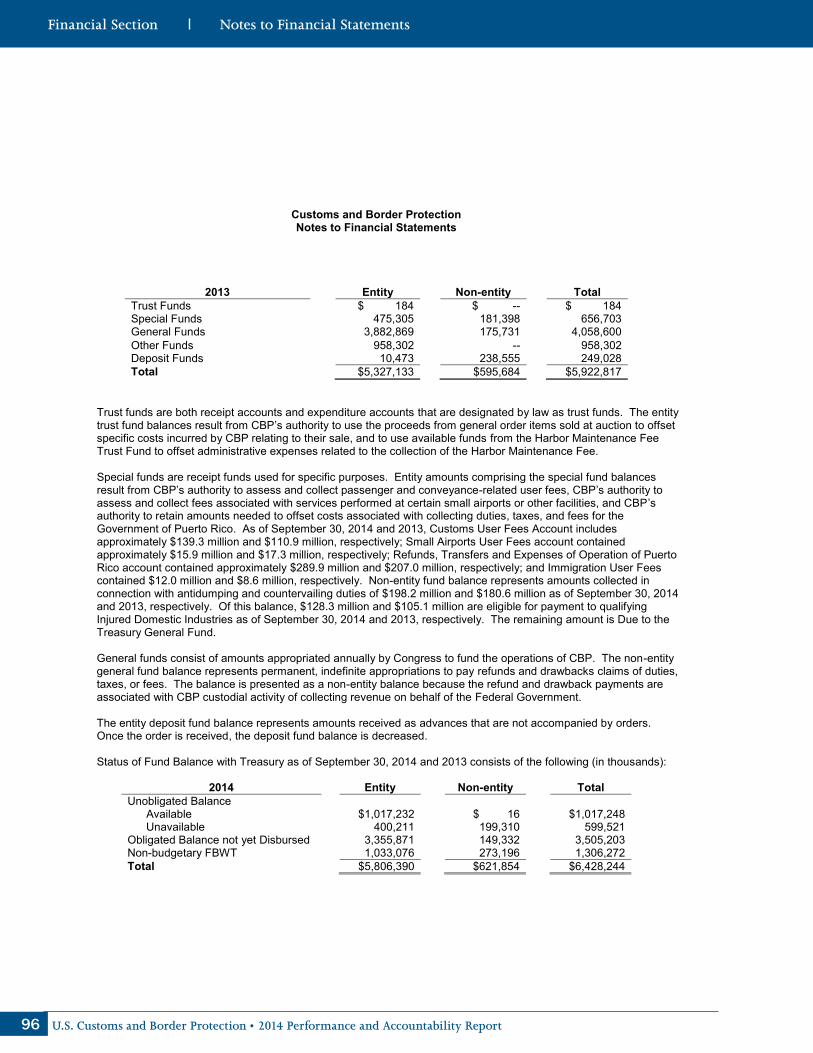
96 U.S. Customs and Border Protection • 2014 Performance and Accountability Report
Customs and Border Protection Notes to Financial Statements
2013 Entity Non-entity Total Trust Funds $ 184 $ -- $ 184 Special Funds 475,305 181,398 656,703 General Funds 3,882,869 175,731 4,058,600 Other Funds 958,302 -- 958,302 Deposit Funds 10,473 238,555 249,028 Total $5,327,133 $595,684 $5,922,817
Trust funds are both receipt accounts and expenditure accounts that are designated by law as trust funds. The entity trust fund balances result from CBP’s authority to use the proceeds from general order items sold at auction to offset specific costs incurred by CBP relating to their sale, and to use available funds from the Harbor Maintenance Fee Trust Fund to offset administrative expenses related to the collection of the Harbor Maintenance Fee.
Special funds are receipt funds used for specific purposes. Entity amounts comprising the special fund balances result from CBP’s authority to assess and collect passenger and conveyance-related user fees, CBP’s authority to assess and collect fees associated with services performed at certain small airports or other facilities, and CBP’s authority to retain amounts needed to offset costs associated with collecting duties, taxes, and fees for the Government of Puerto Rico. As of September 30, 2014 and 2013, Customs User Fees Account includes approximately $139.3 million and $110.9 million, respectively; Small Airports User Fees account contained approximately $15.9 million and $17.3 million, respectively; Refunds, Transfers and Expenses of Operation of Puerto Rico account contained approximately $289.9 million and $207.0 million, respectively; and Immigration User Fees contained $12.0 million and $8.6 million, respectively. Non-entity fund balance represents amounts collected in connection with antidumping and countervailing duties of $198.2 million and $180.6 million as of September 30, 2014 and 2013, respectively. Of this balance, $128.3 million and $105.1 million are eligible for payment to qualifying Injured Domestic Industries as of September 30, 2014 and 2013, respectively. The remaining amount is Due to the Treasury General Fund. General funds consist of amounts appropriated annually by Congress to fund the operations of CBP. The non-entity general fund balance represents permanent, indefinite appropriations to pay refunds and drawbacks claims of duties, taxes, or fees. The balance is presented as a non-entity balance because the refund and drawback payments are associated with CBP custodial activity of collecting revenue on behalf of the Federal Government.
The entity deposit fund balance represents amounts received as advances that are not accompanied by orders. Once the order is received, the deposit fund balance is decreased.
Status of Fund Balance with Treasury as of September 30, 2014 and 2013 consists of the following (in thousands):
2014 Entity Non-entity Total
Unobligated Balance Available $1,017,232 $ 16 $1,017,248 Unavailable 400,211 199,310 599,521 Obligated Balance not yet Disbursed 3,355,871 149,332 3,505,203 Non-budgetary FBWT 1,033,076 273,196 1,306,272 Total $5,806,390 $621,854 $6,428,244

972014 Performance and Accountability Report • U.S. Customs and Border Protection
Customs and Border Protection Notes to Financial Statements
2013 Entity Non-entity Total Unobligated Balance Available $ 717,720 $ -- $ 717,720 Unavailable 426,518 181,398 607,916 Obligated Balance not yet Disbursed 3,193,516 175,731 3,369,247 Non-budgetary FBWT 989,379 238,555 1,227,934 Total $5,327,133 $595,684 $5,922,817
Portions of the Unobligated Balance Unavailable include amounts appropriated in prior fiscal years that are not available to fund new obligations. However, the amounts can be used for upward and downward adjustments for existing obligations in future years.
The Obligated Balance not yet Disbursed represents amounts designated for payment of goods or services ordered, but not received, or goods and services received for which payment has not yet been made. The Non-budgetary Fund Balance with Treasury at September 30, 2014 and 2013 includes $639.9 million in COBRA User Fees that are restricted by law for use until either withdrawn by Treasury from CBP’s account or made available to CBP, as provided in Appropriation Acts. The balance resulted from a temporary fee increase and elimination of the North American Free Trade Agreement (NAFTA) country exemptions from 1994 to 1997.
CBP returned to Treasury $64.4 million and $13.8 million for indefinite no-year authority and retained $149.3 million and $175.7 million in authority for obligations pursuant to public law during the years ending September 30, 2014 and 2013, respectively. In accordance with Public Law 101-510, CBP is required to automatically cancel obligated and unobligated balances of appropriated funds five years after a fund expires. Obligations that have not been paid at the time an appropriation is canceled may be paid from an unexpired appropriation that is available for the same general purpose. As of September 30, 2014, CBP canceled $120.4 million from FY 2009 annual appropriations. As of September 30, 2013, CBP canceled $102.8 million from FY 2008 annual appropriations.
4. Cash and Other Monetary Assets
Cash and Other Monetary Assets as of September 30, 2014 and 2013, consist of the following (in thousands):
2014 Entity Non-entity Total Imprest Funds $ 185 $ -- $ 185 Undeposited Collections 199 3,260 3,459 Total $ 384 $3,260 $3,644
2013 Entity Non-entity Total
Imprest Funds $ 154 $ -- $ 154 Undeposited Collections 232 4,580 4,812 Total $ 386 $4,580 $4,966
Imprest funds are cash held primarily for change-making and for using as aids in training canines to detect the odor of currency. Undeposited collection balances represent timing differences between when cash relating to duties, taxes, fees, and other trade related collections are received and the deposit occurs in a future period. Cash can either be distributed to the General Fund, other Federal agencies, other governments, or returned to the importer/broker.
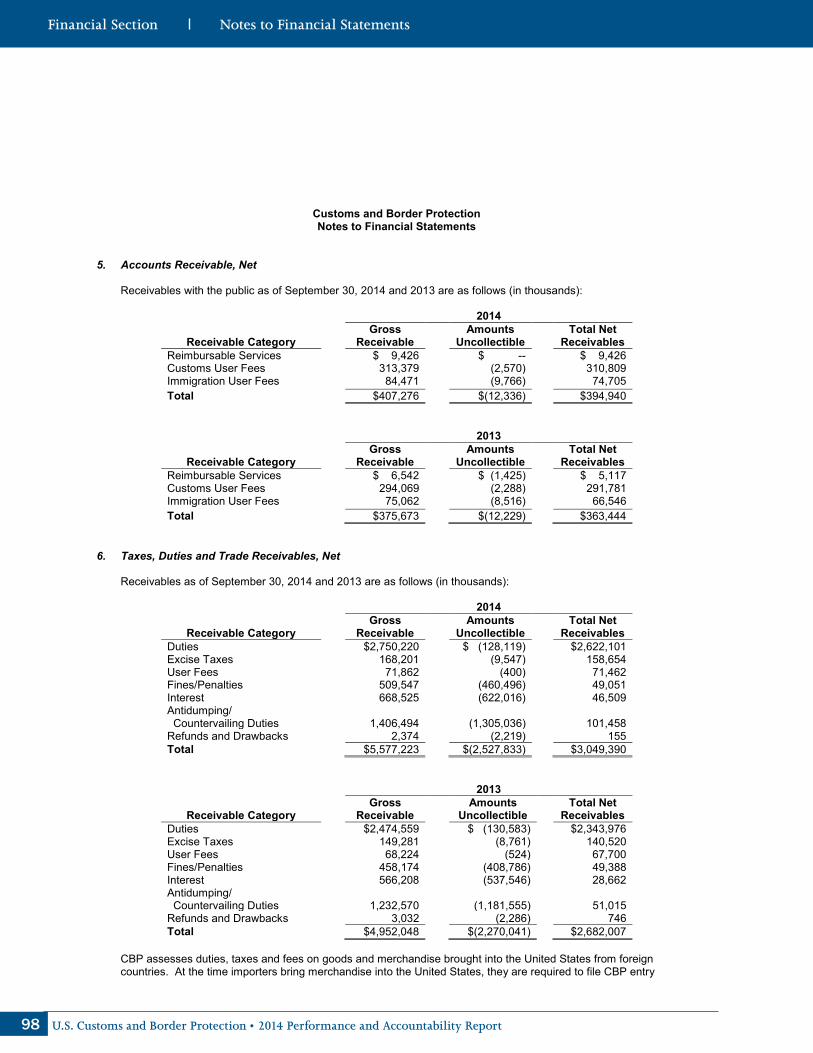
98 U.S. Customs and Border Protection • 2014 Performance and Accountability Report
Customs and Border Protection Notes to Financial Statements
5. Accounts Receivable, Net Receivables with the public as of September 30, 2014 and 2013 are as follows (in thousands):
2014
Receivable Category Gross
Receivable Amounts
Uncollectible Total Net
Receivables Reimbursable Services $ 9,426 $ -- $ 9,426 Customs User Fees 313,379 (2,570) 310,809 Immigration User Fees 84,471 (9,766) 74,705 Total $407,276 $(12,336) $394,940
2013
Receivable Category
Gross Receivable
Amounts Uncollectible
Total Net Receivables
Reimbursable Services $ 6,542 $ (1,425) $ 5,117 Customs User Fees 294,069 (2,288) 291,781 Immigration User Fees 75,062 (8,516) 66,546 Total $375,673 $(12,229) $363,444
6. Taxes, Duties and Trade Receivables, Net Receivables as of September 30, 2014 and 2013 are as follows (in thousands):
2014
Receivable Category Gross
Receivable Amounts
Uncollectible Total Net
Receivables Duties $2,750,220 $ (128,119) $2,622,101 Excise Taxes 168,201 (9,547) 158,654 User Fees 71,862 (400) 71,462 Fines/Penalties 509,547 (460,496) 49,051 Interest 668,525 (622,016) 46,509 Antidumping/ Countervailing Duties
1,406,494 (1,305,036) 101,458
Refunds and Drawbacks 2,374 (2,219) 155 Total $5,577,223 $(2,527,833) $3,049,390
2013
Receivable Category Gross
Receivable Amounts
Uncollectible Total Net
Receivables Duties $2,474,559 $ (130,583) $2,343,976 Excise Taxes 149,281 (8,761) 140,520 User Fees 68,224 (524) 67,700 Fines/Penalties 458,174 (408,786) 49,388 Interest 566,208 (537,546) 28,662 Antidumping/ Countervailing Duties
1,232,570 (1,181,555) 51,015
Refunds and Drawbacks 3,032 (2,286) 746 Total $4,952,048 $(2,270,041) $2,682,007
CBP assesses duties, taxes and fees on goods and merchandise brought into the United States from foreign countries. At the time importers bring merchandise into the United States, they are required to file CBP entry
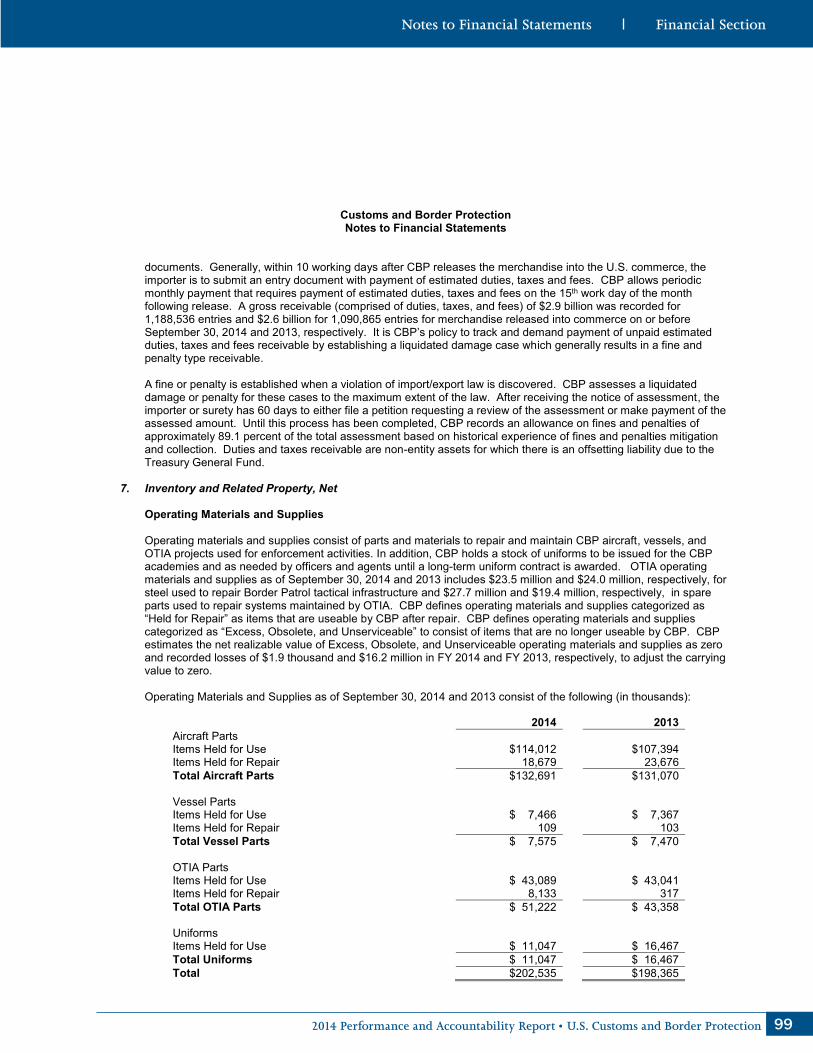
992014 Performance and Accountability Report • U.S. Customs and Border Protection
Customs and Border Protection Notes to Financial Statements
documents. Generally, within 10 working days after CBP releases the merchandise into the U.S. commerce, the importer is to submit an entry document with payment of estimated duties, taxes and fees. CBP allows periodic monthly payment that requires payment of estimated duties, taxes and fees on the 15th work day of the month following release. A gross receivable (comprised of duties, taxes, and fees) of $2.9 billion was recorded for 1,188,536 entries and $2.6 billion for 1,090,865 entries for merchandise released into commerce on or before September 30, 2014 and 2013, respectively. It is CBP’s policy to track and demand payment of unpaid estimated duties, taxes and fees receivable by establishing a liquidated damage case which generally results in a fine and penalty type receivable.
A fine or penalty is established when a violation of import/export law is discovered. CBP assesses a liquidated damage or penalty for these cases to the maximum extent of the law. After receiving the notice of assessment, the importer or surety has 60 days to either file a petition requesting a review of the assessment or make payment of the assessed amount. Until this process has been completed, CBP records an allowance on fines and penalties of approximately 89.1 percent of the total assessment based on historical experience of fines and penalties mitigation and collection. Duties and taxes receivable are non-entity assets for which there is an offsetting liability due to the Treasury General Fund.
7. Inventory and Related Property, Net
Operating Materials and Supplies Operating materials and supplies consist of parts and materials to repair and maintain CBP aircraft, vessels, and OTIA projects used for enforcement activities. In addition, CBP holds a stock of uniforms to be issued for the CBP academies and as needed by officers and agents until a long-term uniform contract is awarded. OTIA operating materials and supplies as of September 30, 2014 and 2013 includes $23.5 million and $24.0 million, respectively, for steel used to repair Border Patrol tactical infrastructure and $27.7 million and $19.4 million, respectively, in spare parts used to repair systems maintained by OTIA. CBP defines operating materials and supplies categorized as “Held for Repair” as items that are useable by CBP after repair. CBP defines operating materials and supplies categorized as “Excess, Obsolete, and Unserviceable” to consist of items that are no longer useable by CBP. CBP estimates the net realizable value of Excess, Obsolete, and Unserviceable operating materials and supplies as zero and recorded losses of $1.9 thousand and $16.2 million in FY 2014 and FY 2013, respectively, to adjust the carrying value to zero. Operating Materials and Supplies as of September 30, 2014 and 2013 consist of the following (in thousands):
2014 2013 Aircraft Parts Items Held for Use $114,012 $107,394 Items Held for Repair 18,679 23,676 Total Aircraft Parts $132,691 $131,070 Vessel Parts Items Held for Use $ 7,466 $ 7,367 Items Held for Repair 109 103 Total Vessel Parts $ 7,575 $ 7,470 OTIA Parts Items Held for Use $ 43,089 $ 43,041 Items Held for Repair 8,133 317 Total OTIA Parts $ 51,222 $ 43,358 Uniforms Items Held for Use $ 11,047 $ 16,467 Total Uniforms $ 11,047 $ 16,467 Total $202,535 $198,365

100 U.S. Customs and Border Protection • 2014 Performance and Accountability Report
Customs and Border Protection Notes to Financial Statements
8. Seized and Forfeited Property
This schedule is presented for material categories of prohibited (non-valued) seized and forfeited property only. These items are retained and ultimately destroyed by CBP and are not transferred to the Department of the Treasury Forfeiture Fund or other Federal agencies. The ending balance for firearms includes only those seized items that can actually be used as firearms. Counterfeit goods are presented in number of seized items, and include clothing, footwear, jewelry, electronic equipment, movies, music, media, identification documents and other items. Illegal drugs are presented in kilograms and a portion of the weight includes packaging, which often cannot be reasonably separated from the weight of the drugs since the packaging must be maintained for evidentiary purposes. Firearms are presented in number of cases. Khat seizures have increased in recent years and are therefore included in the list of illegal drugs seized and forfeited in both FY 2014 and 2013.
Analysis of Changes in Prohibited (Non-valued) Seized Property, September 30, 2014
Category Unit of
Measurement Balance
October 1 New
Seizures Remissions New
Forfeitures Adjustments* Balance
September 30
Illegal Drugs Cannabis
(marijuana) Kilograms 3,104 1,039,151 -- (1,043,877) 4,635 3,013
Cocaine Kilograms 211 21,975 -- (21,889) 6 303
Heroin Kilograms 9 2,402 -- (2,383) 21 49
Ecstasy Kilograms 17 298 -- (298) -- 17
Khat Kilograms 45 66,902 -- (66,910) (37) --
Methamphetamine Kilograms 11 11,676 -- (11,633) (21) 33
Steroids Kilograms 264 689 -- (555) (2) 396
Firearms Number of Cases 3,668 4,589 (361) (1,528) (765) 5,603
Counterfeit Goods Number of Cases 31,473 55,768 (818) (51,755) (1,348) 33,320
* Adjustments are the result of changes due to inventory counts, changes in legal status or property type, and/or discontinuance of cases. Analysis of Changes in Prohibited (Non-valued) Seized Property, September 30, 2013
Category Unit of
Measurement Balance
October 1 New
Seizures Remissions New
Forfeitures Adjustments* Balance
September 30
Illegal Drugs Cannabis
(marijuana) Kilograms 2,051 1,224,988 -- (1,231,308) 7,373 3,104
Cocaine Kilograms 83 20,528 -- (20,373) (27) 211
Heroin Kilograms 4 2,396 -- (2,392) 1 9
Ecstasy Kilograms 18 720 -- (724) 3 17
Khat Kilograms 48 82,786 -- (82,741) (48) 45
Methamphetamine Kilograms 5 11,035 -- (11,054) 25 11
Steroids Kilograms 147 734 -- (613) (4) 264 Firearms Number of Cases 3,112 4,600 (564) (3,290) (190) 3,668
Counterfeit Goods Number of Cases 39,248 56,207 (637) (60,127) (3,218) 31,473
* Adjustments are the result of changes due to inventory counts, changes in legal status or property type, and/or discontinuance of cases.

1012014 Performance and Accountability Report • U.S. Customs and Border Protection
Customs and Border Protection Notes to Financial Statements
Analysis of Changes in Prohibited (Non-valued) Forfeited Property, September 30, 2013
Category Unit of
Measurement Balance
October 1 New
Forfeitures Transfers Destroyed Adjustments* Balance
September 30 Illegal Drugs Cannabis (marijuana)
Kilograms 141,235 1,231,308 (152) (395,939) (833,133) 143,319
Cocaine Kilograms 24,821 20,373 (193) (22,924) (2,227) 19,850 Heroin Kilograms 2,768 2,392 (38) (1,818) (57) 3,247 Ecstasy Kilograms 921 724 (40) (496) (32) 1,077 Khat Kilograms 3,339 82,741 -- (81,401) (1,021) 3,658 Methamphetamine Kilograms 7,039 11,054 (77) (6,210) (326) 11,480 Steroids Kilograms 340 613 (1) (596) (21) 335
Firearms Number of Cases 1,025 3,290 (3,285) (3) 133 1,160 Counterfeit Goods Number of Cases 15,764 60,127 (246) (54,438) 1,698 22,905 * Adjustments are the result of changes due to inventory counts, changes in legal status or property type, and/or discontinuance of cases.
Analysis of Changes in Prohibited (Non-Valued) Forfeited Property, September 30, 2014
Category Unit of
Measurement Balance
October 1 New
Forfeitures Transfers Destroyed Adjustments* Balance
September 30 Illegal Drugs Cannabis (marijuana)
Kilograms 143,319 1,043,877 (270) (353,443) (698,891) 134,592
Cocaine Kilograms 19,850 21,889 (130) (19,354) (954) 21,301 Heroin Kilograms 3,247 2,383 (20) (1,897) (208) 3,505 Ecstasy Kilograms 1,077 298 (46) (474) (25) 830 Khat Kilograms 3,658 66,910 -- (68,165) (161) 2,242 Methamphetamine Kilograms 11,480 11,633 (9) (8,094) (1,736) 13,274 Steroids Kilograms 335 555 -- (836) 9 63
Firearms Number of Cases 1,160 1,528 (1,668) -- 390 1,410 Counterfeit Goods Number of Cases 22,905 51,755 (275) (48,323) 521 26,583 * Adjustments are the result of changes due to inventory counts, changes in legal status or property type, and/or discontinuance of cases.
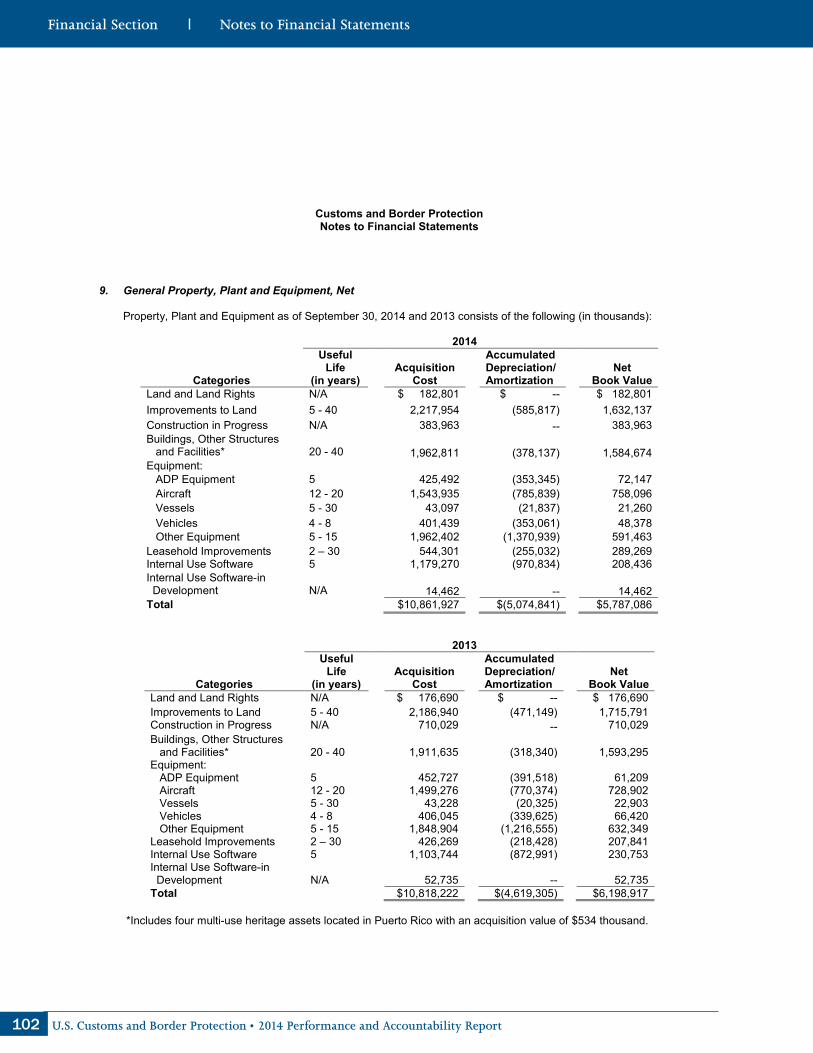
102 U.S. Customs and Border Protection • 2014 Performance and Accountability Report
Customs and Border Protection Notes to Financial Statements
9. General Property, Plant and Equipment, Net
Property, Plant and Equipment as of September 30, 2014 and 2013 consists of the following (in thousands):
2014
Categories
Useful Life
(in years)
Acquisition
Cost
Accumulated Depreciation/Amortization
Net
Book Value Land and Land Rights N/A $ 182,801 $ -- $ 182,801 Improvements to Land 5 - 40 2,217,954 (585,817) 1,632,137 Construction in Progress N/A 383,963 -- 383,963 Buildings, Other Structures and Facilities*
20 - 40 1,962,811 (378,137) 1,584,674
Equipment: ADP Equipment 5 425,492 (353,345) 72,147 Aircraft 12 - 20 1,543,935 (785,839) 758,096 Vessels 5 - 30 43,097 (21,837) 21,260 Vehicles 4 - 8 401,439 (353,061) 48,378 Other Equipment 5 - 15 1,962,402 (1,370,939) 591,463 Leasehold Improvements 2 – 30 544,301 (255,032) 289,269 Internal Use Software 5 1,179,270 (970,834) 208,436 Internal Use Software-in Development
N/A 14,462 -- 14,462
Total $10,861,927 $(5,074,841) $5,787,086
2013
Categories
Useful Life
(in years)
Acquisition
Cost
Accumulated Depreciation/Amortization
Net
Book Value Land and Land Rights N/A $ 176,690 $ -- $ 176,690 Improvements to Land 5 - 40 2,186,940 (471,149) 1,715,791 Construction in Progress N/A 710,029 -- 710,029 Buildings, Other Structures and Facilities*
20 - 40 1,911,635 (318,340) 1,593,295
Equipment: ADP Equipment 5 452,727 (391,518) 61,209 Aircraft 12 - 20 1,499,276 (770,374) 728,902 Vessels 5 - 30 43,228 (20,325) 22,903 Vehicles 4 - 8 406,045 (339,625) 66,420 Other Equipment 5 - 15 1,848,904 (1,216,555) 632,349 Leasehold Improvements 2 – 30 426,269 (218,428) 207,841 Internal Use Software 5 1,103,744 (872,991) 230,753 Internal Use Software-in Development N/A 52,735 -- 52,735 Total $10,818,222 $(4,619,305) $6,198,917
*Includes four multi-use heritage assets located in Puerto Rico with an acquisition value of $534 thousand.

1032014 Performance and Accountability Report • U.S. Customs and Border Protection
Customs and Border Protection Notes to Financial Statements
10. Stewardship PP&E
CBP’s Stewardship PP&E is comprised of heritage assets located in Washington D.C. and the Commonwealth of Puerto Rico. CBP aggregates its personal property heritage assets as collections of documents and artifacts and reflects its multi-use heritage assets as number of physical units. Information related to heritage assets at September 30, 2014 and 2013 consists of the following:
2014 Categories
Beginning Balance
Additions Withdrawals Adjustments Total
Collection-type Assets Documents 1 -- -- -- 1 Artifacts 1 -- -- -- 1 Multi-use Heritage Assets 4 -- -- -- 4 Total Stewardship PP&E 6 -- -- -- 6
2013 Categories
Beginning Balance
Additions Withdrawals Adjustments Total
Collection-type Assets Documents 1 -- -- -- 1 Artifacts 1 -- -- -- 1 Multi-use Heritage Assets 4 -- -- -- 4 Total Stewardship PP&E 6 -- -- -- 6
CBP possesses a wide range of documents and artifacts which are unique due to historical, cultural, artistic, or architectural significance. These assets are used to preserve and to provide education on CBP’s history and tradition. Documents consist of dated port records, CBP regulations, and ledgers of Collectors of Customs. Artifacts include antique scales, dated pictures of Customs Inspectors, aged tools used to sample imported commodities such as wood bales and bulk grain, and dated Customs uniforms, badges, and stamps.
As of September 30, 2014 and 2013, CBP maintained four Customs houses, designated as multi-use heritage assets, located in Puerto Rico and valued at $534 thousand, which are fully depreciated. All multi-use heritage assets are reflected on the Consolidated Balance Sheets. Deferred maintenance and repairs and condition information for heritage assets are presented in the Required Supplementary Information.
11. Other Assets
Advances and Prepayments
Intra-governmental advances and prepayments as of September 30, 2014 and 2013, totaling $263.8 million and $133.9 million, respectively, consist primarily of advances to the Departments of Transportation and Defense for support of border security, and to the Department of Justice, UNICOR, for vehicle purchases.
Other
Other assets consists of capital assets no longer in service, pending disposal, and employee travel and salary advances as of September 30, 2014 and 2013, totaling $50 thousand and $429 thousand, respectively.

104 U.S. Customs and Border Protection • 2014 Performance and Accountability Report
Customs and Border Protection Notes to Financial Statements
12. Liabilities Not Covered by Budgetary Resources
Liabilities Not Covered by Budgetary Resources as of September 30, 2014 and 2013, consist of the following (in thousands):
2014 2013 Intra-governmental: Accrued FECA Liability $ 167,449 $ 165,071 Other Employment Liabilities 206 322 Due to the Treasury General Fund 3,120,403 2,757,534 Total Intra-governmental $3,288,058 $2,922,927 Public: Accrued Payroll and Benefits: Accrued Unfunded Leave (Note 13) 433,161 405,063 Actuarial FECA Liability (Note 13) 1,015,236 1,005,111 Other Employment Liabilities 3,832 -- Environmental and Disposal Liabilities (Note 14) 20,974 17,524 Legal Contingent Liabilities 397,844 381,572 Total Public $1,871,047 $1,809,270 Total Liabilities Not Covered by Budgetary Resources 5,159,105 4,732,197 Total Liabilities Covered by Budgetary Resources 1,450,866 1,317,389 Total Liabilities $6,609,971 $6,049,586
Liabilities not covered by new budget authority or other budgetary resources represent amounts owed in excess of available appropriated or other amounts. Available budgetary resources include new budget authority, unobligated balances of budgetary resources at the beginning of the year or net transfers of prior year balances during the year, spending authority from offsetting collections, and recoveries of unexpired budget authority through downward adjustments of prior year obligations.
13. Accrued Payroll and Benefits
The payroll and benefits liability as of September 30, 2014 and 2013 consists of the following (in thousands):
2014 2013 Accrued Funded Payroll and Benefits $ 169,769 $ 65,225 Accrued Unfunded Leave 433,161 405,063 Accrued Other Employment Liabilities 3,832 -- Actuarial FECA Liability 1,015,236 1,005,111 Total $1,621,998 $1,475,399
Future workers’ compensation estimates are generated from an application of actuarial procedures developed by DOL.
14. Environmental and Disposal Liabilities
CBP is required to remediate contamination in accordance with Federal laws in order to protect human health and the environment. These laws include the Comprehensive Environmental Response, Compensation and Liability Act,
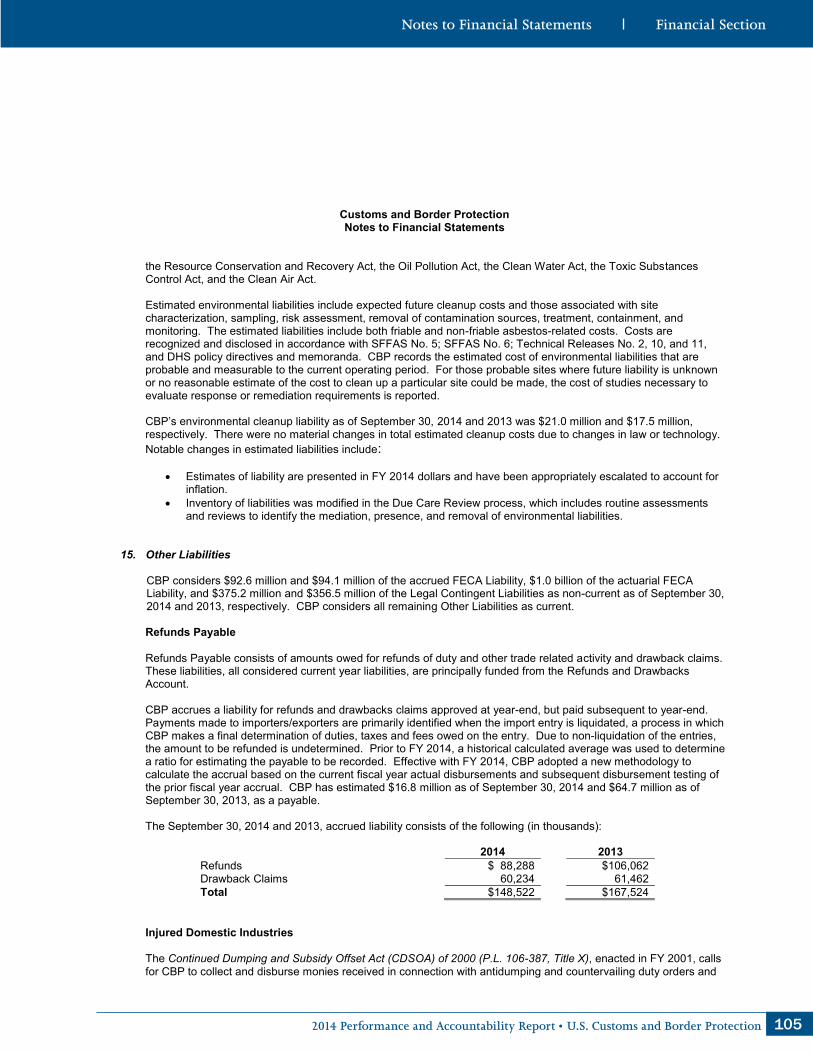
1052014 Performance and Accountability Report • U.S. Customs and Border Protection
Customs and Border Protection Notes to Financial Statements
the Resource Conservation and Recovery Act, the Oil Pollution Act, the Clean Water Act, the Toxic Substances Control Act, and the Clean Air Act. Estimated environmental liabilities include expected future cleanup costs and those associated with site characterization, sampling, risk assessment, removal of contamination sources, treatment, containment, and monitoring. The estimated liabilities include both friable and non-friable asbestos-related costs. Costs are recognized and disclosed in accordance with SFFAS No. 5; SFFAS No. 6; Technical Releases No. 2, 10, and 11, and DHS policy directives and memoranda. CBP records the estimated cost of environmental liabilities that are probable and measurable to the current operating period. For those probable sites where future liability is unknown or no reasonable estimate of the cost to clean up a particular site could be made, the cost of studies necessary to evaluate response or remediation requirements is reported. CBP’s environmental cleanup liability as of September 30, 2014 and 2013 was $21.0 million and $17.5 million, respectively. There were no material changes in total estimated cleanup costs due to changes in law or technology. Notable changes in estimated liabilities include:
Estimates of liability are presented in FY 2014 dollars and have been appropriately escalated to account for inflation.
Inventory of liabilities was modified in the Due Care Review process, which includes routine assessments and reviews to identify the mediation, presence, and removal of environmental liabilities.
15. Other Liabilities CBP considers $92.6 million and $94.1 million of the accrued FECA Liability, $1.0 billion of the actuarial FECA Liability, and $375.2 million and $356.5 million of the Legal Contingent Liabilities as non-current as of September 30, 2014 and 2013, respectively. CBP considers all remaining Other Liabilities as current.
Refunds Payable Refunds Payable consists of amounts owed for refunds of duty and other trade related activity and drawback claims. These liabilities, all considered current year liabilities, are principally funded from the Refunds and Drawbacks Account. CBP accrues a liability for refunds and drawbacks claims approved at year-end, but paid subsequent to year-end. Payments made to importers/exporters are primarily identified when the import entry is liquidated, a process in which CBP makes a final determination of duties, taxes and fees owed on the entry. Due to non-liquidation of the entries, the amount to be refunded is undetermined. Prior to FY 2014, a historical calculated average was used to determine a ratio for estimating the payable to be recorded. Effective with FY 2014, CBP adopted a new methodology to calculate the accrual based on the current fiscal year actual disbursements and subsequent disbursement testing of the prior fiscal year accrual. CBP has estimated $16.8 million as of September 30, 2014 and $64.7 million as of September 30, 2013, as a payable.
The September 30, 2014 and 2013, accrued liability consists of the following (in thousands):
2014 2013 Refunds $ 88,288 $106,062 Drawback Claims 60,234 61,462 Total $148,522 $167,524
Injured Domestic Industries
The Continued Dumping and Subsidy Offset Act (CDSOA) of 2000 (P.L. 106-387, Title X), enacted in FY 2001, calls for CBP to collect and disburse monies received in connection with antidumping and countervailing duty orders and

106 U.S. Customs and Border Protection • 2014 Performance and Accountability Report
Customs and Border Protection Notes to Financial Statements
findings to qualifying Injured Domestic Industries (IDI). Antidumping duties are collected when it is determined that a class or kind of foreign merchandise is being released into the U.S. economy at less than its fair value to the detriment of a U.S. industry. Countervailing duties are collected when it is determined that a foreign government is providing a subsidy to its local industries to manufacture, produce, or export a class or kind of merchandise for import into the U.S. commerce to the detriment of a U.S. industry. Due to the repeal of the CDSOA in the Deficit Reduction Omnibus Reconciliation Act of 2005, only duties on entries filed prior to October 1, 2007 will eventually be distributed to affected U.S. companies pursuant to rulings by the U.S. Department of Commerce. As of September 30, 2014 and 2013, CBP recorded a liability of $128.3 million and $105.1 million, respectively. CBP makes annual payments of antidumping/countervailing duties to qualifying Injured Domestic Industries.
16. Leases
Operating Leases CBP leases various facilities and equipment under leases accounted for as operating leases. The leased items consist of offices, warehouses, vehicles and other equipment. Much of the office space occupied by CBP is either owned by the Federal Government or is leased by the General Services Administration (GSA) from commercial sources. CBP is not committed to continue to pay rent to GSA beyond the period occupied providing proper advance notice is given to GSA unless the rental agreement is non-cancelable. It is expected that CBP will continue to occupy and lease office space from GSA in future years.
The following schedule, by years, shows the future minimum rental payments required under operating leases that have initial or remaining non-cancelable lease terms in excess of one year, as of September 30, 2014 (in thousands):
Fiscal Year
Facilities, Vehicles, and
Equipment 2015 $ 207,239 2016 187,858 2017 172,647 2018 150,075 2019 116,324 Beyond 2018 914,941 Total Future Lease Payments $1,749,084
17. Commitments and Contingencies
Legal Contingent Liabilities
CBP is party to various administrative proceedings, legal actions, and administrative claims brought against it in the normal course of operations that may result in settlements or decisions that are adverse to CBP. The ultimate disposition of these claims is unknown, and they are primarily related to personnel matters, Federal Tort Claims Act matters, and trade matters involving various customs laws and regulations. Any financially unfavorable administrative or court decision will normally be funded from: (1) CBP appropriation for refunds and drawbacks; (2) the Judgment Fund maintained by Treasury; or (3) CBP salaries and expenses appropriations. The range of estimated contingent liabilities for all probable and estimable litigation related claims as of September 30, 2014 and 2013 were $397.8 million to $1.0 billion and $381.6 million to $1.0 billion, respectively. Asserted and pending legal claims for which loss is reasonably possible range from an estimated $393.4 million to $530.6 million and $389.7 million to $526.4 million as of September 30, 2014 and 2013, respectively. As of September 30, 2014, CBP had three unasserted tort cases considered probable or reasonably possible for which no estimate could be made.

1072014 Performance and Accountability Report • U.S. Customs and Border Protection
Customs and Border Protection Notes to Financial Statements
As disclosed in the Other Liabilities note, $375.2 million and $356.5 million of the Legal Contingent Liabilities is considered non-current as of September 30, 2014 and 2013, respectively.
Duty and Trade Refunds
There are various other trade issues resolved by other Federal agencies, such as the Department of Commerce, which may result in refunds of duties, taxes and fees from the Refunds and Drawbacks Account. Until such time as a decision is reached by the other Federal agencies, CBP does not have sufficient information to estimate a contingent liability amount. All known refunds as of September 30, 2014 and 2013 have been recorded. Loaned Aircraft
CBP is liable to the Department of Defense for damage or loss to aircraft on loan. CBP had 16 aircraft loaned from the Department of Defense with an acquisition value of $94.4 million, as of September 30, 2014 and 2013.
18. Funds from Dedicated Collections Funds from dedicated collections are financed by specifically identified revenues, provided to the government by non-federal sources, often supplemented by other financing sources, which remain available over time. These specifically identified revenues and other financing sources are required by statute to be used for designated activities, benefits or purposes and must be accounted for separately from the Federal Government’s General Fund. Consolidated Omnibus Budget Reconciliation Act (COBRA)
In April 1986, the President signed the Consolidated Omnibus Budget Reconciliation Act (COBRA) of 1985, which authorized CBP to collect user fees for certain services. The law initially established processing fees for air and sea passengers, commercial trucks, rail cars, private vessels and aircraft, commercial vessels, dutiable mail packages, and CBP broker permits. An additional fee category, contained in tax reform legislation, for processing barges and bulk carriers for Canada and Mexico, was added later that year. The collection of the COBRA fees for CBP services began on July 7, 1986. In addition to the collection of user fees, other changes in CBP procedures were enacted due to the COBRA statute. Most importantly, provisions were included for providing non-reimbursable inspectional overtime services and paying for excess pre-clearance costs from the COBRA user fee collections. The Customs and Trade Act of 1990 amended the COBRA legislation to provide for the hiring of inspectional personnel, the purchasing of equipment, and the covering of related expenses with any surplus monies available after overtime and excess pre-clearance costs are satisfied. Expenditures from the surplus can only be used to enhance the service provided to those functions for which fees are collected. This legislation took effect on October 1, 1990. 19 USC Section 58c contains the Fees for certain Customs services. The authority to use these funds is contained in the annual Department of Homeland Security Appropriations Act. Immigration User Fees (IUF) Joint Resolution (H.J. Res. 738), making continuing appropriations for FY 1987 (the “1987 Act”) (Public Laws 99-500 and 99-591), established the Immigration User Fee Account (IUFA) requiring the collection of a $5 fee charged to each passenger arriving in the United States from foreign locations aboard commercial aircraft and commercial vessels except passengers whose journeys originated in the United States, Canada, Mexico, a territory or possession of the United States, or an adjacent island. The 1987 Act directed the Immigration and Naturalization Service (INS), beginning in FY 1987, to collect an immigration user fee for each passenger arriving in the United States by commercial air or sea conveyance (with limited exceptions). This law was codified in 8 U.S.C. 1103, 1356, section 286, the Immigration and Nationality Act (INA).
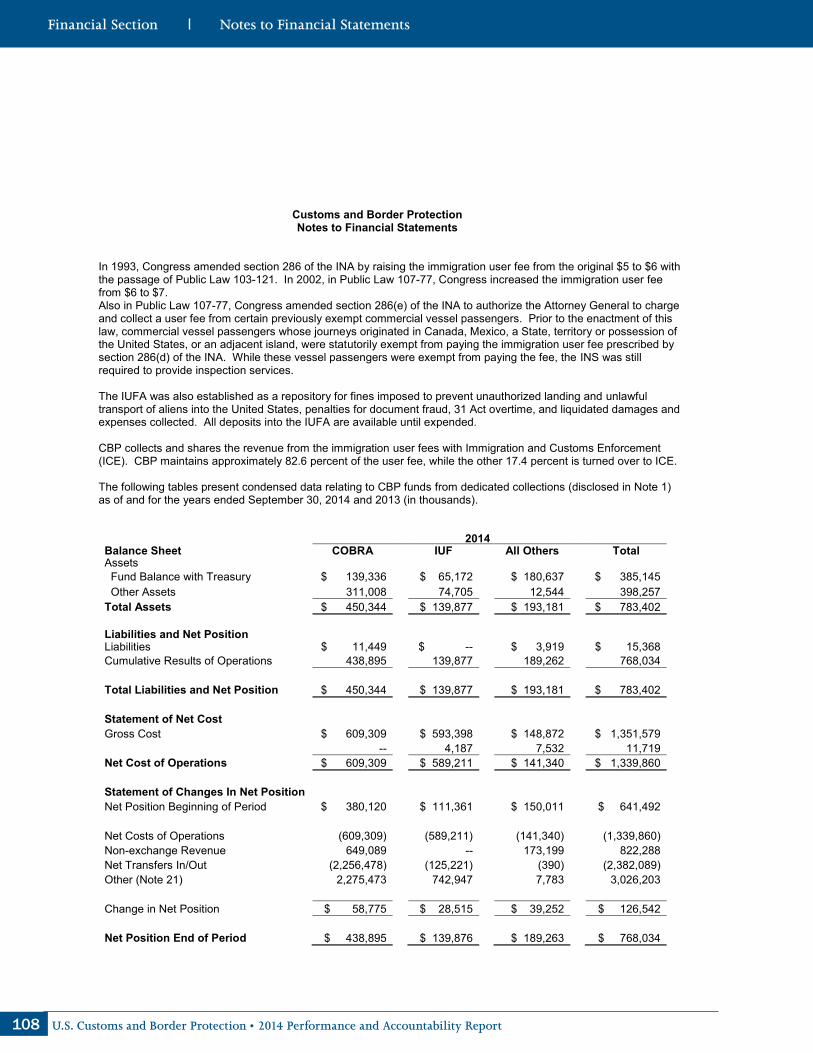
108 U.S. Customs and Border Protection • 2014 Performance and Accountability Report
Customs and Border Protection Notes to Financial Statements
In 1993, Congress amended section 286 of the INA by raising the immigration user fee from the original $5 to $6 with the passage of Public Law 103-121. In 2002, in Public Law 107-77, Congress increased the immigration user fee from $6 to $7. Also in Public Law 107-77, Congress amended section 286(e) of the INA to authorize the Attorney General to charge and collect a user fee from certain previously exempt commercial vessel passengers. Prior to the enactment of this law, commercial vessel passengers whose journeys originated in Canada, Mexico, a State, territory or possession of the United States, or an adjacent island, were statutorily exempt from paying the immigration user fee prescribed by section 286(d) of the INA. While these vessel passengers were exempt from paying the fee, the INS was still required to provide inspection services.
The IUFA was also established as a repository for fines imposed to prevent unauthorized landing and unlawful transport of aliens into the United States, penalties for document fraud, 31 Act overtime, and liquidated damages and expenses collected. All deposits into the IUFA are available until expended. CBP collects and shares the revenue from the immigration user fees with Immigration and Customs Enforcement (ICE). CBP maintains approximately 82.6 percent of the user fee, while the other 17.4 percent is turned over to ICE.
The following tables present condensed data relating to CBP funds from dedicated collections (disclosed in Note 1) as of and for the years ended September 30, 2014 and 2013 (in thousands). 2014 Balance Sheet COBRA IUF All Others Total Assets Fund Balance with Treasury $ 139,336 $ 65,172 $ 180,637 $ 385,145 Other Assets 311,008 74,705 12,544 398,257 Total Assets $ 450,344 $ 139,877 $ 193,181 $ 783,402 Liabilities and Net Position Liabilities $ 11,449 $ -- $ 3,919 $ 15,368 Cumulative Results of Operations 438,895 139,877 189,262 768,034 Total Liabilities and Net Position $ 450,344 $ 139,877 $ 193,181 $ 783,402 Statement of Net Cost Gross Cost $ 609,309 $ 593,398 $ 148,872 $ 1,351,579 -- 4,187 7,532 11,719 Net Cost of Operations $ 609,309 $ 589,211 $ 141,340 $ 1,339,860 Statement of Changes In Net Position Net Position Beginning of Period $ 380,120 $ 111,361 $ 150,011 $ 641,492 Net Costs of Operations (609,309) (589,211) (141,340) (1,339,860) Non-exchange Revenue 649,089 -- 173,199 822,288 Net Transfers In/Out (2,256,478) (125,221) (390) (2,382,089) Other (Note 21) 2,275,473 742,947 7,783 3,026,203 Change in Net Position $ 58,775 $ 28,515 $ 39,252 $ 126,542 Net Position End of Period $ 438,895 $ 139,876 $ 189,263 $ 768,034

1092014 Performance and Accountability Report • U.S. Customs and Border Protection
Customs and Border Protection Notes to Financial Statements
2013 Balance Sheet COBRA IUF All Others Total Assets Fund Balance with Treasury $ 110,919
$ 44,815
$ 149,150
$ 304,884
Other Assets 292,012
66,546
2,552
361,110 Total Assets $ 402,931
$ 111,361
$ 151,702
$ 665,994
Liabilities and Net Position Liabilities $ 22,811
$ --
$ 1,691
$ 24,502
Cumulative Results of Operations 380,120
111,361
150,011
641,492
Total Liabilities and Net Position $ 402,931
$ 111,361
$ 151,702
$ 665,994
Statement of Net Cost Gross Cost $ 406,464
$ 632,041
$ 124,515
$ 1,163,020
Less Earned Revenues --
--
2,776
2,776 Net Cost of Operations $ 406,464
$ 632,041
$ 121,739
$ 1,160,244
Statement of Changes In Net Position Net Position Beginning of Period $ 181,369 $ 147,217 $ 106,086 $ 434,672 Net Costs of Operations (406,464) (632,040) (121,740) (1,160,244) Non-exchange Revenue 448,683 -- 156,322 605,005 Net Transfers In/Out (2,167,719)
) (116,842)
) --
) (2,284,561)
) Other (Note 21) 2,324,251 713,026 9,343 3,046,620 Change in Net Position $ 198,751
$ (35,856)
$ 43,925
$ 206,820
Net Position End of Period $ 380,120 $ 111,361 $ 150,011 $ 641,492
19. Intra-governmental Costs and Exchange Revenue
Intra-governmental costs represent exchange transactions made between two reporting entities within the Federal Government and are presented separately from costs with the public (exchange transactions made between the reporting entity and a non-Federal entity). Intra-governmental exchange revenue is disclosed separately from exchange revenue with the public. The criteria used for this classification requires that the intra-governmental expenses relate to the source of goods and services purchased by the reporting entity and not to the classification of related revenue. With intra-governmental costs, the buyer and seller are both Federal entities. If a Federal entity purchases goods or services from another Federal entity and sells them to the public, the exchange revenue would be classified as “with the public,” but the related costs would be classified as intra-governmental. The purpose of this classification is to enable the Federal Government to provide consolidated financial statements, and not to match public and intra-governmental revenue with costs that are incurred to produce public and intra-governmental revenue. The Consolidated Statement of Net Cost reflects intra-governmental and public cost and exchange revenue as summarized below for the years ended September 30, 2014 and 2013 (in thousands):

110 U.S. Customs and Border Protection • 2014 Performance and Accountability Report
Customs and Border Protection Notes to Financial Statements
For the years ended September 30, 2014 and 2013: 2014 2013 Securing America’s Borders Intra-governmental Costs $ 1,680,830 $ 1,470,571 Public Costs 4,069,225 3,671,553 Total Securing America’s Borders Costs $ 5,750,055 $ 5,142,124 Less: Intra-governmental Earned Revenue 34,591 1,604 Less: Public Earned Revenue 67,448 7,647 Total Securing America’s Borders Revenue $ 102,039 $ 9,251 Securing and Expediting Trade Intra-governmental Costs 881,132 1,040,394 Public Costs 1,874,799 2,060,690 Total Securing and Expediting Trade Costs $ 2,755,931 $ 3,101,084 Less: Intra-governmental Earned Revenue 15,697 65,666 Less: Public Earned Revenue 30,169 71,947 Total Securing and Expediting Trade Revenue $ 45,866 $ 137,613 Securing and Expediting Travel Intra-governmental Costs 1,362,216 1,282,933 Public Costs 2,687,162 2,690,261 Total Securing and Expediting Travel Costs $ 4,049,378 $ 3,973,194 Less: Intra-governmental Earned Revenue 25,762 35,007 Less: Public Earned Revenue 49,983 55,655 Total Securing and Expediting Travel Revenue $ 75,745 $ 90,662 Intelligence and Targeting Intra-governmental Costs 163,335 136,107 Public Costs 422,999 438,774 Total Intelligence and Targeting Costs $ 586,334 $ 574,881 Less: Intra-governmental Earned Revenue 2,046 24 Less: Public Earned Revenue 4,293 2,632 Total Intelligence and Targeting Revenue $ 6,339 $ 2,656 Net Cost of Operations $12,911,709 $12,551,101

1112014 Performance and Accountability Report • U.S. Customs and Border Protection
Customs and Border Protection Notes to Financial Statements
20. Sub-organization Program Costs/Program Costs by Strategic Goal
CBP is the unified border agency whose priority mission is the prevention of terrorism and terrorist weapons from entering the U.S. CBP meets these responsibilities by: (1) enforcing the laws governing the flow of merchandise or commerce across the borders of the U.S.; (2) assessing and collecting duties, taxes and fees on imported and other goods and services; and (3) enforcing drug-related and other laws and regulations of the U.S. on behalf of Federal agencies and/or in conjunction with various states, local agencies and foreign countries. Operating costs are summarized in the Consolidated Statement of Net Cost by mission or major line of activity, as applicable to the reporting period. The net cost of operations is the gross (i.e. total) cost incurred by CBP less any exchange (i.e. earned) revenue. The strategic goals identified in the following tables align with the “DHS Strategic Plan for Fiscal Years (FY) 2012 – 2016.” The DHS Strategic Plan is the result of the DHS Quadrennial Homeland Security Review (QHSR), which established a unified, strategic framework for homeland security missions and goals.
For the year ended September 30, 2014 (in thousands):
2014
Schedule of Net Cost by Program and Responsibility Segment
Fostering a Safe & Secure Homeland
Enforcing & Administering
Our Immigration Laws
Providing Essential Support to National,
Economic and Homeland Security
Intra-Entity Eliminations
Consolidated Total
Securing America’s Borders Gross Costs $ 6,275,106 $ 39,603 -- $ 564,654 $ 5,750,055 Less: Earned Revenue 160,793 -- -- 58,754 102,039 Net Program Costs $ 6,114,313 $ 39,603 -- $ 505,900 $ 5,648,016 Securing and Expediting Trade Gross Costs $ 2,362,091 -- $753,083 $ 359,243 $ 2,755,931 Less: Earned Revenue 410,458 -- 137,947 502,539 45,866 Net Program Costs $ 1,951,633 -- $615,136 $(143,296) $ 2,710,065 Securing and Expediting Travel Gross Costs $ 2,623,917 $2,019,157 $ 151 $ 593,847 $ 4,049,378 Less: Earned Revenue 554,323 502,947 2 981,527 75,745 Net Program Costs $ 2,069,594 $1,516,210 $ 149 $(387,680) $ 3,973,633 Intelligence and Targeting Gross Costs $ 621,276 -- -- $ 34,942 $ 586,334 Less: Earned Revenue 16,205 -- -- 9,866 6,339 Net Program Costs $ 605,071 -- -- $ 25,076 $ 579,995 Net Cost of Operations $10,740,611 $1,555,813 $615,285 $ -- $12,911,709

112 U.S. Customs and Border Protection • 2014 Performance and Accountability Report
Customs and Border Protection Notes to Financial Statements
For the year ended September 30, 2013 (in thousands):
2013
Schedule of Net Cost by Program and Responsibility Segment
Fostering a Safe & Secure Homeland
Enforcing & Administering
Our Immigration Laws
Providing Essential Support to National,
Economic and Homeland Security
Intra-Entity Eliminations
Consolidated Total
Securing America’s Borders Gross Costs $ 5,138,348 $ 50,825 -- $ 47,049 $ 5,142,124 Less: Earned Revenue 62,630 - -- 53,379 9,251 Net Program Costs $ 5,075,718 $ 50,825 -- $ ( 6,330) $ 5,132,873 Securing and Expediting Trade Gross Costs $ 2,947,167 -- $ 947,345 $ 793,428 $ 3,101,084 Less: Earned Revenue 471,742 -- 148,699 482,828 137,613 Net Program Costs $ 2,475,425 -- $ 798,646 $ 310,600 $ 2,963,471 Securing and Expediting Travel Gross Costs $ 2,545,840 $ 1,912,060 $ 221 $ 484,927 $ 3,973,194 Less: Earned Revenue 541,463 433,872 1 884,674 90,662 Net Program Costs $ 2,004,377 $ 1,478,188 $ 220 $(399,747) $ 3,882,532 Intelligence and Targeting Gross Costs $ 682,215 -- -- $ 107,334 $ 574,881 Less: Earned Revenue 14,513 -- -- 11,857 2,656 Net Program Costs $ 667,702 -- -- $ 95,477 $ 572,225 Net Cost of Operations $10,223,222 $ 1,529,013 $ 798,866 $ -- $12,551,101
21. Non-exchange Revenues and Transfers In/Out Without Reimbursement
Non-exchange Revenue represents amounts collected from user fees that CBP may retain and expend as authorized by law, and is identified in Non-exchange Revenue and Other. Transfers In/Out Without Reimbursement are amounts of funds collected and transferred from CBP receipt accounts to expenditure accounts within CBP and to other Federal agencies.
Non-exchange Revenue reported under Budgetary Financing Sources includes Land Border Inspection Fees, Immigration Enforcement Fees, International Registered Traveler Program Fees, Electronic Systems for Travel Authorization Fees, Customs User Fees, and amounts from Abandoned and Seized Goods. These amounts are identified as Budgetary Financing Sources because CBP recognizes budget authority related to the collections. Non-exchange Revenue reported under Other Financing Sources as Other, includes Immigration User Fees, Small Airports User Fees, and Merchandise Processing Fees, which represent revenue reported in receipt accounts for which CBP does not have available budgetary authority. Also reported under Other Financing Sources as Other, is the accounts receivable related portion of Customs User Fees.

1132014 Performance and Accountability Report • U.S. Customs and Border Protection
Customs and Border Protection Notes to Financial Statements
22. Apportionment Categories of Obligations Incurred: Direct vs. Reimbursable Obligations Apportionment categories are determined in accordance with the guidance provided in OMB Circular A-11, Preparation, Submission and Execution of the Budget. Category A represents resources apportioned for calendar quarters. Category B represents resources apportioned for other time periods, activities, projects, objectives or any combination thereof (in thousands).
2014 Apportionment
Category A Apportionment
Category B Exempt from
Apportionment Total Obligations Incurred – Direct $10,333,519 $2,252,647 $1,399,172 $13,985,338 Obligations Incurred - Reimbursable (4,032) 1,712,533 -- 1,708,501 Total Obligations Incurred $10,329,487 $3,965,180 $1,399,172 $15,693,839
2013 Apportionment
Category A Apportionment
Category B Exempt from
Apportionment Total Obligations Incurred – Direct $9,648,928 $2,338,559 $1,300,623 $13,288,110 Obligations Incurred - Reimbursable (1,283) 1,575,677 -- 1,574,394 Total Obligations Incurred $9,647,645 $3,914,236 $1,300,623 $14,862,504
23. Appropriations
As of September 30, 2014 and 2013, the Combined Statements of Budgetary Resources consist of appropriations totaling $14.0 billion and $12.9 billion, respectively. This differs from the Consolidated Statements of Changes in Net Position as of September 30, 2014 and 2013, which consist of appropriations received totaling $8.3 billion and $8.2 billion, respectively. This difference is due to CBP’s non-entity activity, which as of September 30, 2014 and 2013 consists of $1.5 billion and $1.3 billion, respectively, for Refund and Drawback activity, $3.9 billion and $3.7 billion, respectively, for user/inspection fees and subsidy activity, that are not reported on the Consolidated Statements of Changes in Net Position, $51.5 million and $597.3 million, respectively, in rescissions, that are reported separately in Other Adjustments on the Consolidated Statements of Changes in Net Position, and $340.6 million and $382.9 million, respectively, in non-expenditure transfers, that are reported separately on the Consolidated Statements of Changes in Net Position. Permanent, indefinite appropriations refer to the appropriations that result from permanent public laws, which authorize CBP to retain certain receipts. The amount appropriated depends upon the amount of the receipts rather than on a specific amount. CBP has a permanent, indefinite appropriation, Refunds and Drawbacks, which is used to disburse tax and duty refunds and duty drawbacks. Although funded through an appropriation, refund and drawback activity is, in most instances, reported as a custodial activity. Refunds are custodial revenue-related activity in that refunds are a direct result of importer overpayments of duties, taxes and fees. Federal tax revenue received from taxpayers is not available for use in the operation of CBP and is not reported on the Consolidated Statements of Net Cost. Likewise, the refunds of overpayments are not available for use by CBP in its operations. This appropriation is not subject to budgetary ceilings established by Congress. Refunds and drawbacks payable at year-end are not subject to funding restrictions. Refund payment funding is recognized as appropriations are used.
24. Legal Arrangements Affecting the Use of Unobligated Balances
Unobligated balances, for which the period of availability has expired, are not available to fund new obligations. Expired unobligated balances are available to pay for current period adjustments to obligations incurred prior to expiration. For a fixed appropriation account, the balance can be carried forward for five fiscal years after the period of availability ends. For a no-year account, the unobligated balance is carried forward indefinitely until (1) specifically rescinded by law; or (2) the head of the agency concerned or the President determines that the purposes for
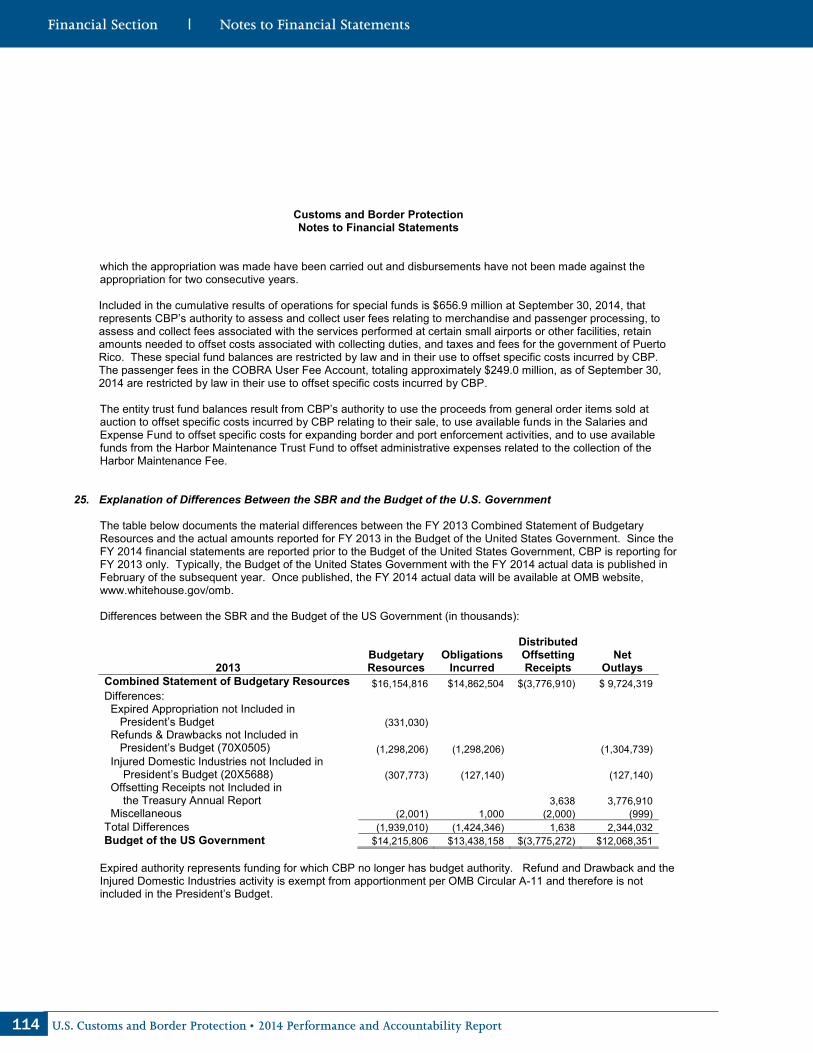
114 U.S. Customs and Border Protection • 2014 Performance and Accountability Report
Customs and Border Protection Notes to Financial Statements
which the appropriation was made have been carried out and disbursements have not been made against the appropriation for two consecutive years. Included in the cumulative results of operations for special funds is $656.9 million at September 30, 2014, that represents CBP’s authority to assess and collect user fees relating to merchandise and passenger processing, to assess and collect fees associated with the services performed at certain small airports or other facilities, retain amounts needed to offset costs associated with collecting duties, and taxes and fees for the government of Puerto Rico. These special fund balances are restricted by law and in their use to offset specific costs incurred by CBP. The passenger fees in the COBRA User Fee Account, totaling approximately $249.0 million, as of September 30, 2014 are restricted by law in their use to offset specific costs incurred by CBP. The entity trust fund balances result from CBP’s authority to use the proceeds from general order items sold at auction to offset specific costs incurred by CBP relating to their sale, to use available funds in the Salaries and Expense Fund to offset specific costs for expanding border and port enforcement activities, and to use available funds from the Harbor Maintenance Trust Fund to offset administrative expenses related to the collection of the Harbor Maintenance Fee.
25. Explanation of Differences Between the SBR and the Budget of the U.S. Government
The table below documents the material differences between the FY 2013 Combined Statement of Budgetary Resources and the actual amounts reported for FY 2013 in the Budget of the United States Government. Since the FY 2014 financial statements are reported prior to the Budget of the United States Government, CBP is reporting for FY 2013 only. Typically, the Budget of the United States Government with the FY 2014 actual data is published in February of the subsequent year. Once published, the FY 2014 actual data will be available at OMB website, www.whitehouse.gov/omb.
Differences between the SBR and the Budget of the US Government (in thousands):
2013 Budgetary Resources
Obligations Incurred
Distributed Offsetting Receipts
Net Outlays
Combined Statement of Budgetary Resources $16,154,816 $14,862,504 $(3,776,910) $ 9,724,319 Differences: Expired Appropriation not Included in President’s Budget (331,030) Refunds & Drawbacks not Included in President’s Budget (70X0505) (1,298,206) (1,298,206) (1,304,739) Injured Domestic Industries not Included in President’s Budget (20X5688) (307,773) (127,140) (127,140) Offsetting Receipts not Included in the Treasury Annual Report 3,638 3,776,910 Miscellaneous (2,001) 1,000 (2,000) (999) Total Differences (1,939,010) (1,424,346) 1,638 2,344,032 Budget of the US Government $14,215,806 $13,438,158 $(3,775,272) $12,068,351
Expired authority represents funding for which CBP no longer has budget authority. Refund and Drawback and the Injured Domestic Industries activity is exempt from apportionment per OMB Circular A-11 and therefore is not included in the President’s Budget.

1152014 Performance and Accountability Report • U.S. Customs and Border Protection
Customs and Border Protection Notes to Financial Statements
26. Undelivered Orders at the End of Period
An undelivered order exists when a valid obligation has occurred and funds have been reserved, but the goods or services have not been delivered and have not been prepaid. Undelivered orders for the period ended September 30, 2014 and 2013 (in thousands):
2014 2013 Unpaid $3,010,987 $2,954,472 Upward/Downward Adjustment of Prior Period (330,071) (364,759) Total Undelivered Orders at the End of Period $2,680,916 $2,589,713
27. Custodial Revenues
Custodial Revenue consists of duties, user fees, excise taxes, fines and penalties, refunds and drawbacks overpayments and interest associated with import/export activity that have been established as specifically identifiable, legally enforceable claims and remain uncollected as of year-end. These receivables are net of amounts deemed uncollectible, which were determined by considering the debtor’s payment record and willingness to pay, the probable recovery of amounts from secondary sources, such as sureties and an analysis of aged receivable activity. Primarily, revenue collections result from current fiscal year activity. Disbursements from the Refunds and Drawbacks Account for the fiscal years ended September 30, 2014 and 2013 (in thousands):
2014 2013 Refunds $ 586,009 $ 625,790 Drawbacks 949,683 873,121 Total $1,535,692 $1,498,911
Amounts refunded during FY 2014 and 2013 identified by entry year consist of the following (in thousands):
Entry Year 2014 2014 $ 925,874 2013 320,336 2012 100,585 2011 45,295 Prior Years 143,602 Total $1,535,692
Entry Year 2013 2013 $ 824,708 2012 288,515 2011 95,876 2010 33,975 Prior Years 255,837 Total $1,498,911
The total amount of antidumping and countervailing duties varies from year to year, depending on decisions from the Department of Commerce. Antidumping and countervailing duty refunds (included in total refunds presented above) and associated interest refunded for the fiscal years ended September 30, 2014 and 2013, consisted of the following (in thousands):
2014 2013 Antidumping and Countervailing Duty Refunds $170,131 $92,976 Interest 6,251 4,551 Total $176,382 $97,527

116 U.S. Customs and Border Protection • 2014 Performance and Accountability Report
Customs and Border Protection Notes to Financial Statements
28. Reconciliation of Net Cost of Operations to Budget
The following table presents CBP’s reconciliation of net cost of operations to budgetary accounts for the years ended September 30, 2014 and 2013 (in thousands).
2014 2013 Resources Used to Finance Activities: Budgetary Resources Obligated Obligations Incurred $15,693,839 $14,862,504 Less: Spending Authority from Offsetting Collections and Recoveries 2,098,232 1,986,889
Obligations Net of Offsetting Collections and Recoveries $13,595,607 $12,875,615 Less: Offsetting Receipts 3,919,289 3,776,910 Net Obligations $ 9,676,318 $ 9,098,705
Other Resources Transfers In/Out Without Reimbursement 42,156 36,425
Imputed Financing from Costs Absorbed by Others 685,831 598,159 Other (Note 21) 3,038,754 3,210,294
Net Other Resources Used to Finance Activities $ 3,766,741 $ 3,844,878 Total Resources Used to Finance Activities $13,443,059 $12,943,583
Resources Used to Finance Items Not Part of the Net Cost of Operations
Change in Budgetary Resources Obligated for Goods, Services and Benefits Ordered, but not yet Provided $ 236,381 $ (429,869) Resources that Fund Expenses Recognized in Prior Periods -- 439
Budgetary Offsetting Collections and Receipts that do not Affect Net Cost of Operations (849,554) (515,626) Resources that Finance the Acquisition of Assets or Liquidation of Liabilities 425,205 609,154
Tax Revenue Refunds and Other Resources or Adjustments to Net Obligated Resources that do not Affect Net Cost of Operations 1,494,076 1,431,626 Total Resources Used to Finance Items Not Part of the Net Cost of Operations $ 1,306,108 $ 1,095,724
Total Resources Used to Finance the Net Cost of Operations $12,136,951 $11,847,859
Components of the Net Cost of Operations that will not Require or Generate Resources in the Current Period: Components Requiring or Generating Resources in Future Periods
Increase in Annual Leave Liability and Environmental Liability
$ 31,548 $ 9,700
Change in Actuarial FECA Liability, Legal Contingent Liabilities and Other 32,490 141,633 Total Components of Net Cost of Operations that will Require or Generate Resources in Future Periods
$ 64,038
$ 151,333
Components Not Requiring or Generating Resources Depreciation and Amortization $ 630,985 $ 676,571
Revaluation of Assets or Liabilities (5,924) (20,552) Other Non-budgetary Resources 85,659 (104,110) Total Components of Net Cost of Operations that will Not Require
or Generate Resources Resources
$ 710,720 $ 551,909 Total Components of Net Cost of Operations that will Not Require or Generate Resources in the Current Period $ 774,758 $ 703,242
Net Cost of Operations $12,911,709 $12,551,101
Notes to Financial Statements

1172014 Performance and Accountability Report • U.S. Customs and Border Protection
Required Supplementary Information
Customs and Border Protection Required Supplementary Information
(Unaudited) Deferred Maintenance and Repairs
Deferred maintenance and repairs are maintenance and repairs that were not performed when they should have been or were scheduled to be performed, and were delayed until a future period. Maintenance and repairs include preventive maintenance, normal repairs, replacement of parts and structural components, and other activities needed to preserve the asset so that it will continue to provide acceptable service and achieve its useful life. An assessment of “fair” means the facility/equipment condition meets minimum standards but requires additional maintenance or repair to prevent further deterioration, increase operating efficiency and to achieve normal life expectancy. An assessment of “good” means the facility/equipment condition is above minimum standards, but requires preventive maintenance or normal repairs to maintain the design intent of the building or equipment so that it continues to provide acceptable service and achieves the expected useful life. An assessment of “poor” means the facility/equipment does not meet most maintenance standards and requires frequent repairs to prevent accelerated deterioration and to provide a minimal level of operating function. In some cases, this includes condemned or failed facilities. Deferred maintenance on property, plant and equipment as measured by condition assessment survey, is comprised of (in thousands):
2014
Condition
Assessment
Deferred Maintenance and Repairs
Building and Structures Poor to Good $119,300 Vehicles Good -- Equipment Good -- Multi-Use Heritage Assets Poor to Good 31,250 Collections (documents and artifacts) Poor to Good -- Total $150,550
2013 Condition
Assessment
Deferred Maintenance and Repairs
Building and Structures Poor to Good $181,484 Vehicles Good -- Equipment Good -- Multi-Use Heritage Assets Poor to Good 987 Collections (documents and artifacts) Poor to Good -- Total $182,471
Required Supplementary Information

118 U.S. Customs and Border Protection • 2014 Performance and Accountability Report
Customs and Border Protection Required Supplementary Information
(Unaudited) Statement of Budgetary Resources (SBR) The total Budgetary Resources of $17.3 billion for FY 2014 includes new budget authority, unobligated balances at the beginning of the year and transferred in/out, spending authority from offsetting collections, recoveries of prior year obligations and adjustments.
Schedule of Budgetary Resources by Major Budget Accounts (in thousands):
2014
As of September 30, 2014 (in thousands): Salaries & Expense Air & Marine BSFIT Construction Automation Other Total
Budgetary Resources Unobligated balance brought forward, October 1 $ 245,596 $ 72,667 $420,691 $ 77,831 $ 84,115 $ 391,412 $ 1,292,312 Recoveries of prior year unpaid obligations 116,152 48,814 91,020 34,519 47,628 5,916 344,049 Other changes in unobligated balance (118,618) -- (1,811) -- 5,428 -- (115,001) Unobligated balance from prior year budget authority, net 243,130 121,481 509,900 112,350 137,171 397,328 1,521,360 Appropriations 8,449,512 805,032 283,956 472,778 854,781 3,112,130 13,978,189 Spending authority from offsetting collections 1,695,632 14,536 3 -- 28,647 15,365 1,754,183 Total Budgetary Resources $10,388,274 $941,049 $793,859 $585,128 $1,020,599 $3,524,823 $17,253,732 Status of Budgetary Resources Obligations incurred (Note 23) $10,016,042 $819,955 $437,097 $476,991 $ 882,587 $3,061,167 $15,693,839 Unobligated balance, end of year: Apportioned 212,021 114,807 334,544 49,523 120,087 186,450 1,017,432 Unapportioned 160,211 6,287 22,218 58,614 17,925 277,206 542,461 Total unobligated balance, end of year 372,232 121,094 356,762 108,137 138,012 463,656 1,559,893 Total Budgetary Resources $10,388,274 $941,049 $793,859 $585,128 $1,020,599 $3,524,823 $17,253,732

1192014 Performance and Accountability Report • U.S. Customs and Border Protection
Customs and Border Protection Required Supplementary Information
(Unaudited)
2014
Salaries & Expense Air & Marine BSFIT Construction Automation Other Total
Change in Obligated Balance: Unpaid Obligations: Unpaid obligations brought forward, October 1 (gross) $ 1,178,792 $ 559,463 $ 512,721 $ 519,001 $ 342,214 $ 408,814 $ 3,521,005 Obligations incurred (Note 23) 10,016,042 819,955 437,097 476,991 882,587 3,061,167 15,693,839 Outlay (gross) (9,834,822) (817,857) (343,641) (455,699) (755,739) (3,011,627) (15,219,385) Recoveries of prior year unpaid obligations (116,152) (48,814) (91,020) (34,519) (47,628) (5,916) (344,049) Unpaid obligations, end of year (gross) $ 1,243,860 $ 512,747 $ 515,157 $ 505,774 $ 421,434 $ 452,438 $ 3,651,410 Uncollected Payments: Uncollected customer payments from Federal sources brought forward from October 1 (150,083) (591) -- -- -- (1,085) (151,759) Change in uncollected customer payments from federal sources 25,612 (3,076) -- -- (16,218) (765) 5,553 Uncollected customer payments from federal sources, end of year (124,471) (3,667) -- -- (16,218) (1,850) (146,206) Obligated Balance, Start of Year $ 1,028,709 $ 558,872 $ 512,721 $ 519,001 $ 342,214 $ 407,729 $ 3,369,246 Obligated Balance, End of Year $ 1,119,389 $ 509,080 $ 515,157 $ 505,774 $ 405,216 $ 450,588 $ 3,505,204 Budget Authority and Outlays, Net: Budget authority, gross 10,145,144 819,568 283,959 472,778 883,428 3,127,495 15,732,372 Actual offsetting collections (1,721,244) (11,460) (3) -- (12,429) (14,600) (1,759,736) Change in uncollected customer payment from Federal sources 25,612 (3,076) -- -- (16,218) (765) 5,553 Budget Authority, Net $ 8,449,512 $ 805,032 $ 283,956 $ 472,778 $ 854,781 $ 3,112,130 $ 13,978,189 Outlays, gross $ 9,834,822 $ 817,857 $ 343,641 $ 455,699 $ 755,739 $ 3,011,627 $ 15,219,385 Actual offsetting collections (1,721,244) (11,460) (3) -- (12,429) (14,600) (1,759,736) Outlays, net 8,113,578 806,397 343,638 455,699 743,310 2,997,027 13,459,649 Distributed offsetting receipts -- -- -- -- -- (3,919,289) (3,919,289) Agency Outlays, Net $ 8,113,578 $ 806,397 $ 343,638 $ 455,699 $ 743,310 $ (922,262) $ 9,540,360

120 U.S. Customs and Border Protection • 2014 Performance and Accountability Report
Customs and Border Protection Required Supplementary Information
(Unaudited)
Schedule of Budgetary Resources by Major Budget Accounts:
2013
As of September 30, 2013 (in thousands): Salaries & Expense Air & Marine BSFIT Construction Automation Other Total
Budgetary Resources Unobligated balance brought forward, October 1 $ 268,273 $ 69,777 $407,160 $ 41,502 $ 99,244 $ 424,908 $ 1,310,864 Recoveries of prior year unpaid obligations 137,200 68,493 90,289 60,366 27,051 5,922 389,321 Other changes in unobligated balance (92,421) (1,375) (9,031) -- 6,880 -- (95,947) Unobligated balance from prior year budget authority, net 313,052 136,895 488,418 101,868 133,175 430,830 1,604,238 Appropriations 8,234,379 758,262 234,256 209,527 722,847 2,793,739 12,953,010 Spending authority from offsetting collections 1,569,333 2,734 50 -- -- 25,451 1,597,568 Total Budgetary Resources $10,116,764 $897,891 $722,724 $311,395 $856,022 $3,250,020 $16,154,816
Status of Budgetary Resources Obligations incurred (Note 23) $ 9,871,168 $825,224 $302,033 $233,564 $771,907 $2,858,608 $14,862,504 Unobligated balance, end of year: Apportioned 26,360 66,842 402,412 30,065 75,084 117,111 717,874 Unapportioned 219,236 5,825 18,279 47,766 9,031 274,301 574,438 Total unobligated balance, end of year 245,596 72,667 420,691 77,831 84,115 391,412 1,292,312 Total Budgetary Resources $10,116,764 $897,891 $722,724 $311,395 $856,022 $3,250,020 $16,154,816

1212014 Performance and Accountability Report • U.S. Customs and Border Protection
Customs and Border Protection Required Supplementary Information
(Unaudited)
2013
Salaries & Expense Air & Marine BSFIT Construction Automation Other Total
Change in Obligated Balances Unpaid Obligations: Unpaid obligations brought forward, October 1 (gross) $ 1,761,724
$ 604,631 $ 644,865 $ 694,687 $ 177,004 $ 274,569 $ 4,157,480
Obligations incurred (Note 23) 9,871,168 825,224 302,033 233,564 771,907 2,858,608 14,862,504 Outlay (gross) (10,316,900) (801,900) (343,888) (348,883) (579,645) (2,718,442) (15,109,658) Recoveries of prior year unpaid obligations (137,200) (68,493) (90,289) (60,366) (27,051) (5,922) (389,321) Unpaid obligations, end of year (gross) 1,178,792 559,462 512,721 519,002 342,215 408,813 3,521,005 Uncollected Payments: Uncollected customer payments from Federal sources brought forward from October 1 (161,057) (363) (167) -- -- (1,033) (162,620) Change in uncollected customer payments from federal sources 10,974 (228) 167 -- -- (52) 10,861 Uncollected customer payments from federal sources, end of year (150,083) (591) -- -- -- (1,085) (151,759) Obligated Balance, Start of Year $ 1,600,667 $ 604,268 $ 644,698 $ 694,687 $ 177,004 $ 273,536 $ 3,994,860 Obligated Balance, End of Year $ 1,028,709 $ 558,871 $ 512,721 $ 519,002 $ 342,215 $ 407,728 $ 3,369,246 Budget Authority and Outlays, Net: Budget authority, gross $ 9,803,712 $ 760,996 $ 234,306 $ 209,527 $ 722,847 $ 2,819,190 $ 14,550,578 Actual offsetting collections (1,580,307) (2,506) (217) -- -- (25,399) (1,608,429) Change in uncollected customer payment from Federal sources 10,974 (228) 167 -- -- (52) 10,861 Budget Authority, Net $ 8,234,379 $ 758,262 $ 234,256 $ 209,527 $ 722,847 $ 2,793,739 $ 12,953,010 Outlays, gross $ 10,316,900 $ 801,900 $ 343,888 $ 348,883 $ 579,645 $ 2,718,442 $ 15,109,658 Actual offsetting collections (1,580,307) (2,506) (217) -- -- (25,399) (1,608,429) Outlays, net 8,736,593 799,394 343,671 348,883 579,645 2,693,043 13,501,229 Distributed offsetting receipts -- -- -- -- -- (3,776,910) (3,776,910) Agency Outlays, Net $ 8,736,593 $ 799,394 $ 343,671 $ 348,883 $ 579,645 $(1,083,867) $ 9,724,319

122 U.S. Customs and Border Protection • 2014 Performance and Accountability Report
Customs and Border Protection Required Supplementary Information
(Unaudited)
Custodial Activity Substantially all duty, tax and fee revenues collected by CBP are remitted to various General Fund accounts maintained by Treasury and the U.S Department of Agriculture. Treasury further distributes these revenues to other Federal agencies in accordance with various laws and regulations. CBP transfers the remaining revenue (less than one percent of revenues collected) directly to other Federal agencies, the Governments of Puerto Rico and the U.S. Virgin Islands. Refunds of revenues collected from import/export activities are recorded in separate accounts established for this purpose and are funded through permanent, indefinite appropriations. These activities reflect the non-entity, or custodial, responsibilities that CBP, as an agency of the Federal government, has been authorized by law to enforce. CBP reviews selected documents to ensure all duties, taxes and fees owed to the Federal government are paid and to ensure regulations are followed. If CBP determines that duties, taxes, fees, fines or penalties are due in addition to estimated amounts previously paid by the importer/violator, the importer/violator is notified of the additional amount due. CBP regulations allow the importer/violator to file a protest on the additional amount due for review by the Port Director. A protest allows the importer/violator the opportunity to submit additional documentation supporting their claim of a lower amount due or to cancel the additional amount due in its entirety. During the protest period, CBP does not have a legal right to importer/violator’s assets, and consequently CBP recognizes accounts receivable only when the protest period has expired or an agreement is reached. For FY 2014 and 2013, CBP had the legal right to collect $3.1 billion and $2.7 billion of receivables, respectively. In addition, there were $2.8 billion and $2.3 billion representing records still in the protest phase for FY 2014 and 2013, respectively. CBP recognized as write-offs $47.4 million and $288 million of assessments that the Department has statutory authority to collect at September 30, 2014 and 2013, respectively, but has no future collection potential. Most of this amount represents trade receivables.
Auditors’ Report
The independent audit of CBP’s consolidated financial statements was conducted by KPMG LLP, and follows in its entirety.

1232014 Performance and Accountability Report • U.S. Customs and Border Protection
Independent Auditors' Report on U.S. Customs and Border Protection's FY 2014 Financial Statements
April 21, 2015 OIG-15-76
Auditor’s Report

124 U.S. Customs and Border Protection • 2014 Performance and Accountability Report
HIGHLIGHTS Independent Auditors' Report on
U.S. Customs and Border Protection’s FY 2014 Financial Statements
April 21, 2015
Why We Did This The Federal Government has a fundamental responsibility to be an effective steward of taxpayers’ dollars. Sound financial practices and related management operations, reliable financial systems, and effective internal control are essential for reliable, timely financial information that supports management decision- making needed to achieve Customs and Border Protection’s (CBP) mission.
What We Recommend KPMG LLP made 18 recommendations to help improve internal control over financial reporting and increase the reliability of financial systems and operations. These recommendations address the four significant deficiencies identified in the report.
For Further Information: Contact our Office of Public Affairs at (202) 254-4100, or email us at [email protected]
What We Found The independent public accounting firm, KPMG LLP, has issued an unmodified (clean) opinion on CBP’s fiscal year 2014 consolidated financial statements. In the independent auditors’ opinion, the financial statements present fairly, in all material respects, the financial position of CBP as of September 30, 2014.
The report identifies four significant deficiencies in internal control, one of which KPMG LLP considers to be a material weakness in the area of drawback duties, taxes, and fees. The other three significant deficiencies in internal control were identified in the areas of property, plant, and equipment; entry process (including the in-bond program, bonded warehouse and foreign trade zones, entry reports, bond sufficiency, and classification of custodial liabilities); and information technology.
CBP’s Response CBP concurred with the one material weakness and the three significant deficiencies identified in the report and indicated that management will continue to work to resolve all identified weaknesses.
www.oig.dhs.gov OIG-15-76
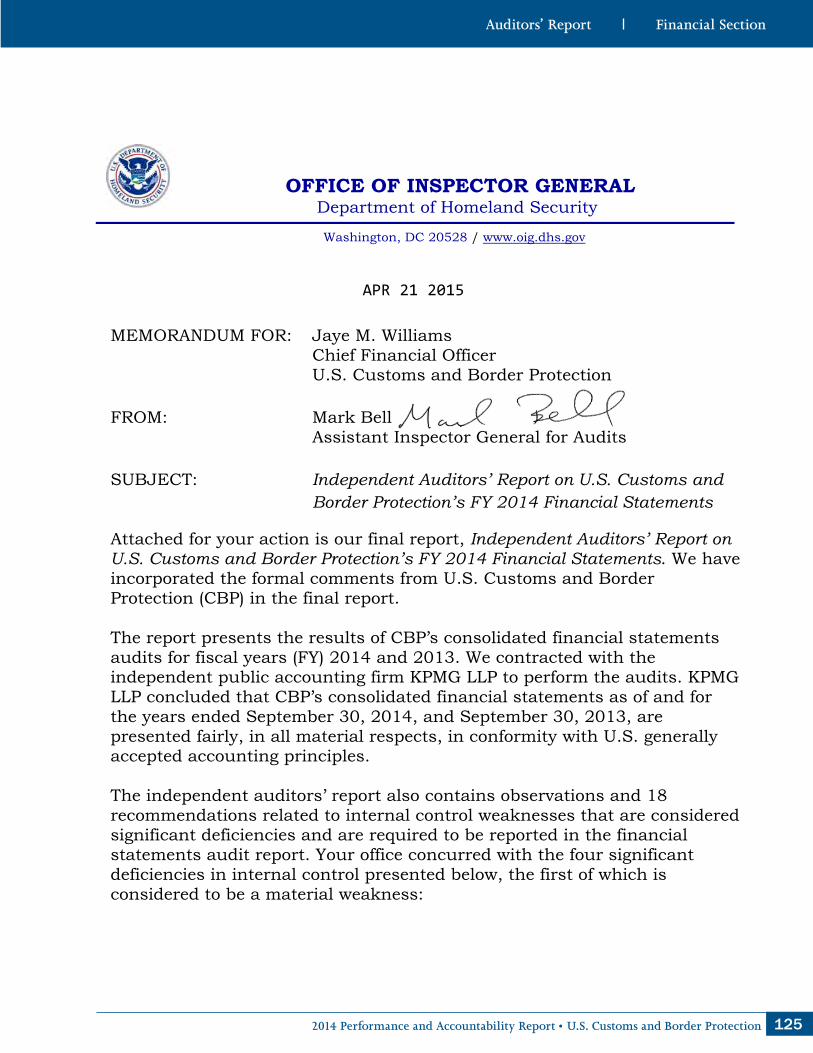
1252014 Performance and Accountability Report • U.S. Customs and Border Protection
OFFICE OF INSPECTOR GENERAL Department of Homeland Security
Washington, DC 20528 / www.oig.dhs.gov
APR 21 2015
MEMORANDUM FOR: Jaye M. Williams Chief Financial Officer U.S. Customs and Border Protection
FROM: Mark Bell Assistant Inspector General for Audits
SUBJECT: Independent Auditors’ Report on U.S. Customs and Border Protection’s FY 2014 Financial Statements
Attached for your action is our final report, Independent Auditors’ Report on U.S. Customs and Border Protection’s FY 2014 Financial Statements. We have incorporated the formal comments from U.S. Customs and Border Protection (CBP) in the final report.
The report presents the results of CBP’s consolidated financial statements audits for fiscal years (FY) 2014 and 2013. We contracted with the independent public accounting firm KPMG LLP to perform the audits. KPMG LLP concluded that CBP’s consolidated financial statements as of and for the years ended September 30, 2014, and September 30, 2013, are presented fairly, in all material respects, in conformity with U.S. generally accepted accounting principles.
The independent auditors’ report also contains observations and 18 recommendations related to internal control weaknesses that are considered significant deficiencies and are required to be reported in the financial statements audit report. Your office concurred with the four significant deficiencies in internal control presented below, the first of which is considered to be a material weakness:

126 U.S. Customs and Border Protection • 2014 Performance and Accountability Report
OFFICE OF INSPECTOR GENERAL Department of Homeland Security
Significant Deficiencies in Internal Control
A. Drawback of Duties, Taxes, and Fees B. Property, Plant, and Equipment C. Entry Process
1. In-Bond Program 2. Bonded Warehouse and Foreign Trade Zones 3. Entry Reports 4. Bond Sufficiency 5. Classification of Custodial Liabilities
D. Information Technology
KPMG LLP (KPMG) is responsible for the attached independent auditors’ report dated April 1, 2015, and the conclusions expressed in the report. To ensure the quality of the audit work performed, we evaluated KPMG’s qualifications and independence, reviewed the approach and planning of the audit, monitored the progress of the audit at key points, reviewed and accepted KPMG’s audit report, and performed other procedures that we deemed necessary. Additionally, we provided oversight of the audit of financial statements and certain accounts and activities conducted at CBP. Our review disclosed no instances where KPMG did not comply, in all material respects, with generally accepted governments auditing standards.
Consistent with our responsibility under the Inspector General Act, we will provide copies of our report to congressional committees with oversight and appropriation responsibility over the Department of Homeland Security. We will post the report on our website for public dissemination.
Please call me with any questions, or your staff may contact Paul Wood, Acting Deputy Assistant Inspector General for Audits, at (202) 254-4100.
Attachment
www.oig.dhs.gov OIG-15-76

1272014 Performance and Accountability Report • U.S. Customs and Border Protection
OFFICE OF INSPECTOR GENERAL Department of Homeland Security
Table of Contents
Independent Auditors’ Report ......................................................................... 1
Exhibit I – Material Weakness....................................................................... I.1
Exhibit II – Significant Deficiencies.............................................................. II.1
Exhibit III – Index of Financial Reporting and Internal Control Criteria...... III.1
Appendixes
Appendix A: Management Comments to the Report..................................... 2
Appendix B: Report Distribution.................................................................. 3
www.oig.dhs.gov OIG-15-76

128 U.S. Customs and Border Protection • 2014 Performance and Accountability Report
KPMG LLPSuite 120001801 K Street, NW Washington, DC 20006
KPMG LLP is a Delaware limited liability partnership,the U.S. member firm of KPMG International Cooperative(“KPMG International”), a Swiss entity.
Independent Auditors’ Report
Inspector General U.S. Department of Homeland Security:
Commissioner U.S. Customs and Border Protection:
Report on the Financial Statements
We have audited the accompanying consolidated financial statements of the U.S. Customs and Border Protection (CBP), which comprise the consolidated balance sheets as of September 30, 2014 and 2013, and the related consolidated statements of net cost, changes in net position, and custodial activity, and combined statements of budgetary resources for the years then ended, and the related notes to the consolidated financial statements.
Management’s Responsibility for the Financial Statements
Management is responsible for the preparation and fair presentation of these consolidated financial statements in accordance with U.S. generally accepted accounting principles; this includes the design, implementation, and maintenance of internal control relevant to the preparation and fair presentation of consolidated financial statements that are free from material misstatement, whether due to fraud or error.
Auditors’ Responsibility
Our responsibility is to express an opinion on these consolidated financial statements based on our audits. We conducted our audits in accordance with auditing standards generally accepted in the United States of America; the standards applicable to financial audits contained in Government Auditing Standards issued by the Comptroller General of the United States; and Office of Management and Budget (OMB) Bulletin No. 14-02, Audit Requirements for Federal Financial Statements. Those standards and OMB Bulletin No. 14-02 require that we plan and perform the audit to obtain reasonable assurance about whether the consolidated financial statements are free from material misstatement.
An audit involves performing procedures to obtain audit evidence about the amounts and disclosures in the consolidated financial statements. The procedures selected depend on the auditors’ judgment, including the assessment of the risks of material misstatement of the consolidated financial statements, whether due to fraud or error. In making those risk assessments, the auditor considers internal control relevant to the entity’spreparation and fair presentation of the consolidated financial statements in order to design audit procedures that are appropriate in the circumstances, but not for the purpose of expressing an opinion on the effectiveness of the entity’s internal control. Accordingly, we express no such opinion. An audit also includes evaluating the appropriateness of accounting policies used and the reasonableness of significant accounting estimates made by management, as well as evaluating the overall presentation of the consolidated financial statements.
We believe that the audit evidence we have obtained is sufficient and appropriate to provide a basis for our audit opinion.

1292014 Performance and Accountability Report • U.S. Customs and Border Protection
Opinion on the Financial Statements
In our opinion, the consolidated financial statements referred to above present fairly, in all material respects, the financial position of CBP as of September 30, 2014 and 2013, and its net costs, changes in net position, budgetary resources, and custodial activity for the years then ended in accordance with U.S. generally accepted accounting principles.
Other Matters
Required Supplementary Information
U.S. generally accepted accounting principles require that the information in the Management’s Discussion and Analysis and Required Supplementary Information sections be presented to supplement the basic consolidated financial statements. Such information, although not a part of the basic consolidated financial statements, is required by the Federal Accounting Standards Advisory Board who considers it to be an essential part of financial reporting for placing the basic consolidated financial statements in an appropriate operational, economic, or historical context. We have applied certain limited procedures to the required supplementary information in accordance with auditing standards generally accepted in the United States of America, which consisted of inquiries of management about the methods of preparing the information and comparing the information for consistency with management’s responses to our inquiries, the basic consolidated financial statements, and other knowledge we obtained during our audits of the basic consolidated financial statements. We do not express an opinion or provide any assurance on the information because the limited procedures do not provide us with sufficient evidence to express an opinion or provide any assurance.
Other Information
Our audits were conducted for the purpose of forming an opinion on the basic consolidated financial statements as a whole. The Commissioner’s Message, Performance Section, Message from the Chief Financial Officer, Other Information, and Acronyms as reflected in CBP’s Fiscal Year 2014 Performance and Accountability Report are presented for purposes of additional analysis and are not a required part of the basic consolidated financial statements. Such information has not been subjected to the auditing procedures applied in the audit of the basic consolidated financial statements, and accordingly, we do not express an opinion or provide any assurance on it.
Other Reporting Required by Government Auditing Standards
Internal Control Over Financial Reporting
In planning and performing our audit of the consolidated financial statements as of and for the year ended September 30, 2014, we considered CBP’s internal control over financial reporting (internal control) to determine the audit procedures that are appropriate in the circumstances for the purpose of expressing our opinion on the consolidated financial statements, but not for the purpose of expressing an opinion on the effectiveness of CBP’s internal control. Accordingly, we do not express an opinion on the effectiveness of CBP’s internal control. We did not test all internal controls relevant to operating objectives as broadly defined by the Federal Managers’ Financial Integrity Act of 1982.
Our consideration of internal control was for the limited purpose described in the preceding paragraph and was not designed to identify all deficiencies in internal control that might be material weaknesses or significant deficiencies and therefore, material weaknesses or significant deficiencies may exist that have not been identified. However, as described in the accompanying exhibits we identified certain deficiencies in internal control that we consider to be a material weakness and significant deficiencies.

130 U.S. Customs and Border Protection • 2014 Performance and Accountability Report
A deficiency in internal control exists when the design or operation of a control does not allow management or employees, in the normal course of performing their assigned functions, to prevent, or detect and correct, misstatements on a timely basis. A material weakness is a deficiency, or a combination of deficiencies, in internal control such that there is a reasonable possibility that a material misstatement of the entity’s financial statements will not be prevented, or detected and corrected, on a timely basis. We consider the deficiencies described in Exhibit I to be a material weakness.
A. Drawback of Duties, Taxes, and Fees
A significant deficiency is a deficiency, or a combination of deficiencies, in internal control that is less severe than a material weakness, yet important enough to merit attention by those charged with governance. We consider the deficiencies described in Exhibit II to be significant deficiencies.
B. Property, Plant, and Equipment C. Entry Process D. Information Technology
Compliance and Other Matters
As part of obtaining reasonable assurance about whether CBP’s consolidated financial statements are free from material misstatement, we performed tests of its compliance with certain provisions of laws, regulations, and contracts, noncompliance with which could have a direct and material effect on the determination of financial statement amounts, and certain provisions of other laws and regulations specified in OMB Bulletin No. 14-02. However, providing an opinion on compliance with those provisions was not an objective of our audit, and accordingly, we do not express such an opinion. The results of our tests of compliance disclosed no instances of noncompliance or other matters that are required to be reported herein under Government Auditing Standards or OMB Bulletin No. 14-02.
CBP’s Responses to Findings
CBP’s responses to the findings identified in our audit are described in Management’s Response to the Independent Auditors’ Report. CBP’s responses were not subjected to the auditing procedures applied in the audit of the consolidated financial statements and, accordingly, we express no opinion on the responses.
Purpose of the Other Reporting Required by Government Auditing Standards
The purpose of the communication described in the Other Reporting Required by Government Auditing Standards section is solely to describe the scope of our testing of internal control and compliance and the result of that testing, and not to provide an opinion on the effectiveness of CBP’s internal control or compliance. Accordingly, this communication is not suitable for any other purpose.
Washington, D.C. April 1, 2015
1312014 Performance and Accountability Report • U.S. Customs and Border Protection
EXHIBIT I
Material Weakness
A. Drawback of Duties, Taxes, and Fees
Background:
U.S. Customs and Border Protection (CBP) performs an important revenue collection function for the U.S. Department of the Treasury. In fiscal year (FY) 2014, CBP collected approximately $39.0 billion in import duties, taxes, and fees on merchandise arriving in the U.S. from foreign countries. Receipts of import duties and related refunds are presented in the statement of custodial activity in CBP’s consolidated financial statements.
Refunds occur when a claimant has paid duties, taxes, fees, and interest in excess of the amount due. As a result, a refund check is issued. CBP issues a variety of types of refunds, including baggage declaration refunds, refunds of cash deposits in lieu of surety, mail refunds, and administrative refunds of formal entry collections. One week prior to the processing of a refund for payment, the refund appears on the B41, Preliminary Check Proof Listing Report. A separate individual from the reviewer of the refund request reviews and verifies the B41, Preliminary Check Proof Listing Report to verify that the refund payment is properly supported.
Drawback, which is a particular type of refund, is the remittance, in whole or in part, of duties, taxes, or fees previously paid by an importer. Drawback typically occurs when the imported goods, on which duties, taxes, or fees have been previously paid, are subsequently exported from the United States or destroyed prior to entering the commerce of the United States. Depending on the type of drawback claim, the claimant has up to eight years from the date of importation to file for drawback. The responsibility for maintaining documentation to support drawback claims remains with the brokers and claimants.
CBP offers accelerated payment privileges to qualifying claimants, and in turn the claimants are required to maintain 100 percent bond coverage through either a continuous or single transaction bond. In years past, CBP’s system has been incapable of properly accounting for bond sufficiency of claims that involve a continuous bond. Therefore, the Drawback Specialists responsible for reviewing the accelerated payment claims are required to verify that sufficient bond coverage remains on the bond in order to accelerate the claim.
The conditions cited below have existed for several years; however, CBP’s planned remediation for these conditions is dependent upon funding for IT systems modernization and new system implementation. In FY 2014, CBP continued its efforts to review and reassess the drawback process as a whole.
Conditions:
We identified the following weaknesses in internal control over refund and drawback of duties, taxes, and fees paid by the importer:
• CBP lacks effective controls to prevent, or detect and correct excessive drawback claims. Currently, the drawback module provides information to ensure that the total amount of all drawback claims against a given import entry does not exceed 100 percent of the total amount of duties, taxes, and fees collected, at the entry summary level. However, the amount paid for drawback claims against a given import entry should not exceed 99 percent of the duties, taxes, and fees collected at the individual line item level and the entry summary level. In addition, export information is not linked to the drawback module and therefore, electronic comparisons of export data cannot be performed.
• The drawback system does not allow for an automated review of all prior drawback claims against a selected import entry to determine whether an excessive amount has been claimed against the underlying consumption entry sheets. A manual review of all prior claims against a selected import entry is not feasible. Therefore, CBP utilizes a validity control review process to select and trace the
I. 1

132 U.S. Customs and Border Protection • 2014 Performance and Accountability Report
EXHIBIT I
highest dollar invoice item on the highest dollar consumption entry sheet for claims over $50,000.However, this approach is not statistical. In addition, drawback review policy and procedures allow the Drawback Specialist, with supervisor approval, to judgmentally decrease the number of consumption entry sheets reviewed for certain claims. This methodology is also not statistical and CBP’s Drawback Handbook does not include procedures for statistically projecting errors across the population.
• The length of document retention of a drawback claim, per the Code of Federal Regulations, is three years from the date of payment. However, there are several situations that could extend the life of the drawback claim beyond three years from the date of payment.
• The system does not properly account for bond sufficiency of claims that involve a continuous bond. Specifically, the automated control that prevents a claimant from exceeding the bond amount on file does not operate effectively. The control is designed to accumulate all open accelerated payments against a continuous bond to ensure that the bond is sufficient. However, the system does not always track open accelerated payments against continuous bonds. Additionally, manual procedures are not in place to ensure the sufficiency of continuous bonds. In FY 2012, CBP began developing a script that indicates the bond number, claimants listed on the bond, anniversary date of the bond, bond value, and a list of all drawback payments applied against the bond. However, the script has not been fully tested and developed to allow for it to be implemented and released into production within the system.
• CBP did not maintain sufficient documentation to evidence review of the B41, Preliminary Check Proof Listing Report. For example, at one port only the first page was retained. Therefore, it was impossible to verify the refund amount to the B41 report. At another port, the first page was not retained, therefore proper review of the B41 report could not be determined.
Cause/Effect:
The current drawback system does not provide the necessary functionality to prevent overpayment of drawback claims. CBP plans to replace the current drawback system with a new system in FY 2015.However, CBP does not currently have sufficient resources to effectively perform compensating manual controls over drawback claims until such implementation of the new automated system occurs.
There is a high inherent risk of fraudulent claims or claims made in error, which increases the risk for erroneous payments. Since all, or a statistically valid sample, of drawback claims are not reviewed against aselected import entry, the possibility exists that the related drawback claims, in aggregate, could exceed the amount of duty and tax collected on the underlying consumption entry sheet at the individual line item level. Thus, an import entry could be over-claimed by submitting multiple claims for the same item and the error would not be detected.
The length of the drawback claim lifecycle often extends beyond the statutorily mandated document retention period, which can only be changed by Congressional legislation. Therefore, CBP management may not be able to obtain sufficient, competent evidence to determine whether the recorded drawback claims exist and are complete and accurate.
Since the current drawback system is scheduled for replacement, CBP has not allocated funding to complete development of the bond script within the current system. The use of manual control procedures to track bonds is not an efficient and effective means of ensuring the sufficiency of continuous bonds. Therefore, if a claimant claims an incorrect amount of drawback via accelerated payment and the claimant is paid without sufficient bond coverage on file, CBP may not be able to recollect the overpayment from the surety, as the bond will be insufficient.
I. 2
1332014 Performance and Accountability Report • U.S. Customs and Border Protection
EXHIBIT I
CBP did not consistently adhere to policies and procedures over the review of the B41, Preliminary Check Proof Listing Report. Failure to consistently adhere to the policies and procedures for reviewing the report may result in CBP not identifying inaccurate or unsupported refunds, resulting in the potential misstatement of the Taxes, Duties, and Trade Receivables, Net balance.
Criteria:
Presented in Index of Financial Reporting and Internal Control Criteria, Exhibit III.
Recommendations:
We recommend that CBP:
1. Continue with the implementation of drawback functionality in the new system as scheduled.
2. Dedicate sufficient resources to effectively perform compensating manual controls over drawback claims, including implementation of a statistical method for identifying potential revenue loss until CBP systems can be updated to implement an automated solution.
3. Continue to pursue Congressional action in order to have the statutory requirement set by Congress changed.
4. Include requirements to automate bond sufficiency for drawback in the development of drawback functionality in the new system. Additionally, until such time as the automated functionality is operating in the new system, CBP should develop manual control procedures to track the sufficiency of continuous bonds.
5. Institute a periodic monitoring control to ensure accurate and timely reconciliations are performed,including the redistribution of relevant directives to personnel that communicate the required steps for completing the reconciliations.
I. 3

134 U.S. Customs and Border Protection • 2014 Performance and Accountability Report
EXHIBIT II
Significant Deficiencies
B. Property, Plant, and Equipment
Background:
U.S. Customs and Border Protection (CBP) acquired new equipment, facilities, and other assets through purchase and construction in FY 2014. The increase in assets is primarily due to construction of new facilities and software. This was offset by the depreciation of assets previously placed-in-service.
Condition:
CBP continued to have weaknesses in its processes for tracking and reporting property, plant, and equipment (PP&E) balances. Specifically, CBP did not:
• Adhere to policies and procedures to timely and accurately record certain construction-in-progress (CIP) settlement transactions, resulting in misclassification of assets between CIP, completed assets, accumulated depreciation, and depreciation expense.
• Have adequate controls in place to verify that the correct amount was settled from CIP to completed assets.
• Produce an auditable population of CIP projects as of April 30, 2014, and had to conduct further analysis of CIP projects in order to provide an auditable population at fiscal year-end.
• Have adequate controls in place to timely and accurately record the acquisition of new assets to the general ledger in accordance with policies and procedures.
• Have adequate controls in place to detect and correct for errors when certain assets recorded in the general ledger no longer existed.
• Adhere to policies and procedures to timely record certain asset retirements. Additionally, some assets were retired prior to receiving proper approval in accordance with policies.
Criteria:
Presented in Index of Financial Reporting and Internal Control Criteria, Exhibit III.
Cause/Effect:
Due to the decentralized nature of CBP’s PP&E, CBP’s policies are heavily reliant upon individuals in local field offices to submit timely and accurate information. CBP personnel do not consistently adhere to policies and procedures to ensure that transactions are recorded in a timely manner and for the correct amount. CBP management has not implemented appropriate monitoring controls to ensure compliance with stated policies and procedures by CBP personnel.
However, CBP is at an increased risk of errors and misstatements due to the untimely recording of asset retirement transactions and the disposal of assets without proper authorization. In addition, disposal of physical assets prior to approval increases the risk of misappropriation of assets.
CBP’s PP&E and related depreciation balances were misstated during the fiscal year due to untimely or inaccurate PP&E entries. At year-end, CBP’s General PP&E, CIP, Accumulated Depreciation, and Prior Period Adjustments Due to Corrections of Errors contained uncorrected factual and projected misstatements.
II. 1

1352014 Performance and Accountability Report • U.S. Customs and Border Protection
EXHIBIT II
Recommendations:
We recommend that CBP:
1. Distribute and reinforce policies and procedures to local field offices to ensure that completed assets are transferred from CIP to general PP&E in a timely manner.
2. Strengthen monitoring controls to ensure accountability at the project manager level for timely asset creation and settlement, as well as compliance with stated policies and procedures. Additionally, monitoring controls should include processes to identify projects that are nearing completion or have not had recent activity, as these have a higher risk of no longer being valid CIP projects.
3. Educate field personnel, including project managers and supervisors on the importance of following policies and procedures to ensure that asset additions are recorded in a timely manner.
4. Modify policies and procedures to require formal authorization and documentation of all assetretirements, emphasize the importance of timely reporting asset retirement transactions, and develop and implement monitoring controls to ensure compliance with stated policies and procedures for asset retirements.
C. Entry Process
1. In-Bond Program
Background:
An in-bond entry allows for the movement of cargo through the United States without payment of duty or appraisement prior to entry into either domestic commerce or exportation to a foreign country. The cargo may enter U.S. commerce after it arrives at the destination port and an entry is filed, may be entered into a bonded warehouse (BW) for storage, or may be admitted into a Foreign Trade Zone (FTZ).
To assist with in-bond oversight functions, CBP implemented the In-Bond Compliance Module in September 2012. CBP conducts audits and examinations to assist in protecting custodial revenues related to in-bond entries of goods. CBP performs audits by reviewing entry documents or documents that show proof of subsequent export to ensure proper accounting of all merchandise has occurred. Examinations are conducted by physical inspection of the merchandise to ensure the commodity matches the entry documentation. At the end of each audit or examination, the findings, conclusions, and corrective actions recommended or taken are documented. These results assist CBP in assessing the risk of bonded carriers.
We identified control deficiencies over the in-bond process from FY 2006 through FY 2013. CBPdeveloped an “NFR Analysis and Remediation Strategy” in response to these prior year findings, with full implementation planned for the fourth quarter of FY 2014. We confirmed that a revised policy was developed by CBP and implemented on April 1, 2014. Additionally, CBP Management stated that a memo was issued on October 2, 2014, which directed ports to implement oversight plans for in-bond, including the ports’ procedures and processes when conducting in-bond examinations and audits. These plans were due November 19, 2014, and therefore they were not considered during the FY 2014 audit.
Condition:
The following weaknesses in internal control over compliance exams and audits were identified:
• Revised policies and procedures over the in-bond process were not implemented until April 1, 2014. Therefore, prior year weaknesses continued to exist through the first half of FY 2014. Additionally, port personnel did not have a clear understanding of how to operate the newly implemented compliance module, which led to inconsistent implementation across ports.
II. 2

136 U.S. Customs and Border Protection • 2014 Performance and Accountability Report
EXHIBIT II
• Complete and accurate listings of the completed in-bond compliance exams, audits, and the underlying individual audit/exam results cannot be reliably generated from the system.
Criteria:
Presented in Index of Financial Reporting and Internal Control Criteria, Exhibit III.
Cause/Effect:
CBP did not effectively communicate the revised policy across the organization and did not provide sufficient training to port personnel prior to the implementation of the revised policy. Additionally, system functionality issues continue to result in report discrepancies. The system also lacks sufficient document retention capability to support the in-bond compliance exam and audit function at the port level. Further, port personnel are not required to maintain supporting documentation to evidence performance of required in-bond compliance exams and audits outside of the system.
The in-bond monitoring process supports CBP’s efforts to protect custodial revenues. The inability to effectively monitor the in-bond process could result in missed opportunities for CBP to assess fines and penalties and collect the associated revenues.
Recommendations:
We recommend that CBP implement additional training at port locations over in-bond tracking and compliance, as well as develop a process to ensure effective oversight of the in-bond process. Additionally, we recommend that CBP implement policies and procedures that resolve the insufficient document retention capability of the system.
2. Bonded Warehouse and Foreign Trade Zones
Background:
Bonded Warehouses (BWs) are facilities under CBP’s supervision used to store merchandise that has not made entry into U.S. commerce. The merchandise stored in such warehouses is secured by the bond on the warehouse. Merchandise is entered into the BW by the submission of the CBP Form 7501, Entry Summary with Continuation Sheets, and can be stored in the bonded facility for up to five years.
Foreign Trade Zones (FTZs) are secure areas under CBP supervision that are legally considered to be outside the commerce of the United States. Authority for establishing these facilities is granted by the FTZ Board under the FTZ Act of 1934, as amended (19 U.S.C. 81a through 81u). Foreign and domestic merchandise may be admitted into zones for operations not otherwise prohibited by law, including storage, exhibition, assembly, manufacturing, and processing. Merchandise is admitted into an FTZ using CBP Form 214, Application for Foreign-Trade Zone Admission and/or Status Designation.
The monitoring of BW and FTZ operations is based on the performance of risk assessments and compliance reviews by CBP officers in the field. CBP conducts a quarterly survey of ports that have BWs and FTZs, the results of which are submitted to CBP Headquarters for compilation and analysis. Headquarters uses the survey results to assist in CBP’s determination on the effectiveness of the BW and FTZ programs. CBP developed national databases in order to maintain a centralized repository of profiles of bonded facilities,including BW and FTZ sites.
II. 3

1372014 Performance and Accountability Report • U.S. Customs and Border Protection
EXHIBIT II
Condition:
The following weaknesses in internal control over the BW and FTZ programs were identified:
• A reconciliation of the codes assigned within the system to the compliance review schedule maintained by each port was not fully implemented during FY 2014.
• CBP was unable to provide documentation to evidence the completion of compliance reviews to support the assessed risk level for certain BW and FTZ reviews.
• CBP improperly recorded the risk level of an FTZ based on the compliance review that was conducted.
Criteria:
Presented in Index of Financial Reporting and Internal Control Criteria, Exhibit III.
Cause/Effect:
CBP had not completed its review of system codes to ensure the completeness and accuracy of data maintained within the system. Therefore, the results of any reconciliations performed, would not be reliable.In addition, CBP personnel did not consistently adhere to BW and FTZ policies and procedures in relation to the completion of compliance reviews.
These weaknesses in internal control increase the likelihood that CBP is not in compliance with Title 19 of the Code of Federal Regulations. Further, improper monitoring of BWs or FTZs creates a risk that imported goods awaiting entry into commerce may not be secure, and could result in a loss of revenue or error to the Taxes, Duties, and Trade Receivables, Net balance.
Recommendations:
We recommend that CBP:
1. Complete the process of reconciling codes for bonded facilities.
2. Implement additional training at ports and/or additional oversight controls to ensure risk assessments for BWs and FTZs are consistently performed in accordance with required guidelines.
3. Entry Reports
Background:
CBP personnel process and review certain entry edit/exception reports, including the following:
• The B06, Weekly List of Rejected/Cancelled Entries Report, denotes entries that were either cancelled or placed in rejected status.
• The B07, Weekly List of Unpaid/Rejected Entries, denotes entries in rejected status and entries for which duty, taxes, and fees have not been collected, or if collected, not properly posted to the entry.
• The B08, Weekly Late Report: Entry Releases with No Follow-Up Summaries, is a cumulative listing of entry releases with no processing errors or follow-up entry summary on file.
• The B84, Weekly Budget Clearing Account (BCA) and Suspense Item Report, is a cumulative listing of collections that are an intentional posting to a suspense account or collections in an error condition.
II. 4

138 U.S. Customs and Border Protection • 2014 Performance and Accountability Report
EXHIBIT II
Condition:
CBP personnel did not consistently complete and review reports in accordance with the directives requirements. Specifically, a lack of segregation of duties was identified over the review process for certain reports as the individuals who performed the transactions were also responsible for reviewing the reports of those transactions. In addition, some entry exception/edit reports selected did not include evidence that the actions taken to resolve the exceptions or to verify the edits were performed timely or at all.
Criteria:
Presented in Index of Financial Reporting and Internal Control Criteria, Exhibit III.
Cause/Effect:
CBP port personnel did not consistently adhere to the policies and procedures in place to ensure entry edit/exception reports were resolved properly. CBP does not have adequate controls in place to enforce the segregation of duties over the processing, review, and verification of entry edit/exception reports at the ports.
Failure to consistently adhere to existing policies and procedures for review and verification of entry edit/exception reports may cause CBP not to identify improperly cancelled or deleted entries, unpaid duties, late entry summaries, or duties held in suspense accounts, resulting in a potential misstatement to the Taxes, Duties, and Trade Receivables, Net balance.
Recommendation:
We recommend that CBP redistribute to all ports of entry the relevant directives communicating the steps for completing report reconciliations. Additionally, we recommend that CBP institute a quarterly monitoring control by local port of entry management to ensure the timely completion of reconciliations.
4. Bond Sufficiency
Background:
CBP requires bonds from parties that import merchandise into the United States. These bonds are contracts to secure payment of duties, taxes, and fees in the event that an importer fails to fulfill their financial obligations. The assessment of liquidated damages against a bond serves to promote compliance with laws and regulations.
The two primary types of customs bonds are continuous bonds and single transaction bonds (STBs). A continuous bond is typically obtained by importers that have a large number of entries across several ports of entry. The bond has a term of one year and is automatically renewed each year until it is terminated by the surety or the principal. An STB serves as collateral for a specific entry or transaction.
Condition:
The following weaknesses in internal control over STBs were identified:
• CBP was unable to provide documentation to support the review of two STBs that were submitted electronically.
• The execution date and transaction date of an STB occurred after the date of entry per the entry summary form. Therefore, the STB was invalid.
II. 5

1392014 Performance and Accountability Report • U.S. Customs and Border Protection
EXHIBIT II
Criteria:
Presented in Index of Financial Reporting and Internal Control Criteria, Exhibit IV.
Cause/Effect:
CBP did not consistently adhere to policies and procedures for the review of STBs. Failure to adhere to existing policies and procedures for the review of STBs may cause CBP not to collect all revenue owed,resulting in an inability to identify all trade receivables.
Recommendation:
We recommend that CBP implement a centralized approach to monitoring STBs.
5. Classification of Custodial Liabilities
Background:
CBP is authorized to collect duties and taxes for Puerto Rico and to recover CBP’s cost of services from the collections. CBP recorded the net duties and taxes that are due to Puerto Rico, as well as amounts potentially payable to an importer that are under protest, as accounts payable. However, these amounts met the definition of custodial liabilities.
Condition:
The internal control over the review of manual journal entries recorded for amounts to be paid to Puerto Rico was not operating effectively, as the liabilities were improperly recorded as Accounts Payable rather than Custodial Liabilities.
Criteria:
Presented in Index of Financial Reporting and Internal Control Criteria, Exhibit III.
Cause/Effect:
CBP’s review of the manual journal entries did not ensure appropriate posting logic was used, based on applicable guidance per Statement of Federal Financial Accounting Standard (SFFAS) No. 7, Accounting for Revenue and Other Financing Sources, and the United States Standard General Ledger (USSGL) with respect to accounting for Puerto Rico transactions. The aggregate impact of the three misclassifications is an overstatement of Accounts Payable and an understatement of Custodial Liabilities.
Recommendation:
We recommend that CBP correct the posting logic applied in preparing journal entries related to amounts payable to Puerto Rico, such that amounts owed are recorded to SGL 2980, Custodial Liability, rather than SGL 2110, Accounts Payable.
D. Information Technology
Background:
Controls over information technology (IT) and related financial systems are essential elements of financial reporting integrity. Effective IT controls in an IT financial systems environment can be defined in five key general control areas (security management, access control, configuration management, segregation of duties, and contingency planning) and four key application control areas (application level general controls, business process controls, interface controls, and data management system controls) . In addition to reliable general and application controls, financial management system functionality is important to program monitoring, increasing accountability of financial and program managers, providing better information for
II. 6

140 U.S. Customs and Border Protection • 2014 Performance and Accountability Report
EXHIBIT II
decision-making, and increasing the efficiency and effectiveness of services provided by the Federal government.
Condition:
CBP took corrective actions to address prior year IT control deficiencies, and successfully closed 12 of 18 deficiencies that were followed up on in FY2014. For example, CBP made improvements to password parameters, audit log reviews and maintenance of evidence, recertification of user access, provisioning of user access, removing separated personnel in a timely manner, enforcing segregation of duties, and performing backups.
However, during FY 2014, new and continuing general IT control weaknesses were identified that could potentially impact CBP’s financial and custodial data. The most significant weaknesses related to controls over system functionality, access, segregation of duties, and configuration management. Collectively, the general IT control weaknesses limit CBP’s ability to support assertions that critical financial and operational data confidentiality, integrity, and availability are maintained. CBP’s current system of record for entries imported into the U.S. does not fully support CBP’s custodial revenue and drawback processes.
Due to the sensitive nature of these issues, we will issue a separate, restricted distribution report that discusses the general IT control and functionality deficiencies in greater detail.
Criteria:
The criteria will be presented in a separate, restricted distribution report that discusses the general IT control and functionality deficiencies in greater detail.
Cause/Effect:
Funding for IT development and implementation, as well as for IT support staff has been reduced in recent years. This has prolonged implementation of systems that would replace or enhance current systems, and has had an impact on providing IT support resources. In addition, transition to different system development methodologies has led to inconsistent IT control practices and documentation. Further, due to the presence of IT control and financial system functionality weaknesses, there is additional pressure on the manual, mitigating processes and controls.
Recommendation:
We recommend that CBP improve the IT general and application controls over its financial systems to ensure adequate security, protection, and functionality of the information systems.
II. 7

1412014 Performance and Accountability Report • U.S. Customs and Border Protection
EXHIBIT III
Index of Financial Reporting and Internal Control Criteria (Listed Alphabetically by Criteria Source)
Criteria Reference Report Exhibit
Title 19, Volume 1, Section 18.2 (d), Section 18.6 (b), and Section 18.8(b) II-C-1
Title 19, Volume 1, Section 19.4 (a) and Section 146.3 (a) II-C-2
Title 19, Volume 1, Section 111.23 (a)(1)-(2)
I-A
Title 19, Volume 1, Section 111.25
Title 19, Volume 1, Section 113.13 (c)
Title 19, Volume 1, Section 113.65 (a)(3)-(4),(b)
2014 Code of Federal Regulations (CFR) Title 19, Volume 2, Section 163.4 (a)-(b)
Title 19, Volume 2, Section 191.15
Title 19, Volume 2, Part 191.38 (a)
Title 19, Volume 2, Section 191.51 (b)(1)
Title 19, Volume 2, Section 191.92 (d)
Title 19, Volume 1, Section 113.13 (c)
II-C-4 Title 19, Volume 1, Section 113.15
Title 19, Volume 1, Section 113.26
III. 1

142 U.S. Customs and Border Protection • 2014 Performance and Accountability Report
EXHIBIT III
Criteria Reference Report Exhibit
CBP Directive 3510-005, Bond Sufficiency Section 2; Section 3 II-C-4
CBP Directive 3710-004B, Refund of Miscellaneous Collections Section 2.2; Section 5.7.1 I-A
CBP Directive 5320-028D, Commitment, Obligation, Expenditure, and Payment Procedures for Goods and Services
Section 7.5.1 II-B
CBP Directive 5610-004B, Resolving Certain ACS Exception and Error Reports
Section 5.1.2; Section 5.4.2; Section 5.5.2; Section 5.6.2; Section 5.11.2 II-C-3
CBP Directive 5610-006A, Entry Deletion and Entry or Entry Summary Cancellation Section 6.6.1 II-C-3
CBP FY 2014 Personal Property Inventory Instructions Introduction II-B
CBP Handbook (HB) 3500-09, Compliance Review Handbook for Bonded Warehouses Foreword; Chapter 3 II-C-2
CBP HB 3500-10, Compliance Review Handbook for Foreign Trade Zones Chapter 3 II-C-2
CBP HB 3500-11, Bonded Warehouse Manual for Customs and Border Protection Officers and Bonded Warehouse Proprietors
Part 1.1 II-C-2
CBP HB 3700-01B, Drawback Handbook Chapter 5 I-A
CBP HB 5200-13B, Personal Property andAsset Management Handbook Chapter 8 II-B
Federal Accounting Standards Advisory Board (FASAB) Statement of Federal Financial Accounting Standards (SFFAS) No. 6, Accounting for Property, Plant, and Equipment
Chapter 2, Paragraphs 26, 34, 38, and 39 II-B
FASAB SFFAS No. 7, Accounting for Revenue and Other Financing Sources Appendix B, Paragraphs 245, 289, 290, and 291 II-C-5
FASAB Federal Financial Accounting Technical Release (TR) No. 14 Paragraph 10 II-B
III. 2

1432014 Performance and Accountability Report • U.S. Customs and Border Protection
EXHIBIT III
Criteria Reference Report Exhibit
The Federal Manager’s Financial Integrity Act (FMFIA) of 1982 Section 2 (d)(1)(A) I-A, II-B
Section I I-A, II-C-3, II-C-4
Office of Management and Budget (OMB) Circular No. A-123, Management’s Responsibility for Internal Control
Policy, paragraph 3; Section I, paragraph 2; Section IV, paragraph 1 I-A
Section II. Standards I-A, II-B, II-C-3
Purpose, paragraph 1 II-C-5
U.S. Customs Service HB 2100-05A, Records Control Handbook Introduction and Background II-C-4
United States Standard General Ledger (USSGL)
Account Definitions for SGL 2110, Accounts Payable, and SGL 2980, Custodial Liability II-C-5
III. 3

144 U.S. Customs and Border Protection • 2014 Performance and Accountability Report
OFFICE OF INSPECTOR GENERAL Department of Homeland Security
Appendix A Management Comments to the Report
www.oig.dhs.gov 2 OIG-15-76
1452014 Performance and Accountability Report • U.S. Customs and Border Protection
OFFICE OF INSPECTOR GENERAL Department of Homeland Security
Appendix B Report Distribution
Department of Homeland Security
Secretary Deputy Secretary Chief of Staff Deputy Chief of Staff General Counsel Director, GAO/OIG Liaison Office Assistant Secretary for Office of Policy Assistant Secretary for Office of Public Affairs Assistant Secretary for Office of Legislative Affairs Chief Financial Officer Chief Information Officer Chief Privacy Officer
U.S. Customs and Border Protection
Commissioner Chief Financial Officer Chief Information Officer CBP Audit Liaison
Office of Management and Budget
Chief, Homeland Security Branch DHS OIG Budget Examiner
Congress
Congressional Oversight and Appropriations Committees
www.oig.dhs.gov OIG-15-76

146 U.S. Customs and Border Protection • 2014 Performance and Accountability Report
ADDITIONAL INFORMATION AND COPIES
To view this and any of our other reports, please visit our website at: www.oig.dhs.gov.
For further information or questions, please contact Office of Inspector General Public Affairs at: [email protected]. Follow us on Twitter at: @dhsoig.
OIG HOTLINE
To report fraud, waste, or abuse, visit our website at www.oig.dhs.gov and click on the red "Hotline" tab. If you cannot access our website, call our hotline at (800) 323-8603, fax our hotline at (202) 254-4297, or write to us at:
Department of Homeland Security Office of Inspector General, Mail Stop 0305 Attention: Hotline 245 Murray Drive, SW Washington, DC 20528-0305

Other InformationThis section includes CBP’s Schedule of Spending and information on CBP’s Revenue Gap, Revenue Collections, Improper Payments Information, and Summary of Financial Statement Audit Management Assurances. This section is unaudited.

148 U.S. Customs and Border Protection • 2014 Performance and Accountability Report
Other Information
Customs and Border Protection Other Information
(Unaudited)
Schedule of Spending For the Years Ended September 30, 2014 and 2013 (in thousands)
2014 2013 What Money is Available to Spend? Total Resources $17,253,732 $16,154,816 Less: Amount Available but Not Agreed to be Spent 1,017,432 717,874 Less: Amount Not Available to be Spent 542,461 574,438 Total Amounts Agreed to be Spent $15,693,839 $14,862,504 How was the Money Spent/Issued? Salaries & Expenses
Personnel Compensation and Benefits $ 8,207,551 $ 8,055,942 Contractual Services and Supplies 1,543,403 1,644,432 Acquisition of Assets 262,140 168,050 Refunds 2,343 2,276 Other 605 468
Automation Modernization Personnel Compensation and Benefits 153,185 167,843 Contractual Services and Supplies 481,494 379,291 Acquisition of Assets 247,908 224,773
Construction Personnel Compensation and Benefits 43,558 29,921 Contractual Services and Supplies 371,621 160,387 Acquisition of Assets 61,812 43,256
BSFIT Personnel Compensation and Benefits -- 1,330 Contractual Services and Supplies 327,933 243,467 Acquisition of Assets 109,164 57,236
Air & Marine Personnel Compensation and Benefits 274,600 269,675 Contractual Services and Supplies 488,308 479,498 Acquisition of Assets 57,044 76,051 Other 3 --
Other Personnel Compensation and Benefits 1,259,327 1,136,220 Contractual Services and Supplies 293,423 266,297 Acquisition of Assets 46,546 22,242 Refunds 1,461,871 1,433,849
Total Amounts Agreed to be Spent $15,693,839 $14,862,504

1492014 Performance and Accountability Report • U.S. Customs and Border Protection
Customs and Border Protection Other Information
(Unaudited)
Who did the Money go to? Individuals $ 5,136,965 $ 6,247,205 Government 7,988,337 4,935,832 For Profit 2,535,314 3,636,481 Higher Education 30,880 34,616
Other 2,343 8,370 Total Amounts Agreed to be Spent $15,693,839 $14,862,504 Who did the Money go to? Federal $ 5,373,992 $ 4,947,085 Non-Federal 10,319,847 9,915,419 Total Amounts Agreed to be Spent $15,693,839 $14,862,504
Much of what is reported on this schedule, primarily personnel expenses and payments to other federal agencies, is excluded from the USASpending.gov reporting. USASpending.gov reports primarily payments made on commercial contracts. CBP’s financial reporting is within five percent of the spending reported on the USASpending.gov website.
Revenue Gap The Entry Summary of Trade Compliance Measurement (TCM) program collects objective statistical data to estimate the compliance level of commercial imports with U.S. trade laws, regulations and agreements, and is used to produce a dollar amount for Estimated Net Under-collections, and a percent of Revenue Gap. The Revenue Gap is a calculated estimate that measures potential loss of revenue owing to noncompliance with trade laws, regulations, and trade agreements using a statistically valid sample of the revenue losses and overpayments detected during TCM entry summary reviews conducted throughout the year.
FY 2014 (Preliminary) FY 2013 (Final) Estimated Revenue Gap $192.5 mil $627.9 mil Estimated Revenue Gap of all collectable revenue for year (%) 0.44% 1.51% Estimated Over-Collection $24.6 mil $108.8 mil Estimated Under-Collection $217.2 mil $736.7 mil Estimated Overall Trade Compliance Rate (%) 98.0% 97.1%
The preliminary overall compliance rate for FY 2014 is 98.0 percent. The final overall trade compliance rate and estimated revenue gap for FY 2014 will be issued in February 2015.

150 U.S. Customs and Border Protection • 2014 Performance and Accountability Report
Customs and Border Protection Other Information
(Unaudited) Petitioned and Protested Schedule An analysis of the changes in petitioned and protested assessed amounts during FY 2014 and 2013 is as follows (in thousands):
2014
Balance October 1
Additional
Assessments
Protest in Favor
of Debtor
Net Reduction Administrative
Process
Additional Receivable
Balance
September 30 Duties $ 392,218 $ 70,348 $ (3,825) $ (109,300) $ -- $ 349,441 Taxes 1,367 (307) -- (398) -- 662 Fees 1,366 1,193 (75) (1,547) -- 937 Fines/Penalties 1,342,238 1,057,997 (268,519) (23) (405,269) 1,726,424 Interest 200,275 34,228 (1,024) (21,281) -- 212,198 Antidumping/ Countervailing Duty 313,117 250,642 (3,166) (73,614) -- 486,979 Refunds & Drawbacks 8,728 1,982 (1,255) (3,724) -- 5,731 Total $2,259,309 $1,416,083 $(277,864) $(209,887) $(405,269) $2,782,372
2013
Balance October 1
Additional
Assessments
Protest in
Favor of Debtor
Net Reduction Administrative
Process
Additional Receivable
Balance
September 30
Duties $ 319,525 $253,822 $ (7,092) $(174,037) $ -- $ 392,218 Taxes 313 1,862 (8) (800) -- 1,367 Fees 8,287 3,339 (71) (10,189) -- 1,366 Fines/Penalties 1,926,647 454,961 (776,023) (122) (263,225) 1,342,238 Interest 172,404 51,436 (3,389) (20,176) -- 200,275 Antidumping/ Countervailing Duty 204,116 173,784 (4,595) (60,188) -- 313,117 Refunds & Drawbacks 4,626 10,692 (1,027) (5,563) -- 8,728 Total $2,635,918 $949,896 $(792,205) $(271,075) $(263,225) $2,259,309

1512014 Performance and Accountability Report • U.S. Customs and Border Protection
Customs and Border Protection Other Information
(Unaudited) CBP reviews selected entry documentation to determine whether importer payment estimates of duties, taxes and fees were accurate or whether additional supplemental amounts are owed and should be billed. CBP regulations allow the importer 180 days (or 90 days for entries before December 18, 2004) from the bill date to file a protest and application with the Port Director challenging the assessment of supplemental duties, taxes and fees and requesting further review of the protest by CBP Office of Regulations and Rulings. If the Port Director denies the protest and application for further review, the protestor has an additional 60 days from the denial date for a review of the application by the Commissioner of CBP. Consequently, CBP recognizes accounts receivables only when the protested period has elapsed or when a protest decision has been rendered in CBP’s favor. Additionally, importers and their sureties also have the option to petition for relief after receipt of CBP’s notice that a fine or penalty has been assessed when a violation of law or regulation is discovered. The importer or surety has 60 days to file a petition for relief or make payment of the assessed amount. If a petition is received and CBP finds there are extenuating circumstances such as an incorrect assessment, which warrants mitigation, relief is granted as prescribed by CBP’s mitigation guidelines and directives. Consequently, CBP recognizes accounts receivables only when the petition period has elapsed or when a petition decision has been rendered.
Accounts Receivable with Public, Net An aging of Accounts Receivable with the Public as of September 30, 2014 and 2013 is as follows (in thousands):
Aged Period
2014 <=90 days 91 days–1 year 1-2 years 2-3 years 3+ years Total Reimbursable Services $ 2,849 $4,688 $ 566 $ 405 $ 918 $ 9,426 User Fees 384,090 1,618 1,780 415 9,947 397,850 Gross Receivables $386,939 $6,306 $2,346 $ 820 $ 10,865 $407,276 Less: Uncollectible Amounts
-- (279) (1,722) (412) (9,923) (12,336)
Net Receivables $386,939 $6,027 $ 624 $ 408 $ 942 $394,940
Aged Period 2013 <=90 days 91 days–1 year 1-2 years 2-3 years 3+ years Total
Reimbursable Services $ 2,639 $1,716 $ 775 $ 399 $ 1,013 $ 6,542 User Fees 355,617 3,144 686 106 9,578 369,131 Gross Receivables $358,256 $4,860 $1,461 $ 505 $ 10,591 $375,673 Less: Uncollectible Amounts
1,863 36
685
104
9,541
12,229
Net Receivables $356,393 $4,824 $ 776 $ 401 $ 1,050 $363,444

152 U.S. Customs and Border Protection • 2014 Performance and Accountability Report
Customs and Border Protection Other Information
(Unaudited)
Taxes, Duties and Trade Receivables, Net
An analysis of the changes in Taxes, Duties, and Trade Receivables during FY 2014 and 2013 is as follows (in thousands):
2014
Receivable Category
Balance October 1
Receivables Recorded During the Fiscal Year
Collections
Write-offs
Adjustments
Balance September 30
Duties $2,474,559 $29,275,312 $(17,575,331) $ (532) $(11,423,788) $2,750,220 Excise Taxes 149,281 2,762,032 (1,609,096) -- (1,134,016) 168,201 Fees 68,224 3,187,170 (1,923,130) -- (1,260,402) 71,862 Fines/Penalties 458,174 861,885 (52,975) (42,296) (715,241) 509,547 Interest 566,208 130,728 (12,737) (8) (15,666) 668,525 Antidumping/ Countervailing Duty 1,232,570 733,430 (314,985) -- (244,521) 1,406,494 Refunds/Drawbacks 3,032 4,516 (3,021) -- (2,153) 2,374 Total $4,952,048 $36,955,073 $(21,491,275) $(42,836) $(14,795,787) $5,577,223 Less: Uncollectible Amounts 2,270,041 2,527,833 Net Receivables $2,682,007 $3,049,390
2013
Receivable Category
Balance October 1
Receivables Recorded During the Fiscal Year
Collections
Write-offs
Adjustments
Balance September 30
Duties $2,284,738 $27,522,198 $(16,823,348) $ (20,727) $(10,488,302) $2,474,559 Excise Taxes 142,685 2,505,738 (764,567) -- (1,734,575) 149,281 Fees 197,613 2,978,414 (1,850,234) -- (1,257,569) 68,224 Fines/Penalties 445,238 603,051 (57,740) (93,643) (438,732) 458,174 Interest 541,130 81,298 (10,987) (71,917) 26,684 566,208 Antidumping/ Countervailing Duty 1,169,953 130,578 (30,989) (101,531) 64,559 1,232,570 Refunds/Drawbacks 1,461 5,705 (868) -- (3,266) 3,032 Total $4,782,818 $33,826,982 $(19,538,733) $(287,818) $(13,831,201) $4,952,048 Less: Uncollectible Amounts 2,082,353
2,270,041
Net Receivables $2,700,465 $2,682,007
The beginning and ending balances for the “Antidumping/Countervailing Duty” Receivable Category represent only receivables resulting from Supplemental Duty Bills.
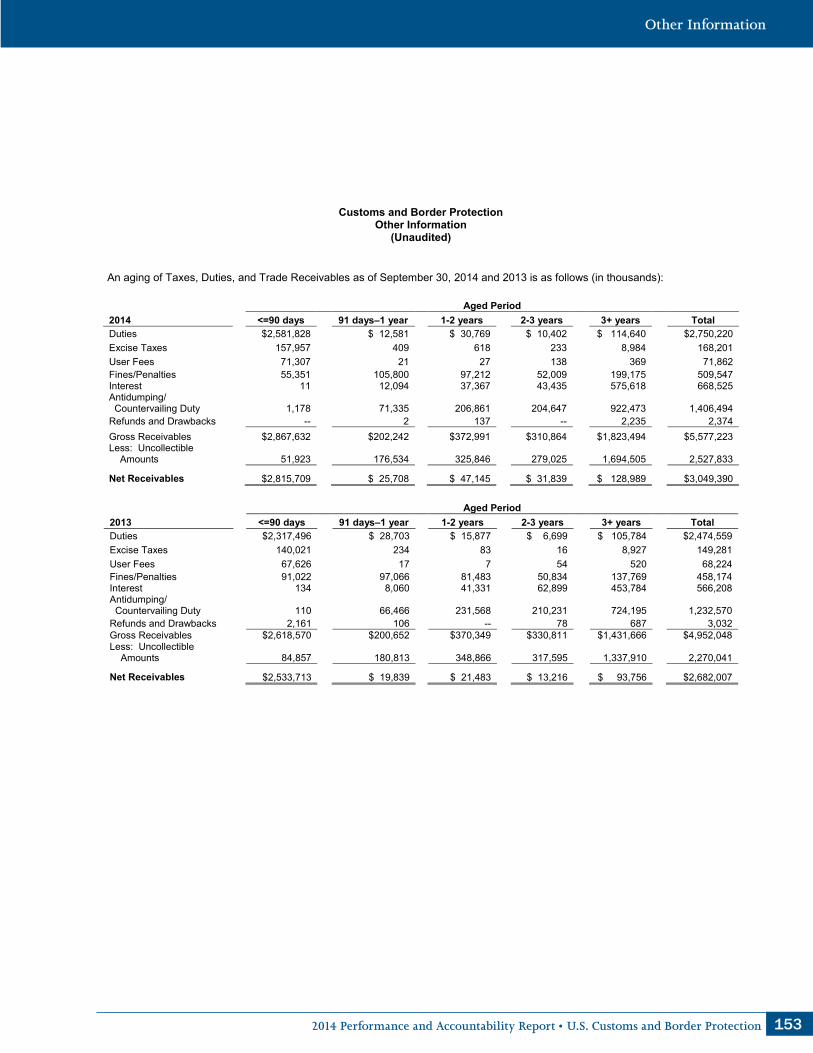
1532014 Performance and Accountability Report • U.S. Customs and Border Protection
Customs and Border Protection Other Information
(Unaudited) An aging of Taxes, Duties, and Trade Receivables as of September 30, 2014 and 2013 is as follows (in thousands):
Aged Period
2014 <=90 days 91 days–1 year 1-2 years 2-3 years 3+ years Total Duties $2,581,828 $ 12,581 $ 30,769 $ 10,402 $ 114,640 $2,750,220 Excise Taxes 157,957 409 618 233 8,984 168,201 User Fees 71,307 21 27 138 369 71,862 Fines/Penalties 55,351 105,800 97,212 52,009 199,175 509,547 Interest 11 12,094 37,367 43,435 575,618 668,525 Antidumping/ Countervailing Duty 1,178 71,335 206,861 204,647 922,473 1,406,494 Refunds and Drawbacks -- 2 137 -- 2,235 2,374 Gross Receivables $2,867,632 $202,242 $372,991 $310,864 $1,823,494 $5,577,223 Less: Uncollectible Amounts 51,923 176,534 325,846 279,025 1,694,505 2,527,833
Net Receivables $2,815,709 $ 25,708 $ 47,145 $ 31,839 $ 128,989 $3,049,390
Aged Period 2013 <=90 days 91 days–1 year 1-2 years 2-3 years 3+ years Total Duties $2,317,496 $ 28,703 $ 15,877 $ 6,699 $ 105,784 $2,474,559 Excise Taxes 140,021 234 83 16 8,927 149,281 User Fees 67,626 17 7 54 520 68,224 Fines/Penalties 91,022 97,066 81,483 50,834 137,769 458,174 Interest 134 8,060 41,331 62,899 453,784 566,208 Antidumping/ Countervailing Duty 110 66,466 231,568 210,231 724,195 1,232,570 Refunds and Drawbacks 2,161 106 -- 78 687 3,032 Gross Receivables $2,618,570 $200,652 $370,349 $330,811 $1,431,666 $4,952,048 Less: Uncollectible Amounts 84,857 180,813 348,866 317,595 1,337,910 2,270,041
Net Receivables $2,533,713 $ 19,839 $ 21,483 $ 13,216 $ 93,756 $2,682,007

154 U.S. Customs and Border Protection • 2014 Performance and Accountability Report
Customs and Border Protection Other Information
(Unaudited) CBP Collections by Category (in thousands)
2010 2011 2012 2013 2014 Duties (Unaudited) (Unaudited) (Unaudited) (Unaudited) (Unaudited) Consumption Entries $25,312,699 $29,522,341 $30,860,080 $32,246,586 $34,267,273 Warehouse Withdrawals 54,214 41,907 38,676 58,065 46,462 Mail Entries 3,354 3,159 2,028 2,721 3,067 Passenger Baggage Entries 3,616 3,652 4,085 4,738 4,938 Crew Baggage Entries 9 6 5 60 11 Military Baggage Entries 2 3 5 2 2 Informal Entries 56,200 63,689 65,543 138,076 216,293 Vessel Repair Entries 21,521 30,381 16,710 11,613 29,123 Other Duties 9,747 8,359 18,868 24,904 32,927 Total Duties $25,461,362 $29,673,497 $31,006,000 $32,486,765 $34,600,096 Miscellaneous Violations of CBP Law 60,380 61,532 52,451 51,846 47,068 Testing, Inspecting & Grading 58 64 4,157 3,394 1,270 Miscellaneous Taxes 20,382 21,845 21,745 21,752 22,270 USDA Collections 120,637 120,704 131,680 146,016 151,595 Harbor Maintenance Fee 1,221,712 1,469,109 1,539,799 1,523,171 1,510,343 Fees 7,817 5,904 7,392 8,730 8,277 User Fee Account 2,440,275 2,779,483 3,439,523 3,680,658 3,853,530 Unclaimed Funds 188 164 469 240 256 Recoveries -- -- -- 3 1 Interest 13,555 35,577 40,173 1,050 37,891 Other CBP Receipts 15,329 13,838 22,412 22,142 56,275 Total Miscellaneous $ 3,900,333 $ 4,508,220 $ 5,259,801 $ 5,459,002 $5,688,776 Internal Revenue Taxes 2,782,240 2,796,788 2,995,140 3,039,640 3,143,782 Total Collections $32,143,935 $36,978,505 $39,260,941 $40,985,407 $43,432,654
These schedules will not equal amounts reported on the Consolidated Statement of Custodial Activity due to timing adjustments and entity collections which are not reported on the Consolidated Statement of Custodial Activity but are included in this schedule.

1552014 Performance and Accountability Report • U.S. Customs and Border Protection
Customs and Border Protection Other Information
(Unaudited) CBP Collections by Major Processing Port Locations (in thousands) 2010 2011 2012 2013 2014 (Unaudited) (Unaudited) (Unaudited) (Unaudited) (Unaudited) Boston $ 352,710 $ 345,490 $ 363,497 $ 364,986 $ 368,708 Buffalo-Niagara Falls 342,659 294,659 317,012 322,727 329,602 Ogdensburg 132,890 132,567 147,013 143,957 148,037 Portland, Maine 54,993 60,124 62,517 55,223 59,328 Providence 82,532 112,008 126,627 146,914 147,430 St. Albans 46,778 46,145 50,206 51,063 55,956 Baltimore 615,025 629,569 654,950 701,463 797,220 Philadelphia 422,253 448,508 461,559 511,088 529,195 Newark 4,347,759 5,025,814 5,219,277 5,113,482 5,452,541 JFK Airport 961,149 1,017,668 981,040 1,056,601 1,096,558 Charleston 858,098 1,043,719 1,184,188 1,123,350 1,183,438 Miami 600,506 771,770 803,266 836,692 916,642 San Juan 101,368 117,235 125,899 279,092 198,743 St. Thomas 16,720 14,948 12,550 12,110 12,007 Savannah 1,643,027 1,985,424 2,047,913 2,073,771 2,548,813 Tampa 425,038 447,629 492,541 488,510 474,920 Wilmington 294,996 304,612 266,326 280,096 277,479 Norfolk 604,357 704,551 736,196 808,177 913,193 NFC Indianapolis/Washington 1,418,106 1,650,976 1,870,288 2,328,877 2,347,853 Mobile 168,661 180,997 185,049 204,101 184,221 New Orleans 1,011,820 1,232,590 1,303,706 1,351,597 1,536,368 Dallas/Ft Worth 428,898 527,570 574,583 625,293 667,102 El Paso 139,378 144,829 152,491 200,830 217,850 Houston 735,314 919,704 1,116,282 1,121,159 1,312,861 Laredo 424,299 583,472 656,435 674,221 779,703 Port Arthur 28,584 30,079 20,869 17,125 19,053 Nogales 84,353 96,259 94,566 110,129 131,433 Los Angeles 8,565,244 9,715,689 10,268,894 10,858,809 11,039,327 San Diego 216,275 221,490 252,688 268,872 320,284 Anchorage 124,792 134,253 118,389 94,208 80,073 Honolulu 32,816 36,089 37,192 36,037 35,748 Portland 303,922 312,337 365,043 338,674 340,501 San Francisco 1,115,329 1,301,094 1,405,650 1,449,926 1,506,267 Seattle 1,145,325 1,307,307 1,354,234 1,300,806 1,261,971 Chicago 1,602,089 1,916,811 2,009,737 2,013,849 2,169,167 Cleveland 1,490,599 1,710,571 1,810,848 1,938,792 2,150,736 Detroit 528,280 625,148 677,489 696,579 749,017 Milwaukee 24,786 23,183 31,130 23,548 38,893 Minneapolis 187,866 244,880 265,195 262,182 262,412 Pembina 23,483 25,078 31,373 36,254 44,855 St. Louis 304,941 364,369 426,942 486,737 540,986 Great Falls 135,917 171,290 179,291 177,500 186,163 Total Revenues Collected $32,143,935 $36,978,505 $39,260,941 $40,985,407 $43,432,654 These schedules will not equal amounts reported on the Consolidated Statements of Custodial Activity due to timing adjustments and entity collections which are not reported on the Consolidated Statements of Custodial Activity but are included in these schedules.

156 U.S. Customs and Border Protection • 2014 Performance and Accountability Report
Customs and Border Protection Other Information
(Unaudited)
Summary of Financial Statement Audit and Management Assurances
Table 1 and Table 2 below provide a summary of the financial statement audit results and management assurances for FY 2014.
Table 1. FY 2014 Summary of the Financial Statement Audit
Audit Opinion UNMODIFIED Restatement No
Material Weakness Beginning Balance New Resolved Consolidated Ending
Balance Drawback Payments 1 0 0 0 1 Total Material Weaknesses 1 0 0 0 1
In FY 2014, the Independent Auditor’s Report continues to identify one long-standing material weakness associated with Drawback Payments. Drawback is a remittance, in whole or in part, of duties, taxes, or fees previously paid by an importer. Drawback occurs when the imported goods on which duties, taxes, or fees have been previously paid, are subsequently exported from the United States or destroyed prior to entering the commerce of the United States. Corrective actions to reduce the severity and ultimately resolve the material weakness will require a combination of legislative activity, an information technology systems solution, and compensating manual procedures. CBP’s remediation strategy includes actions addressing each of these three components. Table 2. FY 2014 Summary of Management Assurances
Effectiveness of Internal Control over Financial Reporting (FMFIA § 2) Statement of Assurance QUALIFIED
Material Weakness Beginning Balance New Resolved Consolidated Ending
Balance Drawback Payments 1 0 0 0 1 Total Material Weakness 1 0 0 0 1
Effectiveness of Internal Control over Operations (FMFIA § 2) Statement of Assurance UNQUALIFIED
Material Weakness Beginning Balance New Resolved Consolidated Ending
Balance None 0 0 0 0 0 Total Material Weakness 0 0 0 0 0
Conformance with Financial Management Systems Requirements (FMFIA § 4)
Statement of Assurance SYSTEMS DO NOT CONFORM WITH FINANCIAL SYSTEMS REQUIREMENTS
Non-Conformances Beginning Balance New Resolved Consolidated Ending
Balance Core Financial Systems 1 0 0 0 1 IT General Controls 1 0 0 0 1 IT Infrastructure 1 0 0 0 1 Total Non-Conformances 3 0 0 0 3
Compliance with Section 803(a) of the Federal Financial Management Improvement Act (FFMIA) CBP Auditor 1.System Requirements Lack of substantial
compliance noted Lack of substantial compliance
noted 2.Accounting Standards No lack of substantial
compliance noted No lack of substantial
compliance noted 3. United States Standard General Ledger (USSGL) at Transaction Level
Lack of substantial compliance noted
Lack of substantial compliance noted

1572014 Performance and Accountability Report • U.S. Customs and Border Protection
Customs and Border Protection Other Information
(Unaudited) The Federal Financial Management Improvement Act (FFMIA) non-compliance conditions consist of the following:
System Requirements – the conditions noted predominantly relate to access control and security management conditions associated with separating employees. CBP is addressing the conditions by developing a technical solution that will provide an efficient and effective process for removing employee system access.
USSGL at Transaction Level – CBP’s Automated Commercial System (ACS) does not interface trade-related receivable activity with the CBP general ledger accounting system, SAP, at the transaction level. The condition will be included in the planning and development of an initiative to migrate ACS from its current mainframe platform to a web-based platform as part of the Revenue Modernization Program.
Improper Payments Information Act of 2002 (IPIA) The Improper Payments Information Act (IPIA) of 2002 was amended by the Improper Payments Elimination and Recovery Act (IPERA) of 2010 and the Improper Payments Elimination and Recovery Improvement Act of 2012 (IPERIA). CBP identified and performed a risk assessment on all ten programs, two of which, Custodial Refund and Drawback and Salaries and Expense Payroll-Administrative Uncontrollable Overtime (AUO), were identified as high risk. Federal law requires Hurricane Sandy Supplemental spending to be considered high risk as defined by IPERIA. Thus all Hurricane Sandy Supplemental funds must be tested. Congress requires funds allocated to agencies under the American Recovery and Reinvestment Act (ARRA) of 2009 be tested regardless of risk assessment outcome. Per OMB guidance, if an agency, “has documented a minimum of two consecutive years of improper payments that are less than” 1.5 percent, “the agency may request relief from the annual reporting requirements for this program or activity.” CBP’s total extrapolated error rate was less than 0.1 percent for the past two years. The DHS Chief Financial Officer (CFO) signed a memorandum dated April 11, 2013 approving cessation of segregated testing for future ARRA disbursements due to the consistent low error rate. Border Security Fencing (BSF) was deemed low risk according to the FY 2013 risk assessment. However, CBP received stimulus money for BSF projects under ARRA, which requires funds allocated to be tested regardless of the risk assessment outcome. Per OMB guidance, if an agency, “has documented a minimum of two consecutive years of improper payments that are less than” 1.5 percent, “the agency may request relief from the annual reporting requirements for this program or activity” and includes an assertion from the agency’s Office of Inspector General (OIG) that concurs with the agency’s request for relief. CBP’s total extrapolated error rate was less than 0.01 percent for the past two years. CBP submitted a request in May 2014, which included the DHS Inspector General’s concurrence, to obtain OMB’s approval to seek relief from continued annual IPERIA testing for BSF. Relief from testing was granted by OMB on July 23, 2014. The Custodial Refund and Drawback payment testing yielded an estimated improper payment amount of $179 thousand of the $1.5 billion, or 0.01 percent, disbursed during FY 2013. Salaries and Expense Payroll-AUO payment testing yielded no improper payment of the $393 million testing population, or .00 percent, disbursed during FY 2013. One hundred percent of Hurricane Sandy disbursements for supplies, equipment and other services were required to be tested. CBP did not identify any improper payments for FY 2013.
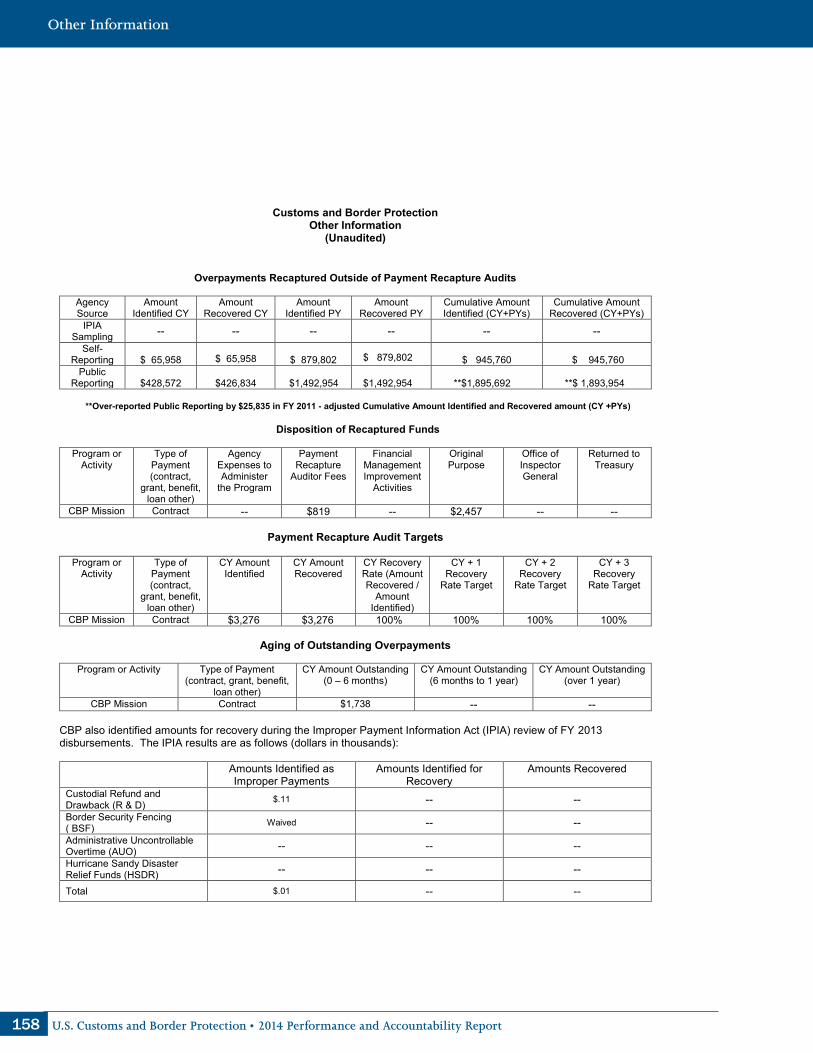
158 U.S. Customs and Border Protection • 2014 Performance and Accountability Report
Customs and Border Protection Other Information
(Unaudited)
Overpayments Recaptured Outside of Payment Recapture Audits
Agency Source
Amount Identified CY
Amount Recovered CY
Amount Identified PY
Amount Recovered PY
Cumulative Amount Identified (CY+PYs)
Cumulative Amount Recovered (CY+PYs)
IPIA Sampling -- -- -- -- -- --
Self-Reporting
$ 65,958
$ 65,958
$ 879,802
$ 879,802
$ 945,760
$ 945,760
Public Reporting
$428,572
$426,834
$1,492,954
$1,492,954
**$1,895,692
**$ 1,893,954
**Over-reported Public Reporting by $25,835 in FY 2011 - adjusted Cumulative Amount Identified and Recovered amount (CY +PYs)
Disposition of Recaptured Funds
Program or
Activity Type of
Payment (contract,
grant, benefit, loan other)
Agency Expenses to Administer
the Program
Payment Recapture
Auditor Fees
Financial Management Improvement
Activities
Original Purpose
Office of Inspector General
Returned to Treasury
CBP Mission Contract -- $819 -- $2,457 -- --
Payment Recapture Audit Targets
Program or Activity
Type of Payment (contract,
grant, benefit, loan other)
CY Amount Identified
CY Amount Recovered
CY Recovery Rate (Amount Recovered /
Amount Identified)
CY + 1 Recovery
Rate Target
CY + 2 Recovery
Rate Target
CY + 3 Recovery
Rate Target
CBP Mission Contract $3,276 $3,276 100% 100% 100% 100%
Aging of Outstanding Overpayments
Program or Activity Type of Payment (contract, grant, benefit,
loan other)
CY Amount Outstanding (0 – 6 months)
CY Amount Outstanding (6 months to 1 year)
CY Amount Outstanding (over 1 year)
CBP Mission Contract $1,738 -- -- CBP also identified amounts for recovery during the Improper Payment Information Act (IPIA) review of FY 2013 disbursements. The IPIA results are as follows (dollars in thousands):
Amounts Identified as Improper Payments
Amounts Identified for Recovery
Amounts Recovered
Custodial Refund and Drawback (R & D) $.11 -- -- Border Security Fencing ( BSF) Waived -- -- Administrative Uncontrollable Overtime (AUO) -- -- -- Hurricane Sandy Disaster Relief Funds (HSDR) -- -- --
Total $.01 -- --
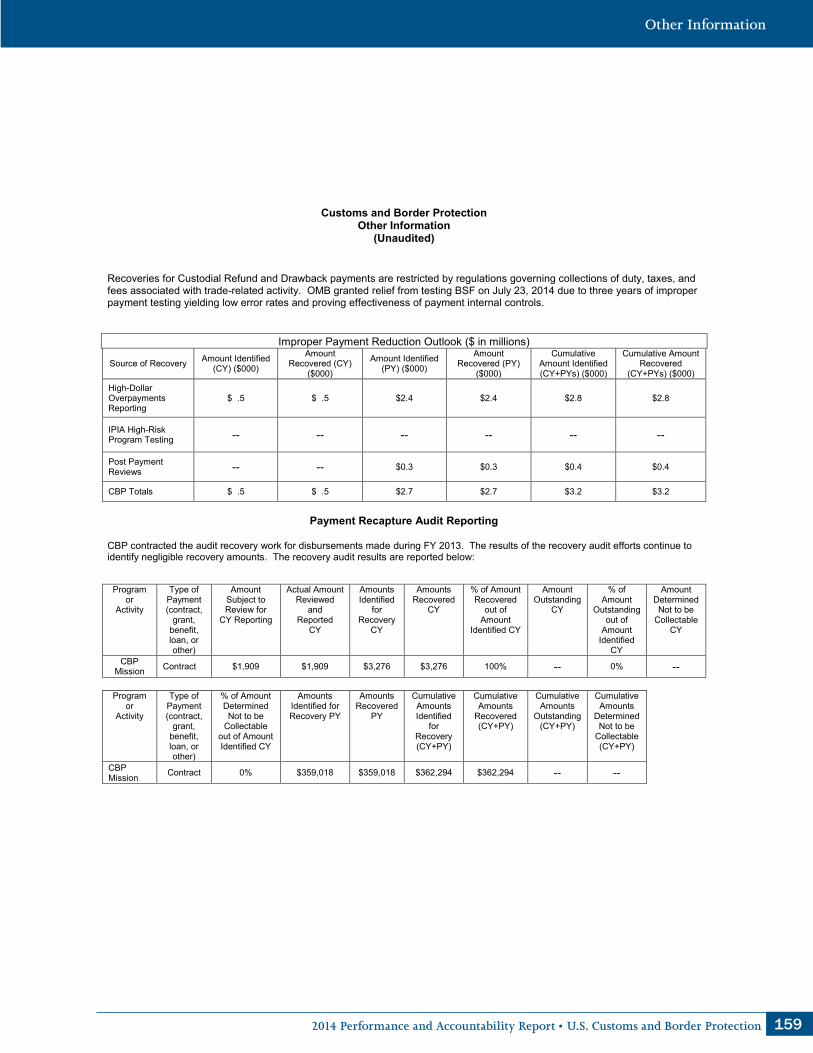
1592014 Performance and Accountability Report • U.S. Customs and Border Protection
Customs and Border Protection Other Information
(Unaudited) Recoveries for Custodial Refund and Drawback payments are restricted by regulations governing collections of duty, taxes, and fees associated with trade-related activity. OMB granted relief from testing BSF on July 23, 2014 due to three years of improper payment testing yielding low error rates and proving effectiveness of payment internal controls.
Improper Payment Reduction Outlook ($ in millions)
Source of Recovery Amount Identified (CY) ($000)
Amount Recovered (CY)
($000)
Amount Identified (PY) ($000)
Amount Recovered (PY)
($000)
Cumulative Amount Identified (CY+PYs) ($000)
Cumulative Amount Recovered
(CY+PYs) ($000) High-Dollar Overpayments Reporting
$ .5 $ .5 $2.4 $2.4 $2.8 $2.8
IPIA High-Risk Program Testing -- -- -- -- -- --
Post Payment Reviews -- -- $0.3 $0.3 $0.4 $0.4
CBP Totals $ .5 $ .5 $2.7 $2.7 $3.2 $3.2
Payment Recapture Audit Reporting
CBP contracted the audit recovery work for disbursements made during FY 2013. The results of the recovery audit efforts continue to identify negligible recovery amounts. The recovery audit results are reported below:
Program or
Activity
Type of Payment (contract,
grant, benefit, loan, or other)
Amount Subject to Review for
CY Reporting
Actual Amount Reviewed
and Reported
CY
Amounts Identified
for Recovery
CY
Amounts Recovered
CY
% of Amount Recovered
out of Amount
Identified CY
Amount Outstanding
CY
% of Amount
Outstanding out of
Amount Identified
CY
Amount Determined Not to be
Collectable CY
CBP Mission Contract $1,909 $1,909 $3,276 $3,276 100% -- 0% --
Program
or Activity
Type of Payment (contract,
grant, benefit, loan, or other)
% of Amount Determined Not to be
Collectable out of Amount Identified CY
Amounts Identified for Recovery PY
Amounts Recovered
PY
Cumulative Amounts Identified
for Recovery (CY+PY)
Cumulative Amounts
Recovered (CY+PY)
Cumulative Amounts
Outstanding (CY+PY)
Cumulative Amounts
Determined Not to be
Collectable (CY+PY)
CBP Mission Contract 0% $359,018 $359,018 $362,294 $362,294 -- --

160 U.S. Customs and Border Protection • 2014 Performance and Accountability Report
Customs and Border Protection Other Information
(Unaudited)
Improper Payment Reduction Outlook
(in millions) 2012 2012 2012 2013 2013 2013 2013 2013 2014
Program PY Outlays PY % PY $ CY
Outlays CY IP % CY IP $ CY Over- payment $
CY Under-payment $
CY + 1 est.
Outlays Refunds & Drawbacks $1,937 .36% $7 $1,473 .01% $.18 -- -- $1,338
Border Security Fencing
$ 173 <.01% -- Waived 0% -- -- -- $ 157
Administrative Uncontrollable
Overtime (AUO)
-- 0% -- $ 393 0% -- -- -- $ 393
Hurricane Sandy
Disaster Relief Funds
(HSDR)
-- 0% -- $ .28 0% -- -- -- N/A
(in millions) 2015 2015 2016 2016 2016 2017 2017 2017
Program CY + 1 IP %
CY + 1 IP $
CY + 2 est.
Outlays
CY + 2 IP %
CY + 2 IP $
CY + 3 est.
Outlays
CY + 3 IP %
CY + 3 IP $
Refunds & Drawbacks .01% $.12 $1,338 .01% $.12 $1,338 .01% $.12
Border Security Fencing
0% -- $ 213 0% -- $ 213 0% $0
Administrative Uncontrollable
Overtime (AUO)
0% -- $ 393 0% -- $ 393 0% 0%
Hurricane Sandy
Disaster Relief Funds
(HSDR)
0% -- N/A 0% -- N/A 0% 0%
The forecast of activity related to Refunds and Drawbacks depends on indeterminable factors including the volume of trade activity and various trade related issues addressed and ruled on by the Department of Commerce.
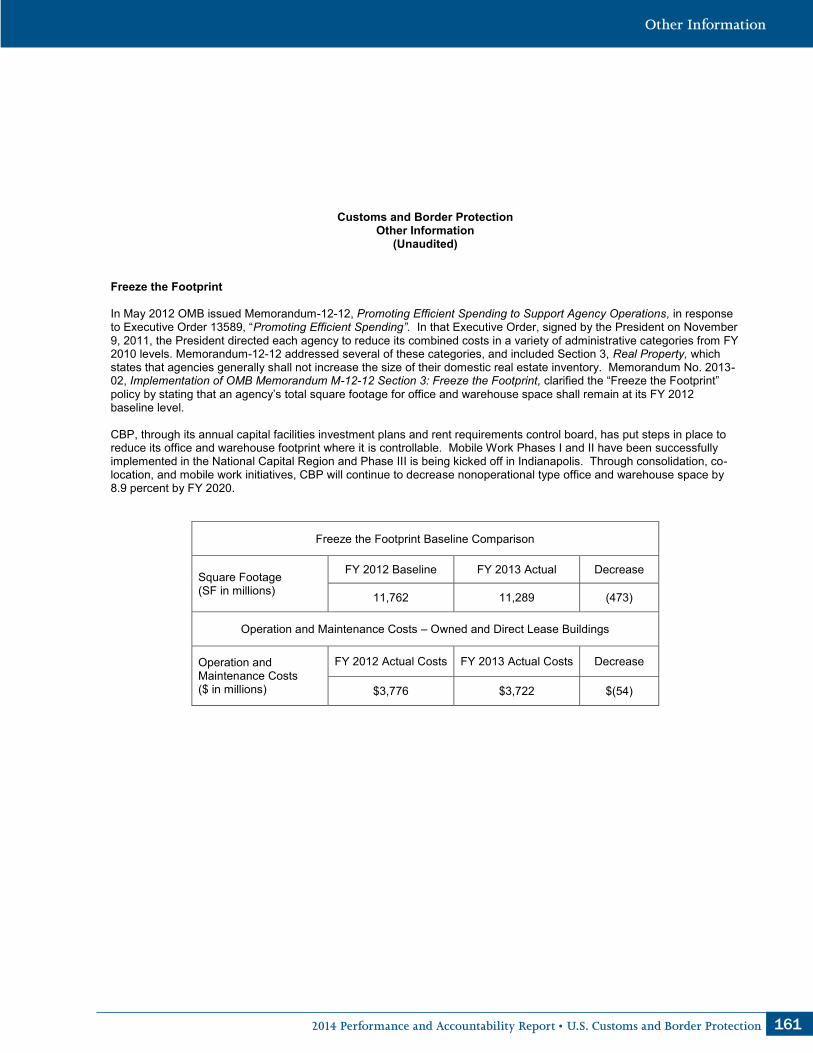
1612014 Performance and Accountability Report • U.S. Customs and Border Protection
Customs and Border Protection Other Information
(Unaudited) Freeze the Footprint In May 2012 OMB issued Memorandum-12-12, Promoting Efficient Spending to Support Agency Operations, in response to Executive Order 13589, “Promoting Efficient Spending”. In that Executive Order, signed by the President on November 9, 2011, the President directed each agency to reduce its combined costs in a variety of administrative categories from FY 2010 levels. Memorandum-12-12 addressed several of these categories, and included Section 3, Real Property, which states that agencies generally shall not increase the size of their domestic real estate inventory. Memorandum No. 2013-02, Implementation of OMB Memorandum M-12-12 Section 3: Freeze the Footprint, clarified the “Freeze the Footprint” policy by stating that an agency’s total square footage for office and warehouse space shall remain at its FY 2012 baseline level. CBP, through its annual capital facilities investment plans and rent requirements control board, has put steps in place to reduce its office and warehouse footprint where it is controllable. Mobile Work Phases I and II have been successfully implemented in the National Capital Region and Phase III is being kicked off in Indianapolis. Through consolidation, co-location, and mobile work initiatives, CBP will continue to decrease nonoperational type office and warehouse space by 8.9 percent by FY 2020.
Freeze the Footprint Baseline Comparison
Square Footage (SF in millions)
FY 2012 Baseline FY 2013 Actual Decrease
11,762 11,289 (473)
Operation and Maintenance Costs – Owned and Direct Lease Buildings
Operation and Maintenance Costs ($ in millions)
FY 2012 Actual Costs FY 2013 Actual Costs Decrease
$3,776 $3,722 $(54)

162 U.S. Customs and Border Protection • 2014 Performance and Accountability Report
Office of Inspector General (OIG) Report on MajorManagement Challenges
The DHS OIG’s report on Major Management and Performance Challenges Facing the Department of Homeland Security, OIG-15-09, dated November 14, 2014, and the agency’s progress addressing these challenges are addressed at the DHS consolidated level and are incorporated into the DHS Fiscal Year 2014 Agency Financial Report.

1632014 Performance and Accountability Report • U.S. Customs and Border Protection
Acronyms
Acronym DefinitionACE Automated Commercial EnvironmentACS Automated Commercial SystemACTT Alliance to Combat Transnational ThreatsADIS Arrival and Departure Information SystemAEO Authorized Economic OperatorAES Automated Export SystemAFI Analytical Framework for Intelligence ALM Active Lane ManagementAIS Automatic Identification SystemAMOC Air Marine Operations CenterAPC Automated Passport ControlAPHIS Animal and Plant Health Inspection ServiceAPIS Advance Passenger Information SystemARO Admissibility Review OfficeATS Automated Targeting SystemATS-AT Automated Targeting System-Anti-TerrorismATS-L Automated Targeting System-LandATS-N Automated Targeting System- InboundATS-P Automated Targeting System- PassengerBORTAC Border Patrol Tactical UnitBSDP Border Security Deployment ProgramBSFIT Border Security Fencing Infrastructure and TechnologyC3 California Corridor CampaignC3E CBP Cloud Computing Environment CBP Customs and Border ProtectionCBSA Canadian Border Services AgencyCCD Coherent Change DetectionCCUC California Corridor Unified Command CDS Consequence Delivery SystemCEE Centers of Excellence and ExpertiseCFO Chief Financial OfficerCIO Chief Information OfficerCIV Coastal Interceptor VesselsCMAA Customs Mutual Assistance AgreementCOBRA Consolidated Omnibus Budget ReconciliationCOS Chief of StaffCOSS Customs Overtime Scheduling SystemCPSC Consumer Product Safety Commission

164 U.S. Customs and Border Protection • 2014 Performance and Accountability Report
CSA Canada Self-AssessmentCSI Container Security InitiativeCTAC Commercial Targeting and Analysis CenterC-TPAT Customs Trade Partnership Against TerrorismDEA Drug Enforcement AdministrationDHS Department of Homeland SecurityDIS Digital Imaging SystemDoD Department of DefenseDOJ Department of JusticeELMO Enforcement Link Mobile OperationsEPA Environmental Protection AgencyERO Enforcement and Removal Operations ERP Enterprise Resource PlanningESTA Electronic System for Travel AuthorizationEXT Entry/Exit Transformation ProgramFAA Federal Aviation AdministrationFASAB Federal Accounting Standards Advisory BoardFAST Free and Secure TradeFBI Federal Bureau of InvestigationFDA Food and Drug AdministrationFDAU Fraudulent Document Analysis UnitFEA Federal Electronic AssetsFECA Federal Employees’ Compensation ActFEMA Federal Emergency Management AgencyFERS Federal Employees’ Retirement SystemFFMIA Federal Financial Management Improvement ActFISMA Federal Information Security Management Act of 2002FLIR Forward Looking Infrared RadiometerFM&E Facilities Management and Engineering Directorate FMFIA Federal Managers’ Financial Integrity ActFOUO For Official Use OnlyFSIS Food Safety Inspection ServiceFSU Field Support UnitFTZ Foreign Trade ZoneFY Fiscal YearFYHSP Future Year Homeland Security ProgramGAAP Generally Accepted Accounting PrinciplesGAO Government Accountability Office GMTI Ground Moving Target Indicator
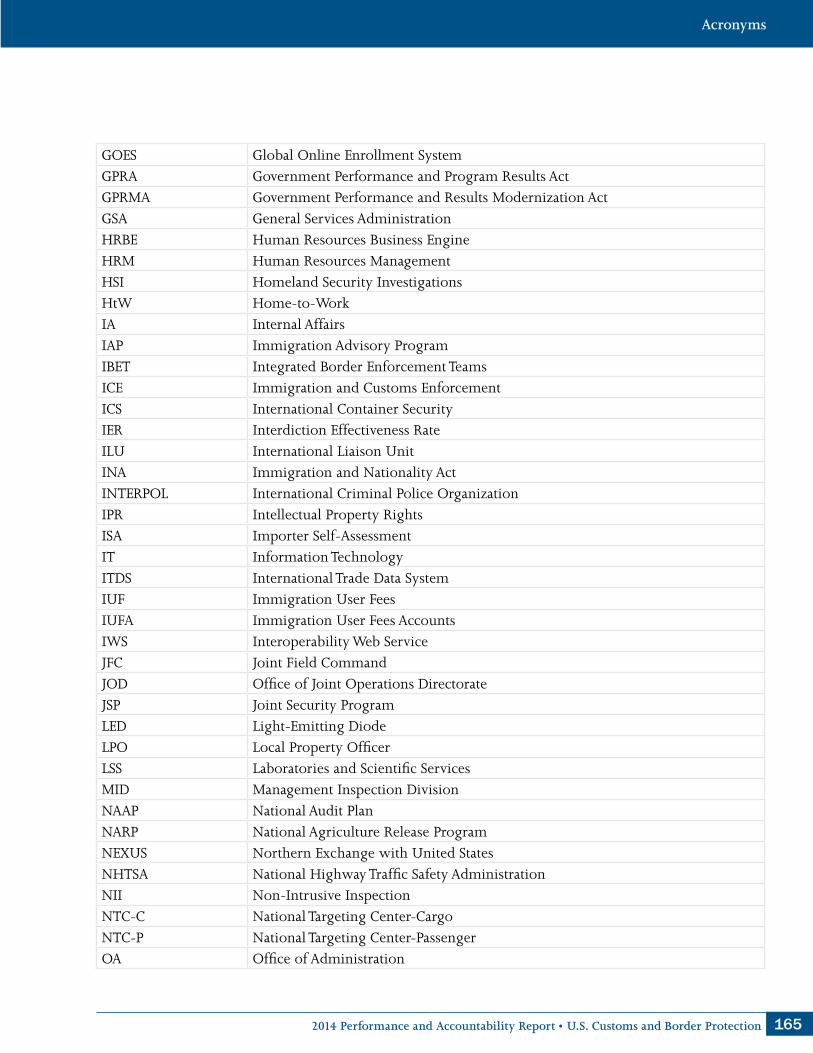
1652014 Performance and Accountability Report • U.S. Customs and Border Protection
GOES Global Online Enrollment SystemGPRA Government Performance and Program Results Act GPRMA Government Performance and Results Modernization Act GSA General Services AdministrationHRBE Human Resources Business EngineHRM Human Resources ManagementHSI Homeland Security InvestigationsHtW Home-to-WorkIA Internal AffairsIAP Immigration Advisory ProgramIBET Integrated Border Enforcement TeamsICE Immigration and Customs EnforcementICS International Container SecurityIER Interdiction Effectiveness RateILU International Liaison UnitINA Immigration and Nationality ActINTERPOL International Criminal Police OrganizationIPR Intellectual Property RightsISA Importer Self-AssessmentIT Information TechnologyITDS International Trade Data SystemIUF Immigration User FeesIUFA Immigration User Fees AccountsIWS Interoperability Web ServiceJFC Joint Field CommandJOD Office of Joint Operations DirectorateJSP Joint Security ProgramLED Light-Emitting DiodeLPO Local Property OfficerLSS Laboratories and Scientific ServicesMID Management Inspection DivisionNAAP National Audit PlanNARP National Agriculture Release ProgramNEXUS Northern Exchange with United States NHTSA National Highway Traffic Safety AdministrationNII Non-Intrusive InspectionNTC-C National Targeting Center-CargoNTC-P National Targeting Center-PassengerOA Office of Administration

166 U.S. Customs and Border Protection • 2014 Performance and Accountability Report
OAM Office of Air and MarineOBP Office of Border PatrolOCA Office of Congressional AffairsOCC Office of Chief CounselOES Office of Executive SecretariatOFO Office of Field OperationsOGA Other Government AgenciesOIG Office of Inspector GeneralOIIL Office of Intelligence and Investigative LiaisonOIP Operational Implementation PlanOIT Office of Information and TechnologyOMB Office of Management and BudgetOPA Office of Public AffairsOPD Office of Program DevelopmentOPM Office of Personnel ManagementOPP Office of Policy and PlanningOSI Office of Strategic IntegrationOT Office of International TradeOTIA Office of Technology Innovation and AcquisitionOTD Office of Training and DevelopmentOTR Office of Trade RelationsPAR Performance and Accountability ReportPDO Privacy and Diversity OfficePMF Performance Management FrameworkPOE Port of EntryPPBA Planning, Programming, Budgeting, and AccountingPPMOB Personal Property Management Oversight BoardQHSR Quadrennial Homeland Security ReviewRA Regulatory AuditReCoM Regional Coordinating MechanismRFID Radio Frequency IdentificationRTU Rail Targeting UnitSAFE Security and Accountability For EverySAP Systems, Applications, and ProductsSAR Synthetic Aperture RadarSBREFA Small Business Regulatory Enforcement Fairness ActSE Simplified EntrySENTRI Secure Electronic Network for Traveler Rapid InspectionSFFAS Statement of Federal Financial Accounting Standards

1672014 Performance and Accountability Report • U.S. Customs and Border Protection
SIP Self-Inspection ProgramSLEP Service Life Extension ProgramSLT Office of State, Local, and Tribal LiaisonSLTD Stolen Lost Travel Documents SOP Standard Operating ProceduresSTC South Texas CampaignT3U Tactical Trade Targeting UnitTACCOM Tactical Communication Modernization ProgramTCO Transnational Criminal OrganizationTOMIS Tasking, Operations, and Management Information SystemTSA Transportation Security AgencyTTC Tactical/Technical CommandUAS Unmanned Aircraft SystemUGS Unattended Ground SensorUPAX Unified PassengerU.S. United StatesUSCIS United States Citizenship and Immigration ServicesUS-VISIT U.S. Visitor and Immigration Status Indicator TechnologyVADER Vehicle and Dismounted Exploitation RadarVWP Visa Waiver ProgramWSM Workload Staffing Model

Office of Administration1331 Pennsylvania AvenueRoom 950, National Place
Washington, DC 20229
Please visit the U.S. Customs and Border Protection website at www.cbp.gov
To report suspicious activity, call1-800-BE ALERT