causes of cholera two camps 1.miasmatists (m)—foul air (fa) robert seymour, october 1, 1831
TRANSCRIPT
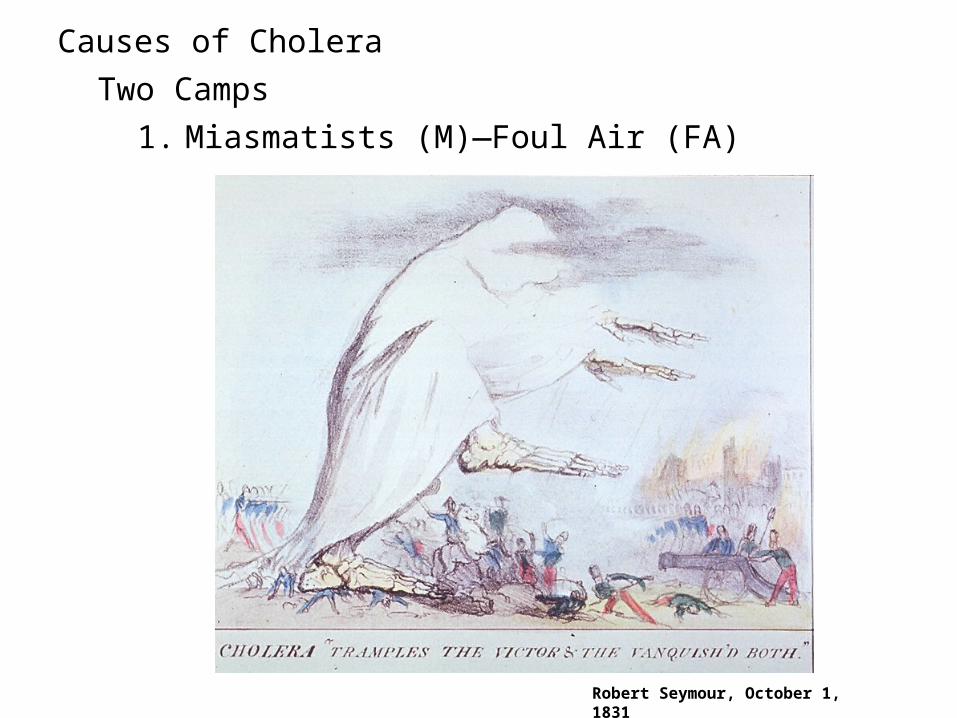
Causes of Cholera
Two Camps
1. Miasmatists (M)—Foul Air (FA)
Robert Seymour, October 1, 1831
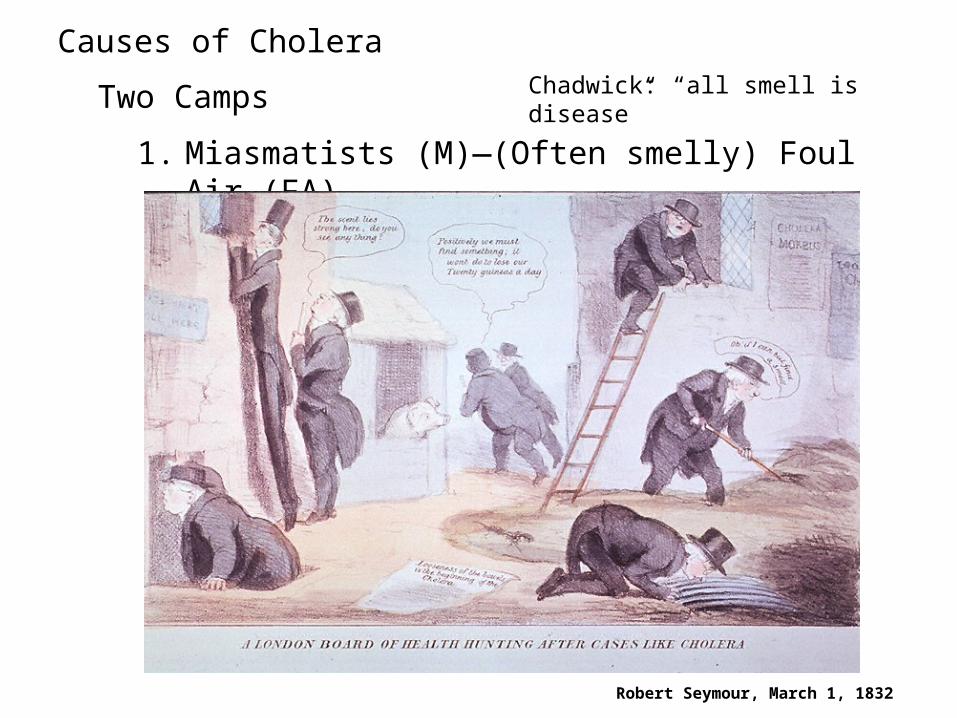
Causes of Cholera
Two Camps
1. Miasmatists (M)—(Often smelly) Foul Air (FA)
Robert Seymour, March 1, 1832
Chadwick: “all smell is disease”

George Cruickshank, 1832
It makes me sick
We shall all have the Cholera
Give us clean water
Causes of Cholera
Two Camps2. Contagionists (C)—Contaminated Water (CW)
mz)e(t
Thames

Source: Greenwood C and Greenwood J. Greenwood Map of London, 1830.
“In 1830, the Southwark Water Company was located on the South bank of the River Thames between the Southwark and London Bridges. The water intake pipe went from the company to the middle of the river, a short distance to the West of the new London Bridge, which officially opened in 1831. Later in 1845 the Southwark Water Company merged with the Vauxhall Water Company to become the Southwark and Vauxhall Water Company. At about the same time, the new company closed the former Southwark Water Company (shown below), and moved up-river to Battersea.”

Data on 1848-1849 Cholera Outbreak
The Office of the Registrar-General, created in 1838, hired William Farr to compile statistics from birth and death certificates. One of his important contributions was to set up a system for recording the causes of death.
Allowed him to create, Cholera Deaths per 10,000 people!
William Farr

SOURCE: Bingham P, NQ Verlander, and MJ Cheal, “John Snow, William Farr and the 1849 Outbreak of Cholera that Affected London,” Public Health. 2004; 118(6):387-94

George Cruickshank, 1832

Hammersmith Bridge
Battersea Bridge
Vauxhall Bridge
NThe Thames runs from West to East
Waterloo Bridge
Kew Bridge
WaterCL
= 1 if the district’s water company drew its water from the Thames between Battersea Bridge and Waterloo Bridge
= 0 otherwise
Southwark Bridge
London Bridge
≈1845

0 10 20 30 40 50 60 70 80 90 1000
20
40
60
80
100
120
140
160
180
200
220
Elevation above High Water (# feet)
Ch
oler
a D
eath
s (#
per
10,
000
peo
ple
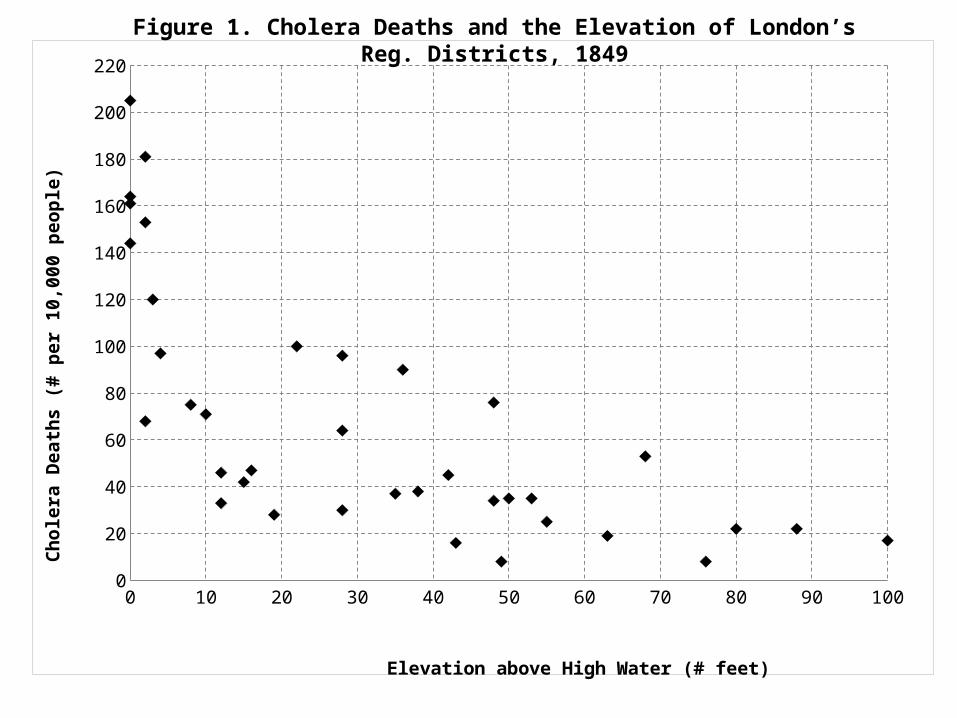
)Figure 1. Cholera Deaths and the Elevation of London’s Reg. Districts, 1849

Dependent Variable: Cholera Deaths per 10,000 people
Explanatory Variables (1) (2) (3)
Elevation above HighWater (# feet)
-1.326*** -0.730** -0.647**(5.72) (2.63) (2.36)
Water Intake in CentralLondon (yes=1)
80.73*** 52.136*** 48.570***
(6.19) (3.21) (3.05)
Average House Value (£ per year)
-0.306*
(1.72)
Constant 110.101*** 41.52*** 74.128*** 86.660***
(11.27) (5.59) (5.23) (5.56)
Observations 37 37 37 37
R-squared 0.483 0.522 0.603 0.636
Absolute value of t statistics in parentheses
* significant at 10%; ** significant at 5%; *** significant at 1%
Table 1. What Explains Cholera Deaths in London in 1849?

0 10 20 30 40 50 60 70 80 90 1000
20
40
60
80
100
120
140
160
180
200
220
Elevation above High Water (# feet)
Ch
oler
a D
eath
s (#
per
10,
000
peo
ple
)
)72.5(
326.1101.110 ElevationCDeaths ^OLS Fitted Line
Interpretation of the slope: each additional foot of elevation is associated, on average, with 1.3 fewer cholera deaths per 10,000 people.
0 10 20 30 40 50 60 70 80 90 1000
20
40
60
80
100
120
140
160
180
200
220
Elevation above High Water (# feet)
Ch
oler
a D
eath
s (#
per
10,
000
peo
ple
)Figure 1. Cholera Deaths and the Elevation of London’s Reg. Districts, 1849

0 10 20 30 40 50 60 70 80 90 1000
20
40
60
80
100
120
140
160
180
200
220
Elevation above High Water (# feet)
Ch
oler
a D
eath
s (#
per
10,
000
peo
ple
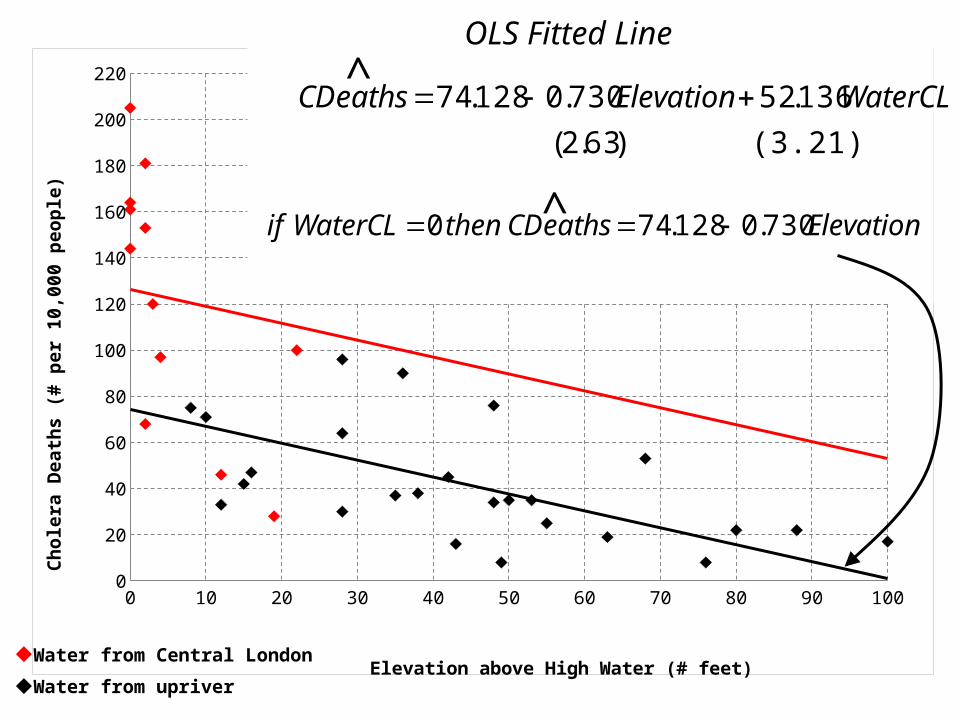
)Figure 2. Cholera Deaths, Elevation and Water Supply of London’s Reg. Districts, 1849
Water from Central London
Water from upriver
0 10 20 30 40 50 60 70 80 90 1000
20
40
60
80
100
120
140
160
180
200
220
Elevation above High Water (# feet)
Ch
oler
a D
eath
s (#
per
10,
000
peo
ple
)
Water from Central London
Water from upriver
^OLS Fitted Line
(3.21) )63.2(
136.52730.0128.74 WaterCLElevationCDeaths
ElevationCDeathsthenWaterCLif 730.0128.74 0 ^

0 10 20 30 40 50 60 70 80 90 1000
20
40
60
80
100
120
140
160
180
200
220
Elevation above High Water (# feet)
Ch
oler
a D
eath
s (#
per
10,
000
peo
ple
)
Water from Central London
Water from upriver
^OLS Fitted Line
(3.21) )63.2(
136.52730.0128.74 WaterCLElevationCDeaths
ElevationCDeathsthenWaterCLif 730.0264.126 1 ^
52.136
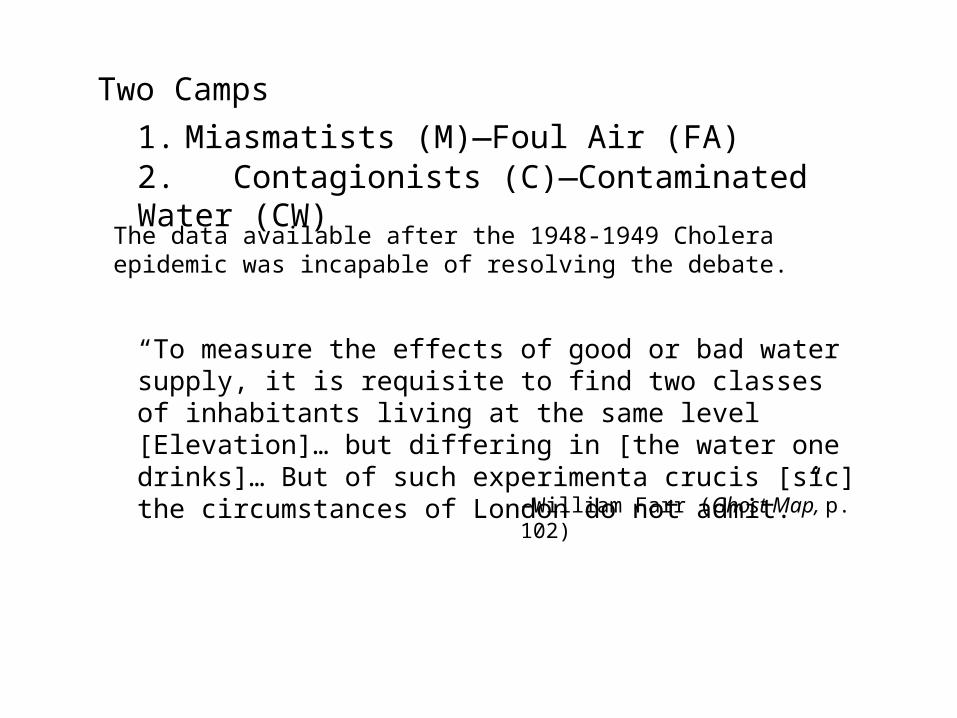
Two Camps
1. Miasmatists (M)—Foul Air (FA)2. Contagionists (C)—Contaminated Water (CW)
The data available after the 1948-1949 Cholera epidemic was incapable of resolving the debate.
“To measure the effects of good or bad water supply, it is requisite to find two classes of inhabitants living at the same level [Elevation]… but differing in [the water one drinks]… But of such experimenta crucis [sic] the circumstances of London do not admit.”
–William Farr (Ghost Map, p. 102)

Tuesday, September 5
—————
ALL SMELL IS DISEASEEDWIN CHADWICK
The first solid cause for home began to filter through the neighborhood Tuesday morning. For the first time in four days, Henry Whitehead let himself believe that this terrible visitation might finally be passing. The wife of Mr. G, the tailor, had died that morning, but for every new death, Whitehead could point to another dramatic recovery. The servant woman he had been tending to since Friday had risen from what she had assumed would be her deathbed, her pallor much improved. Two adolescents—a boy and girl—had also turned the corner, much to the delight of their remaining family. All three of them attributed their recovery to one thing: they had consumed large quantities of water from the Broad Street pump since falling ill. The speed and intensity of their recovery made an impression on Whitehead that would linger in his mind through the coming weeks.

b) The Exemption Proves the Rule
2. Broad Street Pump
Evidence that Cholera was waterborne from the 1854 Cholera Epidemic
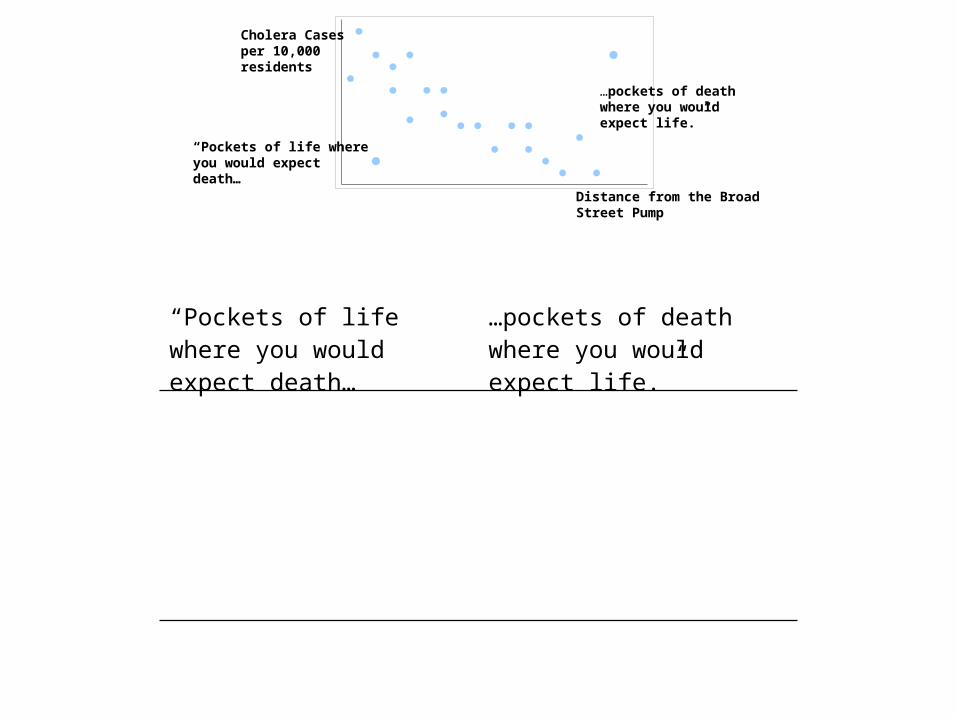
Distance from the Broad Street Pump
Cholera Cases per 10,000 residents
“Snow knew that the case would be made in the exceptions to the rule.” (The Ghost Map, p. 140)
“Pockets of life where you would expect death…
…pockets of death where you would expect life.”
Distance from the Broad Street Pump
Cholera Cases per 10,000 residents
“Pockets of life where you would expect death…
…pockets of death where you would expect life.”
“Pockets of life where you would expect death…
…pockets of death where you would expect life.”

Distance from Broad Street Pump (miles)
Cholera Cases per 10,000 residents
“Pockets of life where you would expect death…
…pockets of death where you would expect life.”
“Pockets of life where you would expect death… …pockets of death where you would expect life.”
St. James Workhouse—93 deaths per 10,000 residents (5/535) because water supplied by Grand Junction Waterworks
Susannah Eley—93 deaths per 10,000 residents (5/535) because water supplied by Grand Junction Waterworks
Lion Brewery—no deaths among 70 workers because private pipeline and beer drinkers
5 deaths
no deaths
Eley Brothers Factory—18 deaths
Eley Factory
Work House
Brewery 1 2
Susannah lived in Hempstead
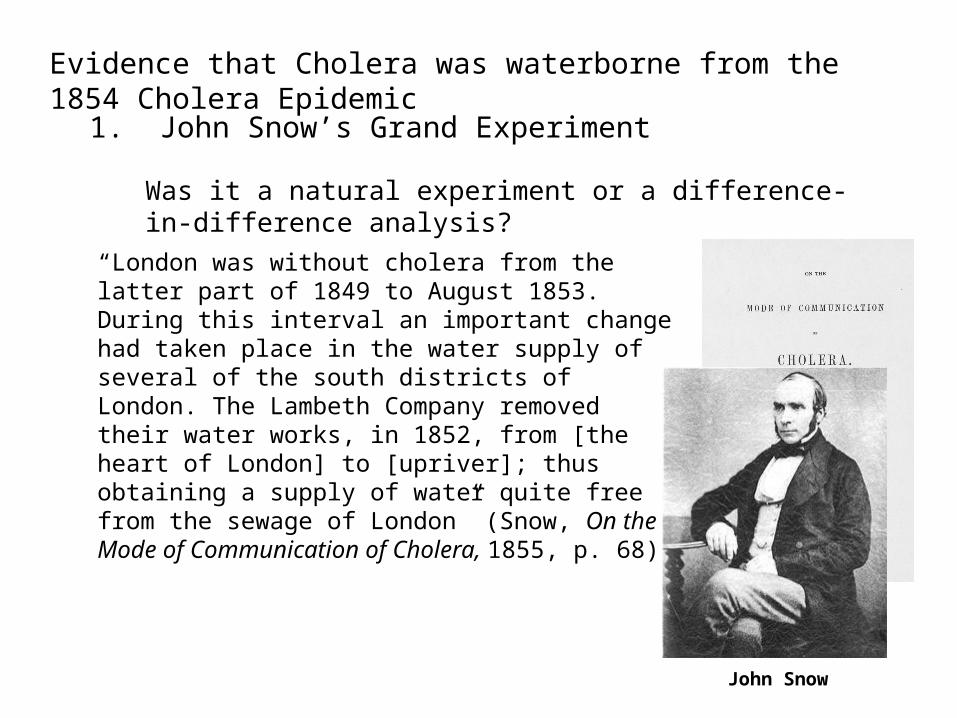
Evidence that Cholera was waterborne from the 1854 Cholera Epidemic
1. John Snow’s Grand Experiment
Was it a natural experiment or a difference-in-difference analysis?
“London was without cholera from the latter part of 1849 to August 1853. During this interval an important change had taken place in the water supply of several of the south districts of London. The Lambeth Company removed their water works, in 1852, from [the heart of London] to [upriver]; thus obtaining a supply of water quite free from the sewage of London” (Snow, On the Mode of Communication of Cholera, 1855, p. 68).
John Snow

Battersea Bridge
NThe Thames runs from West to East
Southwark Bridge
London Bridge
moved≈1845
Moved in 1852
Seething Wells Intake
Seething Wells was beyond the tidal reach of the Thames
Southwark & Vauxhall Water Company (S&V)
Lambeth Waterworks

“The experiment ...was on the grandest scale. No fewer than three hundred thousand people of both sexes, of every age and occupation, and of every rank and station, from gentle folks down to the very poor, were divided into two groups without their choice, and, in most cases, without their knowledge; one group being supplied with water containing the sewage of London [S&V], and the other group having water quite free from such impurity [Lambeth Company]”
31 subdistricts
12 served by S&V only
3 served by Lambeth only
Not random
100 cholera cases per 10,000 residents
≈ 0 cases
“relatively well-to-do suburbs”
“smog-bound
industrial zones”
16 served by both companies
≈ random via natural experiment
pipes—promiscuously interlinked households—assigned w/o knowledge
S&V households
Lambeth households
315 cases per 10,000 residents
37 cases per 10,000 residents
Same income & elevation

Table. Cholera Deaths in 16 Sub-Districts Served by 2 Water Companies, 1854
Households Deaths
(#) (#) (# per 10,000)
S&V (intake in heart of London)
40,046 1,263 315
Lambeth (intake upriver)
26,107 98 37
Rest of London 256,423 1,422 59
“In 1849 when cholera was last present in London, mortality due to cholera was similar among persons supplied by the Lambeth Company and the Southwark and Vauxhall Company.”
Epidemiologist Ralph Frerichs

0 1 2 3 40
50
100
150
200
250
300
350
400
450
500
550
600
650
700
S&VLambeth
1849 1852 1854
Lambeth moved its intake pipe from downriver to upriver.
37
Deaths per 10,000 households
315
If the subdistricts that Lambeth served exclusively were “relatively well-to-do suburbs” then it seems plausible that it might have served relatively well-off households in the areas served by both companies (i.e., the households on the border)…
Increased risk due to foul water:
A
B
CD
Natural experiment
A – B
Difference-in-difference
1849 epidemic was more severe
(A – B) – (C – D)
Validity rests on assignment within the natural experiment being truly random
Controls for the potential non-randomness

“The DD idea was probably pioneered by physician John Snow (1855), who studied cholera epidemics in London in the mid-nineteenth century.”

Friday, September 8
—————
THE PUMP HANDLE
“DEATH’S DISPENSARY”
On Thursday night, the Board of Governors of St. James Parish had held an emergency meeting to discuss the ongoing outbreak and the neighborhood’s response. Halfway into the meeting, they received notice that a gentleman wished to address them. It was John Snow, armed with his survey of the past week’s devastation. He stood before them, and in his odd, husky voice told them that he knew the cause of the outbreak, and could prove convincingly that the great majority of cases in the neighborhood could be traced to its original source. It is unlikely that Snow went into the intricacies of his broader case against the miasma theory—better to go straight to the telling patterns of death and life, leave the philosophizing for another day. He explained the dismal ratios of survival among the people living near the pump, and the unusual exemptions granted to people who had not drunk the water.

He told the Board of Governors of deaths that had transpired far from Golden Square, connected to the area only by the consumption of Broad Street water. He may have told them of the brewery or the workhouse on Poland Street. Death after death after death had been linked to the water at the base of the Broad Street well. And yet the pump remained in active use.
The members of the Board were skeptical. They knew as well as any other locals how highly regarded the Broad Street water was—particularly as compared to the other nearby pumps. But they also knew firsthand the smells and noxious fumes that were rampant in the neighborhood; surely these were more responsible for the outbreak than the reliable Broad Street water. Yet Snow’s argument was persuasive—and,, besides, they had few other options. If Snow was wrong, the neighborhood might go thirsty for a few weeks. If he was right, who knew how many lives they might save? And so, after a quick internal consultation, the Board voted that the Broad Street well should be closed down.

2. Broad Street Pump
Evidence that Cholera was waterborne from the 1854 Cholera Epidemic

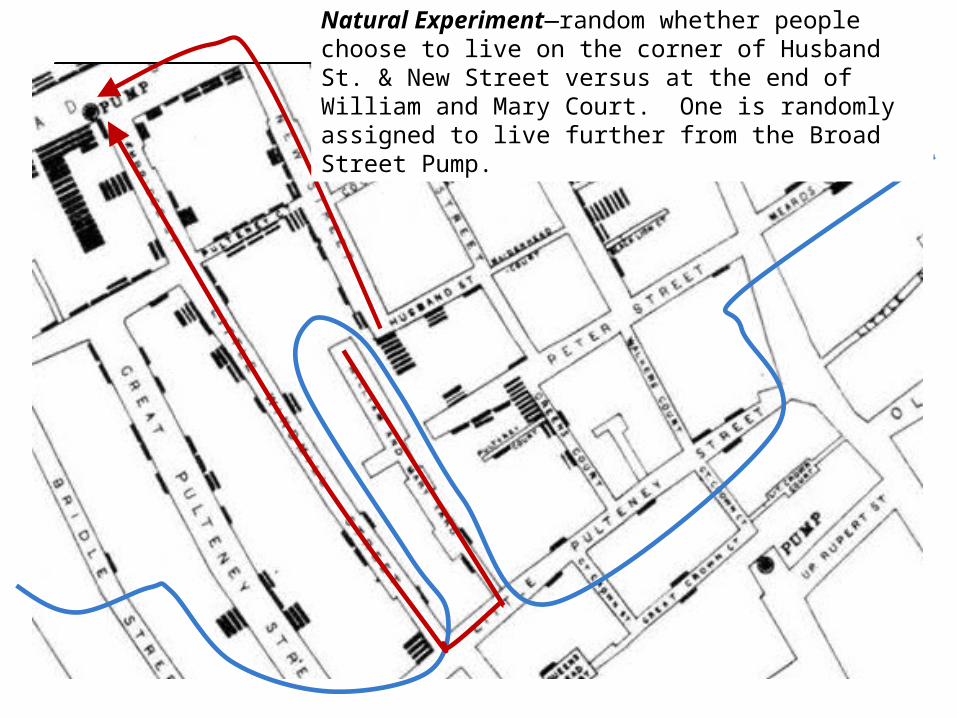
a) Spatial Pattern of Deaths
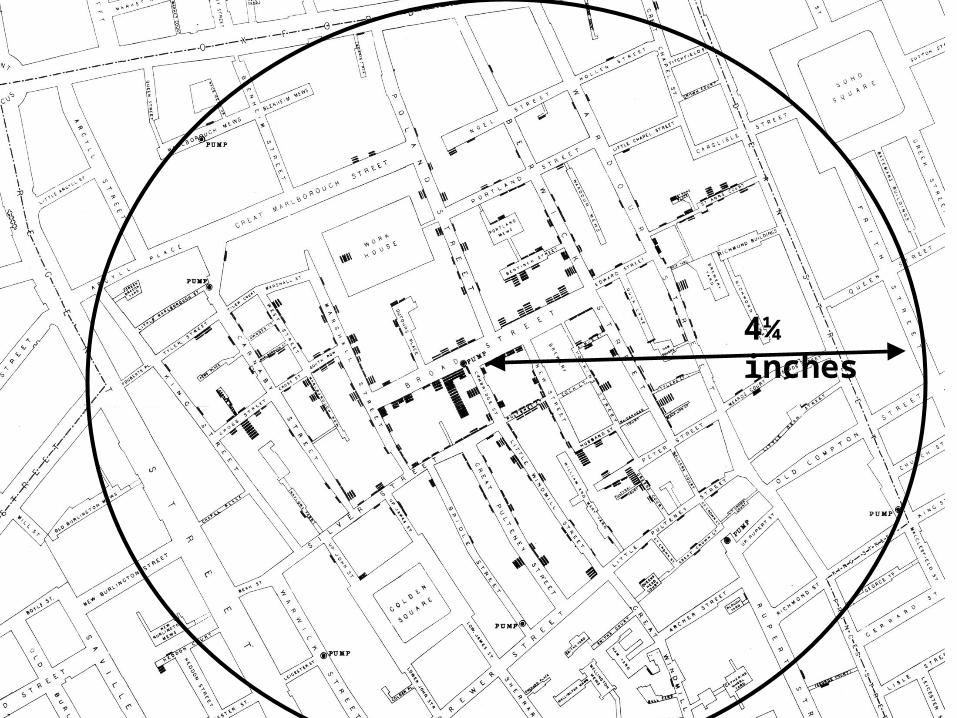
4¼ inches

a) Spatial Pattern of Deaths
a) Spatial Pattern of Deaths
Natural Experiment—random whether people choose to live on the corner of Husband St. & New Street versus at the end of William and Mary Court. One is randomly assigned to live further from the Broad Street Pump.
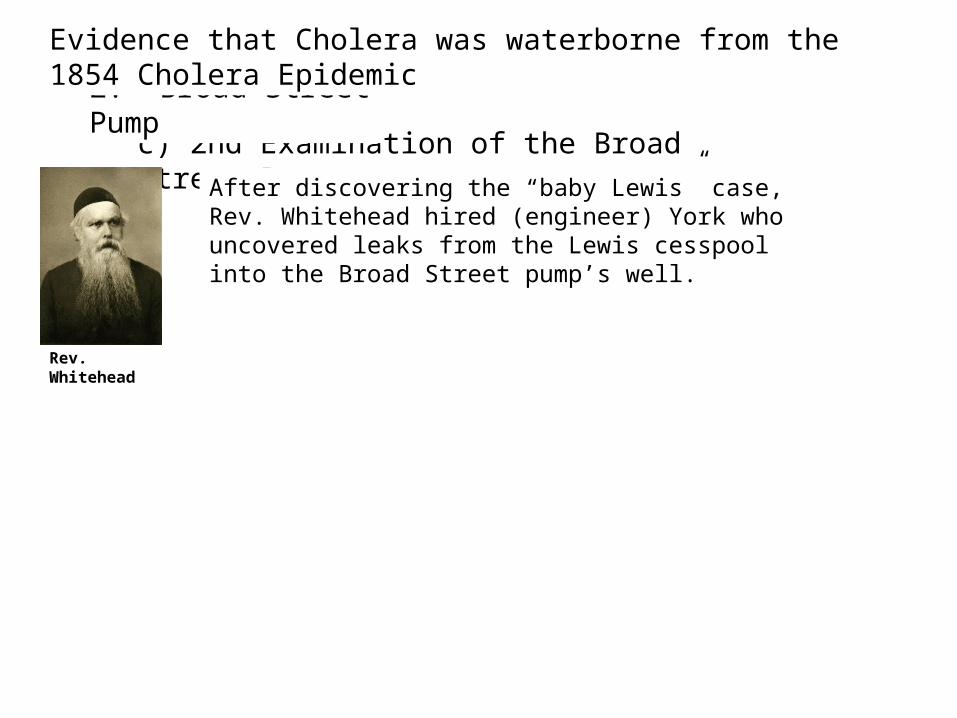
c) 2nd Examination of the Broad Street Pump.
2. Broad Street Pump
Evidence that Cholera was waterborne from the 1854 Cholera Epidemic
After discovering the “baby Lewis” case, Rev. Whitehead hired (engineer) York who uncovered leaks from the Lewis cesspool into the Broad Street pump’s well.
Rev. Whitehead