categorical representation of visual stimuli in the primate prefrontal cortex
TRANSCRIPT
REPORTS
higher titer vector, whereas the three births, including the transgenic one, and the blighted pregnancy originated from the lower titer LNEFEGFP-(VSV-G) vector (10' cfulml; Table I) . Although only one live offspring is shown to be transgenic, we cannot yet ex-clude the possibility of transgenic mosaics in the others. We have neither demonstrated germline transmission nor the presence of transgenic sperm; this must await ANDi's development through puberty in about 4 years. Vector titers and volume injected may play crucial roles in gene transfer efficiency. These offspring and their surrogates are now housed in dedicated facilities with ongoing, stringent monitoring.
Nonhuman primates are invaluable models for advancing gene therapy treatments for dis- eases such as Parlunson's (24) and diabetes (25), as well as ideal models for testing cell therapies (26) and vaccines, including those for HIV (27, 28). Although we have demonstrated transgene introduction in rhesus monkeys, sig- nificant hurdles remain for the successful ho- mologous recombination essential for gene tar- geting (29). The molecular approaches for mak- ing clones [either by embryo splitting (30) or nuclear transfer (31-36)], utilizing stem cells (37-39), and now producing transgenic mon- keys, could be combined to produce the ideal models to accelerate discoveries and to bridge the scientific gap between transgenic mice and humans.
References and Notes 1. M. j. Blouin et a[., Nature Med. 6, 177 (2000). 2. R. L. Eckert et al., Int. J. Oncol. 16, 853 (2000). 3. H. M. Hsieh-Li et a[., Nature Genet. 24, 66 (2000). 4. A. M. Murphy et al., Science 287, 488 (2000). 5. E. J. Weinstein et al., Mol. Med. 6, 4 (2000). 6. j. A. Thomson, V. S. Marshall, Curr. Topics Dev. Biol.
38, 133 (1998). 7. A. W. S. Chan et al., Mol. Hum. Reprod. 6. 26 (2000). 8. K. R. Chien, J. Clin. Invest. 98, S19 (1996). 9. R. P. Erickson, BioEssays 18, 993 (1996).
10. A. W. S. Chan et al., Proc. Natl. Acad. Sci. U.S.A. 95, 14028 (1998).
11. J. K. Yee et al., Methods Cell Biol. 43, 99 (1994). 12. The CFP vector was injected into the perivitelline
space (10) of in vivo matured rhesus oocytes (40), fertilized by lCSl 6 hours later. Embryos at the four- to eight-cell stage were selected for embryo transfer on the basis of morphology. Surrogate females were selected on the basis of serum estradiol and proges- terone levels (15).
13. The CFP gene from plasmid pECFP-N1 was inserted into the retroviral vector pLNCX using standard re- combinant DNA techniques [Web supplement 1 (47)l.
14. 0oYytes for electron microscopy were fixed in lto- Karnovsky's fixative [Web supplement 2 (41)].
15. L. Hewitson et al., Hum. Reprod. 13, 2786 (1998). 16. L. Hewitson et al., Nature Med. 5. 431 (1999). 17. Cenomic DNA was extracted from tissues obtained
from the stillbirths [Web supplement 3 (41)]. 18. PCR was performed using specific primers that am-
plify the flanking region of the GFP gene. Provirus was detected by using a primer set specific to the unique LTR region of genomic integrated virus. Trans- gene was detected by standard reverse transcription followed by PCR [Web supplement 4 (47)].
19. Southern analysis was performed using genomic DNA followed by restriction enzyme digestion using a
unique site within the vector and detected by a CFP [32P]-labeled probe [Web supplement 5 (41)].
20. B. Schott et a[., Nucleic Acid Res. 25, 2940 (1997). 21. N. Chinnasamy et al., Hum. Gene Ther. 11, 1901
(2000). 22. Biopsied tissues were snap frozen, sectioned, fixed,
and imaged with anti-CFP using rhodamine-conju- gated anti-mouse (IgC) secondary antibody [Web supplement 6 (41)].
23. T. Roe et al., EMBO I . 12, 2099 (1993). 24. J. H. Kordower et al., Science 290, 767 (2000). 25. H. C. Lee et al., Nature 408, 483 (2000). 26. D. H. Barouch et al., Proc. Natl. Acad. Sci. U.S.A. 97,
4192 (2000). 27. M. 1. Kuroda et a[., J. Virol. 74, 8751 (2000). 28. N. Nathanson et a[., AIDS (suppl. A) 13, 51 13 (1999). 29. U. Muller, Mech. Dev. 82, 1 (1999). 30. A. W. S. Chan et al., Science 287, 317 (2000). 31. 1. Wilmut et a[., Nature 385, 810 (1997). 32. J. B. Cibelli et al., Science 280, 1256 (1998). 33. T. Wakayama et dl., Nature 394, 369 (1998). 34. D. P. Wolf et al., Biol. Reprod. 60, 199 (1999). 35. A. Onishi et al., Science 289, 1188 (2000). 36. 1. A. Polejaeva et dl., Nature 407, 86 (2000). 37. 1. A. Thomson et al., Proc. Natl. Acad. Sci. U.S.A. 92,
7844 (1995).
38. M. J. Shamblott et a[., Proc. Natl. Acad. Sci. U.S.A. 95, 13726 (1998).
39, J. A. Thomson et a[., Science 282, 1145 (1998). 40. C. J. Wu et a[., Biol. Reprod. 55, 269 (1996). 41. Supplementary figures are available at www.
sciencemag.org/cgi/content/fuILl291/5502/3091 --a
UC I. 42. A. W. S. Chan, K. Y. Chong, C. Martinovich, C. Simerly,
C. Schatten, data not shown. 43. We thank J. C. Burns (University of California San
Diego); B. True (University of Wisconsin-Madison); K. Wells (U.S. Department of Agriculture); Chiron Inc.; and all at the Oregon Regional Primate Research Center (ORPRC), especially M. Axthelm, J. Bassir,J. M. Cook, N. Duncan, M. Emme, J. Fanton, A. Hall, L. Hewitson, D. Jacob, E. jacoby, A. Lewis, C. M. Luetjens, C. Machida, C. Macginnis, 8. Mason, T. Swanson, D. Takahashi. K. Tice, J. Videoff, M. Webb, and S. WonE. Procedures approved bythe Oregon Health sciences UniversityIORPRC Animal Care and Biosafety Com- mittees. Supported by NIHlNational Center for Re- search Resources (NCRR) (ORPRC; M. S. Smith, Direc- tor) and grants (NCRR, National Institute of Child Health and Human Development to C.S.).
7 November 2000: accepted 14 December 2000
Categorical Representation of Visual Stimuli in the Primate
Prefrontal Cortex David J. Freedman,1,2,5 Maximilian Riesenh~ber ,~*~,~
Tomaso P o g g i ~ , ~ * ~ v ~ Earl K. Miller1,2,5*
The ability t o group stimuli into meaningful categories is a fundamental cog- nitive process. To explore its neural basis, we trained monkeys t o categorize computer-generated stimuli as "cats" and "dogs." A morphing system was used t o systematically vary stimulus shape and precisely define the category bound- ary. Neural activity in the lateral prefrontal cortex reflected the category of visual stimuli, even when a monkey was retrained with the stimuli assigned t o new categories.
Categorization refers to the ability to react sim- ilarly to stimuli when they are physically dis- tinct, and to react differently to stimuli that may be physically similar (I). For example, we rec- ognize an apple and a banana to be in the same category (food) even though they are dissimilar in appearance, and we consider an apple and a billiard ball to be in different categories even though they are similar in shape and sometimes color. Categorization is fundamental; our raw perceptions would be useless without our clas- sification of items as furniture or food. Al- though a great deal is known about the neural analysis of visual features, little is known about the neural basis of the categorical information that gives them meaning.
'Center for learn in^ and Memory, ZRIKEN-MIT Neu- roscience Research Center, 3~en<er for Biological and Computational Learning, 4McCovern Institute for Brain Research, 5Department of Brain and Cognitive Sciences. Massachusetts lnstltute of Technoloev.
u,
cambridge, MA 02139, USA.
* T ~whom correspondence should be addressed. E-mail: [email protected]
In advanced animals, most categories are learned. Monkeys can learn to categorize stim- uli as animal or non-animal (2), food or non- food (3), tree or non-tree, fish or non-fish (41, and by ordinal number (5). The neural correlate of such perceptual categories might be found in brain areas that process visual form. The infe- rior temporal (IT) and prefrontal (PF) cortices are likely candidates; their neurons are sensitive to form (6-9) and they are important for a wide range of visual behaviors (10-12).
The hallmark of perceptual categorization is a sharp "boundary" (13). That is, stimuli from different categories that are similar in appear- ance (e.g.. applebilliard ball) are treated as different, whereas distinct stimuli within the same category (e.g., applebanana) are treated alike. Presumablv. there are neurons that also represent such sharp distinctions, n i s is diffi-
assess with a subset of a large' amorphous category (e.g.5 food, human. etc). Because the category boundary is unknown, it is unclear whether neural activity reflects cate- gory membership or physical similarity.
312 12 JANUARY 2001 VOL 291 SCIENCE www.sciencemag.org
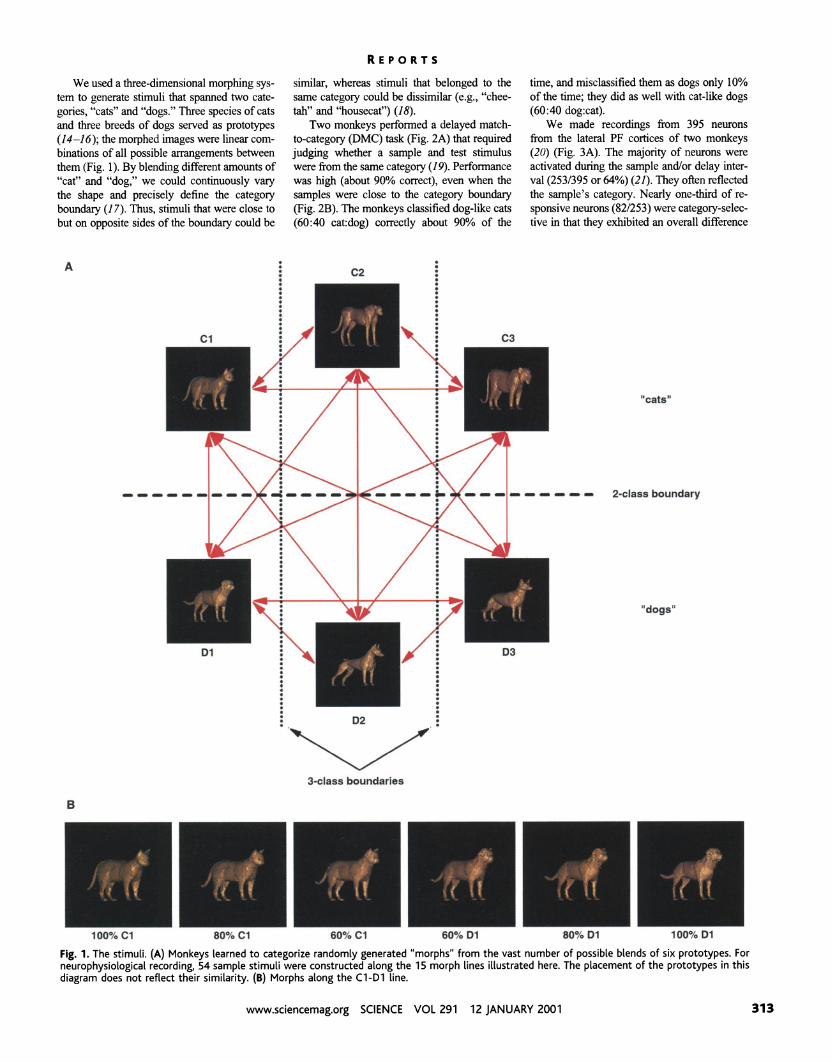
We used a three-dimensional morphing sys- tem to generate stimuli that spanned two cate- gories, "cats" and "dogs." Three species of cats and three breeds of dogs served as prototypes (14-1 6); the morphed images were linear com- binations of all possible arrangements between them (Fig. 1). By blending different amounts of "cat" and "dog," we could continuously vary the shape and precisely define the category boundary (1 7). Thus, stimuli that were close to but on opposite sides of the boundary could be
similar, whereas stimuli that belonged to the same categoIy could be dissimilar (e.g., "chee- tah" and "housecat") (18).
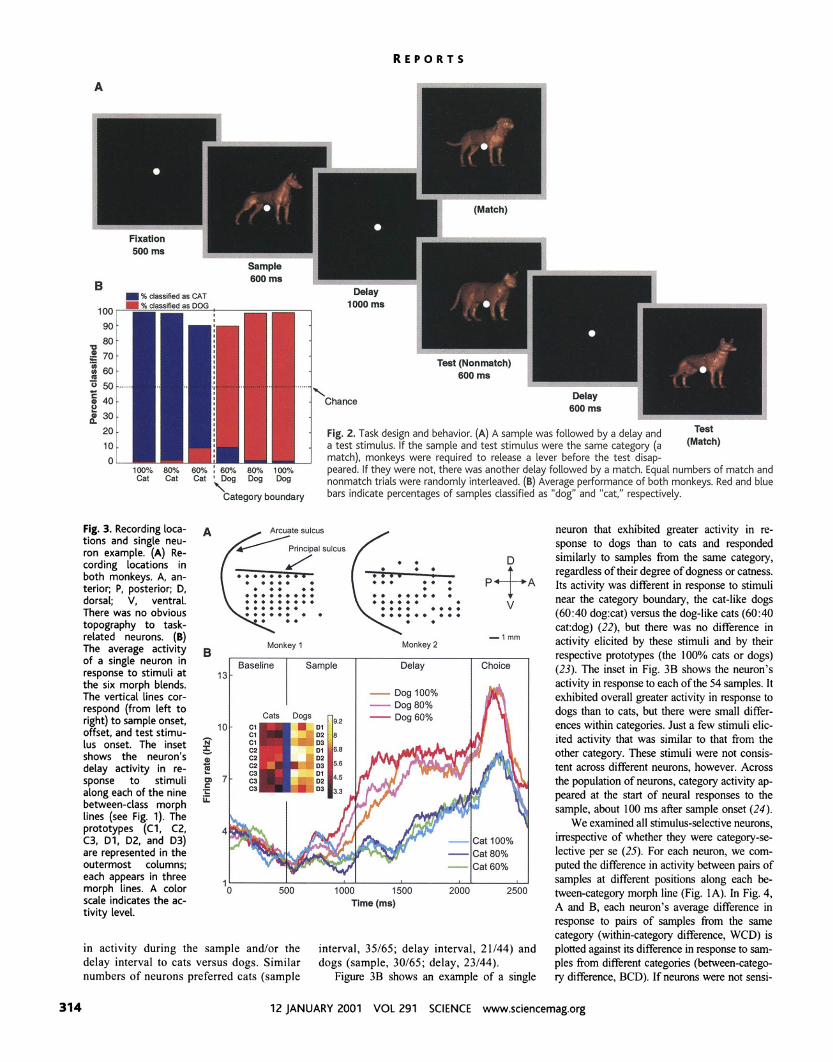
Two monkeys performed a delayed match- to-category (DMC) task (Fig. 2A) that required judging whether a sample and test stimulus were from the same category (19). Performance was high (about 90% correct), even when the samples were close to the category boundary (Fig. 2B). The monkeys classified dog-like cats (60:40 cat:dog) correctly about 90% of the
time, and misclassified them as dogs only 10% of the time; they did as well with cat-like dogs (60:40 dog:cat).
We made recordings from 395 neurons from the lateral PF cortices of two monkeys (20) (Fig. 3A). The majority of neurons were activated during the sample andlor delay inter- val (2531395 or 64%) (21). They often reflected the sample's category. Nearly one-third of re- sponsive neurons (821253) were category-selec- tive in that they exhibited an overall difference
2clws boundary
"dog."
Fig. 1. The stimuli. (A) Monkeys learned to categorize randomly generated "morphs" from the vast number of possible blends of six prototypes. For neurophysiological recording, 54 sample stimuli were constructed along the 15 morph lines illustrated here. The placement of the prototypes in this diagram does not reflect their similarity. (B) Morphs along the C1-Dl line.
www.sciencernag.org SCIENCE VOL 291 12 JANUARY 2001
R E P O R T S
I
jt (Nonrnatch) 60Dm I
Fig. 2. Task design and behavior. (A) A sample was followed by a delay and '-
ma a test stimulus. If the sample and test stimulus were the same category (a match), monkeys were required to release a lever before the test disap-
row aolrc : evn I- peared. If they were not, there was another delay followed by a match. Equal numben of match and ' Dog Dog Dog nonmatch trials were randomly interleaved. (B) Average performance of both monkeys. Red and blue
bMd.w bats indicate percentages of samples dassified as "dogu and "cat," respectively.
Fig. 3. Recording loca- tions and single neu- ron example. (A) Re- cording locations in both monkeys. A, an- terior; P, posterior; D, dorsal; V, ventral. There was no obvious topography to task- related neurons. (B) The average activitv Monkey 2
P of a singleneuron in Baseline Sample Delay response to stimuli at 13
Choh
the six morph blends. The vertical lines cor- respond (from left to right) to sample onset, offset, and test stimu- lus onset. The inset shows the neuron's delay activity in re- sponse to stimuli along each of the nine between-class morph lines (see Fig. 1). The prototypes (Cl, C2, C3, Dl, D2, and D3) are represented in the outermost columns; each appears in three morph lines. A color scale indicates the ac- tivity level.
llm (ms)
in activity during the sample and/or the interval, 35/65; delay interval, 21/44) and delay interval to cats versus dogs. Similar dogs (sample, 30165; delay, 23/44). numbers of neurons preferred cats (sample Figure 3B shows an example of a single
neuron that exhibited greater activity in re- sponse to dogs than to cats and responded similarly to samples from the same category, regardless of their degree of dogness or catness. Its activity was different in response to stimuli near the category boundary, the cat-like dogs (60:40 dog:cat) versus the dog-like cats (60:40 cat:dog) (22), but there was no difference in activity elicited by these stimuli and by their respective prototypes (the 100% cats or dogs) (23). The inset in Fig. 3B shows the neuron's activity in response to each of the 54 samples. It exhibited overall greater activity in response to dogs than to cats, but there were small differ- ences within categories. Just a few stimuli elic- ited activity that was similar to that from the other category. These stimuli were not consis- tent across different neurons, however. Across the population of neurons, category activity ap- peared at the start of neural responses to the sample, about 100 ms after sample onset (24).
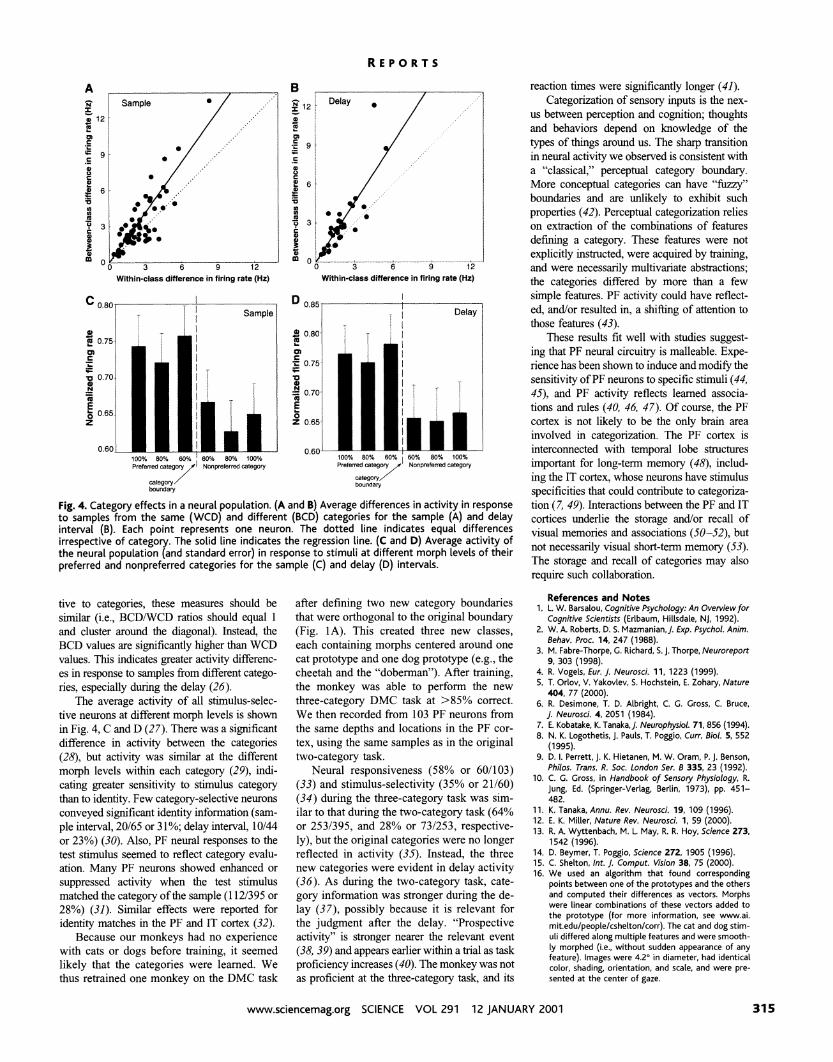
We examined all stimulus-selective neurons, irrespective of whether they were category-se- lective per se (25). For each neuron, we com- puted the difference in activity between pairs of samples at different positions along each be- tween-category morph line (Fig. 1A). In Fig. 4, A and B, each neuron's average difference in response to pairs of samples from the same category (within-category difference, WCD) is plotted against its difference in response to sam- ples from different categories (between-catego- ry difference, BCD). If neurons were not sensi-
12 JANUARY 2001 VOL 291 SCIENCE www.sciencemag.org
R E P O R T S
Within-class difference in firlng rate (Hz) Within-class difference in firing rate (Hz)
Preferred category J'Nonpteferred category Preferred category f Nonprefened category
Fig. 4. Category effects in a neural population. (A and B) Average differences in activity in response to samples from the same (WCD) and different (BCD) categories for the sample (A) and delay interval (0). Each point represents one neuron. The dotted line indicates equal differences irrespective of category. The solid line indicates the regression line. (C and D) Average activity of the neural population (and standard error) in response t o stimuli at different morph levels of their preferred and nonpreferred categories for the sample (C) and delay (D) intervals.
tive to categories, these measures should be after defining two new category boundaries similar (i.e., BCDWCD ratios should equal 1 that were orthogonal to the original boundary and cluster around the diagonal). Instead, the (Fig. 1A). This created three new classes, BCD values are significantly higher than WCD each containing morphs centered around one values. This indicates greater activity differenc- cat prototype and one dog prototype (e.g., the es in response to samples from different catego- cheetah and the "doberman"). After training, ries, especially during the delay (26). the monkey was able to perform the new
The average activity of all stimulus-selec- three-category DMC task at >85% correct. tive neurons at different morph levels is shown We then recorded from 103 PF neurons from in Fig. 4, C and D (27). There was a significant the same depths and locations in the PF cor- difference in activity between the categories tex, using the same samples as in the original (28), but activity was similar at the different two-category task. morph levels within each category (29), indi- Neural responsiveness (58% or 601103) cating greater sensitivity to stimulus category (33) and stimulus-selectivity (35% or 21160) than to identity. Few category-selective neurons (34) during the three-category task was sim- conveyed significant identity information (sam- ilar to that during the two-category task (64% ple interval, 20165 or 3 1%; delay interval, 10144 or 2531395, and 28% or 731253, respective- or 23%) (30). Also, PF neural responses to the ly), but the original categories were no longer test stimulus seemed to reflect category evalu- reflected in activity (35). Instead, the three ation. Many PF neurons showed enhanced or new categories were evident in delay activity suppressed activity when the test stimulus (36). As during the two-category task, cate- matched the category of the sample (1 121395 or gory information was stronger during the de- 28%) (31). Similar effects were reported for lay (37), possibly because it is relevant for identity matches in the PF and IT cortex (32). the judgment after the delay. "Prospective
Because our monkeys had no experience activity" is stronger nearer the relevant event with cats or dogs before training, it seemed (38, 39) and appears earlier within a trial as task likely that the categories were learned. We proficiency increases (40). The monkey was not thus retrained one monkey on the DMC task as proficient at the three-category task, and its
reaction times were significantly longer (41). Categorization of sensory inputs is the nex-
us between perception and cognition; thoughts and behaviors depend on knowledge of the types of things around us. The sharp transition in neural activity we observed is consistent with a "classical," perceptual category boundary. More conceptual categories can have ''fizzy" boundaries and are unlikely to exhibit such properties (42). Perceptual categorization relies on extraction of the combinations of features defining a category. These features were not explicitly instructed, were acquired by training, and were necessarily multivariate abstractions: the categories differed by more than a few simple features. PF activity could have reflect- ed, andor resulted in, a shifting of attention to those features (43).
These results fit well with studies suggest- ing that PF neural circuitry is malleable. Expe- rience has been shown to induce and modify the sensitivity of PF neurons to specific stimuli (44, 45), and PF activity reflects learned associa- tions and rules (40, 46, 47). Of course, the PF cortex is not likely to be the only brain area involved in categorization. The PF cortex is interconnected with tem~oral lobe structures important for long-term memory (48), includ- ing the IT cortex, whose neurons have stimulus specificities that could contribute to categoriza- tion (7, 49). Interactions between the PF and IT cortices underlie the storage andor recall of visual memories and associations (50-52), but not necessarily visual short-term memory (53). The storage and recall of categories may also require such collaboration.
References and Notes 1. L. W. Barsalou, Cognitive Psychology: An Overview for
Cognitive Scientists (Erlbaum. Hillsdale. NJ,1992). 2. W. A. Roberts. D. S. Mazmanian.]. Exp. Psychol. Anirn.
Behav. Proc. 14, 247 (1988). 3. M. Fabre-Thorpe. G. Richard, 5.1. Thorpe, Neuroreport
9, 303 (1998). 4. R. Vogels, Eur. J. Neurosci. 11, 1223 (1999). 5. T. Orlov, V. Yakovlev, S. Hochstein, E. Zohary, Nature
404, 77 (2000). 6. R. Desirnone, T. D. Albright, C. G. Cross, C. Bruce,
1.Neurosci. 4, 2051 (1984). 7. E. Kobatake, K. Tanaka,]. Neurophysiol. 71,856 (1994). 8. N. K. Logothetis, 1. Pauls. T. Poggio, Curr. Biol. 5, 552
(1995). 9. 6. I. ~erret t , 1. K. Hietanen, M. W. Oram. P. J. Benson,
Philos. Trans. R. Soc. London Ser. B 335. 23 (1992). 10. C. G. Gross, in Handbook of Sensory Physiology, R.
jung, Ed. (Springer-Verlag, Berlin, 1973), pp. 451- 482.
11. K. Tanaka, Annu. Rev. Neurosci. 19. 109 (1996). 12. E. K. Miller, Nature Rev. Neurosci. 1, 59 (2000). 13. R. A. Wyttenbach, M. L. May, R. R. Hoy, Science 273,
1542 (1996). 14. D. Beyrner. T. Poggio. Science 272, 1905 (1996). 15. C. Shelton, Int. 1.Cornput. Vision 38, 75 (2000). 16. We used an algorithm that found corresponding
points between one of the prototypes and the others and computed their differences as vectors. Morphs were linear combinations of these vectors added to the prototype (for more information, see www.ai. mit.edu/people/cshelton/corr). The cat and dog stirn- uli differed along multiple features and were srnooth- ly rnorphed (i.e., without sudden appearance of any feature). Images were 4.2" in diameter, had identical color, shading, orientation, and scale, and were pre- sented at the center of gaze.
www.sciencernag.org SCIENCE VOL 291 12 JANUARY 2001 315
R E P O R T S
17. For neurophysiological recording, morphs were six levels of blends of cat and dog (100:O. 80:20, 60:40, 40:60, 20:80. 0:100) and two levels within catego- ries (60:40, 40:60).
18. "Similarity" as defined by the morphing technique and confirmed by an image correlation analysis.
19. Monkeys maintained gaze within 2' of a fixation point throughout the trial. Eye movements were monitored using an eye tracking system (ISCAN, Cambridge, MA). We excluded stimuli that were less than 60% of a given category, as they carried little or no category information. To prevent memorization of sample-test pairs, we chose as the test stimuli a set of 200 randomly generated morphs that were at least 70% of a category. All main effects were observed in both monkeys. For brevity, we summarize their data.
20. This total consisted of 130 neurons from one monkey and 265 from the other. Sample interval activity was summed over 800 ms, beginning 100 ms after stim- ulus onset. The delay interval activity was summed from 300 ms after sample offset to 100 ms after the end of the delay. Baseline activity was from the 500 ms of fixation before sample onset.
21. T test versus baseline activity, P < 0.01. Parametric statistics such as t tests assume normal distribu- tions. Because neuronal activity is sometimes not normally distributed, we also computed nonparamet- ric statistics for all main effects. They yielded a virtually identical pattern of results.
22. T tests on activity from the sample and delay inter- vals. both P < 0.001.
23. P > 0.6. 24. Paired t tests between activity of all stimulus-selec-
tive neurons in response to the two categories com- puted in successive 100-ms time bins. A significant difference (P < 0.01) began 100 to 200 ms after sample onset, when the earliest PF neurons began responding. The immediate appearance of category information was also evident in average histograms across the neuron population.
25. One-way analysis of variance (ANOVA) on the 54 sample stimuli. Sample interval, 62 neurons: delay interval, 33 neurons; P < 0.01.
26. T test that BCDIWCD ratios were significantly differ- ent from 1. Sample interval, BCDIWCD mean = 1.30: delay interval, BCDIWCD mean = 1.49: both P < 0.001. Category information was significantly stron- ger during the delay; one-tailed t test, P = 0.04. An index of (BCD - WCD)/(BCD + WCD) yielded similar results.
27. Excluding neurons with firing rates below 2 Hz (which produce spurious values when normalized) yielded 55 and 29 neurons with selectivity in the sample and delay intervals, respectively. We normalized each neuron's activity as a proportion of its activity in response to the most effective morph level. To en- sure that analyses were not biased toward a category effect, we used only the single stimulus that evoked the maximum response to determine preferred and nonpreferred category.
28. Two-way ANOVA of category membership and level of category (60%. 80%. loo%), test of the category factor. P < 0.01 for both intervals.
29. Two-way ANOVA, test of the level factor, P > 0.6 for both intervals.
30. ANOVAs on the 27 samples from the preferred or nonpreferred category, either P < 0.01.
31. T test on all match versus all nonmatch test stimuli, P < 0.01.
32. E. K. Miller, C. A. Erickson, R. Desimone, J. Neurosci. 16, 5154 (1996).
33. T test versus baseline for the sample andlor delay intervals. P < 0.01
34. One-way ANOVA on all 54 samples for the sample andlor delay intervals, P < 0.01.
35. Sample interval, mean two-category BCDIWCD =
1.13, t test, P = 0.22; delay interval, two-category BCDIWCD mean = 0.96, t test, P = 0.58. This analysis was limited to morphs between correspond- ing cat and dog prototypes (i.e., C1-Dl, C2-D2, C3- D3: the vertical morph lines in Fig. 1A) because the other morph lines crossed both the two-category and three-category boundaries. We confirmed that this test could detect two-category information by ap-
plying i t to the data from the two-category task. The results were virtually identical to the two-category test described above (sample interval. BCDIWCD ra- tio = 1.33, t test, P < 0.001: delay interval, BCDI WCD ratio = 1.57, t test, P < 0.001).
36. Three-category BCDIWCD mean = 1.51, t test. P < 0.01. As for the two-category test, we compared samples at equivalent distances along between- category morph lines but now using morph lines that crossed the three-category boundaries, but not the two-category boundary. The early ap- pearance of category information in PF activity also suggested that training had altered neuronal selectivity.
37. It was not evident during the sample interval; three- category BCDIWCD mean = 1.03. t test, P = 0.79.
38. ]. Quintana, J. M. Fuster, Neuroreport 3, 721 (1992). 39. G. Rainer, S. C. Rao, E. K. Miller, J. Neurosci. 19, 5493
(1999). 40. W. F. Asaad, G. Rainer, E. K. Miller, Neuron 21, 1399
(1998). 41. Performance was lower on the three-category task
than on the two-category task (87% versus 96%, t test, P < 0.001) and reaction times were longer (average 307 ms versus 264 ms, t test, P < 0.001).
42. G. Lakoff, Women, Fire, and Dangerous Things (Univ. of Chicago Press, Chicago. 1987).
43. R. Dias, T. W. Robbins, A. C. Roberts, Nature 380, 69 (1 996).
44. N. P. Bichot,]. D. Schall, K. G. Thompson, Nature 381, 697 (1996).
45. G. Rainer, E. K. Miller, Neuron 27, 179 (2000). 46. 1. M. White, S. P. Wise, Exp. Brain Res. 126, 315
(1999). 47. W. F. Asaad. G. Rainer, E. K. Miller, J. Neurophysiol.
84. 451 (2000). 48. M. 1. Webster, 1. Bachevalier, L. G. Ungerleider, Cereb.
Cortex 4. 470 (1994). 49. R. Vogels, Eur. I . Neurosci. 11, 1239 (1 999). 50. S. A. Gutnikov, Y. Y. Ma, D. Gaffan, Eur. J. Neurosci. 9,
1524 (1997). 51. G. Rainer, S. C. Rao, E. K. Miller, J. Neurosci. 19, 5493
110001 , 52. H. Tomita, M. Ohbayashi. K. Nakahara, I. Hasegawa,
Y. Miyashita, Nature 401, 699 (1999). 53. D. Gaffan, M. J. Eacott. Exp. Brain. Res. 105, 175
(1995). 54. We thank C. Shelton for the morphing software, and
K. Anderson, W. Asaad, M. Histed, M. Mehta,]. Wallis, R. Wehby, and M. Wicherski for valuable comments, help, and discussions. Supported by a National Insti- tute of Neurological Disorders and Stroke grant, a NSF Knowledge and Distributed Intelligence grant, the RIKEN-MIT Neuroscience Research Center, a MercWMIT Fellowship (M.R.), the Whitaker Chair (T.P.), and the Class of 1956 Chair (E.K.M.).
1 September 2000: accepted 15 November 2000
Role of ER Export Signals in Controlling Surface Potassium
Channel Numbers Dzwokai Ma,' Noa Zerangue,' Yu-Fung Lin,' Anthony ~ o l l i n s , ~
Mei Yu,' Yuh Nung Jan,' Lily Yeh an'* Little is known about the identity of endoplasmic reticulum (ER) export signals and how they are used to regulate the number of proteins on the cell surface. Here, we describe two ER export signals that profoundly altered the steady- state distribution of potassium channels and were required for channel local- ization to the plasma membrane. When transferred to other potassium channels or a C protein-coupled receptor, these ER export signals increased the number of functional proteins on the cell surface. Thus, ER export of membrane proteins is not necessarily limited by folding or assembly, but may be under the control of specific export signals.
Ion channels control neuronal signaling, hor- mone secretion, cell volume, and salt and water flow across epithelia (I). The number of cell surface channels is critical to these physiological functions (1). Whether for- ward-trafficking signals regulate the supply of ion channels to the plasma membrane is not known.
Export from the ER to the Golgi is a key early event in forward traffic. Numerous studies suggest that ER export is limited pri- marily by quality control (2, 3). However, certain secreted and membrane proteins are
concentrated in the process of ER export (4-6). A motif containing Asp, a variable amino acid, and Glu (DXE) (7-9) in vesicular stomatitis virus glycoprotein (VSV-G) has been reported to accelerate the ER export. It is not clear whether ER export signals control the steady-state levels of endogenous mem- brane proteins destined for later compart- ments, including the plasma membrane.
The inwardly rectifying potassium (Kir) channels (10) I(lrl.1 (ROMK1) and Kir2.1 (IRK1) were efficiently expressed in the plasma membrane in Xenopus oocytes, whereas several other Kir familv members exhibited Door ex- pression or delayed expression kinetics. To test
'Howard Hughes Medical Institute, University of Cal- ifornia, San Francisco, San Francisco. CA 94143-0725,
whether these differences with the
USA. 2Colleee of Pharrnacv. Oreeon State Universitv, Presence or absence of trafficking signals, we Corvallis, 0: 97331-3507, USA" first examined the possible involvement of the *To whom correspondence should be addressed. E- vanable COOH-krmini of these channels (Fig. mail: [email protected] 1A). Indeed, efficient surface expression (11)
316 12 JANUARY 2001 VOL 291 SCIENCE www.sciencemag.org