carruthers creek watershed plan fluvial …...introduction: watershed plan study area carruthers...
TRANSCRIPT
Carruthers Creek Watershed Plan Fluvial Geomorphology Assessment of Regional Watershed Monitoring Program Data 2003-2016
Prepared by Matrix Solutions Inc for Toronto and Region Conservation Authority and the Region of Durham Final revision 10 July 2017
Carruthers Creek Watershed Plan Phase 1 Technical Reports
Foreword
The Region of Durham recognises watershed plans as an effective tool in informing the management of the Durhamrsquos water resources natural heritage and natural hazards such as flooding In 2015 the Region retained the Toronto and Region Conservation Authority (TRCA) to update the watershed plan for Carruthers Creek
This four year study will build upon the goals objectives and management recommendations established in the 2003 watershed plan for Duffins Creek and Carruthers Creek thereby ensuring a continuum of management efforts to achieve the desired ecological and sustainability objectives for the watershed
The following report was prepared by Matrix Solutions Incorporated under the direction of TRCA Given the specialised expertise and experience of the engineers at Matrix TRCA commissioned the fluvial geomorphology assessment as one of the series of technical reports that were prepared at the end of the first phase of the watershed plan development process to characterize the current conditions of the watershed Information contained in these reports will provide the knowledge base necessary to develop management recommendations during Phase 2 As with the reports written by TRCA staff this report was subjected to an independent peer review process The final integrated watershed plan will be completed by the end of Phase 2
Carruthers Creek Watershed Plan Phase 1 Technical Reports
Introduction Watershed Plan Study Area
Carruthers Creek is a relatively small watershed with a drainage area of approximately 3748 hectares (9261 acres) ranging from two to three kilometres in width and only 18 kilometres in length (see map below) It is the easternmost watershed in TRCAs jurisdiction and is located entirely in the Region of Durham At the request of the Region of Durham a small section of lands in East Duffins Creek subwatershed which are immediately adjacent to Carruthers Creek watershed and outside of the provincial Greenbelt were included in the study area
The watershed occurs within the South Slope and Glacial Lake Iroquois physiographic regions south of the Oak Ridges Moraine Topographically most of Carruthers Creek watershed is flat to slightly rolling The exceptions are low hills associated with the Lake Iroquois Shoreline notably the Kinsale Raised Shoreline immediately west of Audley Road and south of Highway 7 and the main valley feature of Carruthers Creek itself which forms a distinct but shallow ravine from Taunton Road south to Highway 401
Carruthers Creekrsquos headwaters form to the south of the Oak Ridges Moraine in the City of Pickering Both the east and west branches of the creek originate north of Concession 8 their confluence is immediately north of Taunton Road and the creek enters Lake Ontario in the Town of Ajax Carruthers Creek contains a total of 61 kilometres of stream channels Historically portions of the watershed would have supported cold water fish populations including Brook trout Atlantic salmon Slimy sculpin and Mottled sculpin Instream barriers to fish movement in the watershed adversely impact the aquatic system by limiting access to feeding and spawning areas increasing water temperature and affecting sediment transport In addition some instream structures increase water velocities to the point where fish passage is prevented Instream structures that act as barriers to fish passage include dams weirs road and rail crossings and some culverts
Carruthers Creek watershed lies in the Great Lakes-St Lawrence floristic region which is comprised of mixed coniferous-deciduous forest There are two provincial Areas of Natural and Scientific Interest (ANSl) as designated by the Ontario Ministry of Natural Resources and Forestry in the watershed the Kinsale Raised Shoreline Earth Science ANSI designated for its distinct geological character as a well preserved part of the ancient Lake Iroquois Shoreline and Shoal Point Marsh Life Science ANSI which is included in the coastal Carruthers Creek Wetland Complex Provincially Significant Wetland Two smaller wetlands are evaluated as Locally Significant the Rossland Road Wetland Complex and the Salem Road Wetland Complex The Carruthers Creek Wetland Complex is divided into two Environmentally Significant Areas the coastal Carruthers Marsh and the Carruthers Creek Forest a few hundred metres inland
Long-term precipitation and air temperature patterns in the watershed are summarised from data collected by Environment and Climate Change Canada at the nearby Oshawa Water Pollution Control Plant station In 2015 precipitation volumes of 985 mm exceeded the 30 year (1981-2010) normal of 892 mm however the 2016 volumes were significantly lower at approximately 614 mm For three of the
last nine years the total volume of precipitation exceeded the 30 year normal Lower than normal precipitation volumes were reported in the years 2013 2015 and 2016
Stream flow records for the watershed are related to climate patterns Preliminary water quantity data suggest that 2015 was a wet year in terms of stream flow and 2016 was significantly drier Although stream flow has only been measured in the watershed for a relatively short period of record a wide range of climatic conditions has been observed
Carruthers Creek watershed is mainly rural north of Highway 7 From Highway 7 south to Taunton Road the majority of lands are in the Protected Countryside of the provincial Greenbelt however there is a noticeable loss of the integrity of the natural heritage system due to clearing of vegetation and filling Low to medium density suburban development predominates from Taunton Road south to the lakeshore Lands currently mapped as rural in the urban areas of Ajax are expected to be developed as employment lands to meet future demands The older parts of the built urban area have little to no stormwater controls while the newer parts include standard stormwater quality and quantity ponds accompanied by low impact development (LID) technologies There is also a flood vulnerable area in the Pickering Beach neighbourhood of Ajax
As expected there are differences in agricultural land use in the upper reaches versus mid-reaches of the watershed which may be attributed to land tenure drainage and soil properties or a combination of factors Horticulture dominates the east catchment whereas the west catchment is predominantly cash crops and at least one livestock operation although horticulture is also present In the urban areas of Ajax some lands slated for development are still cultivated with cash crops as an interim use Overall the land use in this small watershed is in transition therefore the characterization provided by the field work in Phase 1 of the watershed plan is an excellent benchmark for future study and decision-making Regular monitoring during and following this watershed planning process continuously improves our understanding of the watershed and will help to guide ongoing decision-making to protect restore and enhance Carruthers Creek watershed
CARRUTHERS CREEK FLUVIAL GEOMORPHIC ASSESSMENT OF REGIONAL WATERSHED MONITORING PROGRAM DATA 2003 -2016
Report Prepared for
TORONTO AND REGION CONSERVATION AUTHORITY
Prepared by
MATRIX SOLUTIONS INC
February 2017
Final revision 10 July 2017
Mississauga Ontario
Suite 200 2500 Meadowpine Blvd
Mississauga ON L5N 6C4
T 9058779531 F 9058774143
wwwmatrix-solutionscom
reviewed by
Tatiana Hrytsak MSc John Parish PGeo
Fluvial Geomorphology Specialist Principal Geomorphologist
CARRUTHERS CREEK
FLUVIAL GEOMORPHIC ASSESSMENT OF REGIONAL WATERSHED
MONITORING PROGRAM DATA 2003-2016
Report prepared for the Toronto and Region Conservation Authority February 2017
DISCLAIMER
We certify that this report is accurate and complete and accords with the information available during the site investigation Information
obtained during the site investigation or provided by third parties is believed to be accurate but is not guaranteed We have exercised
reasonable skill care and diligence in assessing the information obtained during the preparation of this report
This report was prepared for Toronto and Region Conservation Authority The report may not be relied upon by any other person or entity
without our written consent and that of Toronto and Region Conservation Authority Any uses of this report by a third party or any reliance on
decisions made based on it are the responsibility of that party We are not responsible for damages or injuries incurred by any third party as a
result of decisions made or actions taken based on this report
23655-522 Carruthers Creek 2017-07-10 draftdocx ii Matrix Solutions Inc
TABLE OF CONTENTS
1 INTRODUCTION 1
2 BACKGROUND REVIEW 1
21 Carruthers Creek State of the Watershed Report - Fluvial Geomorphology 1
22 A Watershed Plan for Duffins Creek and Carruthers Creek 2
23 Valley Segments Carruthers Petticoat Duffins Creek Watersheds 2
24 Regional Monitoring Program - Fluvial Geomorphology Component Petticoat Creek
Carruthers Creek Duffins Creek and Highland Creek Watersheds 4
3 FIELDWORK AND ANALYSIS METHODS 5
31 Cross-sectional Shape and Area 5
32 Substrate Size Distribution 9
33 Lateral Channel Migration 11
4 TRIBUTARY A 16
41 GTCC-11 17
42 GTCC-9 18
5 TRIBUTARY B 20
51 GTCC-6 20
52 GTCC-5 22
53 GTCC-4 23
6 CARRUTHERS CREEK MAIN BRANCH 25
61 GCC-12 25
62 GCC-7 27
63 GCC-6 28
64 GCC-4 30
65 GCC-2 31
7 DISCUSSION AND RECOMMENDATIONS 33
8 REFERENCES 36
LIST OF FIGURES
FIGURE 1 Geomorphic monitoring site locations and valley segments (PARISH 2003a) 3
FIGURE 2 Location of GTCC-11 monitoring station 17
FIGURE 3 Location of GTCC-9 monitoring station 19
FIGURE 4 Location of GTCC-6 monitoring station 21
FIGURE 5 Location of GTCC-5 monitoring station 22
FIGURE 6 Location of GTCC-4 monitoring station 24
FIGURE 7 Location of GCC-12 monitoring station 26
23655-522 Carruthers Creek 2017-07-10 draftdocx iii Matrix Solutions Inc
FIGURE 8 Location of GCC-7 monitoring station 27
FIGURE 9 Location of GCC-6 monitoring station 29
Figure 10 Location of GCC-4 monitoring station 30
Figure 11 Location of GCC-2 monitoring station 32
LIST OF TABLES
TABLE 1 Stability rankings for Carruthers Creek 5
TABLE 2 Summary of cross-sectional area and percent change for all monitoring stations
2003-2016 7
TABLE 3 Summary of grain size distribution for all monitoring stations 2003-201610
TABLE 4 Summary of erosion pin data for all monitoring stations 2003-2016 12
APPENDICES
APPENDIX A Carruthers Creek Regional Watershed Monitoring Program Site Map
APPENDIX B Individual Site Summary Sheets
23655-522 Carruthers Creek 2017-07-10 draftdocx iv Matrix Solutions Inc
1 INTRODUCTION
The Toronto and Region Conservation Authority (TRCA) has undertaken the process of completing an
updated watershed plan for Carruthers Creek The original watershed plan was prepared in 2003 at a
time when minimal supporting field data was available for the fluvial geomorphology component It was
identified that as the Carruthers Creek watershed becomes more developed it will be critical to establish
baseline conditions to assess potential impacts As part of this work the Regional Watershed Monitoring
Program (RWMP) was established by TRCA Matrix Solutions Inc (formerly PARISH Geomorphic Ltd)
established the ten monitoring stations along Carruthers Creek in 2003 (Appendix A) These stations
were updated every three years through 2012
To provide support for the updated Carruthers Creek watershed plan Matrix was retained by TRCA to
complete a 2016 update of the monitoring stations and prepare a report analysing the full monitoring
data set which includes years 2003 2006 2009 and 2012 This analysis will provide an understanding of
channel morphology which can be employed to guide policy recommendations and assess future
development scenarios in the watershed
2 BACKGROUND REVIEW
21 Carruthers Creek State of the Watershed Report - Fluvial Geomorphology
The State of the Watershed (SOW) report (TRCA 2002) was developed as a reference document for the
companion document the Watershed Management Strategy The SOW report would be used by land
use planning decision makers who have jurisdiction related to the Carruthers Creek watershed
A number of technical experts contributed to the document producing chapters focusing on various
aspects of the watershed including physical properties and processes and cultural characteristics The
chapter focusing on fluvial geomorphology was reviewed to provide background for the current
Carruthers Creek report
The fluvial geomorphology chapter provided a broad overview of the general form and function of the
Carruthers Creek watershed The report discussed the underlying geology drainage density and shape
of the watershed The watershed is a narrow elongated basin which is concave in shape with steeper
headwaters and generally flattens progressing downstream towards Lake Ontario The channel planform
reflects this the channel is straighter in the upstream and becomes more sinuous south of Highway 401
Fine grained substrates are common as a result of the underlying geology which is predominantly from
the glacial Lake Iroquois It was noted in the reporting that there was very little field data available for
Carruthers Creek and was recommended that broader scale studies will need to be undertaken to
provide the information necessary to inform management decisions The report cautioned that as
development of the area progresses more local-scale studies will likely be completed and it will be
necessary to have a holistic understanding of the watershed
23655-522 Carruthers Creek 2017-07-10 draftdocx 1 Matrix Solutions Inc
22 A Watershed Plan for Duffins Creek and Carruthers Creek
Watershed Plans were developed for each of TRCAs nine watersheds (TRCA 2003) The purpose of the
watershed plans was to complete a thorough study of natural features and functions human heritage
public use and the interdependence of these elements This was completed through the SOW Reports
The Watershed Plans then focused on evaluating the potential effects of current and future watershed
activities and identifying management actions to minimize effects and enhance existing features
The report identified that the key management issues facing the Carruthers Creek watershed are those
that challenge all urbanizing creek systems urban growth ongoing stewardship of existing agricultural
and urban land uses and firm protection of existing natural areas Technical studies indicated that
protecting and enhancing terrestrial natural heritage cover is critical to achieving management goals
For Carruthers Creek it was noted that there is a less robust terrestrial natural heritage system and that
within the development process there are very few opportunities to grow the area of natural cover
Without protection of these areas and changes to development planning it is likely that as urban growth
continues the health of Carruthers Creek will decline The report also highlighted the importance of
improving areas with existing development through reforestation streambank management and
changing cultural practices through community engagement initiatives The Regional Watershed
Monitoring Network (RWMN) is a key component of continuing to monitor progress of these goals and
objectives under the watershed plan It would also address information gaps by contributing additional
data to establish baseline conditions in lesser studied areas This would be critical for Carruthers Creek
considering the lack of available data to support the SOW fluvial geomorphology assessment
23 Valley Segments Carruthers Petticoat Duffins Creek Watersheds
PARISH was retained to establish the fluvial geomorphology stations as part of the RWMP for TRCA
(PARISH 2003) As part of this process a valley segment report was produced delineating the
Carruthers Petticoat and Duffins Creek watersheds into distinct segments Valley segments are
considered to be relatively homogenous sections of a watercourse that exhibit distinct physical
characteristics These characteristics are determined by governing factors such as topography geology
climate and hydrography The valley segments were delineated based on differences in stream order
catchment size slope and surficial geology Locations for the RWMN sites were then selected based on
representative coverage of the valley segments
Carruthers Creek was divided into 26 valley segments with the 12 segments on the Main Branch Based
on stream length and types of valley segments ten monitoring sites were selected for Carruthers Creek
five on the tributaries and five on the Main Branch (Figure 1)
23655-522 Carruthers Creek 2017-07-10 draftdocx 2 Matrix Solutions Inc
GPC -1
1 0 1 2 3 4 5 KilometersPetticoat Creek WatershedCarruthers Creek WatershedDuffins Creek Watershed
Valley SegmentsNon-Selected SegmentsSelected Segments
Geomorphic Monitoring LocationValley Segment Boundaries
N
EW
S
Figure 3 Geomorphic monitoring site locations within the Petticoat Creek Duffins Creek and Carruthers Creek Watershed
GPC-4 Identification Number
GC C-2
GC C-4
GC C-6
GT CC -4
GC C-7
GTCC -5
GT CC -6
GT CC -9
GT CC -11
GC C-12
GTP C -16
GT P C -14
GT P C -6
GT PC-4
GTP C -11
GP C -4
GP C -3GT P C -1
GD C -2
GT D C -6GT D C -8
GT D C -2GM C -1
GM C-2
GM C -4
GW X- 3
GW X- 2
GW D -1 5
GW D -14
GR C -2
GR C-1
GS V-1
GW D -1 3
GW D -8
GW D -1 0
GW D -4GW V- 1
GW D -3
GW D -2
GG C -6
GG C -4
GG C -2
GB C -4
GB C -3
GU C -4
GU C -2
GD C -4
GD C -3
GD C -5
FIGURE 1 Geomorphic monitoring site locations and valley segments (PARISH 2003a)
23655-522 Carruthers Creek 2017-07-10 draftdocx 3 Matrix Solutions Inc
24 Regional Monitoring Program - Fluvial Geomorphology Component Petticoat Creek Carruthers Creek Duffins Creek and Highland Creek Watersheds
The RWMP was established to track changes in physical habitat A fluvial geomorphology component
was included because the physical form and function of a watercourse are key elements of aquatic
habitat (PARISH 2004) The TRCA established 150 monitoring sites as part of this program In 2003
fluvial geomorphology sites were set up in the final three watersheds Petticoat Carruthers and Duffins
(additional sites were established for Highland Creek) For the three watersheds 50 monitoring sites
were allotted The number of field sites in each watershed was dictated by the number of valley
segments within it Several sites were linked to fisheries monitoring sites to allow for integration
between disciplines
Setting up the fluvial geomorphology monitoring sites involved additional data collection beyond what
was recommended to maintain the monitoring program This was to provide a larger baseline condition
dataset At each site the following took place
10 bankfull cross-sections were completed this included establishment of the control cross-section
for the monitoring program
A bed chain was installed at or near the monitoring cross-section
Up to five erosion pins were installed through the length of the field site Generally at least one to
two erosion pins were located in close proximity to the control cross-section
A long profile survey was completed through the length of the field site A benchmark was
established to allow future surveys to tie-into the original survey
Photos were taken at documented vantage points so they could be repeated in the future
A GPS reading was taken to document the location of the control cross-section
A historical assessment was completed based on the 1999 aerial photos for the area and floodline
mapping from 1964 and 1987 The assessment was relatively high-level providing general observations
of the watercourse and the surrounding area A Rapid Geomorphic Assessment (RGA) and Rapid Stream
Assessment Technique (RSAT) were completed at each site to evaluate stability For Carruthers Creek
two reaches were considered stable two were stressed and six were transitional (Table 1)
23655-522 Carruthers Creek 2017-07-10 draftdocx 4 Matrix Solutions Inc
3
TABLE 1 Stability rankings for Carruthers Creek
Valley Segments RGA Stability Index RSAT Stability Index
GTCC-11 003 In Regime 23 Moderate
GCC-12 015 In Regime 23 Moderate
GTCC-9 029 Transitional 25 Moderate
GTCC-6 022 Transitional 28 Moderate
GTCC-5 057 Adjustment 215 Moderate
GTCC-4 022 Transitional 20 Moderate
GCC-7 030 Transitional 19 Low
GCC-6 036 Transitional 20 Moderate
GCC-4 038 Transitional 23 Moderate
GCC-2 044 Adjustment 18 Low
(PARISH 2004)
FIELDWORK AND ANALYSIS METHODS
Matrix personnel were required to comply with legislated and Matrix health and safety standards
Field data collection to update the monitoring stations was completed over four days in October 2016
During this time cross-sections pebble counts erosion pin measurement and monumented
photographs were completed RGA and RSAT rapid assessments were also completed for each valley
segment to compare with results from 2004 The updated 2016 data was then compiled with the
preceding datasets in a consistent format for comparison and analysis The integration of the various
datasets allows for comparison between monitoring years and analysis of the overall monitoring period
Summary tables were compiled with the results of these analyses for cross-sections erosion pins and
substrate gradations Additionally summary sheets for each site with cross-section graph overlays and
corresponding photographs for each monitoring year are located in Appendix B to facilitate
interpretation
31 Cross-sectional Shape and Area
Each of the ten established cross-sections are benchmarked with nails which were originally located
well beyond bankfull for detailed topographic data collection between the points The measuring tape
can then be tied to the pins each time re-measurement is completed The start of the cross-section (zero
end of the tape) is always at the left bank pin and terminates at the right bank pin
To compare the cross-section data the various years are overlaid on a graph to provide direct
comparison This comparison is done qualitatively identifying which areas of the cross-section
expanded or contracted and relating this to overall channel processes Quantitatively cross-sectional
area and percent change of cross-sectional area are calculated (Table 2) To provide additional detail on
where the change within the cross-section is occurring it is often useful to compare the maximum
depth bottom width bankfull width and wetted width This aids in revealing how the cross-section is
23655-522 Carruthers Creek 2017-07-10 draftdocx 5 Matrix Solutions Inc
changing and if the overall shape is transitioning Using bottom width or bankfull width is particularly
useful because the width of the monitoring cross-section must remain static to allow for comparison
The width of the monitoring cross-section should also be well beyond bankfull to allow for
documentation of changes in bankfull
23655-522 Carruthers Creek 2017-07-10 draftdocx 6 Matrix Solutions Inc
- - - -
TABLE 2 Summary of cross-sectional area and percent change for all monitoring stations 2003-2016
Monitoring Station
2Cross Sectional Area (m ) Percent Change
Total Change () 2003 2006 2009 2012 2016 2003 2006 2006 2009 2009 2012 2012 2016
GTCC-11 041 048 051 052 061 1694 733 046 1769 4842
GTCC-9 083 099 101 099 113 1858 209 -157 1348 3522
GTCC-6 195 302 335 405 423 NA NA 2065 460 2620
GTCC-5 257 246 299 426 511 -435 2139 4249 1990 9837
GTCC-4 164 179 192 207 206 904 686 793 -025 2545
GCC-12 123 110 139 155 157 -1084 NA 1121 NA NA
GCC-7 175 150 276 240 NA -1442 NA NA NA NA
GCC-6 542 520 554 567 568 -412 668 234 016 486
GCC-4 781 705 738 673 641 -975 472 -876 -483 -1794
GCC-2 327 284 338 362 333 -1313 1894 702 -785 -138
Notes GCC-12 Cross-section width increased in 2009 pin moved back
2016 bank pins could not be found cross-section reinstalled at a larger width in the same location as approximated based on
erosion pin
GTCC-6 2006 cross-section width increased from 360 m to 600 m Bank pin could not be found from original 2003 installation 2009 cross-section width increased by 085 m Total change is calculated for 2009-2016
GCC-7 2009 cross-section width increased from 400 m to 552 m 2012 told that the right cross-section pin was removed by golf course maintenance staff Reinstalled flush to bank at 552 m
23655-522 Carruthers Creek 2017-07-10 draftdocx 7 Matrix Solutions Inc
2016 no pins or indicators of cross-section location could be found cross-section not reinstalled due to challenges with
maintaining
23655-522 Carruthers Creek 2017-07-10 draftdocx 8 Matrix Solutions Inc
Generally the cross-section is considered the most reliable technique for monitoring When the bank
pins are established sufficiently far from the top of bank the risk that they will be lost to erosion is
minimized However if a bank pin must be moved due to erosion risk a number of issues can arise and
it is very difficult to ensure the accuracy of future cross-section comparisons If a bank pin cannot be
found and must be re-established it is highly unlikely that comparisons will be accurate It is difficult to
properly align the re-established pin with the original pin even when the original width is known When
a bank pin is moved back from the known original pin to protect is from erosion it must be properly
documented otherwise it is difficult to make accurate comparisons Even when the bank pin is moved
and properly documented moving one bank pin further into the floodplain generally moves the pin to
ground that is slightly higher than the original location Then when the cross-section is measured the
measuring tape cannot be properly levelled impacting the cross-section graph by artificially deepening a
portion of the cross-section This can be compensated for using the water surface to determine the
difference in elevation If the channel is dry the error cannot be quantified or addressed This is why it is
critical to establish long-term monitoring cross-section bank pins far beyond the top of bank
32 Substrate Size Distribution
To characterize the substrates at each cross-section pebble counts are completed following a modified
Wolman (1954) technique A total of 50 random particles are selected and measured along the median
axis Particle size distributions are tabulated accordingly to produce the representative grain sizes D16
D50 and D84 These values are compared between monitoring periods to identify changes in the overall
substrate distribution (Table 3)
23655-522 Carruthers Creek 2017-07-10 draftdocx 9 Matrix Solutions Inc
TABLE 3 Summary of grain size distribution for all monitoring stations 2003-2016
Monitoring Station (listed in upstream to downstream)
2003 2006 2009 2012 2016
Data displayed in cm
GTCC-11
D16 00009 00009 00009 00002 00004
D50 00009 00009 00009 00049 00008
D84 00190 00009 10 0134 0014
GTCC-9
D16 005 050 019 049 000042
D50 06 20 15 05 052
D84 23 61 50 15 319
GTCC-6
D16 00009 00009 00009 00002 00006
D50 00009 050 049 0019 0090
D84 00009 200 300 200 10
GTCC-5
D16 0031 049 00009 0494 179
D50 059 100 005 150 339
D84 250 180 200 400 679
GTCC-4
D16 011 049 023 005 081
D50 100 150 250 150 192
D84 400 450 480 300 411
GCC-12
D16 0019 00002 0076 170 168
D50 15 10 25 40 48
D84 56 33 60 83 85
GCC-7
D16 053 005 019 049 NA
D50 300 250 300 150 NA
D84 900 1200 680 800 NA
GCC-6
D16 00009 0049 011 050 052
D50 059 100 049 100 202
D84 350 180 230 280 341
GCC-4
D16 011 050 049 100 159
D50 250 150 300 350 988
D84 960 680 1080 750 1623
GCC-2
D16 0019 00009 00009 00049 016
D50 15 049 049 050 036
D84 56 10 15 18 05
23655-522 Carruthers Creek 2017-07-10 draftdocx 10 Matrix Solutions Inc
Substrate monitoring can be complicated by two different factors fine material and seasonality When a
distribution is dominated by fine material (silt sand pebbles) it is very difficult to identify shifts and
nuances in the grain size distribution Therefore substrate monitoring in smaller tributaries or
headwater generally only identifies change if there is a shift from fine material to gravel material This
would require a significant overall change to the system such as incision to remove the upper layer of
fine material revealing underlying coarser material There are also seasonal changes to the grain size
distribution that occur related to the different flow conditions In the summer grain size distributions
are often finer due to the accumulation of fine material during low flow conditions To account for this
monitoring should ideally be completed within the same time frame each monitoring year
Flow conditions should also be taken into account when planning the monitoring visit for the
same reason
33 Lateral Channel Migration
Erosion pins are installed horizontally into the face of stream banks throughout the monitoring site to
provide a means of quantifying channel migration at these locations Each erosion pin is a one meter
length of rebar installed below the bankfull elevation and above the base flow level A portion of the
erosion pin is left exposed from the bank and measured (typically 20 cm) providing a reference length
when re-measured in subsequent monitoring periods The pins serve as a direct measure of bank
recessionmigration rate and are typically installed on the outside bank of pools or straight sections of
channel to serve as controls For each monitoring site four to five pins were installed This generally
included two erosion pins at the monitoring cross-section to corroborate the cross-section results
Change in pin exposure is re-measured during each monitoring year The total change in exposure is
then calculated for the entire monitoring period Total change in exposure is divided by the time period
to determine the migration rate in cmyr (Table 4) The time period differs by erosion pin based on the
available data not all erosion pins have data for every monitoring period This is because during a longer
monitoring period such as the 3-year cycle for the RWMP it is more likely that an erosion pin may not
be found on a subsequent visit If the erosion pin is not found there are a number of explanations the
erosion pin was eroded out of the bank the erosion pin was covered by slumped material or the
erosion pin remained in the bank but could not be located by the practitioner (human error) Ideally the
practitioner should provide additional notes when a change in exposure is not measured Often if an
erosion pin has been eroded out of the bank it may be found lying on the bed noting this will provide
qualitative data for the location It would be uncertain when the pin was fully eroded out of the bank
but it can be concluded that the bank has eroded at least the one meter length of the erosion pin during
the three year period Similarly there is often a general indication that an erosion pin may have been
covered by slumped material if slumps are common in the monitoring reach At minimum if an erosion
pin is not found it generally suggests that a channel is relatively active It is also important when
interpreting the calculated migration rates and measured changes in exposures to consider that erosion
is often an episodic process rather than a occurring at a steady consistent rate
23655-522 Carruthers Creek 2017-07-10 draftdocx 11 Matrix Solutions Inc
- - - -
TABLE 4 Summary of erosion pin data for all monitoring stations 2003-2016
Site Location ID Change in exposure (cm)
Total (cm) Time period for total Migration rate myr
Migration rate cmyr 2003 2006 2006 2009 2009 2012 2012 2016
GTCC-11
RB EP 1 55 145 3 -6 17 2003-2016 0013 131
LB EP 2 25 15 7 -65 18 2003-2016 0014 138
LB EP 3 15 5 18 1 255 2003-2016 0020 196
RB EP 4 05 55 245 11 415 2003-2016 0032 319
LB EP 5 45 -35 45 -15 4 2003-2016 00031 031
GTCC-9
RB EP 1 20 135 50 835 2003-2012 0093 928
LB EP 2 3 -35 5 45 2003-2012 0005 050
LB EP 3 5 -6 -1 -2 2003-2012 -0002 -022
RB EP 4 16 165 2 345 2003-2012 0038 383
RB EP 5 85 325 16 57 2003-2012 0063 633
GTCC-6
LB EP 1 225 -25 235 435 2003-2012 0048 483
LB EP 2 -85 155 7 2003-2009 0012 117
LB EP 3 45 45 2009-2012 015 15
RB EP 4 31 32 70 133 2006-2016 013 133
LB EP 5 -55 305 3 -8 20 2003-2016 0015 154
23655-522 Carruthers Creek 2017-07-10 draftdocx 12 Matrix Solutions Inc
- - - -Site Location ID
Change in exposure (cm) Total (cm) Time period for total
Migration rate myr
Migration rate cmyr 2003 2006 2006 2009 2009 2012 2012 2016
GTCC-5
RB EP 1 36 5 36 2003-2006 0120 12
LB EP 2 -2 1 -05 05 -1 2003-2016 -0001 -008
RB EP 3 195 19 75 46 2003-2012 0051 511
RB EP 4 25 25 2006-2009 0083 833
LB EP 5 -7 6 -55 -65 2003-2012 -0007 -072
GTCC-4
LB EP 1 18 34 52 2006-2012 0087 867
LB EP 2 155 14 6 20 2009-2016 0029 286
RB EP 3 205 12 18 14 645 2003-2016 0050 496
RB EP 4 -145 365 -195 75 10 2003-2016 0008 077
LB EP 5 9 57 13 79 2006-2016 0079 790
GCC-12
LB EP 1 21 255 8 545 2003-2012 0061 606
LB EP 2 34 65 55 43 46 2003-2016 0035 354
LB EP 3 -345 75 -27 2003-2009 -0045 -450
RB EP 4 30 20 50 2006-2012 0083 833
RB EP 5 1 65 14 -5 215 2003-2016 0017 165
GCC-7 RB EP 1 65 85 15 2009-2016 0021 214
23655-522 Carruthers Creek 2017-07-10 draftdocx 13 Matrix Solutions Inc
- - - -Site Location ID
Change in exposure (cm) Total (cm) Time period for total
Migration rate myr
Migration rate cmyr 2003 2006 2006 2009 2009 2012 2012 2016
RB EP 2 145 47 -235 38 2003-2012 0042 422
RB EP 3 30 305 305 2009-2012 0102 1017
LB EP 4 35 -35 -75 -115 -19 2003-2016 -0015 -146
GCC-6
LB EP 1 87 31 69 26 213 2003-2016 0164 1638
LB EP 2 5 155 05 95 305 2003-2016 0023 235
RB EP 3 48 48 2009-2012 0160 16
RB EP 4 555 38 935 2006-2012 0156 1558
RB EP 5 13 135 265 2006-2012 0044 442
GCC-4
LB EP 1 7 11 44 44 2012-2016 0110 11
RB EP 2 44 16 23 39 2009-2016 0056 557
RB EP 3 45 8 2 135 685 2003-2016 0053 527
LB EP 4 45 16 5 7 325 2003-2016 0025 25
RB EP 5 275 1 225 10 61 2003-2016 0047 469
GCC-2
LB EP 1 11 5 5 21 2003-2012 0023 233
RB EP 2 2 -05 -2 -25 -3 2003-2016 -0002 -023
RB EP 3 -10 15 8 95 2009-2016 0014 136
23655-522 Carruthers Creek 2017-07-10 draftdocx 14 Matrix Solutions Inc
- - - -Site Location ID
Change in exposure (cm) Total (cm) Time period for total
Migration rate myr
Migration rate cmyr 2003 2006 2006 2009 2009 2012 2012 2016
RB EP 4 40 21 415 1025 2006-2016 0100 1025
LB EP 5 545 135 405 1085 2003-2012 0120 1206
erosion pins highlighted with yellow are those located at the monitoring cross-section
23655-522 Carruthers Creek 2017-07-10 draftdocx 15 Matrix Solutions Inc
34 Rapid Assessment Results
A rapid assessment was completed for each valley segment in accordance with the RGA (MOE 2003)
and RSAT (Galli 1996) stream assessment protocols Rapid assessment were undertaken to investigate
any significant changes in the geomorphic stability or ecological health of each segment relative to
previously reported results (Parish 2004 TABLE 1) A summary of the 2016 RGA and RSAT results is
presented in TABLE 5 In general 2016 RGA scores were slightly lower than those previously recorded in
2004 suggesting an improvement in channel stability (highlighted in red in TABLE 5) RSAT scores
remained consistent with very little deviation from results reported in 2004 Although the results
suggest improved channel stability within the catchment the rapid assessment protocols are very
subjective and can often be misleading Long term monitoring of geomorphic parameters as those
discussed in previous subsections provides a better method of assessing trends in channel form and
function A detailed description of each valley segment and comprehensive assessment of long term
monitoring results is provided in subsequent sections
TABLE 5 Summary of 2016 Rapid Assessment Results
Valley Segments RGA Stability Index RSAT Stability Index
GTCC-11 009 In Regime 24 Moderate
GTCC-9 013 In Regime 25 Moderate
GTCC-6 016 In Regime 26 Moderate
GTCC-5 032 Transitional 30 Moderate
GTCC-4 025 Transitional 27 Moderate
GCC-12 015 In Regime 28 Moderate
GCC-7 013 In Regime 23 Moderate
GCC-6 020 Transitional 27 Moderate
GCC-4 018 In Regime 34 Moderate
GCC-2 028 Transitional 27 Moderate
23655-522 Carruthers Creek 2017-07-10 draftdocx 16 Matrix Solutions Inc
4 TRIBUTARY A
Tributary A is located at the upstream end of the watershed beginning north of Concession 7 and
confluences with the Main Branch north of Highway 7 The tributary is approximately 4 km in length and
flows through rural area where the dominant surrounding land use is agricultural The riparian corridor
for the tributary is generally 40 to 100 m wide Vegetation consisted of deciduous swamp meadow
marsh buckthorn deciduous thicket and a small area of hardwood deciduous forest downstream of
Highway 407 Two monitoring stations were located on Tributary A GTCC-11 and GTCC-9 The valley
segment containing GTCC-11 was classified as 3M small catchment and high slope The valley segment
containing GTCC-9 was classified as 2M small catchment and moderate slope
41 GTCC-11
The GTCC-11 station is located approximately 200 m upstream of Highway 7 The channel is located in
an area vegetated with shrubs tall grasses and deciduous trees This vegetated area is approximately
60m wide beyond which are agricultural fields The eastern bank is vegetated with poplar trees and red
osier dogwoods while the western bank is vegetated with tall dense grasses
FIGURE 2 Location of GTCC-11 monitoring station
In 2003 the cross-sectional area for the monitoring cross-section was 041 m2 The cross-section had a
narrow ldquoVrdquo shape typical of a small tributary At the time of survey (October) the wetted width was
030 m The bankfull width was approximately 071 m and the max depth was 036 m Over the
monitoring period the cross-section exhibited a steadily increasing cross-sectional area Between 2003
23655-522 Carruthers Creek 2017-07-10 draftdocx 17 Matrix Solutions Inc
and 2016 the cross-sectional area increased by 010 m2 or approximately 48 The cross-section overlay
indicates that this change corresponds to a deepening and widening of the thalweg transitioning the
cross-section from a ldquoVrdquo to a ldquoUrdquo shape The 2006 and 2009 cross-sections show the cross-section
deepening to a maximum depth of 043 m in 2009 The 2012 and 2016 cross-sections then show
widening of the bed through ongoing toe erosion while the maximum depth returns to a consistent
040 m Comparing the 2016 cross-section to the other years also suggests deepening of the floodplain
area This could be a result of higher flows more frequently spilling onto the floodplain and establishing
a larger bankfull cross-section Shifts in floodplain topography can also be tied to growth and die-off of
dense tall grass vegetation These changes in cross-sectional shape are a manifestation of typical
channel processes in a small headwater channel
The erosion pins generally exhibited increased exposure between monitoring periods The maximum
increase in exposure was 245 cm for EP4 between 2009 and 2012 During this monitoring period there
was also a large change in exposure (18 cm) for the erosion pin at the monitoring cross-section (EP3)
Based on these exposures the erosion rates would be approximately 8 cmyr and 6 cmyr respectively
The erosion rates based on the full monitoring period (13 years) ranged from 031 cmyr to 319 cmyr
The average erosion rate is 163 cmyr
The substrate at GTCC-11 is composed of fine grained materials including sand silt and small pebbles
Over the monitoring period this was consistent with no noticeable coarsening
42 GTCC-9
The GTCC-9 station is located approximately 700 m downstream of GTCC-11 It is approximately 2 km
from the confluence with the main channel At GTCC-11 the channel is located on the floor of a valley
which is approximately 20 to 40 m wide The channel meanders across the valley floor periodically
contacting the valley walls The valley floor is vegetated with meadow grasses and woody shrubs such as
buckthorn and red osier dogwoods The slopes are populated by deciduous trees Beyond the top of the
valley are agricultural fields At the monitoring cross-section the right bank (western) is vegetated with
tall grasses and the left bank (eastern) is covered by a large red osier dogwood The monitoring photos
indicate that the cross-section was originally installed immediately downstream of the dogwood
Overtime the dogwood has grown sufficiently large that it encompasses the area where the left bank pin
is located This made it difficult to properly level the measuring tape along the left bank due to the
dense woody vegetation that must be pushed down to allow the tape to lie flat
23655-522 Carruthers Creek 2017-07-10 draftdocx 18 Matrix Solutions Inc
FIGURE 3 Location of GTCC-9 monitoring station
In 2003 the cross-sectional area for the monitoring cross-section was 083 m2 The cross-section had a
notched low-flow channel in the center with a bottom width of approximately 050 m The 2006
cross-section was distinctly different from all other monitoring years and appears to have captured a
transitional period The cross-section bottom width increased to approximately 077 m and no longer
exhibited a defined low-flow area Between 2003 and 2006 cross-sectional area increased by 016 m2
the largest change during the 13-year period Due to the transitional shape it was difficult to define
bankfull for the 2006 cross-section The cross-sections for 2009 2012 and 2016 all indicate that the
channel is migrating towards the right bank This is evidenced by the increasing elevation of the left
bank profile and the consistent retreat of the right bank The cross-section is also deepening along the
right side Over the 13-year monitoring period the bed has deepened by approximately 010m based on
comparison of the max depth values from 2016 and 2003 The overall cross-sectional area has increased
by 030 m2 or 35
Two erosion pins are located at the monitoring cross-section one in each bank Both pins exhibited an
increase in exposure between 2003 and 2006 when the cross-section shape widened From 2006 to
2012 the right bank pin (EP4) exhibited continued increases in exposure while the left bank pin (EP3)
exhibited small reductions in exposure This is consistent with the migration of the channel towards the
right bank Based on the EP4 data the average erosion rate for the right bank at the monitoring
cross-section is 383 cmyr During the monitoring period the largest changes in exposure were noted at
EP1 and EP5 This was a result of their locations both were located on the outer bank of a bend The
average migration rates based on the EP1 and EP5 data are 928 cmyr and 633 cmyr
23655-522 Carruthers Creek 2017-07-10 draftdocx 19 Matrix Solutions Inc
5
The substrate at GTCC-9 is composed of fine grained material and medium sized gravel The substrate
was relatively consistent over the monitoring period with 2006 and 2009 considered coarser than other
years based on the D50 These years may have been coarser because the cross-section was actively
enlarging and more of the fine material had been removed Additionally the 2009 cross-section was
measured in April when high flows are more frequent due to spring melt This leads to seasonally
coarse distributions as fine material is flushed away more regularly
TRIBUTARY B
Tributary B begins northeast of Tributary A south of Concession 8 It is the larger of the two tributaries
approximately 94 km in length more than double the length of Tributary A North of Highway 7 the
channel flows through rural agricultural land with a riparian corridor ranging from approximately 10m
wide in the headwaters to approximately 80 m wide south of Highway 407 South of Highway 7
the channel flows through a small residential development where a channel design has been
implemented The channel then flows through a dense woodlot area before continuing through Deer
Creek Golf Course The confluence with the Main Branch is located near the south end of the golf
course There are three monitoring stations located on Tributary B all of which are located downstream
of Highway 7 The valley segment containing GTCC-6 is classified as 1H small catchment and low slope
The valley segment containing GTCC-5 is classified as 3H small catchment and high slope The valley
segment containing GTCC-4 is classified as 2H small catchment and moderate slope
51 GTCC-6
The GTCC-6 station is the most upstream station located approximately 325 m downstream of Highway
7 near the crossing of Concession 4 On the south side of the channel is a small deciduous woodlot with
meadow grasses The north side is vegetated with tall dense meadow grasses and shrubs The
monitoring cross-section is located in a highly active area of the channel where ongoing erosion of the
right bank is occurring As a result of this there were challenges maintaining the cross-section bank pins
The 2003 cross-section was not considered as part of the results because the cross-section was
reinstalled in 2006 after the right bank pin was completely lost The 2006 cross-section is 23 m wider
than the original 2003 cross-section There also appeared to be an issue with the 2006 cross-section
when compared to subsequent cross-sections This is likely related to the movement of the right pin
from 60 m (2006) to 685 m (2009) Therefore only the 2009 2012 and 2016 cross-sections were
evaluated Based on the different months in which the monitoring was completed (October December
April) the channel is regularly dry during low flow periods such as summer and early fall However based
on the monitoring results it produces sufficient flow during wetter periods such as spring and rainfall
events to result in toe erosion and undercutting
23655-522 Carruthers Creek 2017-07-10 draftdocx 20 Matrix Solutions Inc
FIGURE 4 Location of GTCC-6 monitoring station
The three cross-sections indicate that the cross-section has deepened and also migrated further into the
right bank This is expected given the erosion and severe undercutting of the right bank seen in the
monitoring photos Minimal change to the left bank profile has occurred Between 2009 and 2012 the
cross-section deepened with the maximum depth increasing from 100 m to 113 m The 2016
cross-section exhibits aggradation along the left bank toe and erosion of the right bank toe There were
increases in cross-sectional area both in 2012 and 2016 indicating that the channel is not just migrating
towards the right bank but also enlarging The cross-sectional area in 2009 was 335 m2 and increased to
405 m2 in 2012 and then 423 m2 in 2016 Over the 7-year period this was an increase of 088 m2 or
262
Two erosion pins are located at the monitoring cross-section one in each bank The right bank pin (EP4)
exhibited large increases in exposure every monitoring period Based on the data from EP4 the
migration rate of the right bank is approximately 133 cmyr The left bank pin (EP5) exhibited changes
in exposure ranging from -8cm to 305 cm This would suggest that there is erosion followed by periodic
slumping of material along that bank The other erosion pins indicated that toe erosion is widespread
throughout the reach For example EP2 and EP3 were located in a bend that was actively eroding both
pins were found eroding out of the bank and lying on the bed at two of the monitoring visits This type
of severe toe erosion and undercutting often occurs in channels with grass dominated vegetation
The substrate at GTCC-6 is composed of fine grained materials including sand silt and small pebbles
Over the monitoring period this was consistent with no noticeable coarsening
23655-522 Carruthers Creek 2017-07-10 draftdocx 21 Matrix Solutions Inc
52 GTCC-5
The GTCC-5 station is located in a large woodlot upstream of the Deer Creek Golf Course Through this
area the channel is quite sinuous with tight bends and steep eroding banks Woody debris such as
branches and downed trees was common resulting in jams The banks in this reach were higher than
those upstream ranging from 050 to 125 m This is indicative of incision The monitoring cross-section
is located on the downstream straight section of an ldquoSrdquo bend There is substantial erosion along the
outer bank upstream of the cross-section the bend has over widened and a formed a large pool A large
willow tree fell across the channel at the monitoring cross-section between 2009 and 2012 due to this
the measuring tape would not lie flat in 2012 and 2016 The impact on the cross-section graph could not
be quantified it is assumed that the cross-section shape is representative of field conditions Specific
depth measurements for 2012 and 2016 are likely to be slightly higher than in the field due to the tree
pushing the tape higher in the center of the cross-section The two cross-sections correlate well with
each other signifying that the tree had a consistent impact on measuring tape and cross-section
measurement
FIGURE 5 Location of GTCC-5 monitoring station
The monitoring cross-section at GTCC-5 experienced the most significant change out of all the
monitoring stations The channel has substantially incised at this location as the result of a debris jam
failure Debris jams establish a sharp change in elevation on the channel profile When a debris jam fails
the channel will incise to remove the difference in elevation and re-establish a consistently sloped
profile This process was well documented at the GTCC-5 cross-section Based on the cross-section
overlay and corroboration by the monitoring photos the channel began to incise between 2006 and
23655-522 Carruthers Creek 2017-07-10 draftdocx 22 Matrix Solutions Inc
2009 The cross-section was stable between 2003 and 2006 with some accumulation of material
resulting in a small reduction in area The material likely accumulated as a result of the small debris jam
located immediately downstream of the cross-section (2003 photo) creating a backwater Between 2006
and 2009 the debris jam destabilized as seen in the 2009 photo The 2009 cross-section deepened and
widened along the right bank cross-sectional area increased by 053 m2 or 213 The max depth
increased by 029 m between 2006 and 2009 Between 2009 and 2012 the large willow tree located on
the left bank fell across the cross-section It can be seen in the 2009 photo on the left bank The downed
tree is an additional disturbance altering flow at the cross-section The change in cross-sectional area
between 2009 and 2012 was the most significant during the monitoring period enlarging by 127 m2 or
424 Max depth increased by 036 m this value could be inflated due to the measuring tape issue as a
result of the downed tree Between 2012 and 2016 the cross-section continued to enlarge primarily
through severe undercutting and subsequent retreat of the right bank The bed appears to have
stabilized as there was minimal change in the actual bed elevation A mid-channel bar has also formed
which supports this notion
In total the cross-section has incised approximately 062 m based on the difference in maximum depth
between the 2003 and 2016 cross-sections Over the 13-year monitoring period the cross-sectional area
has increased by 254 m2 or 98 The cross-section enlarged through incision and retreat of the right
bank while the left bank profile remained stable
There are two erosion pins located at the monitoring cross-section EP2 (left bank) and EP3 (right bank)
The data for these two pins is consistent with the cross-section results EP2 exhibited minimal change in
exposure during the monitoring period while EP3 exhibited large changes each monitoring year Based
on the data from EP3 the migration rate for the right bank is approximately 5cmyr The other three
erosion pins were frequently lost during the monitoring which suggests that they were fully eroded out
of the banks due to the severity of erosion For example EP4 was only re-measured once during the
monitoring period in 2009 and had a change in exposure of 25 cm
The substrate at GTCC-5 was dominated by finer material consisting of coarse sand pebbles and silt
from 2003 to 2009 Medium and coarse gravel represented the coarser fraction The distribution
coarsened in 2012 and 2016 this is typical of an incising channel When the debris jam no longer
created a backwater fine sediment would have been flushed out leaving coarser material behind As the
channel incised further additional fine material would have been removed The coarsening of the bed is
also an indication that incision is slowing as the accumulation of coarse material acts to reduce bed
erosion
53 GTCC-4
The GTCC-4 station is located on the Deer Creek Golf Course in a small cedar woodlot downstream of a
cart path bridge The woodlot provides a small buffer from the adjacent manicured golf course The
monitoring cross-section is located between in a straight section between two successive bends or an
23655-522 Carruthers Creek 2017-07-10 draftdocx 23 Matrix Solutions Inc
ldquoSrdquo bend In the upstream bend there was severe woody debris obstruction Upstream of the bend the
channel flows adjacent to a valley wall along the right bank The bend downstream of the cross-section
has severe erosion of the outer bank The bank is steep and elevated with minimal vegetative buffer
from the golf course approximately less than 5m
FIGURE 6 Location of GTCC-4 monitoring station
In 2003 the cross-sectional area for the monitoring cross-section was 164 m2 The maximum depth was
081 m The cross-section had a narrow low-flow area with a bottom width of approximately 060 m
Between 2003 and 2009 the cross-sectional area steadily increased primarily through erosion of the
vertical left bank widening the bottom width of the channel The 2009 cross-section appears to be
capturing a transition between the 20032006 cross-sections and the 20122016 cross-sections In 2009
the cross-section incised to a maximum depth 087 m This is the deepest measured cross-section during
the monitoring period The 2012 cross-section then exhibits a large loss of material from the lower
portion of the right bank where very little change was noted in the previous cross-sections Itrsquos unclear
from the monitoring photos what may have caused this The left bank also exhibited a noticeable retreat
between 2009 and 2012 The change in cross-sectional area between these 2009 and 2012 was 015 m2
or approximately 8 The 2012 and 2016 cross-sections have a wider bottom width of approximately
14 m as compared to approximately 060 m in 2003 Visually comparing the cross-sections the
20032006 cross-sections have a narrow defined low-flow area while the 20122016 cross-sections
have a larger general ldquoUrdquo shape This change in cross-sectional shape is reflected by a 25 increase in
cross-sectional area over the 13-year monitoring period
23655-522 Carruthers Creek 2017-07-10 draftdocx 24 Matrix Solutions Inc
6
One erosion pin is located at the monitoring cross-section in the left bank EP2 The pin exhibited
increases in exposure ranging from 6 to 155 cm Based on this data the average erosion rate for the left
bank was approximately 286 cmyr Erosion pin 4 exhibited variable results ranging from large increases
in exposure (365) to large decreases in exposure (-195) This is indicative of an area which is eroding
destabilizing and collapsing Erosion pin 1 was located in the outer bank of the eroding bend
downstream of the cross-section It was found eroded out of the bank in 2016 and exhibited large
increases in exposure in 2012 and 2009 Based on EP1 the average erosion rate in this bend is
approximately 86 cmyr Overall based on all the erosion pin data for GTCC-4 the average erosion rate
was 503 cmyr
The channel substrate primarily consisted of medium to coarse gravels The material appears to be
relatively large for the size of the channel which reduces vertical erosion As a result the primary mode
of cross-sectional adjustment was lateral erosion The substrate distribution was consistent over the
13-year monitoring period and exhibited no distinct shifts
CARRUTHERS CREEK MAIN BRANCH
The Main Branch of Carruthers Creek originates to the west of Tributary A north of Concession 7 and
east of Westney Road The Main Branch is approximately 27 km long and flows into Lake Ontario The
surrounding land use north of Taunton Road is primarily rural and agricultural South of Taunton Road
the channel corridor is generally contained within residential development particularly between
Taunton Road and Rossland Road Sinuosity also begins to increase noticeably south of Taunton Road
becoming highly sinuous south of Rossland Road This increase in sinuosity corresponds to the reduced
gradient progressing towards the Lake There are five monitoring stations located on the Main Branch
One is located in the headwater area GCC-12 while the other four are located south of Highway 7
There is a large area gap of approximately 9kms between GCC-12 and the next station (GCC-7) The
furthest downstream station is GCC-2 located on the south side of Kingston Road There are no stations
located below Highway 401
61 GCC-12
The GCC-12 station is the most upstream station on the Main Branch of Carruthers Creek It is located
approximately 100 m downstream of Concession 7 The channel flows adjacent to a rural residential
property with agricultural fields surrounding the riparian corridor The riparian corridor is relatively wide
at the monitoring station approximately 80 to 100 m The surrounding vegetation is predominantly tall
meadow grasses and small willow woodlots At the monitoring cross-section both banks are vegetated
with meadow grasses
23655-522 Carruthers Creek 2017-07-10 draftdocx 25 Matrix Solutions Inc
FIGURE 7 Location of GCC-12 monitoring station
There were challenges maintaining the monitoring cross-section at GCC-12 due to ongoing erosion of
the right bank Neither of the cross-section bank pins could be located in 2016 The cross-section was
reinstalled based on an erosion pin that corresponded to the cross-section Therefore the 2016
cross-section should not be compared with other monitoring years It was also noted during the 2016
measurement that the right bank was noticeably higher than the left bank making it difficult to level the
tape Assuming the cross-section was reinstalled at the correct location this difference in bank height
could have impacted previous cross-section measurements Notes from the 2009 cross-section
measurement also indicated that the tape was not level This may have been a result of moving the right
pin back which occurred in 2009 The pin was moved from 43 m to 51 m presumably to prevent loss
due to erosion The movement of the right bank pin in 2009 made comparisons to the earlier years
2003 and 2006 difficult
In general the cross-section is migrating towards the right bank and steadily eroding it It also appears
that the cross-section has deepened based on the overlays and the photo documentation
Two erosion pins are located at the monitoring cross-section EP3 (left bank) and EP4 (right bank)
The erosion pins provide particularly useful data when there are issues maintaining a cross-section The
right bank erosion pin results indicated ongoing retreat of the right bank Twice EP4 was lost or eroded
out of the bank (2006 and 2016) The change in exposure between 2006 and 2009 for EP4 was 30 cm
Between 2009 and 2012 the change in exposure was 20 cm The average migration rate at EP4 was
833 cmyr based on this data The left bank pin at the cross-section EP3 could not be located twice
during the monitoring period in 2012 and 2016 Two of the erosion pins were located in an actively
23655-522 Carruthers Creek 2017-07-10 draftdocx 26 Matrix Solutions Inc
eroding bend downstream of the monitoring cross-section EP1 and EP2 Both EP1 and EP2 exhibited
large increases in exposure between 2003 and 2006 21 cm and 34 cm respectively
The channel substrate at GCC-12 is primarily composed of medium to coarse gravels There appears to
be a coarsening of the distribution in 2012 and 2016 This is indicated by the higher D50 values as well as
D16 values that are comparable to the D50 values from previous monitoring years The coarsening may be
a result of deepening of the cross-section When this occurs finer material is removed while coarser
material which is too large for the channel to transport remains on the bed
62 GCC-7
The GCC-7 monitoring station is located at the south end of the Deer Creek Golf Course Specifically it is
located in a 50m reach of channel between a cart path crossing and a golf course road (Squire Drive)
The channel is surrounded by golf course fairway and has a minimal riparian buffer of less than 5m The
close proximity to golf course operations led to challenges in maintaining the cross-section The 2009
cross-section needed to be reinstalled after the right bank pin was found lying on the bank The pin was
reinstalled 15 m wider than the original cross-section The right bank pin had to be reinstalled again in
2012 due to the removal by golf course maintenance staff A cross-section was not completed in 2016
because neither of the bank pins could be located due to previous issues it was not reinstalled Based
on these issues only the 2003 and 2006 cross-sections could be compared
FIGURE 8 Location of GCC-7 monitoring station
23655-522 Carruthers Creek 2017-07-10 draftdocx 27 Matrix Solutions Inc
Between 2003 and 2006 the cross-section exhibited evidence of erosion along the right side of the
cross-section and right bank face This was paired with a accumulation of material on the left side of the
cross-section The cross-sectional area was reduced from 175 m2 to 15 m2 approximately -14
Based on these two years the channel was migrating towards the right bank Without subsequent years
of data it is unclear if this process continues and if there is a general trend of reduction in cross-sectional
area
The two erosion pins located at the cross-section provide additional insight EP3 was located in the right
bank and EP4 was located in the left bank The data from EP3 indicated that the right bank was
continually eroding through the 13-year monitoring period The pin could not be located in two of the
monitoring years (2009 and 2016) presumably due to severe erosion For both of the monitoring years
that it was measured the exposure increased by 30 cm This suggests an erosion rate of 10 cmyr for the
right bank based on the EP3 data Data from EP4 exhibited decreases in exposure for each monitoring
year between 2006 and 2016 The results ranged from -35 to -115 cm Observations of the left bank in
2016 noted that the bank is slumping The slumping and erosion is likely related to the lack of riparian
buffer to provide additional support to the banks
The channel substrate at GCC-7 is primarily composed of medium to coarse gravel with the largest
material classified as cobbles The grain size distribution was consistent over the 13-year monitoring
period with no observable trends The coarse nature of the material is expected due to the location on
the golf course and the high potential for modification and erosion protection
63 GCC-6
The GCC-6 monitoring station is located immediately south of Taunton Road in a riparian corridor
between two residential areas The residential area to the east was completed between 2005 and 2008
while the area to the west was completed shortly after Stormwater management ponds are located on
either side of the channel corridor as well as a paved trail to the east This is the first of three stations
located in the southern developed portion of the watershed The channel is situated within a woodland
area approximately 125 m wide Vegetation consisted of deciduous trees woody shrubs and tall
grasses The channel is quite sinuous with tight eroding bends Eroding and undercutting banks were
common throughout the reach resulting in frequent slumped vegetated blocks The monitoring
cross-section is located in a straight section of a large bend The left bank at the monitoring
cross-section corresponds with the outer bank of the bend and is vertical while there is a vegetated
point bar located along the right side of the cross-section The wetted width is narrowed by the point
bar and flow is focused along the toe of the left bank This encourages erosion and undercutting
23655-522 Carruthers Creek 2017-07-10 draftdocx 28 Matrix Solutions Inc
FIGURE 9 Location of GCC-6 monitoring station
Out of all the monitoring sites the cross-section at GCC-6 was the most consistent exhibiting minimal
change over the 13-year monitoring period The cross-sectional area in 2003 was 542 m2 with a
maximum depth of 137 m Maximum depth was extremely consistent at 134 m in both 2006 and 2009
and 133 m in 2012 This indicates that the channel bed has not changed The only change in the
cross-section was retreat of the left bank The most significant change during the monitoring period was
noted between 2006 and 2009 cross-sectional area increased from 520 m2 to 554 m2 approximately
66 Over the entire monitoring period the cross-sectional area increased by only 48 The
cross-section can be considered stable
While location of the monitoring cross-section was stable the surrounding reach exhibited frequent
undercutting of banks and slumping of material The erosion pin data indicated that pins were
frequently lost during the monitoring period When erosion pins cannot be located it is assumed that
they have been eroded out of the banks It also occurs when sufficient undercutting has occurred for the
bank to collapse on top of the erosion pin burying it This is likely what has occurred in GCC-6 Erosion
pin 3 was located in an outside bank downstream of a slumped bank area It could not be located in
2006 2009 or 2016 The only year it was located 2012 the exposure increased by 48 cm indicating an
erosion rate of 16 cmyr Erosion pin 1 was located every monitoring year and exhibited dramatic
increases in exposure ranging from 26 to 87 cm Three of the five erosion pins had an average erosion
rate of 16 cmyr Therefore while the cross-section itself was stable the surrounding reach is active
23655-522 Carruthers Creek 2017-07-10 draftdocx 29 Matrix Solutions Inc
The substrate at GCC-6 is primarily composed of medium gravels The grain size was consistent with
minimal variability during the 13-year monitoring period This is expected because the cross-section
graph indicated that the bed of the channel was largely unchanged
64 GCC-4
The GCC-4 monitoring station is located south of a railway crossing in a forested valley Channel
sinuosity is reduced through the reach by the confining effects of the surrounding valley Surrounding
land use is residential development which is located on either side of the valley The residential
development on the east side began around 2005 and was completed around 2014 On the west side
development began around 2012 and was completed around 2015 The forested valley consists of a
variety of both coniferous and deciduous species Leaning and fallen trees were common particularly
along the right bank which coincided with the valley wall
Figure 10 Location of GCC-4 monitoring station
The monitoring cross-section is located in a straight section which flows along the western toe of the
valley The cross-section is wide compared with other monitoring stations located in grass-lined areas
Toe erosion was noted along both banks The cross-sectional area in 2003 was 781 m2 with a maximum
depth of 138 m Over the monitoring period the cross-sectional area steadily reduced to 641 m2 in
2016 and a maximum depth of 113 m The cross-section overlay indicates that the reduction was
primarily through accumulation of bed material There was erosion of the right bank which is expected
because the channel abuts the valley wall along this side The reduction in cross-sectional area was
approximately 18 Generally a reduction in cross-sectional area is related to accumulation of fine
23655-522 Carruthers Creek 2017-07-10 draftdocx 30 Matrix Solutions Inc
material as a result of reduced velocity Reviewing the monitoring photos suggests that the reduction is
a result of accumulation of coarse material across the riffle that the cross-section is located at
There are two erosion pins located at the cross-section EP3 in the right bank and EP4 in the left bank
The data at EP3 indicated that the most substantial increase in exposure was between 2003 and 2006
45 cm Increases in exposure for the subsequent years were much less substantial The left bank erosion
pin EP4 exhibited small increases in exposure ranging from 45 to 16 cm This was relatively consistent
with the other erosion pins Generally the erosion pins exhibited increases in exposure which were
variable but provided similar erosion rates over the 13-year period Three of the five pins provided
average erosion rates of approximately 5cmyr
The substrate at GCC-4 was coarse and consisted primarily of coarse gravel and cobbles The monitoring
data indicated a general coarsening trend The median grain size increased from medium and coarse
gravel to very coarse gravel and small cobbles This indicates that the accumulation of material is
primarily through coarser material armouring the riffle and further reducing transport at the feature
65 GCC-2
The GCC-2 monitoring station is located immediately south of Kingston Road it is the furthest
downstream station The channel flows through a meadow dominated area with some small deciduous
woodlots To the west is a residential development a stormwater management pond and a paved trail
The development was built over the course of the monitoring period completed between 2009 and
2012 To the east is an agricultural field The channel is quite sinuous through this reach The reach was
characterized by tall steep undercutting banks Bank height was frequently 1m with material scoured
out from beneath the upper vegetative root layer Deep scour pools and accumulation of fine material
was also noted The reach can be considered fairly active based on these indicators
23655-522 Carruthers Creek 2017-07-10 draftdocx 31 Matrix Solutions Inc
Figure 11 Location of GCC-2 monitoring station
The monitoring cross-section is located in a short straight section of channel between two bends The
cross-section was highly active during the monitoring period both increasing and decreasing
cross-sectional area The cross-section shape has shifted and changed but when cross-sectional areas
from 2003 and 2016 are compared there is negligable difference The 2003 cross-sectional area was
327 m2 while the 2016 area was 333 m2 Between 2003 and 2006 the cross-sectional area reduced
through bed accumulation reducing maximum depth from 105 to 083m Between 2006 and 2009 the
cross-sectional area increased primarily through erosion of a high point along the right bank and erosion
of both bank toes There was some bed erosion during this time period as well increasing the maximum
depth by 004 m However lateral erosion was the dominant process The 2006 to 2009 period exhibited
the most significant change during the monitoring period cross-sectional area by increased 054 m2 or
19 The cross-section continued to increase through 2012 to 362 m2 with a maximum depth of
095 m This increase was a result of retreat of the right bank erosion along the left bank toe and
deepening of the bed Near the left bank toe there was a narrow notched area where the channel has
cut down This is likely where the thalweg and the strongest forces from the flow are focused In 2016
the cross-sectional area was reduced by 7 to 333 m2 This was primarily due to the accumulation of
sediment above bankfull along the right bank and along the right bank toe It is also worth noting that
during the 2016 assessment the right bank pin was buried under approximately 16 cm of fine material
This could suggest that the higher flows are regularly depositing fine material from bank erosion above
bankfull The bed of the 2016 cross-section exhibits a wider thalweg area than was document in 2012
The area is not as deep (092 m) but it is wider and more defined This could suggest that the channel is
slowly and systematically eroding downward
23655-522 Carruthers Creek 2017-07-10 draftdocx 32 Matrix Solutions Inc
7
Based on the variable changes in the cross-section it can not be definitively said whether it is increasing
or decreasing in size It is clear that the channel is highly active mobilizing sediment from both the bed
and banks in this reach The sediment then periodically accumulates within the channel or overbank
areas due to the excess amount
No erosion pins were located at the monitoring cross-section for GCC-2 Erosion pins 4 and 5 were
located approximately 40m upstream of the cross-section Erosion pin 4 was located at the downstream
end of an overwidened eroding bend with a large scour pool Erosion pin 5 was also located at the
downstream end of an area of severe erosion and undercutting Both EP4 and EP5 exhibited large
increases in exposure and were lost at once Based on the data at these two pins the average erosion
rate was 10 cmyr and 12 cmyr respectively The other three erosion pins were in areas of less active
erosion EP2 exhibited small amount of accumulation during most monitoring periods
The substrate at GCC-2 was predominantly fine material including silt sand and pebbles
This distribution is particularly small given the size of the channel and is likely a reflection of the ongoing
bank erosion The median grain size typically consistents of pebbles
DISCUSSION
The results from the 13-year monitoring period provide insight on channel processes at a variety of
scales Most reliably the data describes the processes occurring at various discrete sites throughout the
watershed Each station is a reflection of the specific governing factors at that location which include
surrounding vegetation land use geology and flow regime Reviewing the stations together based on
their general location within the watershed may reveal broader characteristics of the watercourse The
results of the monitoring program also provide insight into the effectiveness of a long-term program as
very few fluvial geomorphic programs are maintained for such an extensive period This warrants
additional discussion beyond results specific to the Carruthers Creek watershed
Both of the stations on Tributary A have relatively small cross-sectional areas which have enlarged over
the 13-year monitoring period (48 and 35) Due to the small size of the cross-sections small changes
in area result in a large percentage change The evolution of the two cross-sections is markedly
different While GTCC-11 exhibited a gradual consistent transition from a ldquoVrdquo to a ldquoUrdquo shaped
cross-section GTCC-9 appears to have experienced a more complex and abrupt transition The GTCC-9
cross-section exhibited a large change in cross-sectional area between 2003 and 2006 shifting to a
cross-sectional shape that differs from all other years After 2006 the cross-section re-established itself
as a distinctly different shape which consistently migrated towards the right bank and deepened for the
remainder of the monitoring period These results suggest that the 2006 monitoring captured the
cross-section after a specific event a brief instance which is not necessarily representative of the
ongoing long-term process The difference in adjustment between the two sites highlights the
importance of local site-specific characteristics While both cross-sections are enlarging potentially in
response to the same governing factor they do so differently The consistent adjustment at GTCC-11 is
23655-522 Carruthers Creek 2017-07-10 draftdocx 33 Matrix Solutions Inc
reflective of equal resistance of vegetation and bank materials At GTCC-9 the difference in bank
vegetation dense woody dogwood versus dense herbaceous grasses has biased the cross-sectional
adjustment to the right half of the cross-section where less force is required to erode the material
Tributary B is the larger of the two tributaries and has three monitoring stations For Tributary B
interpreting the cross-section adjustment with respect to potential systemic adjustment was
complicated by additional factors for two of the three stations GTCC-6 and GTCC-5 The GTCC-5
cross-section enlarged dramatically (98) doubling in size through incision as a result of a debris jam
failure This adjustment in the response to the local event masks potential channel adjustment which
could be attributed to broader systemic change At GTCC-6 the data was incomplete due to issues with
maintaining the cross-section as a result of severe erosion of the right bank Only the last three
monitoring years (2009 2012 and 2016) were comparable During this period the cross-sectional area
increased by 26 through retreat of the right bank and incision The results definitively indicate that
from 2009-2016 the cross-section is continually enlarging Based on the issues with the right bank pin in
2003 and 2006 it can be inferred that these cross-sections would have exhibited the same trend if the
bank pin had been maintained The third station GTCC-4 did not appear to be impacted by any
identifiable site-specific issues Therefore it is more plausible that adjustment at GTCC-4 is reflective of
potential broader scale influences At GTCC-4 the cross-section adjusted primarily through lateral
erosion as vertical adjustment was limited by coarse bed material The cross-sectional area increased by
25 between 2003 and 2016 transitioning to a distinctly different shape with increased bed width The
enlargement of GTCC-6 and GTCC-4 may be indicative of a broader scale response of Tributary B The
GTCC-5 cross-section may also be support this but it is unclear due to the prominent influence of a local
event
There are five monitoring stations located on the Main Branch of Carruthers Creek Similar to Tributary
B two of the stations had challenges with maintenance and produced incomplete data which was not
definitive At GCC-12 the overall trend of cross-sectional adjustment could not be determined The two
monitoring periods for which cross-sectional area could be compared produced conflicting results
cross-sectional area reduced from 2003 to 2006 and increased from 2009 to 2012 At GCC-7
cross-section graphs after 2006 could not be used due to movement or loss of the right bank pin With
only one monitoring period of data (2003-2006) in which cross-sectional area was reduced no definitive
trends could be identified Both GCC-7 and GCC-12 exhibited ongoing erosion of one of their banks this
could not be attributed to a particular channel process The remainder of the stations GCC-6 GCC-4
and GCC-2 were all located in the lower half of the watershed where ongoing development has occurred
during the monitoring period There does not appear to be an observable trend in the results from the
three stations The GCC-6 cross-section was the least active out of all the monitoring stations
Cross-sectional area increased by 48 during the monitoring period but the cross-sectional shape
remained static The increase in area was the result of erosion of the vertical left bank However
beyond the cross-section the overall GCC-6 reach was active with ongoing erosion slumping and
frequent loss of erosion pins The GCC-4 cross-section was the only monitoring cross-section that
23655-522 Carruthers Creek 2017-07-10 draftdocx 34 Matrix Solutions Inc
exhibited well-documented aggradation reducing cross-sectional area by 18 This is the result of an
accumulation of coarse material which was indicated by a coarsening trend in the grain size
distribution Erosion pin data for the site was relatively consistent with most pins exhibiting average
migration of 5cmyr The GCC-2 cross-section was highly active during the monitoring period increasing
and decreasing cross-sectional area between monitoring years However when comparing the 2003 and
2016 cross-sections there was negligible change in cross-sectional area Throughout the site vertical
banks severe undercutting and bank collapses were common It is assumed that the changes in the
cross-section are a manifestation of the frequent input of fine bank material which temporarily deposits
on the bed and then is periodically flushed downstream This process is supported by the grain size
distribution data which was notably fine for the size of the channel The results of the three downstream
main branch stations did not display a common response which could be attributed to broad scale
influences such as the surrounding ongoing development
The results of the Carruthers Creek monitoring program indicate that the watercourse is an active
channel whether the cross-section is enlarging aggrading or continually adjusting while maintaining a
similar size The sites on both Tributary A and Tributary B suggest that channel dimensions are
increasing The magnitude of increase was larger for the Tributary A sites presumably because it is the
smaller of the two tributaries and is therefore more sensitive to surrounding change Comparatively
while the main branch sites exhibited active channel processes overall change was relatively minimal
There was no indication of a common adjustment response amongst the main branch sites Similar to
the tributaries this is indicative of the larger channelrsquos resilience to accommodate changes to the
surrounding area It should also be considered that the main branch stations are the only stations
located in the developing area of the watershed while most of the tributary sites are located in the
upper agricultural and rural area of the watershed The expectation would be that the ongoing
development would alter the hydrologic regime of the downstream stations and this would manifest as
changes in morphology However this is not supported by the results Channel morphology and flow
regime are intrinsically linked which allows for inferences to be made about both characteristics when
there is sufficient knowledge of one Based on this it can be inferred that the tributary stations are
enlarging as a response to changes in the flow regime However it cannot be definitively determined
without a complementary flow monitoring program
Overall the 13-year monitoring period provided a unique opportunity to document changes in channel
morphology for the purposes of understanding channel processes Fluvial geomorphology monitoring
programs are generally undertaken for 3 to 5 years following the completion of a natural channel
design shorter 1 to 3 year programs are completed for characterization studies After reviewing the
results of the Carruthers Creek monitoring it is clear that a 3 to 5 year monitoring program would not
have adequately captured the ongoing trends The results also revealed the challenges with maintaining
a long-term program such as selecting an appropriate location and establishing a sufficiently wide
cross-section
23655-522 Carruthers Creek 2017-07-10 draftdocx 35 Matrix Solutions Inc
8 REFERENCES
Galli J 1996 Rapid Stream Assessment Technique Field Methods Metropolitan Washington Council of
Governments Washington DC 36pp
Parish Geomorphic Ltd (PARISH) 2003 Valley Segments Carruthers Petticoat and Duffins Creek
Watersheds Report prepared for the Toronto and Region Conservation Authority
September 2003
Ontario Ministry of the Environment (MOE) 2003 Stormwater Management Planning and Design
Manual Queenrsquos Printer Ottawa Ontario March 2003
httpwwwontariocadocumentstormwater-management-planning-and-design-manual
Parish Geomorphic Ltd (PARISH) 2004 Regional Monitoring Program - Fluvial Geomorphology
Component Pettitcoat Creek Carruthers Creek Duffins Creek and Highland Creek Watersheds
Report prepared for the Toronto and Region Conservation Authority April 2004
Toronto and Region Conservation Authority (TRCA) 2015 Crossings Guideline for Valley and Stream
Corridors September 2015 httpwwwtrcaoncadotAsset214493pdf
Toronto and Region Conservation Authority (TRCA) 2003 A Watershed Plan for Duffins Creek and
Carruthers Creek August 2003 httpwwwtrcaoncadotAsset25961pdf
Wolman M G 1954 ldquoA method of sampling coarse river-bed materialrdquo Eos Transactions American
Geophysical Union 35 (6) 951-956
23655-522 Carruthers Creek 2017-07-10 draftdocx 36 Matrix Solutions Inc
- Phase 1 Technical Reports
- Phase 1 Technical Reports
- CCWP_FluvialGeomorphologyReport-Matrix_2017_finalpdf
-
- CCWP_Ph1-techreports-intro-2017_v9_FluvGpdf
-
- Phase 1 Technical Reports
- Phase 1 Technical Reports
-
- CCWP_Ph1-techreports-intro-2017_v9_FluvGpdf
-
- Phase 1 Technical Reports
- Phase 1 Technical Reports
-

Carruthers Creek Watershed Plan Phase 1 Technical Reports
Introduction Watershed Plan Study Area
Carruthers Creek is a relatively small watershed with a drainage area of approximately 3748 hectares (9261 acres) ranging from two to three kilometres in width and only 18 kilometres in length (see map below) It is the easternmost watershed in TRCAs jurisdiction and is located entirely in the Region of Durham At the request of the Region of Durham a small section of lands in East Duffins Creek subwatershed which are immediately adjacent to Carruthers Creek watershed and outside of the provincial Greenbelt were included in the study area
The watershed occurs within the South Slope and Glacial Lake Iroquois physiographic regions south of the Oak Ridges Moraine Topographically most of Carruthers Creek watershed is flat to slightly rolling The exceptions are low hills associated with the Lake Iroquois Shoreline notably the Kinsale Raised Shoreline immediately west of Audley Road and south of Highway 7 and the main valley feature of Carruthers Creek itself which forms a distinct but shallow ravine from Taunton Road south to Highway 401
Carruthers Creekrsquos headwaters form to the south of the Oak Ridges Moraine in the City of Pickering Both the east and west branches of the creek originate north of Concession 8 their confluence is immediately north of Taunton Road and the creek enters Lake Ontario in the Town of Ajax Carruthers Creek contains a total of 61 kilometres of stream channels Historically portions of the watershed would have supported cold water fish populations including Brook trout Atlantic salmon Slimy sculpin and Mottled sculpin Instream barriers to fish movement in the watershed adversely impact the aquatic system by limiting access to feeding and spawning areas increasing water temperature and affecting sediment transport In addition some instream structures increase water velocities to the point where fish passage is prevented Instream structures that act as barriers to fish passage include dams weirs road and rail crossings and some culverts
Carruthers Creek watershed lies in the Great Lakes-St Lawrence floristic region which is comprised of mixed coniferous-deciduous forest There are two provincial Areas of Natural and Scientific Interest (ANSl) as designated by the Ontario Ministry of Natural Resources and Forestry in the watershed the Kinsale Raised Shoreline Earth Science ANSI designated for its distinct geological character as a well preserved part of the ancient Lake Iroquois Shoreline and Shoal Point Marsh Life Science ANSI which is included in the coastal Carruthers Creek Wetland Complex Provincially Significant Wetland Two smaller wetlands are evaluated as Locally Significant the Rossland Road Wetland Complex and the Salem Road Wetland Complex The Carruthers Creek Wetland Complex is divided into two Environmentally Significant Areas the coastal Carruthers Marsh and the Carruthers Creek Forest a few hundred metres inland
Long-term precipitation and air temperature patterns in the watershed are summarised from data collected by Environment and Climate Change Canada at the nearby Oshawa Water Pollution Control Plant station In 2015 precipitation volumes of 985 mm exceeded the 30 year (1981-2010) normal of 892 mm however the 2016 volumes were significantly lower at approximately 614 mm For three of the
last nine years the total volume of precipitation exceeded the 30 year normal Lower than normal precipitation volumes were reported in the years 2013 2015 and 2016
Stream flow records for the watershed are related to climate patterns Preliminary water quantity data suggest that 2015 was a wet year in terms of stream flow and 2016 was significantly drier Although stream flow has only been measured in the watershed for a relatively short period of record a wide range of climatic conditions has been observed
Carruthers Creek watershed is mainly rural north of Highway 7 From Highway 7 south to Taunton Road the majority of lands are in the Protected Countryside of the provincial Greenbelt however there is a noticeable loss of the integrity of the natural heritage system due to clearing of vegetation and filling Low to medium density suburban development predominates from Taunton Road south to the lakeshore Lands currently mapped as rural in the urban areas of Ajax are expected to be developed as employment lands to meet future demands The older parts of the built urban area have little to no stormwater controls while the newer parts include standard stormwater quality and quantity ponds accompanied by low impact development (LID) technologies There is also a flood vulnerable area in the Pickering Beach neighbourhood of Ajax
As expected there are differences in agricultural land use in the upper reaches versus mid-reaches of the watershed which may be attributed to land tenure drainage and soil properties or a combination of factors Horticulture dominates the east catchment whereas the west catchment is predominantly cash crops and at least one livestock operation although horticulture is also present In the urban areas of Ajax some lands slated for development are still cultivated with cash crops as an interim use Overall the land use in this small watershed is in transition therefore the characterization provided by the field work in Phase 1 of the watershed plan is an excellent benchmark for future study and decision-making Regular monitoring during and following this watershed planning process continuously improves our understanding of the watershed and will help to guide ongoing decision-making to protect restore and enhance Carruthers Creek watershed
CARRUTHERS CREEK FLUVIAL GEOMORPHIC ASSESSMENT OF REGIONAL WATERSHED MONITORING PROGRAM DATA 2003 -2016
Report Prepared for
TORONTO AND REGION CONSERVATION AUTHORITY
Prepared by
MATRIX SOLUTIONS INC
February 2017
Final revision 10 July 2017
Mississauga Ontario
Suite 200 2500 Meadowpine Blvd
Mississauga ON L5N 6C4
T 9058779531 F 9058774143
wwwmatrix-solutionscom
reviewed by
Tatiana Hrytsak MSc John Parish PGeo
Fluvial Geomorphology Specialist Principal Geomorphologist
CARRUTHERS CREEK
FLUVIAL GEOMORPHIC ASSESSMENT OF REGIONAL WATERSHED
MONITORING PROGRAM DATA 2003-2016
Report prepared for the Toronto and Region Conservation Authority February 2017
DISCLAIMER
We certify that this report is accurate and complete and accords with the information available during the site investigation Information
obtained during the site investigation or provided by third parties is believed to be accurate but is not guaranteed We have exercised
reasonable skill care and diligence in assessing the information obtained during the preparation of this report
This report was prepared for Toronto and Region Conservation Authority The report may not be relied upon by any other person or entity
without our written consent and that of Toronto and Region Conservation Authority Any uses of this report by a third party or any reliance on
decisions made based on it are the responsibility of that party We are not responsible for damages or injuries incurred by any third party as a
result of decisions made or actions taken based on this report
23655-522 Carruthers Creek 2017-07-10 draftdocx ii Matrix Solutions Inc
TABLE OF CONTENTS
1 INTRODUCTION 1
2 BACKGROUND REVIEW 1
21 Carruthers Creek State of the Watershed Report - Fluvial Geomorphology 1
22 A Watershed Plan for Duffins Creek and Carruthers Creek 2
23 Valley Segments Carruthers Petticoat Duffins Creek Watersheds 2
24 Regional Monitoring Program - Fluvial Geomorphology Component Petticoat Creek
Carruthers Creek Duffins Creek and Highland Creek Watersheds 4
3 FIELDWORK AND ANALYSIS METHODS 5
31 Cross-sectional Shape and Area 5
32 Substrate Size Distribution 9
33 Lateral Channel Migration 11
4 TRIBUTARY A 16
41 GTCC-11 17
42 GTCC-9 18
5 TRIBUTARY B 20
51 GTCC-6 20
52 GTCC-5 22
53 GTCC-4 23
6 CARRUTHERS CREEK MAIN BRANCH 25
61 GCC-12 25
62 GCC-7 27
63 GCC-6 28
64 GCC-4 30
65 GCC-2 31
7 DISCUSSION AND RECOMMENDATIONS 33
8 REFERENCES 36
LIST OF FIGURES
FIGURE 1 Geomorphic monitoring site locations and valley segments (PARISH 2003a) 3
FIGURE 2 Location of GTCC-11 monitoring station 17
FIGURE 3 Location of GTCC-9 monitoring station 19
FIGURE 4 Location of GTCC-6 monitoring station 21
FIGURE 5 Location of GTCC-5 monitoring station 22
FIGURE 6 Location of GTCC-4 monitoring station 24
FIGURE 7 Location of GCC-12 monitoring station 26
23655-522 Carruthers Creek 2017-07-10 draftdocx iii Matrix Solutions Inc
FIGURE 8 Location of GCC-7 monitoring station 27
FIGURE 9 Location of GCC-6 monitoring station 29
Figure 10 Location of GCC-4 monitoring station 30
Figure 11 Location of GCC-2 monitoring station 32
LIST OF TABLES
TABLE 1 Stability rankings for Carruthers Creek 5
TABLE 2 Summary of cross-sectional area and percent change for all monitoring stations
2003-2016 7
TABLE 3 Summary of grain size distribution for all monitoring stations 2003-201610
TABLE 4 Summary of erosion pin data for all monitoring stations 2003-2016 12
APPENDICES
APPENDIX A Carruthers Creek Regional Watershed Monitoring Program Site Map
APPENDIX B Individual Site Summary Sheets
23655-522 Carruthers Creek 2017-07-10 draftdocx iv Matrix Solutions Inc
1 INTRODUCTION
The Toronto and Region Conservation Authority (TRCA) has undertaken the process of completing an
updated watershed plan for Carruthers Creek The original watershed plan was prepared in 2003 at a
time when minimal supporting field data was available for the fluvial geomorphology component It was
identified that as the Carruthers Creek watershed becomes more developed it will be critical to establish
baseline conditions to assess potential impacts As part of this work the Regional Watershed Monitoring
Program (RWMP) was established by TRCA Matrix Solutions Inc (formerly PARISH Geomorphic Ltd)
established the ten monitoring stations along Carruthers Creek in 2003 (Appendix A) These stations
were updated every three years through 2012
To provide support for the updated Carruthers Creek watershed plan Matrix was retained by TRCA to
complete a 2016 update of the monitoring stations and prepare a report analysing the full monitoring
data set which includes years 2003 2006 2009 and 2012 This analysis will provide an understanding of
channel morphology which can be employed to guide policy recommendations and assess future
development scenarios in the watershed
2 BACKGROUND REVIEW
21 Carruthers Creek State of the Watershed Report - Fluvial Geomorphology
The State of the Watershed (SOW) report (TRCA 2002) was developed as a reference document for the
companion document the Watershed Management Strategy The SOW report would be used by land
use planning decision makers who have jurisdiction related to the Carruthers Creek watershed
A number of technical experts contributed to the document producing chapters focusing on various
aspects of the watershed including physical properties and processes and cultural characteristics The
chapter focusing on fluvial geomorphology was reviewed to provide background for the current
Carruthers Creek report
The fluvial geomorphology chapter provided a broad overview of the general form and function of the
Carruthers Creek watershed The report discussed the underlying geology drainage density and shape
of the watershed The watershed is a narrow elongated basin which is concave in shape with steeper
headwaters and generally flattens progressing downstream towards Lake Ontario The channel planform
reflects this the channel is straighter in the upstream and becomes more sinuous south of Highway 401
Fine grained substrates are common as a result of the underlying geology which is predominantly from
the glacial Lake Iroquois It was noted in the reporting that there was very little field data available for
Carruthers Creek and was recommended that broader scale studies will need to be undertaken to
provide the information necessary to inform management decisions The report cautioned that as
development of the area progresses more local-scale studies will likely be completed and it will be
necessary to have a holistic understanding of the watershed
23655-522 Carruthers Creek 2017-07-10 draftdocx 1 Matrix Solutions Inc
22 A Watershed Plan for Duffins Creek and Carruthers Creek
Watershed Plans were developed for each of TRCAs nine watersheds (TRCA 2003) The purpose of the
watershed plans was to complete a thorough study of natural features and functions human heritage
public use and the interdependence of these elements This was completed through the SOW Reports
The Watershed Plans then focused on evaluating the potential effects of current and future watershed
activities and identifying management actions to minimize effects and enhance existing features
The report identified that the key management issues facing the Carruthers Creek watershed are those
that challenge all urbanizing creek systems urban growth ongoing stewardship of existing agricultural
and urban land uses and firm protection of existing natural areas Technical studies indicated that
protecting and enhancing terrestrial natural heritage cover is critical to achieving management goals
For Carruthers Creek it was noted that there is a less robust terrestrial natural heritage system and that
within the development process there are very few opportunities to grow the area of natural cover
Without protection of these areas and changes to development planning it is likely that as urban growth
continues the health of Carruthers Creek will decline The report also highlighted the importance of
improving areas with existing development through reforestation streambank management and
changing cultural practices through community engagement initiatives The Regional Watershed
Monitoring Network (RWMN) is a key component of continuing to monitor progress of these goals and
objectives under the watershed plan It would also address information gaps by contributing additional
data to establish baseline conditions in lesser studied areas This would be critical for Carruthers Creek
considering the lack of available data to support the SOW fluvial geomorphology assessment
23 Valley Segments Carruthers Petticoat Duffins Creek Watersheds
PARISH was retained to establish the fluvial geomorphology stations as part of the RWMP for TRCA
(PARISH 2003) As part of this process a valley segment report was produced delineating the
Carruthers Petticoat and Duffins Creek watersheds into distinct segments Valley segments are
considered to be relatively homogenous sections of a watercourse that exhibit distinct physical
characteristics These characteristics are determined by governing factors such as topography geology
climate and hydrography The valley segments were delineated based on differences in stream order
catchment size slope and surficial geology Locations for the RWMN sites were then selected based on
representative coverage of the valley segments
Carruthers Creek was divided into 26 valley segments with the 12 segments on the Main Branch Based
on stream length and types of valley segments ten monitoring sites were selected for Carruthers Creek
five on the tributaries and five on the Main Branch (Figure 1)
23655-522 Carruthers Creek 2017-07-10 draftdocx 2 Matrix Solutions Inc
GPC -1
1 0 1 2 3 4 5 KilometersPetticoat Creek WatershedCarruthers Creek WatershedDuffins Creek Watershed
Valley SegmentsNon-Selected SegmentsSelected Segments
Geomorphic Monitoring LocationValley Segment Boundaries
N
EW
S
Figure 3 Geomorphic monitoring site locations within the Petticoat Creek Duffins Creek and Carruthers Creek Watershed
GPC-4 Identification Number
GC C-2
GC C-4
GC C-6
GT CC -4
GC C-7
GTCC -5
GT CC -6
GT CC -9
GT CC -11
GC C-12
GTP C -16
GT P C -14
GT P C -6
GT PC-4
GTP C -11
GP C -4
GP C -3GT P C -1
GD C -2
GT D C -6GT D C -8
GT D C -2GM C -1
GM C-2
GM C -4
GW X- 3
GW X- 2
GW D -1 5
GW D -14
GR C -2
GR C-1
GS V-1
GW D -1 3
GW D -8
GW D -1 0
GW D -4GW V- 1
GW D -3
GW D -2
GG C -6
GG C -4
GG C -2
GB C -4
GB C -3
GU C -4
GU C -2
GD C -4
GD C -3
GD C -5
FIGURE 1 Geomorphic monitoring site locations and valley segments (PARISH 2003a)
23655-522 Carruthers Creek 2017-07-10 draftdocx 3 Matrix Solutions Inc
24 Regional Monitoring Program - Fluvial Geomorphology Component Petticoat Creek Carruthers Creek Duffins Creek and Highland Creek Watersheds
The RWMP was established to track changes in physical habitat A fluvial geomorphology component
was included because the physical form and function of a watercourse are key elements of aquatic
habitat (PARISH 2004) The TRCA established 150 monitoring sites as part of this program In 2003
fluvial geomorphology sites were set up in the final three watersheds Petticoat Carruthers and Duffins
(additional sites were established for Highland Creek) For the three watersheds 50 monitoring sites
were allotted The number of field sites in each watershed was dictated by the number of valley
segments within it Several sites were linked to fisheries monitoring sites to allow for integration
between disciplines
Setting up the fluvial geomorphology monitoring sites involved additional data collection beyond what
was recommended to maintain the monitoring program This was to provide a larger baseline condition
dataset At each site the following took place
10 bankfull cross-sections were completed this included establishment of the control cross-section
for the monitoring program
A bed chain was installed at or near the monitoring cross-section
Up to five erosion pins were installed through the length of the field site Generally at least one to
two erosion pins were located in close proximity to the control cross-section
A long profile survey was completed through the length of the field site A benchmark was
established to allow future surveys to tie-into the original survey
Photos were taken at documented vantage points so they could be repeated in the future
A GPS reading was taken to document the location of the control cross-section
A historical assessment was completed based on the 1999 aerial photos for the area and floodline
mapping from 1964 and 1987 The assessment was relatively high-level providing general observations
of the watercourse and the surrounding area A Rapid Geomorphic Assessment (RGA) and Rapid Stream
Assessment Technique (RSAT) were completed at each site to evaluate stability For Carruthers Creek
two reaches were considered stable two were stressed and six were transitional (Table 1)
23655-522 Carruthers Creek 2017-07-10 draftdocx 4 Matrix Solutions Inc
3
TABLE 1 Stability rankings for Carruthers Creek
Valley Segments RGA Stability Index RSAT Stability Index
GTCC-11 003 In Regime 23 Moderate
GCC-12 015 In Regime 23 Moderate
GTCC-9 029 Transitional 25 Moderate
GTCC-6 022 Transitional 28 Moderate
GTCC-5 057 Adjustment 215 Moderate
GTCC-4 022 Transitional 20 Moderate
GCC-7 030 Transitional 19 Low
GCC-6 036 Transitional 20 Moderate
GCC-4 038 Transitional 23 Moderate
GCC-2 044 Adjustment 18 Low
(PARISH 2004)
FIELDWORK AND ANALYSIS METHODS
Matrix personnel were required to comply with legislated and Matrix health and safety standards
Field data collection to update the monitoring stations was completed over four days in October 2016
During this time cross-sections pebble counts erosion pin measurement and monumented
photographs were completed RGA and RSAT rapid assessments were also completed for each valley
segment to compare with results from 2004 The updated 2016 data was then compiled with the
preceding datasets in a consistent format for comparison and analysis The integration of the various
datasets allows for comparison between monitoring years and analysis of the overall monitoring period
Summary tables were compiled with the results of these analyses for cross-sections erosion pins and
substrate gradations Additionally summary sheets for each site with cross-section graph overlays and
corresponding photographs for each monitoring year are located in Appendix B to facilitate
interpretation
31 Cross-sectional Shape and Area
Each of the ten established cross-sections are benchmarked with nails which were originally located
well beyond bankfull for detailed topographic data collection between the points The measuring tape
can then be tied to the pins each time re-measurement is completed The start of the cross-section (zero
end of the tape) is always at the left bank pin and terminates at the right bank pin
To compare the cross-section data the various years are overlaid on a graph to provide direct
comparison This comparison is done qualitatively identifying which areas of the cross-section
expanded or contracted and relating this to overall channel processes Quantitatively cross-sectional
area and percent change of cross-sectional area are calculated (Table 2) To provide additional detail on
where the change within the cross-section is occurring it is often useful to compare the maximum
depth bottom width bankfull width and wetted width This aids in revealing how the cross-section is
23655-522 Carruthers Creek 2017-07-10 draftdocx 5 Matrix Solutions Inc
changing and if the overall shape is transitioning Using bottom width or bankfull width is particularly
useful because the width of the monitoring cross-section must remain static to allow for comparison
The width of the monitoring cross-section should also be well beyond bankfull to allow for
documentation of changes in bankfull
23655-522 Carruthers Creek 2017-07-10 draftdocx 6 Matrix Solutions Inc
- - - -
TABLE 2 Summary of cross-sectional area and percent change for all monitoring stations 2003-2016
Monitoring Station
2Cross Sectional Area (m ) Percent Change
Total Change () 2003 2006 2009 2012 2016 2003 2006 2006 2009 2009 2012 2012 2016
GTCC-11 041 048 051 052 061 1694 733 046 1769 4842
GTCC-9 083 099 101 099 113 1858 209 -157 1348 3522
GTCC-6 195 302 335 405 423 NA NA 2065 460 2620
GTCC-5 257 246 299 426 511 -435 2139 4249 1990 9837
GTCC-4 164 179 192 207 206 904 686 793 -025 2545
GCC-12 123 110 139 155 157 -1084 NA 1121 NA NA
GCC-7 175 150 276 240 NA -1442 NA NA NA NA
GCC-6 542 520 554 567 568 -412 668 234 016 486
GCC-4 781 705 738 673 641 -975 472 -876 -483 -1794
GCC-2 327 284 338 362 333 -1313 1894 702 -785 -138
Notes GCC-12 Cross-section width increased in 2009 pin moved back
2016 bank pins could not be found cross-section reinstalled at a larger width in the same location as approximated based on
erosion pin
GTCC-6 2006 cross-section width increased from 360 m to 600 m Bank pin could not be found from original 2003 installation 2009 cross-section width increased by 085 m Total change is calculated for 2009-2016
GCC-7 2009 cross-section width increased from 400 m to 552 m 2012 told that the right cross-section pin was removed by golf course maintenance staff Reinstalled flush to bank at 552 m
23655-522 Carruthers Creek 2017-07-10 draftdocx 7 Matrix Solutions Inc
2016 no pins or indicators of cross-section location could be found cross-section not reinstalled due to challenges with
maintaining
23655-522 Carruthers Creek 2017-07-10 draftdocx 8 Matrix Solutions Inc
Generally the cross-section is considered the most reliable technique for monitoring When the bank
pins are established sufficiently far from the top of bank the risk that they will be lost to erosion is
minimized However if a bank pin must be moved due to erosion risk a number of issues can arise and
it is very difficult to ensure the accuracy of future cross-section comparisons If a bank pin cannot be
found and must be re-established it is highly unlikely that comparisons will be accurate It is difficult to
properly align the re-established pin with the original pin even when the original width is known When
a bank pin is moved back from the known original pin to protect is from erosion it must be properly
documented otherwise it is difficult to make accurate comparisons Even when the bank pin is moved
and properly documented moving one bank pin further into the floodplain generally moves the pin to
ground that is slightly higher than the original location Then when the cross-section is measured the
measuring tape cannot be properly levelled impacting the cross-section graph by artificially deepening a
portion of the cross-section This can be compensated for using the water surface to determine the
difference in elevation If the channel is dry the error cannot be quantified or addressed This is why it is
critical to establish long-term monitoring cross-section bank pins far beyond the top of bank
32 Substrate Size Distribution
To characterize the substrates at each cross-section pebble counts are completed following a modified
Wolman (1954) technique A total of 50 random particles are selected and measured along the median
axis Particle size distributions are tabulated accordingly to produce the representative grain sizes D16
D50 and D84 These values are compared between monitoring periods to identify changes in the overall
substrate distribution (Table 3)
23655-522 Carruthers Creek 2017-07-10 draftdocx 9 Matrix Solutions Inc
TABLE 3 Summary of grain size distribution for all monitoring stations 2003-2016
Monitoring Station (listed in upstream to downstream)
2003 2006 2009 2012 2016
Data displayed in cm
GTCC-11
D16 00009 00009 00009 00002 00004
D50 00009 00009 00009 00049 00008
D84 00190 00009 10 0134 0014
GTCC-9
D16 005 050 019 049 000042
D50 06 20 15 05 052
D84 23 61 50 15 319
GTCC-6
D16 00009 00009 00009 00002 00006
D50 00009 050 049 0019 0090
D84 00009 200 300 200 10
GTCC-5
D16 0031 049 00009 0494 179
D50 059 100 005 150 339
D84 250 180 200 400 679
GTCC-4
D16 011 049 023 005 081
D50 100 150 250 150 192
D84 400 450 480 300 411
GCC-12
D16 0019 00002 0076 170 168
D50 15 10 25 40 48
D84 56 33 60 83 85
GCC-7
D16 053 005 019 049 NA
D50 300 250 300 150 NA
D84 900 1200 680 800 NA
GCC-6
D16 00009 0049 011 050 052
D50 059 100 049 100 202
D84 350 180 230 280 341
GCC-4
D16 011 050 049 100 159
D50 250 150 300 350 988
D84 960 680 1080 750 1623
GCC-2
D16 0019 00009 00009 00049 016
D50 15 049 049 050 036
D84 56 10 15 18 05
23655-522 Carruthers Creek 2017-07-10 draftdocx 10 Matrix Solutions Inc
Substrate monitoring can be complicated by two different factors fine material and seasonality When a
distribution is dominated by fine material (silt sand pebbles) it is very difficult to identify shifts and
nuances in the grain size distribution Therefore substrate monitoring in smaller tributaries or
headwater generally only identifies change if there is a shift from fine material to gravel material This
would require a significant overall change to the system such as incision to remove the upper layer of
fine material revealing underlying coarser material There are also seasonal changes to the grain size
distribution that occur related to the different flow conditions In the summer grain size distributions
are often finer due to the accumulation of fine material during low flow conditions To account for this
monitoring should ideally be completed within the same time frame each monitoring year
Flow conditions should also be taken into account when planning the monitoring visit for the
same reason
33 Lateral Channel Migration
Erosion pins are installed horizontally into the face of stream banks throughout the monitoring site to
provide a means of quantifying channel migration at these locations Each erosion pin is a one meter
length of rebar installed below the bankfull elevation and above the base flow level A portion of the
erosion pin is left exposed from the bank and measured (typically 20 cm) providing a reference length
when re-measured in subsequent monitoring periods The pins serve as a direct measure of bank
recessionmigration rate and are typically installed on the outside bank of pools or straight sections of
channel to serve as controls For each monitoring site four to five pins were installed This generally
included two erosion pins at the monitoring cross-section to corroborate the cross-section results
Change in pin exposure is re-measured during each monitoring year The total change in exposure is
then calculated for the entire monitoring period Total change in exposure is divided by the time period
to determine the migration rate in cmyr (Table 4) The time period differs by erosion pin based on the
available data not all erosion pins have data for every monitoring period This is because during a longer
monitoring period such as the 3-year cycle for the RWMP it is more likely that an erosion pin may not
be found on a subsequent visit If the erosion pin is not found there are a number of explanations the
erosion pin was eroded out of the bank the erosion pin was covered by slumped material or the
erosion pin remained in the bank but could not be located by the practitioner (human error) Ideally the
practitioner should provide additional notes when a change in exposure is not measured Often if an
erosion pin has been eroded out of the bank it may be found lying on the bed noting this will provide
qualitative data for the location It would be uncertain when the pin was fully eroded out of the bank
but it can be concluded that the bank has eroded at least the one meter length of the erosion pin during
the three year period Similarly there is often a general indication that an erosion pin may have been
covered by slumped material if slumps are common in the monitoring reach At minimum if an erosion
pin is not found it generally suggests that a channel is relatively active It is also important when
interpreting the calculated migration rates and measured changes in exposures to consider that erosion
is often an episodic process rather than a occurring at a steady consistent rate
23655-522 Carruthers Creek 2017-07-10 draftdocx 11 Matrix Solutions Inc
- - - -
TABLE 4 Summary of erosion pin data for all monitoring stations 2003-2016
Site Location ID Change in exposure (cm)
Total (cm) Time period for total Migration rate myr
Migration rate cmyr 2003 2006 2006 2009 2009 2012 2012 2016
GTCC-11
RB EP 1 55 145 3 -6 17 2003-2016 0013 131
LB EP 2 25 15 7 -65 18 2003-2016 0014 138
LB EP 3 15 5 18 1 255 2003-2016 0020 196
RB EP 4 05 55 245 11 415 2003-2016 0032 319
LB EP 5 45 -35 45 -15 4 2003-2016 00031 031
GTCC-9
RB EP 1 20 135 50 835 2003-2012 0093 928
LB EP 2 3 -35 5 45 2003-2012 0005 050
LB EP 3 5 -6 -1 -2 2003-2012 -0002 -022
RB EP 4 16 165 2 345 2003-2012 0038 383
RB EP 5 85 325 16 57 2003-2012 0063 633
GTCC-6
LB EP 1 225 -25 235 435 2003-2012 0048 483
LB EP 2 -85 155 7 2003-2009 0012 117
LB EP 3 45 45 2009-2012 015 15
RB EP 4 31 32 70 133 2006-2016 013 133
LB EP 5 -55 305 3 -8 20 2003-2016 0015 154
23655-522 Carruthers Creek 2017-07-10 draftdocx 12 Matrix Solutions Inc
- - - -Site Location ID
Change in exposure (cm) Total (cm) Time period for total
Migration rate myr
Migration rate cmyr 2003 2006 2006 2009 2009 2012 2012 2016
GTCC-5
RB EP 1 36 5 36 2003-2006 0120 12
LB EP 2 -2 1 -05 05 -1 2003-2016 -0001 -008
RB EP 3 195 19 75 46 2003-2012 0051 511
RB EP 4 25 25 2006-2009 0083 833
LB EP 5 -7 6 -55 -65 2003-2012 -0007 -072
GTCC-4
LB EP 1 18 34 52 2006-2012 0087 867
LB EP 2 155 14 6 20 2009-2016 0029 286
RB EP 3 205 12 18 14 645 2003-2016 0050 496
RB EP 4 -145 365 -195 75 10 2003-2016 0008 077
LB EP 5 9 57 13 79 2006-2016 0079 790
GCC-12
LB EP 1 21 255 8 545 2003-2012 0061 606
LB EP 2 34 65 55 43 46 2003-2016 0035 354
LB EP 3 -345 75 -27 2003-2009 -0045 -450
RB EP 4 30 20 50 2006-2012 0083 833
RB EP 5 1 65 14 -5 215 2003-2016 0017 165
GCC-7 RB EP 1 65 85 15 2009-2016 0021 214
23655-522 Carruthers Creek 2017-07-10 draftdocx 13 Matrix Solutions Inc
- - - -Site Location ID
Change in exposure (cm) Total (cm) Time period for total
Migration rate myr
Migration rate cmyr 2003 2006 2006 2009 2009 2012 2012 2016
RB EP 2 145 47 -235 38 2003-2012 0042 422
RB EP 3 30 305 305 2009-2012 0102 1017
LB EP 4 35 -35 -75 -115 -19 2003-2016 -0015 -146
GCC-6
LB EP 1 87 31 69 26 213 2003-2016 0164 1638
LB EP 2 5 155 05 95 305 2003-2016 0023 235
RB EP 3 48 48 2009-2012 0160 16
RB EP 4 555 38 935 2006-2012 0156 1558
RB EP 5 13 135 265 2006-2012 0044 442
GCC-4
LB EP 1 7 11 44 44 2012-2016 0110 11
RB EP 2 44 16 23 39 2009-2016 0056 557
RB EP 3 45 8 2 135 685 2003-2016 0053 527
LB EP 4 45 16 5 7 325 2003-2016 0025 25
RB EP 5 275 1 225 10 61 2003-2016 0047 469
GCC-2
LB EP 1 11 5 5 21 2003-2012 0023 233
RB EP 2 2 -05 -2 -25 -3 2003-2016 -0002 -023
RB EP 3 -10 15 8 95 2009-2016 0014 136
23655-522 Carruthers Creek 2017-07-10 draftdocx 14 Matrix Solutions Inc
- - - -Site Location ID
Change in exposure (cm) Total (cm) Time period for total
Migration rate myr
Migration rate cmyr 2003 2006 2006 2009 2009 2012 2012 2016
RB EP 4 40 21 415 1025 2006-2016 0100 1025
LB EP 5 545 135 405 1085 2003-2012 0120 1206
erosion pins highlighted with yellow are those located at the monitoring cross-section
23655-522 Carruthers Creek 2017-07-10 draftdocx 15 Matrix Solutions Inc
34 Rapid Assessment Results
A rapid assessment was completed for each valley segment in accordance with the RGA (MOE 2003)
and RSAT (Galli 1996) stream assessment protocols Rapid assessment were undertaken to investigate
any significant changes in the geomorphic stability or ecological health of each segment relative to
previously reported results (Parish 2004 TABLE 1) A summary of the 2016 RGA and RSAT results is
presented in TABLE 5 In general 2016 RGA scores were slightly lower than those previously recorded in
2004 suggesting an improvement in channel stability (highlighted in red in TABLE 5) RSAT scores
remained consistent with very little deviation from results reported in 2004 Although the results
suggest improved channel stability within the catchment the rapid assessment protocols are very
subjective and can often be misleading Long term monitoring of geomorphic parameters as those
discussed in previous subsections provides a better method of assessing trends in channel form and
function A detailed description of each valley segment and comprehensive assessment of long term
monitoring results is provided in subsequent sections
TABLE 5 Summary of 2016 Rapid Assessment Results
Valley Segments RGA Stability Index RSAT Stability Index
GTCC-11 009 In Regime 24 Moderate
GTCC-9 013 In Regime 25 Moderate
GTCC-6 016 In Regime 26 Moderate
GTCC-5 032 Transitional 30 Moderate
GTCC-4 025 Transitional 27 Moderate
GCC-12 015 In Regime 28 Moderate
GCC-7 013 In Regime 23 Moderate
GCC-6 020 Transitional 27 Moderate
GCC-4 018 In Regime 34 Moderate
GCC-2 028 Transitional 27 Moderate
23655-522 Carruthers Creek 2017-07-10 draftdocx 16 Matrix Solutions Inc
4 TRIBUTARY A
Tributary A is located at the upstream end of the watershed beginning north of Concession 7 and
confluences with the Main Branch north of Highway 7 The tributary is approximately 4 km in length and
flows through rural area where the dominant surrounding land use is agricultural The riparian corridor
for the tributary is generally 40 to 100 m wide Vegetation consisted of deciduous swamp meadow
marsh buckthorn deciduous thicket and a small area of hardwood deciduous forest downstream of
Highway 407 Two monitoring stations were located on Tributary A GTCC-11 and GTCC-9 The valley
segment containing GTCC-11 was classified as 3M small catchment and high slope The valley segment
containing GTCC-9 was classified as 2M small catchment and moderate slope
41 GTCC-11
The GTCC-11 station is located approximately 200 m upstream of Highway 7 The channel is located in
an area vegetated with shrubs tall grasses and deciduous trees This vegetated area is approximately
60m wide beyond which are agricultural fields The eastern bank is vegetated with poplar trees and red
osier dogwoods while the western bank is vegetated with tall dense grasses
FIGURE 2 Location of GTCC-11 monitoring station
In 2003 the cross-sectional area for the monitoring cross-section was 041 m2 The cross-section had a
narrow ldquoVrdquo shape typical of a small tributary At the time of survey (October) the wetted width was
030 m The bankfull width was approximately 071 m and the max depth was 036 m Over the
monitoring period the cross-section exhibited a steadily increasing cross-sectional area Between 2003
23655-522 Carruthers Creek 2017-07-10 draftdocx 17 Matrix Solutions Inc
and 2016 the cross-sectional area increased by 010 m2 or approximately 48 The cross-section overlay
indicates that this change corresponds to a deepening and widening of the thalweg transitioning the
cross-section from a ldquoVrdquo to a ldquoUrdquo shape The 2006 and 2009 cross-sections show the cross-section
deepening to a maximum depth of 043 m in 2009 The 2012 and 2016 cross-sections then show
widening of the bed through ongoing toe erosion while the maximum depth returns to a consistent
040 m Comparing the 2016 cross-section to the other years also suggests deepening of the floodplain
area This could be a result of higher flows more frequently spilling onto the floodplain and establishing
a larger bankfull cross-section Shifts in floodplain topography can also be tied to growth and die-off of
dense tall grass vegetation These changes in cross-sectional shape are a manifestation of typical
channel processes in a small headwater channel
The erosion pins generally exhibited increased exposure between monitoring periods The maximum
increase in exposure was 245 cm for EP4 between 2009 and 2012 During this monitoring period there
was also a large change in exposure (18 cm) for the erosion pin at the monitoring cross-section (EP3)
Based on these exposures the erosion rates would be approximately 8 cmyr and 6 cmyr respectively
The erosion rates based on the full monitoring period (13 years) ranged from 031 cmyr to 319 cmyr
The average erosion rate is 163 cmyr
The substrate at GTCC-11 is composed of fine grained materials including sand silt and small pebbles
Over the monitoring period this was consistent with no noticeable coarsening
42 GTCC-9
The GTCC-9 station is located approximately 700 m downstream of GTCC-11 It is approximately 2 km
from the confluence with the main channel At GTCC-11 the channel is located on the floor of a valley
which is approximately 20 to 40 m wide The channel meanders across the valley floor periodically
contacting the valley walls The valley floor is vegetated with meadow grasses and woody shrubs such as
buckthorn and red osier dogwoods The slopes are populated by deciduous trees Beyond the top of the
valley are agricultural fields At the monitoring cross-section the right bank (western) is vegetated with
tall grasses and the left bank (eastern) is covered by a large red osier dogwood The monitoring photos
indicate that the cross-section was originally installed immediately downstream of the dogwood
Overtime the dogwood has grown sufficiently large that it encompasses the area where the left bank pin
is located This made it difficult to properly level the measuring tape along the left bank due to the
dense woody vegetation that must be pushed down to allow the tape to lie flat
23655-522 Carruthers Creek 2017-07-10 draftdocx 18 Matrix Solutions Inc
FIGURE 3 Location of GTCC-9 monitoring station
In 2003 the cross-sectional area for the monitoring cross-section was 083 m2 The cross-section had a
notched low-flow channel in the center with a bottom width of approximately 050 m The 2006
cross-section was distinctly different from all other monitoring years and appears to have captured a
transitional period The cross-section bottom width increased to approximately 077 m and no longer
exhibited a defined low-flow area Between 2003 and 2006 cross-sectional area increased by 016 m2
the largest change during the 13-year period Due to the transitional shape it was difficult to define
bankfull for the 2006 cross-section The cross-sections for 2009 2012 and 2016 all indicate that the
channel is migrating towards the right bank This is evidenced by the increasing elevation of the left
bank profile and the consistent retreat of the right bank The cross-section is also deepening along the
right side Over the 13-year monitoring period the bed has deepened by approximately 010m based on
comparison of the max depth values from 2016 and 2003 The overall cross-sectional area has increased
by 030 m2 or 35
Two erosion pins are located at the monitoring cross-section one in each bank Both pins exhibited an
increase in exposure between 2003 and 2006 when the cross-section shape widened From 2006 to
2012 the right bank pin (EP4) exhibited continued increases in exposure while the left bank pin (EP3)
exhibited small reductions in exposure This is consistent with the migration of the channel towards the
right bank Based on the EP4 data the average erosion rate for the right bank at the monitoring
cross-section is 383 cmyr During the monitoring period the largest changes in exposure were noted at
EP1 and EP5 This was a result of their locations both were located on the outer bank of a bend The
average migration rates based on the EP1 and EP5 data are 928 cmyr and 633 cmyr
23655-522 Carruthers Creek 2017-07-10 draftdocx 19 Matrix Solutions Inc
5
The substrate at GTCC-9 is composed of fine grained material and medium sized gravel The substrate
was relatively consistent over the monitoring period with 2006 and 2009 considered coarser than other
years based on the D50 These years may have been coarser because the cross-section was actively
enlarging and more of the fine material had been removed Additionally the 2009 cross-section was
measured in April when high flows are more frequent due to spring melt This leads to seasonally
coarse distributions as fine material is flushed away more regularly
TRIBUTARY B
Tributary B begins northeast of Tributary A south of Concession 8 It is the larger of the two tributaries
approximately 94 km in length more than double the length of Tributary A North of Highway 7 the
channel flows through rural agricultural land with a riparian corridor ranging from approximately 10m
wide in the headwaters to approximately 80 m wide south of Highway 407 South of Highway 7
the channel flows through a small residential development where a channel design has been
implemented The channel then flows through a dense woodlot area before continuing through Deer
Creek Golf Course The confluence with the Main Branch is located near the south end of the golf
course There are three monitoring stations located on Tributary B all of which are located downstream
of Highway 7 The valley segment containing GTCC-6 is classified as 1H small catchment and low slope
The valley segment containing GTCC-5 is classified as 3H small catchment and high slope The valley
segment containing GTCC-4 is classified as 2H small catchment and moderate slope
51 GTCC-6
The GTCC-6 station is the most upstream station located approximately 325 m downstream of Highway
7 near the crossing of Concession 4 On the south side of the channel is a small deciduous woodlot with
meadow grasses The north side is vegetated with tall dense meadow grasses and shrubs The
monitoring cross-section is located in a highly active area of the channel where ongoing erosion of the
right bank is occurring As a result of this there were challenges maintaining the cross-section bank pins
The 2003 cross-section was not considered as part of the results because the cross-section was
reinstalled in 2006 after the right bank pin was completely lost The 2006 cross-section is 23 m wider
than the original 2003 cross-section There also appeared to be an issue with the 2006 cross-section
when compared to subsequent cross-sections This is likely related to the movement of the right pin
from 60 m (2006) to 685 m (2009) Therefore only the 2009 2012 and 2016 cross-sections were
evaluated Based on the different months in which the monitoring was completed (October December
April) the channel is regularly dry during low flow periods such as summer and early fall However based
on the monitoring results it produces sufficient flow during wetter periods such as spring and rainfall
events to result in toe erosion and undercutting
23655-522 Carruthers Creek 2017-07-10 draftdocx 20 Matrix Solutions Inc
FIGURE 4 Location of GTCC-6 monitoring station
The three cross-sections indicate that the cross-section has deepened and also migrated further into the
right bank This is expected given the erosion and severe undercutting of the right bank seen in the
monitoring photos Minimal change to the left bank profile has occurred Between 2009 and 2012 the
cross-section deepened with the maximum depth increasing from 100 m to 113 m The 2016
cross-section exhibits aggradation along the left bank toe and erosion of the right bank toe There were
increases in cross-sectional area both in 2012 and 2016 indicating that the channel is not just migrating
towards the right bank but also enlarging The cross-sectional area in 2009 was 335 m2 and increased to
405 m2 in 2012 and then 423 m2 in 2016 Over the 7-year period this was an increase of 088 m2 or
262
Two erosion pins are located at the monitoring cross-section one in each bank The right bank pin (EP4)
exhibited large increases in exposure every monitoring period Based on the data from EP4 the
migration rate of the right bank is approximately 133 cmyr The left bank pin (EP5) exhibited changes
in exposure ranging from -8cm to 305 cm This would suggest that there is erosion followed by periodic
slumping of material along that bank The other erosion pins indicated that toe erosion is widespread
throughout the reach For example EP2 and EP3 were located in a bend that was actively eroding both
pins were found eroding out of the bank and lying on the bed at two of the monitoring visits This type
of severe toe erosion and undercutting often occurs in channels with grass dominated vegetation
The substrate at GTCC-6 is composed of fine grained materials including sand silt and small pebbles
Over the monitoring period this was consistent with no noticeable coarsening
23655-522 Carruthers Creek 2017-07-10 draftdocx 21 Matrix Solutions Inc
52 GTCC-5
The GTCC-5 station is located in a large woodlot upstream of the Deer Creek Golf Course Through this
area the channel is quite sinuous with tight bends and steep eroding banks Woody debris such as
branches and downed trees was common resulting in jams The banks in this reach were higher than
those upstream ranging from 050 to 125 m This is indicative of incision The monitoring cross-section
is located on the downstream straight section of an ldquoSrdquo bend There is substantial erosion along the
outer bank upstream of the cross-section the bend has over widened and a formed a large pool A large
willow tree fell across the channel at the monitoring cross-section between 2009 and 2012 due to this
the measuring tape would not lie flat in 2012 and 2016 The impact on the cross-section graph could not
be quantified it is assumed that the cross-section shape is representative of field conditions Specific
depth measurements for 2012 and 2016 are likely to be slightly higher than in the field due to the tree
pushing the tape higher in the center of the cross-section The two cross-sections correlate well with
each other signifying that the tree had a consistent impact on measuring tape and cross-section
measurement
FIGURE 5 Location of GTCC-5 monitoring station
The monitoring cross-section at GTCC-5 experienced the most significant change out of all the
monitoring stations The channel has substantially incised at this location as the result of a debris jam
failure Debris jams establish a sharp change in elevation on the channel profile When a debris jam fails
the channel will incise to remove the difference in elevation and re-establish a consistently sloped
profile This process was well documented at the GTCC-5 cross-section Based on the cross-section
overlay and corroboration by the monitoring photos the channel began to incise between 2006 and
23655-522 Carruthers Creek 2017-07-10 draftdocx 22 Matrix Solutions Inc
2009 The cross-section was stable between 2003 and 2006 with some accumulation of material
resulting in a small reduction in area The material likely accumulated as a result of the small debris jam
located immediately downstream of the cross-section (2003 photo) creating a backwater Between 2006
and 2009 the debris jam destabilized as seen in the 2009 photo The 2009 cross-section deepened and
widened along the right bank cross-sectional area increased by 053 m2 or 213 The max depth
increased by 029 m between 2006 and 2009 Between 2009 and 2012 the large willow tree located on
the left bank fell across the cross-section It can be seen in the 2009 photo on the left bank The downed
tree is an additional disturbance altering flow at the cross-section The change in cross-sectional area
between 2009 and 2012 was the most significant during the monitoring period enlarging by 127 m2 or
424 Max depth increased by 036 m this value could be inflated due to the measuring tape issue as a
result of the downed tree Between 2012 and 2016 the cross-section continued to enlarge primarily
through severe undercutting and subsequent retreat of the right bank The bed appears to have
stabilized as there was minimal change in the actual bed elevation A mid-channel bar has also formed
which supports this notion
In total the cross-section has incised approximately 062 m based on the difference in maximum depth
between the 2003 and 2016 cross-sections Over the 13-year monitoring period the cross-sectional area
has increased by 254 m2 or 98 The cross-section enlarged through incision and retreat of the right
bank while the left bank profile remained stable
There are two erosion pins located at the monitoring cross-section EP2 (left bank) and EP3 (right bank)
The data for these two pins is consistent with the cross-section results EP2 exhibited minimal change in
exposure during the monitoring period while EP3 exhibited large changes each monitoring year Based
on the data from EP3 the migration rate for the right bank is approximately 5cmyr The other three
erosion pins were frequently lost during the monitoring which suggests that they were fully eroded out
of the banks due to the severity of erosion For example EP4 was only re-measured once during the
monitoring period in 2009 and had a change in exposure of 25 cm
The substrate at GTCC-5 was dominated by finer material consisting of coarse sand pebbles and silt
from 2003 to 2009 Medium and coarse gravel represented the coarser fraction The distribution
coarsened in 2012 and 2016 this is typical of an incising channel When the debris jam no longer
created a backwater fine sediment would have been flushed out leaving coarser material behind As the
channel incised further additional fine material would have been removed The coarsening of the bed is
also an indication that incision is slowing as the accumulation of coarse material acts to reduce bed
erosion
53 GTCC-4
The GTCC-4 station is located on the Deer Creek Golf Course in a small cedar woodlot downstream of a
cart path bridge The woodlot provides a small buffer from the adjacent manicured golf course The
monitoring cross-section is located between in a straight section between two successive bends or an
23655-522 Carruthers Creek 2017-07-10 draftdocx 23 Matrix Solutions Inc
ldquoSrdquo bend In the upstream bend there was severe woody debris obstruction Upstream of the bend the
channel flows adjacent to a valley wall along the right bank The bend downstream of the cross-section
has severe erosion of the outer bank The bank is steep and elevated with minimal vegetative buffer
from the golf course approximately less than 5m
FIGURE 6 Location of GTCC-4 monitoring station
In 2003 the cross-sectional area for the monitoring cross-section was 164 m2 The maximum depth was
081 m The cross-section had a narrow low-flow area with a bottom width of approximately 060 m
Between 2003 and 2009 the cross-sectional area steadily increased primarily through erosion of the
vertical left bank widening the bottom width of the channel The 2009 cross-section appears to be
capturing a transition between the 20032006 cross-sections and the 20122016 cross-sections In 2009
the cross-section incised to a maximum depth 087 m This is the deepest measured cross-section during
the monitoring period The 2012 cross-section then exhibits a large loss of material from the lower
portion of the right bank where very little change was noted in the previous cross-sections Itrsquos unclear
from the monitoring photos what may have caused this The left bank also exhibited a noticeable retreat
between 2009 and 2012 The change in cross-sectional area between these 2009 and 2012 was 015 m2
or approximately 8 The 2012 and 2016 cross-sections have a wider bottom width of approximately
14 m as compared to approximately 060 m in 2003 Visually comparing the cross-sections the
20032006 cross-sections have a narrow defined low-flow area while the 20122016 cross-sections
have a larger general ldquoUrdquo shape This change in cross-sectional shape is reflected by a 25 increase in
cross-sectional area over the 13-year monitoring period
23655-522 Carruthers Creek 2017-07-10 draftdocx 24 Matrix Solutions Inc
6
One erosion pin is located at the monitoring cross-section in the left bank EP2 The pin exhibited
increases in exposure ranging from 6 to 155 cm Based on this data the average erosion rate for the left
bank was approximately 286 cmyr Erosion pin 4 exhibited variable results ranging from large increases
in exposure (365) to large decreases in exposure (-195) This is indicative of an area which is eroding
destabilizing and collapsing Erosion pin 1 was located in the outer bank of the eroding bend
downstream of the cross-section It was found eroded out of the bank in 2016 and exhibited large
increases in exposure in 2012 and 2009 Based on EP1 the average erosion rate in this bend is
approximately 86 cmyr Overall based on all the erosion pin data for GTCC-4 the average erosion rate
was 503 cmyr
The channel substrate primarily consisted of medium to coarse gravels The material appears to be
relatively large for the size of the channel which reduces vertical erosion As a result the primary mode
of cross-sectional adjustment was lateral erosion The substrate distribution was consistent over the
13-year monitoring period and exhibited no distinct shifts
CARRUTHERS CREEK MAIN BRANCH
The Main Branch of Carruthers Creek originates to the west of Tributary A north of Concession 7 and
east of Westney Road The Main Branch is approximately 27 km long and flows into Lake Ontario The
surrounding land use north of Taunton Road is primarily rural and agricultural South of Taunton Road
the channel corridor is generally contained within residential development particularly between
Taunton Road and Rossland Road Sinuosity also begins to increase noticeably south of Taunton Road
becoming highly sinuous south of Rossland Road This increase in sinuosity corresponds to the reduced
gradient progressing towards the Lake There are five monitoring stations located on the Main Branch
One is located in the headwater area GCC-12 while the other four are located south of Highway 7
There is a large area gap of approximately 9kms between GCC-12 and the next station (GCC-7) The
furthest downstream station is GCC-2 located on the south side of Kingston Road There are no stations
located below Highway 401
61 GCC-12
The GCC-12 station is the most upstream station on the Main Branch of Carruthers Creek It is located
approximately 100 m downstream of Concession 7 The channel flows adjacent to a rural residential
property with agricultural fields surrounding the riparian corridor The riparian corridor is relatively wide
at the monitoring station approximately 80 to 100 m The surrounding vegetation is predominantly tall
meadow grasses and small willow woodlots At the monitoring cross-section both banks are vegetated
with meadow grasses
23655-522 Carruthers Creek 2017-07-10 draftdocx 25 Matrix Solutions Inc
FIGURE 7 Location of GCC-12 monitoring station
There were challenges maintaining the monitoring cross-section at GCC-12 due to ongoing erosion of
the right bank Neither of the cross-section bank pins could be located in 2016 The cross-section was
reinstalled based on an erosion pin that corresponded to the cross-section Therefore the 2016
cross-section should not be compared with other monitoring years It was also noted during the 2016
measurement that the right bank was noticeably higher than the left bank making it difficult to level the
tape Assuming the cross-section was reinstalled at the correct location this difference in bank height
could have impacted previous cross-section measurements Notes from the 2009 cross-section
measurement also indicated that the tape was not level This may have been a result of moving the right
pin back which occurred in 2009 The pin was moved from 43 m to 51 m presumably to prevent loss
due to erosion The movement of the right bank pin in 2009 made comparisons to the earlier years
2003 and 2006 difficult
In general the cross-section is migrating towards the right bank and steadily eroding it It also appears
that the cross-section has deepened based on the overlays and the photo documentation
Two erosion pins are located at the monitoring cross-section EP3 (left bank) and EP4 (right bank)
The erosion pins provide particularly useful data when there are issues maintaining a cross-section The
right bank erosion pin results indicated ongoing retreat of the right bank Twice EP4 was lost or eroded
out of the bank (2006 and 2016) The change in exposure between 2006 and 2009 for EP4 was 30 cm
Between 2009 and 2012 the change in exposure was 20 cm The average migration rate at EP4 was
833 cmyr based on this data The left bank pin at the cross-section EP3 could not be located twice
during the monitoring period in 2012 and 2016 Two of the erosion pins were located in an actively
23655-522 Carruthers Creek 2017-07-10 draftdocx 26 Matrix Solutions Inc
eroding bend downstream of the monitoring cross-section EP1 and EP2 Both EP1 and EP2 exhibited
large increases in exposure between 2003 and 2006 21 cm and 34 cm respectively
The channel substrate at GCC-12 is primarily composed of medium to coarse gravels There appears to
be a coarsening of the distribution in 2012 and 2016 This is indicated by the higher D50 values as well as
D16 values that are comparable to the D50 values from previous monitoring years The coarsening may be
a result of deepening of the cross-section When this occurs finer material is removed while coarser
material which is too large for the channel to transport remains on the bed
62 GCC-7
The GCC-7 monitoring station is located at the south end of the Deer Creek Golf Course Specifically it is
located in a 50m reach of channel between a cart path crossing and a golf course road (Squire Drive)
The channel is surrounded by golf course fairway and has a minimal riparian buffer of less than 5m The
close proximity to golf course operations led to challenges in maintaining the cross-section The 2009
cross-section needed to be reinstalled after the right bank pin was found lying on the bank The pin was
reinstalled 15 m wider than the original cross-section The right bank pin had to be reinstalled again in
2012 due to the removal by golf course maintenance staff A cross-section was not completed in 2016
because neither of the bank pins could be located due to previous issues it was not reinstalled Based
on these issues only the 2003 and 2006 cross-sections could be compared
FIGURE 8 Location of GCC-7 monitoring station
23655-522 Carruthers Creek 2017-07-10 draftdocx 27 Matrix Solutions Inc
Between 2003 and 2006 the cross-section exhibited evidence of erosion along the right side of the
cross-section and right bank face This was paired with a accumulation of material on the left side of the
cross-section The cross-sectional area was reduced from 175 m2 to 15 m2 approximately -14
Based on these two years the channel was migrating towards the right bank Without subsequent years
of data it is unclear if this process continues and if there is a general trend of reduction in cross-sectional
area
The two erosion pins located at the cross-section provide additional insight EP3 was located in the right
bank and EP4 was located in the left bank The data from EP3 indicated that the right bank was
continually eroding through the 13-year monitoring period The pin could not be located in two of the
monitoring years (2009 and 2016) presumably due to severe erosion For both of the monitoring years
that it was measured the exposure increased by 30 cm This suggests an erosion rate of 10 cmyr for the
right bank based on the EP3 data Data from EP4 exhibited decreases in exposure for each monitoring
year between 2006 and 2016 The results ranged from -35 to -115 cm Observations of the left bank in
2016 noted that the bank is slumping The slumping and erosion is likely related to the lack of riparian
buffer to provide additional support to the banks
The channel substrate at GCC-7 is primarily composed of medium to coarse gravel with the largest
material classified as cobbles The grain size distribution was consistent over the 13-year monitoring
period with no observable trends The coarse nature of the material is expected due to the location on
the golf course and the high potential for modification and erosion protection
63 GCC-6
The GCC-6 monitoring station is located immediately south of Taunton Road in a riparian corridor
between two residential areas The residential area to the east was completed between 2005 and 2008
while the area to the west was completed shortly after Stormwater management ponds are located on
either side of the channel corridor as well as a paved trail to the east This is the first of three stations
located in the southern developed portion of the watershed The channel is situated within a woodland
area approximately 125 m wide Vegetation consisted of deciduous trees woody shrubs and tall
grasses The channel is quite sinuous with tight eroding bends Eroding and undercutting banks were
common throughout the reach resulting in frequent slumped vegetated blocks The monitoring
cross-section is located in a straight section of a large bend The left bank at the monitoring
cross-section corresponds with the outer bank of the bend and is vertical while there is a vegetated
point bar located along the right side of the cross-section The wetted width is narrowed by the point
bar and flow is focused along the toe of the left bank This encourages erosion and undercutting
23655-522 Carruthers Creek 2017-07-10 draftdocx 28 Matrix Solutions Inc
FIGURE 9 Location of GCC-6 monitoring station
Out of all the monitoring sites the cross-section at GCC-6 was the most consistent exhibiting minimal
change over the 13-year monitoring period The cross-sectional area in 2003 was 542 m2 with a
maximum depth of 137 m Maximum depth was extremely consistent at 134 m in both 2006 and 2009
and 133 m in 2012 This indicates that the channel bed has not changed The only change in the
cross-section was retreat of the left bank The most significant change during the monitoring period was
noted between 2006 and 2009 cross-sectional area increased from 520 m2 to 554 m2 approximately
66 Over the entire monitoring period the cross-sectional area increased by only 48 The
cross-section can be considered stable
While location of the monitoring cross-section was stable the surrounding reach exhibited frequent
undercutting of banks and slumping of material The erosion pin data indicated that pins were
frequently lost during the monitoring period When erosion pins cannot be located it is assumed that
they have been eroded out of the banks It also occurs when sufficient undercutting has occurred for the
bank to collapse on top of the erosion pin burying it This is likely what has occurred in GCC-6 Erosion
pin 3 was located in an outside bank downstream of a slumped bank area It could not be located in
2006 2009 or 2016 The only year it was located 2012 the exposure increased by 48 cm indicating an
erosion rate of 16 cmyr Erosion pin 1 was located every monitoring year and exhibited dramatic
increases in exposure ranging from 26 to 87 cm Three of the five erosion pins had an average erosion
rate of 16 cmyr Therefore while the cross-section itself was stable the surrounding reach is active
23655-522 Carruthers Creek 2017-07-10 draftdocx 29 Matrix Solutions Inc
The substrate at GCC-6 is primarily composed of medium gravels The grain size was consistent with
minimal variability during the 13-year monitoring period This is expected because the cross-section
graph indicated that the bed of the channel was largely unchanged
64 GCC-4
The GCC-4 monitoring station is located south of a railway crossing in a forested valley Channel
sinuosity is reduced through the reach by the confining effects of the surrounding valley Surrounding
land use is residential development which is located on either side of the valley The residential
development on the east side began around 2005 and was completed around 2014 On the west side
development began around 2012 and was completed around 2015 The forested valley consists of a
variety of both coniferous and deciduous species Leaning and fallen trees were common particularly
along the right bank which coincided with the valley wall
Figure 10 Location of GCC-4 monitoring station
The monitoring cross-section is located in a straight section which flows along the western toe of the
valley The cross-section is wide compared with other monitoring stations located in grass-lined areas
Toe erosion was noted along both banks The cross-sectional area in 2003 was 781 m2 with a maximum
depth of 138 m Over the monitoring period the cross-sectional area steadily reduced to 641 m2 in
2016 and a maximum depth of 113 m The cross-section overlay indicates that the reduction was
primarily through accumulation of bed material There was erosion of the right bank which is expected
because the channel abuts the valley wall along this side The reduction in cross-sectional area was
approximately 18 Generally a reduction in cross-sectional area is related to accumulation of fine
23655-522 Carruthers Creek 2017-07-10 draftdocx 30 Matrix Solutions Inc
material as a result of reduced velocity Reviewing the monitoring photos suggests that the reduction is
a result of accumulation of coarse material across the riffle that the cross-section is located at
There are two erosion pins located at the cross-section EP3 in the right bank and EP4 in the left bank
The data at EP3 indicated that the most substantial increase in exposure was between 2003 and 2006
45 cm Increases in exposure for the subsequent years were much less substantial The left bank erosion
pin EP4 exhibited small increases in exposure ranging from 45 to 16 cm This was relatively consistent
with the other erosion pins Generally the erosion pins exhibited increases in exposure which were
variable but provided similar erosion rates over the 13-year period Three of the five pins provided
average erosion rates of approximately 5cmyr
The substrate at GCC-4 was coarse and consisted primarily of coarse gravel and cobbles The monitoring
data indicated a general coarsening trend The median grain size increased from medium and coarse
gravel to very coarse gravel and small cobbles This indicates that the accumulation of material is
primarily through coarser material armouring the riffle and further reducing transport at the feature
65 GCC-2
The GCC-2 monitoring station is located immediately south of Kingston Road it is the furthest
downstream station The channel flows through a meadow dominated area with some small deciduous
woodlots To the west is a residential development a stormwater management pond and a paved trail
The development was built over the course of the monitoring period completed between 2009 and
2012 To the east is an agricultural field The channel is quite sinuous through this reach The reach was
characterized by tall steep undercutting banks Bank height was frequently 1m with material scoured
out from beneath the upper vegetative root layer Deep scour pools and accumulation of fine material
was also noted The reach can be considered fairly active based on these indicators
23655-522 Carruthers Creek 2017-07-10 draftdocx 31 Matrix Solutions Inc
Figure 11 Location of GCC-2 monitoring station
The monitoring cross-section is located in a short straight section of channel between two bends The
cross-section was highly active during the monitoring period both increasing and decreasing
cross-sectional area The cross-section shape has shifted and changed but when cross-sectional areas
from 2003 and 2016 are compared there is negligable difference The 2003 cross-sectional area was
327 m2 while the 2016 area was 333 m2 Between 2003 and 2006 the cross-sectional area reduced
through bed accumulation reducing maximum depth from 105 to 083m Between 2006 and 2009 the
cross-sectional area increased primarily through erosion of a high point along the right bank and erosion
of both bank toes There was some bed erosion during this time period as well increasing the maximum
depth by 004 m However lateral erosion was the dominant process The 2006 to 2009 period exhibited
the most significant change during the monitoring period cross-sectional area by increased 054 m2 or
19 The cross-section continued to increase through 2012 to 362 m2 with a maximum depth of
095 m This increase was a result of retreat of the right bank erosion along the left bank toe and
deepening of the bed Near the left bank toe there was a narrow notched area where the channel has
cut down This is likely where the thalweg and the strongest forces from the flow are focused In 2016
the cross-sectional area was reduced by 7 to 333 m2 This was primarily due to the accumulation of
sediment above bankfull along the right bank and along the right bank toe It is also worth noting that
during the 2016 assessment the right bank pin was buried under approximately 16 cm of fine material
This could suggest that the higher flows are regularly depositing fine material from bank erosion above
bankfull The bed of the 2016 cross-section exhibits a wider thalweg area than was document in 2012
The area is not as deep (092 m) but it is wider and more defined This could suggest that the channel is
slowly and systematically eroding downward
23655-522 Carruthers Creek 2017-07-10 draftdocx 32 Matrix Solutions Inc
7
Based on the variable changes in the cross-section it can not be definitively said whether it is increasing
or decreasing in size It is clear that the channel is highly active mobilizing sediment from both the bed
and banks in this reach The sediment then periodically accumulates within the channel or overbank
areas due to the excess amount
No erosion pins were located at the monitoring cross-section for GCC-2 Erosion pins 4 and 5 were
located approximately 40m upstream of the cross-section Erosion pin 4 was located at the downstream
end of an overwidened eroding bend with a large scour pool Erosion pin 5 was also located at the
downstream end of an area of severe erosion and undercutting Both EP4 and EP5 exhibited large
increases in exposure and were lost at once Based on the data at these two pins the average erosion
rate was 10 cmyr and 12 cmyr respectively The other three erosion pins were in areas of less active
erosion EP2 exhibited small amount of accumulation during most monitoring periods
The substrate at GCC-2 was predominantly fine material including silt sand and pebbles
This distribution is particularly small given the size of the channel and is likely a reflection of the ongoing
bank erosion The median grain size typically consistents of pebbles
DISCUSSION
The results from the 13-year monitoring period provide insight on channel processes at a variety of
scales Most reliably the data describes the processes occurring at various discrete sites throughout the
watershed Each station is a reflection of the specific governing factors at that location which include
surrounding vegetation land use geology and flow regime Reviewing the stations together based on
their general location within the watershed may reveal broader characteristics of the watercourse The
results of the monitoring program also provide insight into the effectiveness of a long-term program as
very few fluvial geomorphic programs are maintained for such an extensive period This warrants
additional discussion beyond results specific to the Carruthers Creek watershed
Both of the stations on Tributary A have relatively small cross-sectional areas which have enlarged over
the 13-year monitoring period (48 and 35) Due to the small size of the cross-sections small changes
in area result in a large percentage change The evolution of the two cross-sections is markedly
different While GTCC-11 exhibited a gradual consistent transition from a ldquoVrdquo to a ldquoUrdquo shaped
cross-section GTCC-9 appears to have experienced a more complex and abrupt transition The GTCC-9
cross-section exhibited a large change in cross-sectional area between 2003 and 2006 shifting to a
cross-sectional shape that differs from all other years After 2006 the cross-section re-established itself
as a distinctly different shape which consistently migrated towards the right bank and deepened for the
remainder of the monitoring period These results suggest that the 2006 monitoring captured the
cross-section after a specific event a brief instance which is not necessarily representative of the
ongoing long-term process The difference in adjustment between the two sites highlights the
importance of local site-specific characteristics While both cross-sections are enlarging potentially in
response to the same governing factor they do so differently The consistent adjustment at GTCC-11 is
23655-522 Carruthers Creek 2017-07-10 draftdocx 33 Matrix Solutions Inc
reflective of equal resistance of vegetation and bank materials At GTCC-9 the difference in bank
vegetation dense woody dogwood versus dense herbaceous grasses has biased the cross-sectional
adjustment to the right half of the cross-section where less force is required to erode the material
Tributary B is the larger of the two tributaries and has three monitoring stations For Tributary B
interpreting the cross-section adjustment with respect to potential systemic adjustment was
complicated by additional factors for two of the three stations GTCC-6 and GTCC-5 The GTCC-5
cross-section enlarged dramatically (98) doubling in size through incision as a result of a debris jam
failure This adjustment in the response to the local event masks potential channel adjustment which
could be attributed to broader systemic change At GTCC-6 the data was incomplete due to issues with
maintaining the cross-section as a result of severe erosion of the right bank Only the last three
monitoring years (2009 2012 and 2016) were comparable During this period the cross-sectional area
increased by 26 through retreat of the right bank and incision The results definitively indicate that
from 2009-2016 the cross-section is continually enlarging Based on the issues with the right bank pin in
2003 and 2006 it can be inferred that these cross-sections would have exhibited the same trend if the
bank pin had been maintained The third station GTCC-4 did not appear to be impacted by any
identifiable site-specific issues Therefore it is more plausible that adjustment at GTCC-4 is reflective of
potential broader scale influences At GTCC-4 the cross-section adjusted primarily through lateral
erosion as vertical adjustment was limited by coarse bed material The cross-sectional area increased by
25 between 2003 and 2016 transitioning to a distinctly different shape with increased bed width The
enlargement of GTCC-6 and GTCC-4 may be indicative of a broader scale response of Tributary B The
GTCC-5 cross-section may also be support this but it is unclear due to the prominent influence of a local
event
There are five monitoring stations located on the Main Branch of Carruthers Creek Similar to Tributary
B two of the stations had challenges with maintenance and produced incomplete data which was not
definitive At GCC-12 the overall trend of cross-sectional adjustment could not be determined The two
monitoring periods for which cross-sectional area could be compared produced conflicting results
cross-sectional area reduced from 2003 to 2006 and increased from 2009 to 2012 At GCC-7
cross-section graphs after 2006 could not be used due to movement or loss of the right bank pin With
only one monitoring period of data (2003-2006) in which cross-sectional area was reduced no definitive
trends could be identified Both GCC-7 and GCC-12 exhibited ongoing erosion of one of their banks this
could not be attributed to a particular channel process The remainder of the stations GCC-6 GCC-4
and GCC-2 were all located in the lower half of the watershed where ongoing development has occurred
during the monitoring period There does not appear to be an observable trend in the results from the
three stations The GCC-6 cross-section was the least active out of all the monitoring stations
Cross-sectional area increased by 48 during the monitoring period but the cross-sectional shape
remained static The increase in area was the result of erosion of the vertical left bank However
beyond the cross-section the overall GCC-6 reach was active with ongoing erosion slumping and
frequent loss of erosion pins The GCC-4 cross-section was the only monitoring cross-section that
23655-522 Carruthers Creek 2017-07-10 draftdocx 34 Matrix Solutions Inc
exhibited well-documented aggradation reducing cross-sectional area by 18 This is the result of an
accumulation of coarse material which was indicated by a coarsening trend in the grain size
distribution Erosion pin data for the site was relatively consistent with most pins exhibiting average
migration of 5cmyr The GCC-2 cross-section was highly active during the monitoring period increasing
and decreasing cross-sectional area between monitoring years However when comparing the 2003 and
2016 cross-sections there was negligible change in cross-sectional area Throughout the site vertical
banks severe undercutting and bank collapses were common It is assumed that the changes in the
cross-section are a manifestation of the frequent input of fine bank material which temporarily deposits
on the bed and then is periodically flushed downstream This process is supported by the grain size
distribution data which was notably fine for the size of the channel The results of the three downstream
main branch stations did not display a common response which could be attributed to broad scale
influences such as the surrounding ongoing development
The results of the Carruthers Creek monitoring program indicate that the watercourse is an active
channel whether the cross-section is enlarging aggrading or continually adjusting while maintaining a
similar size The sites on both Tributary A and Tributary B suggest that channel dimensions are
increasing The magnitude of increase was larger for the Tributary A sites presumably because it is the
smaller of the two tributaries and is therefore more sensitive to surrounding change Comparatively
while the main branch sites exhibited active channel processes overall change was relatively minimal
There was no indication of a common adjustment response amongst the main branch sites Similar to
the tributaries this is indicative of the larger channelrsquos resilience to accommodate changes to the
surrounding area It should also be considered that the main branch stations are the only stations
located in the developing area of the watershed while most of the tributary sites are located in the
upper agricultural and rural area of the watershed The expectation would be that the ongoing
development would alter the hydrologic regime of the downstream stations and this would manifest as
changes in morphology However this is not supported by the results Channel morphology and flow
regime are intrinsically linked which allows for inferences to be made about both characteristics when
there is sufficient knowledge of one Based on this it can be inferred that the tributary stations are
enlarging as a response to changes in the flow regime However it cannot be definitively determined
without a complementary flow monitoring program
Overall the 13-year monitoring period provided a unique opportunity to document changes in channel
morphology for the purposes of understanding channel processes Fluvial geomorphology monitoring
programs are generally undertaken for 3 to 5 years following the completion of a natural channel
design shorter 1 to 3 year programs are completed for characterization studies After reviewing the
results of the Carruthers Creek monitoring it is clear that a 3 to 5 year monitoring program would not
have adequately captured the ongoing trends The results also revealed the challenges with maintaining
a long-term program such as selecting an appropriate location and establishing a sufficiently wide
cross-section
23655-522 Carruthers Creek 2017-07-10 draftdocx 35 Matrix Solutions Inc
8 REFERENCES
Galli J 1996 Rapid Stream Assessment Technique Field Methods Metropolitan Washington Council of
Governments Washington DC 36pp
Parish Geomorphic Ltd (PARISH) 2003 Valley Segments Carruthers Petticoat and Duffins Creek
Watersheds Report prepared for the Toronto and Region Conservation Authority
September 2003
Ontario Ministry of the Environment (MOE) 2003 Stormwater Management Planning and Design
Manual Queenrsquos Printer Ottawa Ontario March 2003
httpwwwontariocadocumentstormwater-management-planning-and-design-manual
Parish Geomorphic Ltd (PARISH) 2004 Regional Monitoring Program - Fluvial Geomorphology
Component Pettitcoat Creek Carruthers Creek Duffins Creek and Highland Creek Watersheds
Report prepared for the Toronto and Region Conservation Authority April 2004
Toronto and Region Conservation Authority (TRCA) 2015 Crossings Guideline for Valley and Stream
Corridors September 2015 httpwwwtrcaoncadotAsset214493pdf
Toronto and Region Conservation Authority (TRCA) 2003 A Watershed Plan for Duffins Creek and
Carruthers Creek August 2003 httpwwwtrcaoncadotAsset25961pdf
Wolman M G 1954 ldquoA method of sampling coarse river-bed materialrdquo Eos Transactions American
Geophysical Union 35 (6) 951-956
23655-522 Carruthers Creek 2017-07-10 draftdocx 36 Matrix Solutions Inc
- Phase 1 Technical Reports
- Phase 1 Technical Reports
- CCWP_FluvialGeomorphologyReport-Matrix_2017_finalpdf
-
- CCWP_Ph1-techreports-intro-2017_v9_FluvGpdf
-
- Phase 1 Technical Reports
- Phase 1 Technical Reports
-
- CCWP_Ph1-techreports-intro-2017_v9_FluvGpdf
-
- Phase 1 Technical Reports
- Phase 1 Technical Reports
-
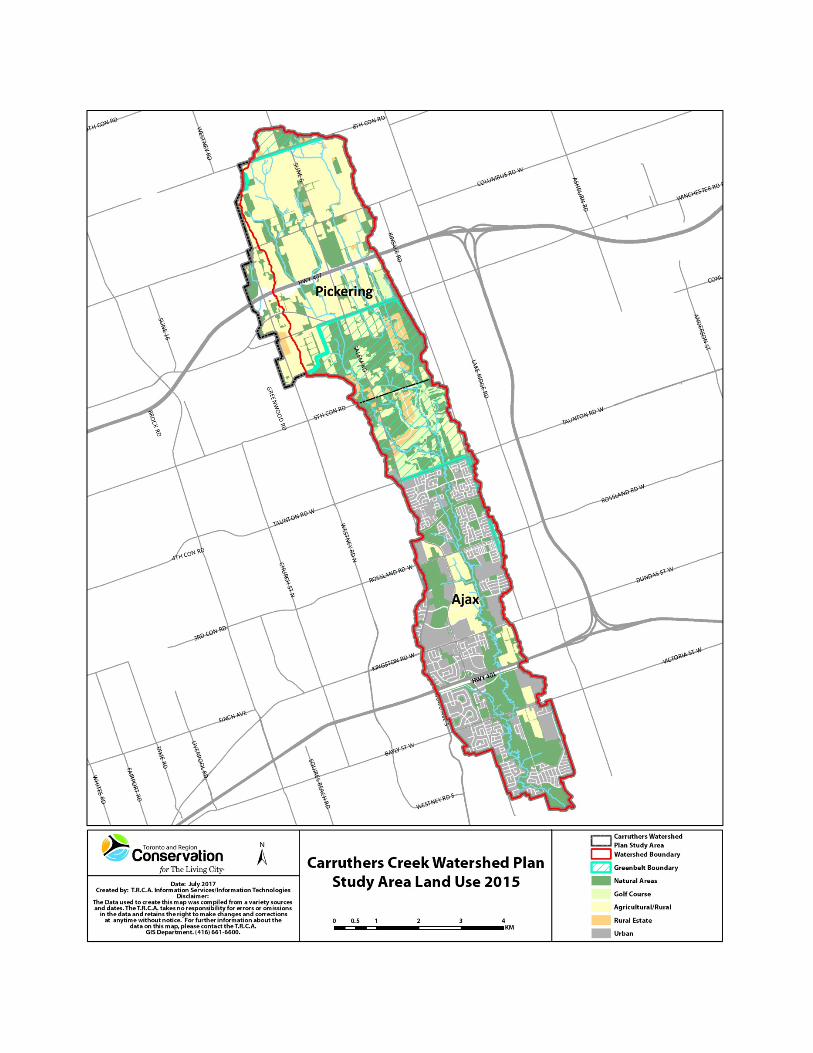
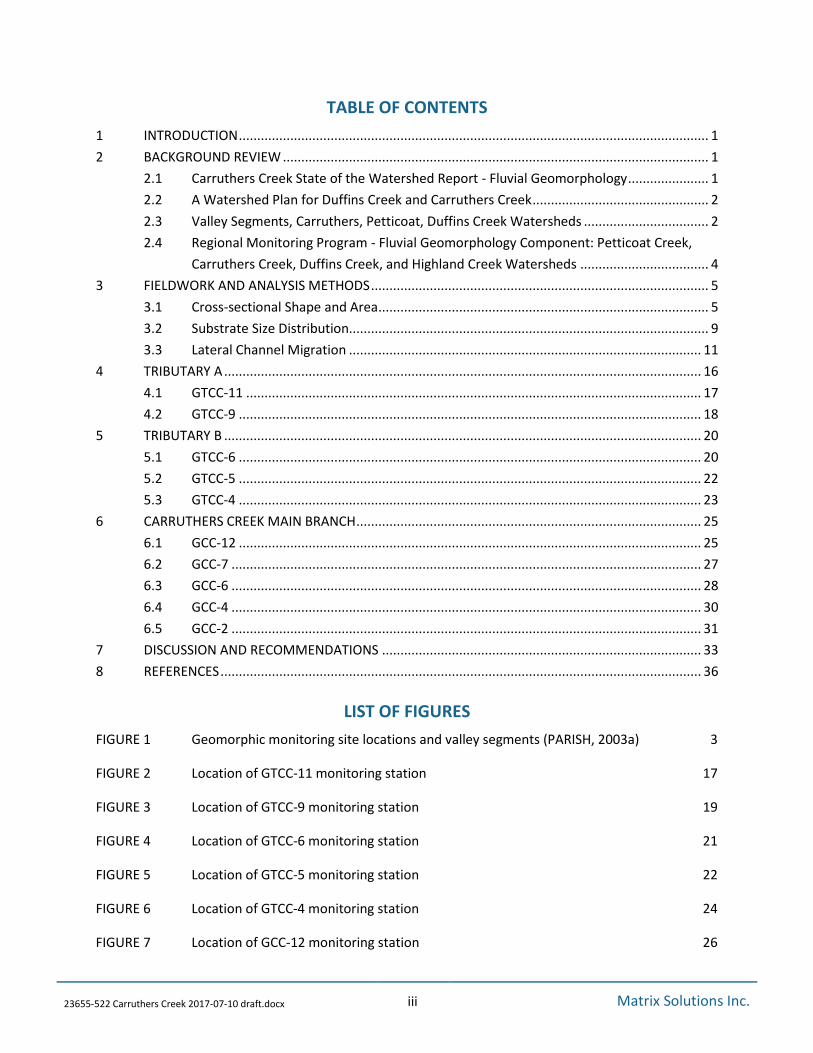
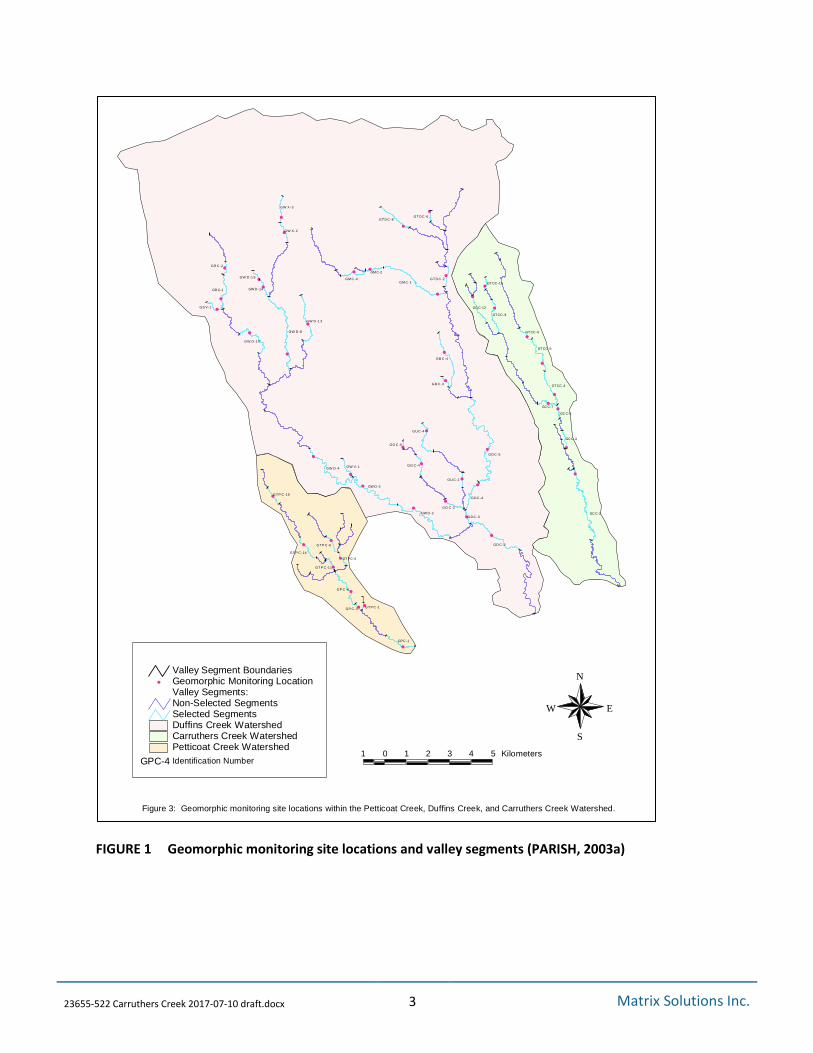
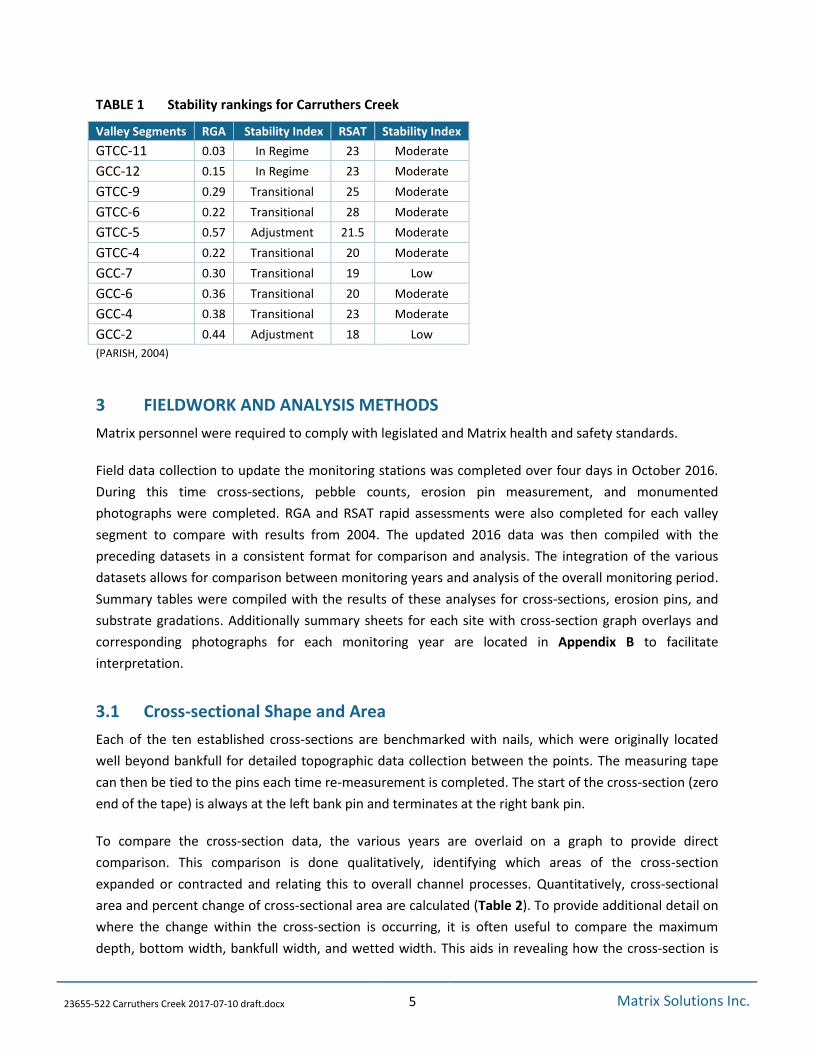

- - - -
TABLE 2 Summary of cross-sectional area and percent change for all monitoring stations 2003-2016
Monitoring Station
2Cross Sectional Area (m ) Percent Change
Total Change () 2003 2006 2009 2012 2016 2003 2006 2006 2009 2009 2012 2012 2016
GTCC-11 041 048 051 052 061 1694 733 046 1769 4842
GTCC-9 083 099 101 099 113 1858 209 -157 1348 3522
GTCC-6 195 302 335 405 423 NA NA 2065 460 2620
GTCC-5 257 246 299 426 511 -435 2139 4249 1990 9837
GTCC-4 164 179 192 207 206 904 686 793 -025 2545
GCC-12 123 110 139 155 157 -1084 NA 1121 NA NA
GCC-7 175 150 276 240 NA -1442 NA NA NA NA
GCC-6 542 520 554 567 568 -412 668 234 016 486
GCC-4 781 705 738 673 641 -975 472 -876 -483 -1794
GCC-2 327 284 338 362 333 -1313 1894 702 -785 -138
Notes GCC-12 Cross-section width increased in 2009 pin moved back
2016 bank pins could not be found cross-section reinstalled at a larger width in the same location as approximated based on
erosion pin
GTCC-6 2006 cross-section width increased from 360 m to 600 m Bank pin could not be found from original 2003 installation 2009 cross-section width increased by 085 m Total change is calculated for 2009-2016
GCC-7 2009 cross-section width increased from 400 m to 552 m 2012 told that the right cross-section pin was removed by golf course maintenance staff Reinstalled flush to bank at 552 m
23655-522 Carruthers Creek 2017-07-10 draftdocx 7 Matrix Solutions Inc
2016 no pins or indicators of cross-section location could be found cross-section not reinstalled due to challenges with
maintaining
23655-522 Carruthers Creek 2017-07-10 draftdocx 8 Matrix Solutions Inc
Generally the cross-section is considered the most reliable technique for monitoring When the bank
pins are established sufficiently far from the top of bank the risk that they will be lost to erosion is
minimized However if a bank pin must be moved due to erosion risk a number of issues can arise and
it is very difficult to ensure the accuracy of future cross-section comparisons If a bank pin cannot be
found and must be re-established it is highly unlikely that comparisons will be accurate It is difficult to
properly align the re-established pin with the original pin even when the original width is known When
a bank pin is moved back from the known original pin to protect is from erosion it must be properly
documented otherwise it is difficult to make accurate comparisons Even when the bank pin is moved
and properly documented moving one bank pin further into the floodplain generally moves the pin to
ground that is slightly higher than the original location Then when the cross-section is measured the
measuring tape cannot be properly levelled impacting the cross-section graph by artificially deepening a
portion of the cross-section This can be compensated for using the water surface to determine the
difference in elevation If the channel is dry the error cannot be quantified or addressed This is why it is
critical to establish long-term monitoring cross-section bank pins far beyond the top of bank
32 Substrate Size Distribution
To characterize the substrates at each cross-section pebble counts are completed following a modified
Wolman (1954) technique A total of 50 random particles are selected and measured along the median
axis Particle size distributions are tabulated accordingly to produce the representative grain sizes D16
D50 and D84 These values are compared between monitoring periods to identify changes in the overall
substrate distribution (Table 3)
23655-522 Carruthers Creek 2017-07-10 draftdocx 9 Matrix Solutions Inc
TABLE 3 Summary of grain size distribution for all monitoring stations 2003-2016
Monitoring Station (listed in upstream to downstream)
2003 2006 2009 2012 2016
Data displayed in cm
GTCC-11
D16 00009 00009 00009 00002 00004
D50 00009 00009 00009 00049 00008
D84 00190 00009 10 0134 0014
GTCC-9
D16 005 050 019 049 000042
D50 06 20 15 05 052
D84 23 61 50 15 319
GTCC-6
D16 00009 00009 00009 00002 00006
D50 00009 050 049 0019 0090
D84 00009 200 300 200 10
GTCC-5
D16 0031 049 00009 0494 179
D50 059 100 005 150 339
D84 250 180 200 400 679
GTCC-4
D16 011 049 023 005 081
D50 100 150 250 150 192
D84 400 450 480 300 411
GCC-12
D16 0019 00002 0076 170 168
D50 15 10 25 40 48
D84 56 33 60 83 85
GCC-7
D16 053 005 019 049 NA
D50 300 250 300 150 NA
D84 900 1200 680 800 NA
GCC-6
D16 00009 0049 011 050 052
D50 059 100 049 100 202
D84 350 180 230 280 341
GCC-4
D16 011 050 049 100 159
D50 250 150 300 350 988
D84 960 680 1080 750 1623
GCC-2
D16 0019 00009 00009 00049 016
D50 15 049 049 050 036
D84 56 10 15 18 05
23655-522 Carruthers Creek 2017-07-10 draftdocx 10 Matrix Solutions Inc
Substrate monitoring can be complicated by two different factors fine material and seasonality When a
distribution is dominated by fine material (silt sand pebbles) it is very difficult to identify shifts and
nuances in the grain size distribution Therefore substrate monitoring in smaller tributaries or
headwater generally only identifies change if there is a shift from fine material to gravel material This
would require a significant overall change to the system such as incision to remove the upper layer of
fine material revealing underlying coarser material There are also seasonal changes to the grain size
distribution that occur related to the different flow conditions In the summer grain size distributions
are often finer due to the accumulation of fine material during low flow conditions To account for this
monitoring should ideally be completed within the same time frame each monitoring year
Flow conditions should also be taken into account when planning the monitoring visit for the
same reason
33 Lateral Channel Migration
Erosion pins are installed horizontally into the face of stream banks throughout the monitoring site to
provide a means of quantifying channel migration at these locations Each erosion pin is a one meter
length of rebar installed below the bankfull elevation and above the base flow level A portion of the
erosion pin is left exposed from the bank and measured (typically 20 cm) providing a reference length
when re-measured in subsequent monitoring periods The pins serve as a direct measure of bank
recessionmigration rate and are typically installed on the outside bank of pools or straight sections of
channel to serve as controls For each monitoring site four to five pins were installed This generally
included two erosion pins at the monitoring cross-section to corroborate the cross-section results
Change in pin exposure is re-measured during each monitoring year The total change in exposure is
then calculated for the entire monitoring period Total change in exposure is divided by the time period
to determine the migration rate in cmyr (Table 4) The time period differs by erosion pin based on the
available data not all erosion pins have data for every monitoring period This is because during a longer
monitoring period such as the 3-year cycle for the RWMP it is more likely that an erosion pin may not
be found on a subsequent visit If the erosion pin is not found there are a number of explanations the
erosion pin was eroded out of the bank the erosion pin was covered by slumped material or the
erosion pin remained in the bank but could not be located by the practitioner (human error) Ideally the
practitioner should provide additional notes when a change in exposure is not measured Often if an
erosion pin has been eroded out of the bank it may be found lying on the bed noting this will provide
qualitative data for the location It would be uncertain when the pin was fully eroded out of the bank
but it can be concluded that the bank has eroded at least the one meter length of the erosion pin during
the three year period Similarly there is often a general indication that an erosion pin may have been
covered by slumped material if slumps are common in the monitoring reach At minimum if an erosion
pin is not found it generally suggests that a channel is relatively active It is also important when
interpreting the calculated migration rates and measured changes in exposures to consider that erosion
is often an episodic process rather than a occurring at a steady consistent rate
23655-522 Carruthers Creek 2017-07-10 draftdocx 11 Matrix Solutions Inc
- - - -
TABLE 4 Summary of erosion pin data for all monitoring stations 2003-2016
Site Location ID Change in exposure (cm)
Total (cm) Time period for total Migration rate myr
Migration rate cmyr 2003 2006 2006 2009 2009 2012 2012 2016
GTCC-11
RB EP 1 55 145 3 -6 17 2003-2016 0013 131
LB EP 2 25 15 7 -65 18 2003-2016 0014 138
LB EP 3 15 5 18 1 255 2003-2016 0020 196
RB EP 4 05 55 245 11 415 2003-2016 0032 319
LB EP 5 45 -35 45 -15 4 2003-2016 00031 031
GTCC-9
RB EP 1 20 135 50 835 2003-2012 0093 928
LB EP 2 3 -35 5 45 2003-2012 0005 050
LB EP 3 5 -6 -1 -2 2003-2012 -0002 -022
RB EP 4 16 165 2 345 2003-2012 0038 383
RB EP 5 85 325 16 57 2003-2012 0063 633
GTCC-6
LB EP 1 225 -25 235 435 2003-2012 0048 483
LB EP 2 -85 155 7 2003-2009 0012 117
LB EP 3 45 45 2009-2012 015 15
RB EP 4 31 32 70 133 2006-2016 013 133
LB EP 5 -55 305 3 -8 20 2003-2016 0015 154
23655-522 Carruthers Creek 2017-07-10 draftdocx 12 Matrix Solutions Inc
- - - -Site Location ID
Change in exposure (cm) Total (cm) Time period for total
Migration rate myr
Migration rate cmyr 2003 2006 2006 2009 2009 2012 2012 2016
GTCC-5
RB EP 1 36 5 36 2003-2006 0120 12
LB EP 2 -2 1 -05 05 -1 2003-2016 -0001 -008
RB EP 3 195 19 75 46 2003-2012 0051 511
RB EP 4 25 25 2006-2009 0083 833
LB EP 5 -7 6 -55 -65 2003-2012 -0007 -072
GTCC-4
LB EP 1 18 34 52 2006-2012 0087 867
LB EP 2 155 14 6 20 2009-2016 0029 286
RB EP 3 205 12 18 14 645 2003-2016 0050 496
RB EP 4 -145 365 -195 75 10 2003-2016 0008 077
LB EP 5 9 57 13 79 2006-2016 0079 790
GCC-12
LB EP 1 21 255 8 545 2003-2012 0061 606
LB EP 2 34 65 55 43 46 2003-2016 0035 354
LB EP 3 -345 75 -27 2003-2009 -0045 -450
RB EP 4 30 20 50 2006-2012 0083 833
RB EP 5 1 65 14 -5 215 2003-2016 0017 165
GCC-7 RB EP 1 65 85 15 2009-2016 0021 214
23655-522 Carruthers Creek 2017-07-10 draftdocx 13 Matrix Solutions Inc
- - - -Site Location ID
Change in exposure (cm) Total (cm) Time period for total
Migration rate myr
Migration rate cmyr 2003 2006 2006 2009 2009 2012 2012 2016
RB EP 2 145 47 -235 38 2003-2012 0042 422
RB EP 3 30 305 305 2009-2012 0102 1017
LB EP 4 35 -35 -75 -115 -19 2003-2016 -0015 -146
GCC-6
LB EP 1 87 31 69 26 213 2003-2016 0164 1638
LB EP 2 5 155 05 95 305 2003-2016 0023 235
RB EP 3 48 48 2009-2012 0160 16
RB EP 4 555 38 935 2006-2012 0156 1558
RB EP 5 13 135 265 2006-2012 0044 442
GCC-4
LB EP 1 7 11 44 44 2012-2016 0110 11
RB EP 2 44 16 23 39 2009-2016 0056 557
RB EP 3 45 8 2 135 685 2003-2016 0053 527
LB EP 4 45 16 5 7 325 2003-2016 0025 25
RB EP 5 275 1 225 10 61 2003-2016 0047 469
GCC-2
LB EP 1 11 5 5 21 2003-2012 0023 233
RB EP 2 2 -05 -2 -25 -3 2003-2016 -0002 -023
RB EP 3 -10 15 8 95 2009-2016 0014 136
23655-522 Carruthers Creek 2017-07-10 draftdocx 14 Matrix Solutions Inc
- - - -Site Location ID
Change in exposure (cm) Total (cm) Time period for total
Migration rate myr
Migration rate cmyr 2003 2006 2006 2009 2009 2012 2012 2016
RB EP 4 40 21 415 1025 2006-2016 0100 1025
LB EP 5 545 135 405 1085 2003-2012 0120 1206
erosion pins highlighted with yellow are those located at the monitoring cross-section
23655-522 Carruthers Creek 2017-07-10 draftdocx 15 Matrix Solutions Inc
34 Rapid Assessment Results
A rapid assessment was completed for each valley segment in accordance with the RGA (MOE 2003)
and RSAT (Galli 1996) stream assessment protocols Rapid assessment were undertaken to investigate
any significant changes in the geomorphic stability or ecological health of each segment relative to
previously reported results (Parish 2004 TABLE 1) A summary of the 2016 RGA and RSAT results is
presented in TABLE 5 In general 2016 RGA scores were slightly lower than those previously recorded in
2004 suggesting an improvement in channel stability (highlighted in red in TABLE 5) RSAT scores
remained consistent with very little deviation from results reported in 2004 Although the results
suggest improved channel stability within the catchment the rapid assessment protocols are very
subjective and can often be misleading Long term monitoring of geomorphic parameters as those
discussed in previous subsections provides a better method of assessing trends in channel form and
function A detailed description of each valley segment and comprehensive assessment of long term
monitoring results is provided in subsequent sections
TABLE 5 Summary of 2016 Rapid Assessment Results
Valley Segments RGA Stability Index RSAT Stability Index
GTCC-11 009 In Regime 24 Moderate
GTCC-9 013 In Regime 25 Moderate
GTCC-6 016 In Regime 26 Moderate
GTCC-5 032 Transitional 30 Moderate
GTCC-4 025 Transitional 27 Moderate
GCC-12 015 In Regime 28 Moderate
GCC-7 013 In Regime 23 Moderate
GCC-6 020 Transitional 27 Moderate
GCC-4 018 In Regime 34 Moderate
GCC-2 028 Transitional 27 Moderate
23655-522 Carruthers Creek 2017-07-10 draftdocx 16 Matrix Solutions Inc
4 TRIBUTARY A
Tributary A is located at the upstream end of the watershed beginning north of Concession 7 and
confluences with the Main Branch north of Highway 7 The tributary is approximately 4 km in length and
flows through rural area where the dominant surrounding land use is agricultural The riparian corridor
for the tributary is generally 40 to 100 m wide Vegetation consisted of deciduous swamp meadow
marsh buckthorn deciduous thicket and a small area of hardwood deciduous forest downstream of
Highway 407 Two monitoring stations were located on Tributary A GTCC-11 and GTCC-9 The valley
segment containing GTCC-11 was classified as 3M small catchment and high slope The valley segment
containing GTCC-9 was classified as 2M small catchment and moderate slope
41 GTCC-11
The GTCC-11 station is located approximately 200 m upstream of Highway 7 The channel is located in
an area vegetated with shrubs tall grasses and deciduous trees This vegetated area is approximately
60m wide beyond which are agricultural fields The eastern bank is vegetated with poplar trees and red
osier dogwoods while the western bank is vegetated with tall dense grasses
FIGURE 2 Location of GTCC-11 monitoring station
In 2003 the cross-sectional area for the monitoring cross-section was 041 m2 The cross-section had a
narrow ldquoVrdquo shape typical of a small tributary At the time of survey (October) the wetted width was
030 m The bankfull width was approximately 071 m and the max depth was 036 m Over the
monitoring period the cross-section exhibited a steadily increasing cross-sectional area Between 2003
23655-522 Carruthers Creek 2017-07-10 draftdocx 17 Matrix Solutions Inc
and 2016 the cross-sectional area increased by 010 m2 or approximately 48 The cross-section overlay
indicates that this change corresponds to a deepening and widening of the thalweg transitioning the
cross-section from a ldquoVrdquo to a ldquoUrdquo shape The 2006 and 2009 cross-sections show the cross-section
deepening to a maximum depth of 043 m in 2009 The 2012 and 2016 cross-sections then show
widening of the bed through ongoing toe erosion while the maximum depth returns to a consistent
040 m Comparing the 2016 cross-section to the other years also suggests deepening of the floodplain
area This could be a result of higher flows more frequently spilling onto the floodplain and establishing
a larger bankfull cross-section Shifts in floodplain topography can also be tied to growth and die-off of
dense tall grass vegetation These changes in cross-sectional shape are a manifestation of typical
channel processes in a small headwater channel
The erosion pins generally exhibited increased exposure between monitoring periods The maximum
increase in exposure was 245 cm for EP4 between 2009 and 2012 During this monitoring period there
was also a large change in exposure (18 cm) for the erosion pin at the monitoring cross-section (EP3)
Based on these exposures the erosion rates would be approximately 8 cmyr and 6 cmyr respectively
The erosion rates based on the full monitoring period (13 years) ranged from 031 cmyr to 319 cmyr
The average erosion rate is 163 cmyr
The substrate at GTCC-11 is composed of fine grained materials including sand silt and small pebbles
Over the monitoring period this was consistent with no noticeable coarsening
42 GTCC-9
The GTCC-9 station is located approximately 700 m downstream of GTCC-11 It is approximately 2 km
from the confluence with the main channel At GTCC-11 the channel is located on the floor of a valley
which is approximately 20 to 40 m wide The channel meanders across the valley floor periodically
contacting the valley walls The valley floor is vegetated with meadow grasses and woody shrubs such as
buckthorn and red osier dogwoods The slopes are populated by deciduous trees Beyond the top of the
valley are agricultural fields At the monitoring cross-section the right bank (western) is vegetated with
tall grasses and the left bank (eastern) is covered by a large red osier dogwood The monitoring photos
indicate that the cross-section was originally installed immediately downstream of the dogwood
Overtime the dogwood has grown sufficiently large that it encompasses the area where the left bank pin
is located This made it difficult to properly level the measuring tape along the left bank due to the
dense woody vegetation that must be pushed down to allow the tape to lie flat
23655-522 Carruthers Creek 2017-07-10 draftdocx 18 Matrix Solutions Inc
FIGURE 3 Location of GTCC-9 monitoring station
In 2003 the cross-sectional area for the monitoring cross-section was 083 m2 The cross-section had a
notched low-flow channel in the center with a bottom width of approximately 050 m The 2006
cross-section was distinctly different from all other monitoring years and appears to have captured a
transitional period The cross-section bottom width increased to approximately 077 m and no longer
exhibited a defined low-flow area Between 2003 and 2006 cross-sectional area increased by 016 m2
the largest change during the 13-year period Due to the transitional shape it was difficult to define
bankfull for the 2006 cross-section The cross-sections for 2009 2012 and 2016 all indicate that the
channel is migrating towards the right bank This is evidenced by the increasing elevation of the left
bank profile and the consistent retreat of the right bank The cross-section is also deepening along the
right side Over the 13-year monitoring period the bed has deepened by approximately 010m based on
comparison of the max depth values from 2016 and 2003 The overall cross-sectional area has increased
by 030 m2 or 35
Two erosion pins are located at the monitoring cross-section one in each bank Both pins exhibited an
increase in exposure between 2003 and 2006 when the cross-section shape widened From 2006 to
2012 the right bank pin (EP4) exhibited continued increases in exposure while the left bank pin (EP3)
exhibited small reductions in exposure This is consistent with the migration of the channel towards the
right bank Based on the EP4 data the average erosion rate for the right bank at the monitoring
cross-section is 383 cmyr During the monitoring period the largest changes in exposure were noted at
EP1 and EP5 This was a result of their locations both were located on the outer bank of a bend The
average migration rates based on the EP1 and EP5 data are 928 cmyr and 633 cmyr
23655-522 Carruthers Creek 2017-07-10 draftdocx 19 Matrix Solutions Inc
5
The substrate at GTCC-9 is composed of fine grained material and medium sized gravel The substrate
was relatively consistent over the monitoring period with 2006 and 2009 considered coarser than other
years based on the D50 These years may have been coarser because the cross-section was actively
enlarging and more of the fine material had been removed Additionally the 2009 cross-section was
measured in April when high flows are more frequent due to spring melt This leads to seasonally
coarse distributions as fine material is flushed away more regularly
TRIBUTARY B
Tributary B begins northeast of Tributary A south of Concession 8 It is the larger of the two tributaries
approximately 94 km in length more than double the length of Tributary A North of Highway 7 the
channel flows through rural agricultural land with a riparian corridor ranging from approximately 10m
wide in the headwaters to approximately 80 m wide south of Highway 407 South of Highway 7
the channel flows through a small residential development where a channel design has been
implemented The channel then flows through a dense woodlot area before continuing through Deer
Creek Golf Course The confluence with the Main Branch is located near the south end of the golf
course There are three monitoring stations located on Tributary B all of which are located downstream
of Highway 7 The valley segment containing GTCC-6 is classified as 1H small catchment and low slope
The valley segment containing GTCC-5 is classified as 3H small catchment and high slope The valley
segment containing GTCC-4 is classified as 2H small catchment and moderate slope
51 GTCC-6
The GTCC-6 station is the most upstream station located approximately 325 m downstream of Highway
7 near the crossing of Concession 4 On the south side of the channel is a small deciduous woodlot with
meadow grasses The north side is vegetated with tall dense meadow grasses and shrubs The
monitoring cross-section is located in a highly active area of the channel where ongoing erosion of the
right bank is occurring As a result of this there were challenges maintaining the cross-section bank pins
The 2003 cross-section was not considered as part of the results because the cross-section was
reinstalled in 2006 after the right bank pin was completely lost The 2006 cross-section is 23 m wider
than the original 2003 cross-section There also appeared to be an issue with the 2006 cross-section
when compared to subsequent cross-sections This is likely related to the movement of the right pin
from 60 m (2006) to 685 m (2009) Therefore only the 2009 2012 and 2016 cross-sections were
evaluated Based on the different months in which the monitoring was completed (October December
April) the channel is regularly dry during low flow periods such as summer and early fall However based
on the monitoring results it produces sufficient flow during wetter periods such as spring and rainfall
events to result in toe erosion and undercutting
23655-522 Carruthers Creek 2017-07-10 draftdocx 20 Matrix Solutions Inc
FIGURE 4 Location of GTCC-6 monitoring station
The three cross-sections indicate that the cross-section has deepened and also migrated further into the
right bank This is expected given the erosion and severe undercutting of the right bank seen in the
monitoring photos Minimal change to the left bank profile has occurred Between 2009 and 2012 the
cross-section deepened with the maximum depth increasing from 100 m to 113 m The 2016
cross-section exhibits aggradation along the left bank toe and erosion of the right bank toe There were
increases in cross-sectional area both in 2012 and 2016 indicating that the channel is not just migrating
towards the right bank but also enlarging The cross-sectional area in 2009 was 335 m2 and increased to
405 m2 in 2012 and then 423 m2 in 2016 Over the 7-year period this was an increase of 088 m2 or
262
Two erosion pins are located at the monitoring cross-section one in each bank The right bank pin (EP4)
exhibited large increases in exposure every monitoring period Based on the data from EP4 the
migration rate of the right bank is approximately 133 cmyr The left bank pin (EP5) exhibited changes
in exposure ranging from -8cm to 305 cm This would suggest that there is erosion followed by periodic
slumping of material along that bank The other erosion pins indicated that toe erosion is widespread
throughout the reach For example EP2 and EP3 were located in a bend that was actively eroding both
pins were found eroding out of the bank and lying on the bed at two of the monitoring visits This type
of severe toe erosion and undercutting often occurs in channels with grass dominated vegetation
The substrate at GTCC-6 is composed of fine grained materials including sand silt and small pebbles
Over the monitoring period this was consistent with no noticeable coarsening
23655-522 Carruthers Creek 2017-07-10 draftdocx 21 Matrix Solutions Inc
52 GTCC-5
The GTCC-5 station is located in a large woodlot upstream of the Deer Creek Golf Course Through this
area the channel is quite sinuous with tight bends and steep eroding banks Woody debris such as
branches and downed trees was common resulting in jams The banks in this reach were higher than
those upstream ranging from 050 to 125 m This is indicative of incision The monitoring cross-section
is located on the downstream straight section of an ldquoSrdquo bend There is substantial erosion along the
outer bank upstream of the cross-section the bend has over widened and a formed a large pool A large
willow tree fell across the channel at the monitoring cross-section between 2009 and 2012 due to this
the measuring tape would not lie flat in 2012 and 2016 The impact on the cross-section graph could not
be quantified it is assumed that the cross-section shape is representative of field conditions Specific
depth measurements for 2012 and 2016 are likely to be slightly higher than in the field due to the tree
pushing the tape higher in the center of the cross-section The two cross-sections correlate well with
each other signifying that the tree had a consistent impact on measuring tape and cross-section
measurement
FIGURE 5 Location of GTCC-5 monitoring station
The monitoring cross-section at GTCC-5 experienced the most significant change out of all the
monitoring stations The channel has substantially incised at this location as the result of a debris jam
failure Debris jams establish a sharp change in elevation on the channel profile When a debris jam fails
the channel will incise to remove the difference in elevation and re-establish a consistently sloped
profile This process was well documented at the GTCC-5 cross-section Based on the cross-section
overlay and corroboration by the monitoring photos the channel began to incise between 2006 and
23655-522 Carruthers Creek 2017-07-10 draftdocx 22 Matrix Solutions Inc
2009 The cross-section was stable between 2003 and 2006 with some accumulation of material
resulting in a small reduction in area The material likely accumulated as a result of the small debris jam
located immediately downstream of the cross-section (2003 photo) creating a backwater Between 2006
and 2009 the debris jam destabilized as seen in the 2009 photo The 2009 cross-section deepened and
widened along the right bank cross-sectional area increased by 053 m2 or 213 The max depth
increased by 029 m between 2006 and 2009 Between 2009 and 2012 the large willow tree located on
the left bank fell across the cross-section It can be seen in the 2009 photo on the left bank The downed
tree is an additional disturbance altering flow at the cross-section The change in cross-sectional area
between 2009 and 2012 was the most significant during the monitoring period enlarging by 127 m2 or
424 Max depth increased by 036 m this value could be inflated due to the measuring tape issue as a
result of the downed tree Between 2012 and 2016 the cross-section continued to enlarge primarily
through severe undercutting and subsequent retreat of the right bank The bed appears to have
stabilized as there was minimal change in the actual bed elevation A mid-channel bar has also formed
which supports this notion
In total the cross-section has incised approximately 062 m based on the difference in maximum depth
between the 2003 and 2016 cross-sections Over the 13-year monitoring period the cross-sectional area
has increased by 254 m2 or 98 The cross-section enlarged through incision and retreat of the right
bank while the left bank profile remained stable
There are two erosion pins located at the monitoring cross-section EP2 (left bank) and EP3 (right bank)
The data for these two pins is consistent with the cross-section results EP2 exhibited minimal change in
exposure during the monitoring period while EP3 exhibited large changes each monitoring year Based
on the data from EP3 the migration rate for the right bank is approximately 5cmyr The other three
erosion pins were frequently lost during the monitoring which suggests that they were fully eroded out
of the banks due to the severity of erosion For example EP4 was only re-measured once during the
monitoring period in 2009 and had a change in exposure of 25 cm
The substrate at GTCC-5 was dominated by finer material consisting of coarse sand pebbles and silt
from 2003 to 2009 Medium and coarse gravel represented the coarser fraction The distribution
coarsened in 2012 and 2016 this is typical of an incising channel When the debris jam no longer
created a backwater fine sediment would have been flushed out leaving coarser material behind As the
channel incised further additional fine material would have been removed The coarsening of the bed is
also an indication that incision is slowing as the accumulation of coarse material acts to reduce bed
erosion
53 GTCC-4
The GTCC-4 station is located on the Deer Creek Golf Course in a small cedar woodlot downstream of a
cart path bridge The woodlot provides a small buffer from the adjacent manicured golf course The
monitoring cross-section is located between in a straight section between two successive bends or an
23655-522 Carruthers Creek 2017-07-10 draftdocx 23 Matrix Solutions Inc
ldquoSrdquo bend In the upstream bend there was severe woody debris obstruction Upstream of the bend the
channel flows adjacent to a valley wall along the right bank The bend downstream of the cross-section
has severe erosion of the outer bank The bank is steep and elevated with minimal vegetative buffer
from the golf course approximately less than 5m
FIGURE 6 Location of GTCC-4 monitoring station
In 2003 the cross-sectional area for the monitoring cross-section was 164 m2 The maximum depth was
081 m The cross-section had a narrow low-flow area with a bottom width of approximately 060 m
Between 2003 and 2009 the cross-sectional area steadily increased primarily through erosion of the
vertical left bank widening the bottom width of the channel The 2009 cross-section appears to be
capturing a transition between the 20032006 cross-sections and the 20122016 cross-sections In 2009
the cross-section incised to a maximum depth 087 m This is the deepest measured cross-section during
the monitoring period The 2012 cross-section then exhibits a large loss of material from the lower
portion of the right bank where very little change was noted in the previous cross-sections Itrsquos unclear
from the monitoring photos what may have caused this The left bank also exhibited a noticeable retreat
between 2009 and 2012 The change in cross-sectional area between these 2009 and 2012 was 015 m2
or approximately 8 The 2012 and 2016 cross-sections have a wider bottom width of approximately
14 m as compared to approximately 060 m in 2003 Visually comparing the cross-sections the
20032006 cross-sections have a narrow defined low-flow area while the 20122016 cross-sections
have a larger general ldquoUrdquo shape This change in cross-sectional shape is reflected by a 25 increase in
cross-sectional area over the 13-year monitoring period
23655-522 Carruthers Creek 2017-07-10 draftdocx 24 Matrix Solutions Inc
6
One erosion pin is located at the monitoring cross-section in the left bank EP2 The pin exhibited
increases in exposure ranging from 6 to 155 cm Based on this data the average erosion rate for the left
bank was approximately 286 cmyr Erosion pin 4 exhibited variable results ranging from large increases
in exposure (365) to large decreases in exposure (-195) This is indicative of an area which is eroding
destabilizing and collapsing Erosion pin 1 was located in the outer bank of the eroding bend
downstream of the cross-section It was found eroded out of the bank in 2016 and exhibited large
increases in exposure in 2012 and 2009 Based on EP1 the average erosion rate in this bend is
approximately 86 cmyr Overall based on all the erosion pin data for GTCC-4 the average erosion rate
was 503 cmyr
The channel substrate primarily consisted of medium to coarse gravels The material appears to be
relatively large for the size of the channel which reduces vertical erosion As a result the primary mode
of cross-sectional adjustment was lateral erosion The substrate distribution was consistent over the
13-year monitoring period and exhibited no distinct shifts
CARRUTHERS CREEK MAIN BRANCH
The Main Branch of Carruthers Creek originates to the west of Tributary A north of Concession 7 and
east of Westney Road The Main Branch is approximately 27 km long and flows into Lake Ontario The
surrounding land use north of Taunton Road is primarily rural and agricultural South of Taunton Road
the channel corridor is generally contained within residential development particularly between
Taunton Road and Rossland Road Sinuosity also begins to increase noticeably south of Taunton Road
becoming highly sinuous south of Rossland Road This increase in sinuosity corresponds to the reduced
gradient progressing towards the Lake There are five monitoring stations located on the Main Branch
One is located in the headwater area GCC-12 while the other four are located south of Highway 7
There is a large area gap of approximately 9kms between GCC-12 and the next station (GCC-7) The
furthest downstream station is GCC-2 located on the south side of Kingston Road There are no stations
located below Highway 401
61 GCC-12
The GCC-12 station is the most upstream station on the Main Branch of Carruthers Creek It is located
approximately 100 m downstream of Concession 7 The channel flows adjacent to a rural residential
property with agricultural fields surrounding the riparian corridor The riparian corridor is relatively wide
at the monitoring station approximately 80 to 100 m The surrounding vegetation is predominantly tall
meadow grasses and small willow woodlots At the monitoring cross-section both banks are vegetated
with meadow grasses
23655-522 Carruthers Creek 2017-07-10 draftdocx 25 Matrix Solutions Inc
FIGURE 7 Location of GCC-12 monitoring station
There were challenges maintaining the monitoring cross-section at GCC-12 due to ongoing erosion of
the right bank Neither of the cross-section bank pins could be located in 2016 The cross-section was
reinstalled based on an erosion pin that corresponded to the cross-section Therefore the 2016
cross-section should not be compared with other monitoring years It was also noted during the 2016
measurement that the right bank was noticeably higher than the left bank making it difficult to level the
tape Assuming the cross-section was reinstalled at the correct location this difference in bank height
could have impacted previous cross-section measurements Notes from the 2009 cross-section
measurement also indicated that the tape was not level This may have been a result of moving the right
pin back which occurred in 2009 The pin was moved from 43 m to 51 m presumably to prevent loss
due to erosion The movement of the right bank pin in 2009 made comparisons to the earlier years
2003 and 2006 difficult
In general the cross-section is migrating towards the right bank and steadily eroding it It also appears
that the cross-section has deepened based on the overlays and the photo documentation
Two erosion pins are located at the monitoring cross-section EP3 (left bank) and EP4 (right bank)
The erosion pins provide particularly useful data when there are issues maintaining a cross-section The
right bank erosion pin results indicated ongoing retreat of the right bank Twice EP4 was lost or eroded
out of the bank (2006 and 2016) The change in exposure between 2006 and 2009 for EP4 was 30 cm
Between 2009 and 2012 the change in exposure was 20 cm The average migration rate at EP4 was
833 cmyr based on this data The left bank pin at the cross-section EP3 could not be located twice
during the monitoring period in 2012 and 2016 Two of the erosion pins were located in an actively
23655-522 Carruthers Creek 2017-07-10 draftdocx 26 Matrix Solutions Inc
eroding bend downstream of the monitoring cross-section EP1 and EP2 Both EP1 and EP2 exhibited
large increases in exposure between 2003 and 2006 21 cm and 34 cm respectively
The channel substrate at GCC-12 is primarily composed of medium to coarse gravels There appears to
be a coarsening of the distribution in 2012 and 2016 This is indicated by the higher D50 values as well as
D16 values that are comparable to the D50 values from previous monitoring years The coarsening may be
a result of deepening of the cross-section When this occurs finer material is removed while coarser
material which is too large for the channel to transport remains on the bed
62 GCC-7
The GCC-7 monitoring station is located at the south end of the Deer Creek Golf Course Specifically it is
located in a 50m reach of channel between a cart path crossing and a golf course road (Squire Drive)
The channel is surrounded by golf course fairway and has a minimal riparian buffer of less than 5m The
close proximity to golf course operations led to challenges in maintaining the cross-section The 2009
cross-section needed to be reinstalled after the right bank pin was found lying on the bank The pin was
reinstalled 15 m wider than the original cross-section The right bank pin had to be reinstalled again in
2012 due to the removal by golf course maintenance staff A cross-section was not completed in 2016
because neither of the bank pins could be located due to previous issues it was not reinstalled Based
on these issues only the 2003 and 2006 cross-sections could be compared
FIGURE 8 Location of GCC-7 monitoring station
23655-522 Carruthers Creek 2017-07-10 draftdocx 27 Matrix Solutions Inc
Between 2003 and 2006 the cross-section exhibited evidence of erosion along the right side of the
cross-section and right bank face This was paired with a accumulation of material on the left side of the
cross-section The cross-sectional area was reduced from 175 m2 to 15 m2 approximately -14
Based on these two years the channel was migrating towards the right bank Without subsequent years
of data it is unclear if this process continues and if there is a general trend of reduction in cross-sectional
area
The two erosion pins located at the cross-section provide additional insight EP3 was located in the right
bank and EP4 was located in the left bank The data from EP3 indicated that the right bank was
continually eroding through the 13-year monitoring period The pin could not be located in two of the
monitoring years (2009 and 2016) presumably due to severe erosion For both of the monitoring years
that it was measured the exposure increased by 30 cm This suggests an erosion rate of 10 cmyr for the
right bank based on the EP3 data Data from EP4 exhibited decreases in exposure for each monitoring
year between 2006 and 2016 The results ranged from -35 to -115 cm Observations of the left bank in
2016 noted that the bank is slumping The slumping and erosion is likely related to the lack of riparian
buffer to provide additional support to the banks
The channel substrate at GCC-7 is primarily composed of medium to coarse gravel with the largest
material classified as cobbles The grain size distribution was consistent over the 13-year monitoring
period with no observable trends The coarse nature of the material is expected due to the location on
the golf course and the high potential for modification and erosion protection
63 GCC-6
The GCC-6 monitoring station is located immediately south of Taunton Road in a riparian corridor
between two residential areas The residential area to the east was completed between 2005 and 2008
while the area to the west was completed shortly after Stormwater management ponds are located on
either side of the channel corridor as well as a paved trail to the east This is the first of three stations
located in the southern developed portion of the watershed The channel is situated within a woodland
area approximately 125 m wide Vegetation consisted of deciduous trees woody shrubs and tall
grasses The channel is quite sinuous with tight eroding bends Eroding and undercutting banks were
common throughout the reach resulting in frequent slumped vegetated blocks The monitoring
cross-section is located in a straight section of a large bend The left bank at the monitoring
cross-section corresponds with the outer bank of the bend and is vertical while there is a vegetated
point bar located along the right side of the cross-section The wetted width is narrowed by the point
bar and flow is focused along the toe of the left bank This encourages erosion and undercutting
23655-522 Carruthers Creek 2017-07-10 draftdocx 28 Matrix Solutions Inc
FIGURE 9 Location of GCC-6 monitoring station
Out of all the monitoring sites the cross-section at GCC-6 was the most consistent exhibiting minimal
change over the 13-year monitoring period The cross-sectional area in 2003 was 542 m2 with a
maximum depth of 137 m Maximum depth was extremely consistent at 134 m in both 2006 and 2009
and 133 m in 2012 This indicates that the channel bed has not changed The only change in the
cross-section was retreat of the left bank The most significant change during the monitoring period was
noted between 2006 and 2009 cross-sectional area increased from 520 m2 to 554 m2 approximately
66 Over the entire monitoring period the cross-sectional area increased by only 48 The
cross-section can be considered stable
While location of the monitoring cross-section was stable the surrounding reach exhibited frequent
undercutting of banks and slumping of material The erosion pin data indicated that pins were
frequently lost during the monitoring period When erosion pins cannot be located it is assumed that
they have been eroded out of the banks It also occurs when sufficient undercutting has occurred for the
bank to collapse on top of the erosion pin burying it This is likely what has occurred in GCC-6 Erosion
pin 3 was located in an outside bank downstream of a slumped bank area It could not be located in
2006 2009 or 2016 The only year it was located 2012 the exposure increased by 48 cm indicating an
erosion rate of 16 cmyr Erosion pin 1 was located every monitoring year and exhibited dramatic
increases in exposure ranging from 26 to 87 cm Three of the five erosion pins had an average erosion
rate of 16 cmyr Therefore while the cross-section itself was stable the surrounding reach is active
23655-522 Carruthers Creek 2017-07-10 draftdocx 29 Matrix Solutions Inc
The substrate at GCC-6 is primarily composed of medium gravels The grain size was consistent with
minimal variability during the 13-year monitoring period This is expected because the cross-section
graph indicated that the bed of the channel was largely unchanged
64 GCC-4
The GCC-4 monitoring station is located south of a railway crossing in a forested valley Channel
sinuosity is reduced through the reach by the confining effects of the surrounding valley Surrounding
land use is residential development which is located on either side of the valley The residential
development on the east side began around 2005 and was completed around 2014 On the west side
development began around 2012 and was completed around 2015 The forested valley consists of a
variety of both coniferous and deciduous species Leaning and fallen trees were common particularly
along the right bank which coincided with the valley wall
Figure 10 Location of GCC-4 monitoring station
The monitoring cross-section is located in a straight section which flows along the western toe of the
valley The cross-section is wide compared with other monitoring stations located in grass-lined areas
Toe erosion was noted along both banks The cross-sectional area in 2003 was 781 m2 with a maximum
depth of 138 m Over the monitoring period the cross-sectional area steadily reduced to 641 m2 in
2016 and a maximum depth of 113 m The cross-section overlay indicates that the reduction was
primarily through accumulation of bed material There was erosion of the right bank which is expected
because the channel abuts the valley wall along this side The reduction in cross-sectional area was
approximately 18 Generally a reduction in cross-sectional area is related to accumulation of fine
23655-522 Carruthers Creek 2017-07-10 draftdocx 30 Matrix Solutions Inc
material as a result of reduced velocity Reviewing the monitoring photos suggests that the reduction is
a result of accumulation of coarse material across the riffle that the cross-section is located at
There are two erosion pins located at the cross-section EP3 in the right bank and EP4 in the left bank
The data at EP3 indicated that the most substantial increase in exposure was between 2003 and 2006
45 cm Increases in exposure for the subsequent years were much less substantial The left bank erosion
pin EP4 exhibited small increases in exposure ranging from 45 to 16 cm This was relatively consistent
with the other erosion pins Generally the erosion pins exhibited increases in exposure which were
variable but provided similar erosion rates over the 13-year period Three of the five pins provided
average erosion rates of approximately 5cmyr
The substrate at GCC-4 was coarse and consisted primarily of coarse gravel and cobbles The monitoring
data indicated a general coarsening trend The median grain size increased from medium and coarse
gravel to very coarse gravel and small cobbles This indicates that the accumulation of material is
primarily through coarser material armouring the riffle and further reducing transport at the feature
65 GCC-2
The GCC-2 monitoring station is located immediately south of Kingston Road it is the furthest
downstream station The channel flows through a meadow dominated area with some small deciduous
woodlots To the west is a residential development a stormwater management pond and a paved trail
The development was built over the course of the monitoring period completed between 2009 and
2012 To the east is an agricultural field The channel is quite sinuous through this reach The reach was
characterized by tall steep undercutting banks Bank height was frequently 1m with material scoured
out from beneath the upper vegetative root layer Deep scour pools and accumulation of fine material
was also noted The reach can be considered fairly active based on these indicators
23655-522 Carruthers Creek 2017-07-10 draftdocx 31 Matrix Solutions Inc
Figure 11 Location of GCC-2 monitoring station
The monitoring cross-section is located in a short straight section of channel between two bends The
cross-section was highly active during the monitoring period both increasing and decreasing
cross-sectional area The cross-section shape has shifted and changed but when cross-sectional areas
from 2003 and 2016 are compared there is negligable difference The 2003 cross-sectional area was
327 m2 while the 2016 area was 333 m2 Between 2003 and 2006 the cross-sectional area reduced
through bed accumulation reducing maximum depth from 105 to 083m Between 2006 and 2009 the
cross-sectional area increased primarily through erosion of a high point along the right bank and erosion
of both bank toes There was some bed erosion during this time period as well increasing the maximum
depth by 004 m However lateral erosion was the dominant process The 2006 to 2009 period exhibited
the most significant change during the monitoring period cross-sectional area by increased 054 m2 or
19 The cross-section continued to increase through 2012 to 362 m2 with a maximum depth of
095 m This increase was a result of retreat of the right bank erosion along the left bank toe and
deepening of the bed Near the left bank toe there was a narrow notched area where the channel has
cut down This is likely where the thalweg and the strongest forces from the flow are focused In 2016
the cross-sectional area was reduced by 7 to 333 m2 This was primarily due to the accumulation of
sediment above bankfull along the right bank and along the right bank toe It is also worth noting that
during the 2016 assessment the right bank pin was buried under approximately 16 cm of fine material
This could suggest that the higher flows are regularly depositing fine material from bank erosion above
bankfull The bed of the 2016 cross-section exhibits a wider thalweg area than was document in 2012
The area is not as deep (092 m) but it is wider and more defined This could suggest that the channel is
slowly and systematically eroding downward
23655-522 Carruthers Creek 2017-07-10 draftdocx 32 Matrix Solutions Inc
7
Based on the variable changes in the cross-section it can not be definitively said whether it is increasing
or decreasing in size It is clear that the channel is highly active mobilizing sediment from both the bed
and banks in this reach The sediment then periodically accumulates within the channel or overbank
areas due to the excess amount
No erosion pins were located at the monitoring cross-section for GCC-2 Erosion pins 4 and 5 were
located approximately 40m upstream of the cross-section Erosion pin 4 was located at the downstream
end of an overwidened eroding bend with a large scour pool Erosion pin 5 was also located at the
downstream end of an area of severe erosion and undercutting Both EP4 and EP5 exhibited large
increases in exposure and were lost at once Based on the data at these two pins the average erosion
rate was 10 cmyr and 12 cmyr respectively The other three erosion pins were in areas of less active
erosion EP2 exhibited small amount of accumulation during most monitoring periods
The substrate at GCC-2 was predominantly fine material including silt sand and pebbles
This distribution is particularly small given the size of the channel and is likely a reflection of the ongoing
bank erosion The median grain size typically consistents of pebbles
DISCUSSION
The results from the 13-year monitoring period provide insight on channel processes at a variety of
scales Most reliably the data describes the processes occurring at various discrete sites throughout the
watershed Each station is a reflection of the specific governing factors at that location which include
surrounding vegetation land use geology and flow regime Reviewing the stations together based on
their general location within the watershed may reveal broader characteristics of the watercourse The
results of the monitoring program also provide insight into the effectiveness of a long-term program as
very few fluvial geomorphic programs are maintained for such an extensive period This warrants
additional discussion beyond results specific to the Carruthers Creek watershed
Both of the stations on Tributary A have relatively small cross-sectional areas which have enlarged over
the 13-year monitoring period (48 and 35) Due to the small size of the cross-sections small changes
in area result in a large percentage change The evolution of the two cross-sections is markedly
different While GTCC-11 exhibited a gradual consistent transition from a ldquoVrdquo to a ldquoUrdquo shaped
cross-section GTCC-9 appears to have experienced a more complex and abrupt transition The GTCC-9
cross-section exhibited a large change in cross-sectional area between 2003 and 2006 shifting to a
cross-sectional shape that differs from all other years After 2006 the cross-section re-established itself
as a distinctly different shape which consistently migrated towards the right bank and deepened for the
remainder of the monitoring period These results suggest that the 2006 monitoring captured the
cross-section after a specific event a brief instance which is not necessarily representative of the
ongoing long-term process The difference in adjustment between the two sites highlights the
importance of local site-specific characteristics While both cross-sections are enlarging potentially in
response to the same governing factor they do so differently The consistent adjustment at GTCC-11 is
23655-522 Carruthers Creek 2017-07-10 draftdocx 33 Matrix Solutions Inc
reflective of equal resistance of vegetation and bank materials At GTCC-9 the difference in bank
vegetation dense woody dogwood versus dense herbaceous grasses has biased the cross-sectional
adjustment to the right half of the cross-section where less force is required to erode the material
Tributary B is the larger of the two tributaries and has three monitoring stations For Tributary B
interpreting the cross-section adjustment with respect to potential systemic adjustment was
complicated by additional factors for two of the three stations GTCC-6 and GTCC-5 The GTCC-5
cross-section enlarged dramatically (98) doubling in size through incision as a result of a debris jam
failure This adjustment in the response to the local event masks potential channel adjustment which
could be attributed to broader systemic change At GTCC-6 the data was incomplete due to issues with
maintaining the cross-section as a result of severe erosion of the right bank Only the last three
monitoring years (2009 2012 and 2016) were comparable During this period the cross-sectional area
increased by 26 through retreat of the right bank and incision The results definitively indicate that
from 2009-2016 the cross-section is continually enlarging Based on the issues with the right bank pin in
2003 and 2006 it can be inferred that these cross-sections would have exhibited the same trend if the
bank pin had been maintained The third station GTCC-4 did not appear to be impacted by any
identifiable site-specific issues Therefore it is more plausible that adjustment at GTCC-4 is reflective of
potential broader scale influences At GTCC-4 the cross-section adjusted primarily through lateral
erosion as vertical adjustment was limited by coarse bed material The cross-sectional area increased by
25 between 2003 and 2016 transitioning to a distinctly different shape with increased bed width The
enlargement of GTCC-6 and GTCC-4 may be indicative of a broader scale response of Tributary B The
GTCC-5 cross-section may also be support this but it is unclear due to the prominent influence of a local
event
There are five monitoring stations located on the Main Branch of Carruthers Creek Similar to Tributary
B two of the stations had challenges with maintenance and produced incomplete data which was not
definitive At GCC-12 the overall trend of cross-sectional adjustment could not be determined The two
monitoring periods for which cross-sectional area could be compared produced conflicting results
cross-sectional area reduced from 2003 to 2006 and increased from 2009 to 2012 At GCC-7
cross-section graphs after 2006 could not be used due to movement or loss of the right bank pin With
only one monitoring period of data (2003-2006) in which cross-sectional area was reduced no definitive
trends could be identified Both GCC-7 and GCC-12 exhibited ongoing erosion of one of their banks this
could not be attributed to a particular channel process The remainder of the stations GCC-6 GCC-4
and GCC-2 were all located in the lower half of the watershed where ongoing development has occurred
during the monitoring period There does not appear to be an observable trend in the results from the
three stations The GCC-6 cross-section was the least active out of all the monitoring stations
Cross-sectional area increased by 48 during the monitoring period but the cross-sectional shape
remained static The increase in area was the result of erosion of the vertical left bank However
beyond the cross-section the overall GCC-6 reach was active with ongoing erosion slumping and
frequent loss of erosion pins The GCC-4 cross-section was the only monitoring cross-section that
23655-522 Carruthers Creek 2017-07-10 draftdocx 34 Matrix Solutions Inc
exhibited well-documented aggradation reducing cross-sectional area by 18 This is the result of an
accumulation of coarse material which was indicated by a coarsening trend in the grain size
distribution Erosion pin data for the site was relatively consistent with most pins exhibiting average
migration of 5cmyr The GCC-2 cross-section was highly active during the monitoring period increasing
and decreasing cross-sectional area between monitoring years However when comparing the 2003 and
2016 cross-sections there was negligible change in cross-sectional area Throughout the site vertical
banks severe undercutting and bank collapses were common It is assumed that the changes in the
cross-section are a manifestation of the frequent input of fine bank material which temporarily deposits
on the bed and then is periodically flushed downstream This process is supported by the grain size
distribution data which was notably fine for the size of the channel The results of the three downstream
main branch stations did not display a common response which could be attributed to broad scale
influences such as the surrounding ongoing development
The results of the Carruthers Creek monitoring program indicate that the watercourse is an active
channel whether the cross-section is enlarging aggrading or continually adjusting while maintaining a
similar size The sites on both Tributary A and Tributary B suggest that channel dimensions are
increasing The magnitude of increase was larger for the Tributary A sites presumably because it is the
smaller of the two tributaries and is therefore more sensitive to surrounding change Comparatively
while the main branch sites exhibited active channel processes overall change was relatively minimal
There was no indication of a common adjustment response amongst the main branch sites Similar to
the tributaries this is indicative of the larger channelrsquos resilience to accommodate changes to the
surrounding area It should also be considered that the main branch stations are the only stations
located in the developing area of the watershed while most of the tributary sites are located in the
upper agricultural and rural area of the watershed The expectation would be that the ongoing
development would alter the hydrologic regime of the downstream stations and this would manifest as
changes in morphology However this is not supported by the results Channel morphology and flow
regime are intrinsically linked which allows for inferences to be made about both characteristics when
there is sufficient knowledge of one Based on this it can be inferred that the tributary stations are
enlarging as a response to changes in the flow regime However it cannot be definitively determined
without a complementary flow monitoring program
Overall the 13-year monitoring period provided a unique opportunity to document changes in channel
morphology for the purposes of understanding channel processes Fluvial geomorphology monitoring
programs are generally undertaken for 3 to 5 years following the completion of a natural channel
design shorter 1 to 3 year programs are completed for characterization studies After reviewing the
results of the Carruthers Creek monitoring it is clear that a 3 to 5 year monitoring program would not
have adequately captured the ongoing trends The results also revealed the challenges with maintaining
a long-term program such as selecting an appropriate location and establishing a sufficiently wide
cross-section
23655-522 Carruthers Creek 2017-07-10 draftdocx 35 Matrix Solutions Inc
8 REFERENCES
Galli J 1996 Rapid Stream Assessment Technique Field Methods Metropolitan Washington Council of
Governments Washington DC 36pp
Parish Geomorphic Ltd (PARISH) 2003 Valley Segments Carruthers Petticoat and Duffins Creek
Watersheds Report prepared for the Toronto and Region Conservation Authority
September 2003
Ontario Ministry of the Environment (MOE) 2003 Stormwater Management Planning and Design
Manual Queenrsquos Printer Ottawa Ontario March 2003
httpwwwontariocadocumentstormwater-management-planning-and-design-manual
Parish Geomorphic Ltd (PARISH) 2004 Regional Monitoring Program - Fluvial Geomorphology
Component Pettitcoat Creek Carruthers Creek Duffins Creek and Highland Creek Watersheds
Report prepared for the Toronto and Region Conservation Authority April 2004
Toronto and Region Conservation Authority (TRCA) 2015 Crossings Guideline for Valley and Stream
Corridors September 2015 httpwwwtrcaoncadotAsset214493pdf
Toronto and Region Conservation Authority (TRCA) 2003 A Watershed Plan for Duffins Creek and
Carruthers Creek August 2003 httpwwwtrcaoncadotAsset25961pdf
Wolman M G 1954 ldquoA method of sampling coarse river-bed materialrdquo Eos Transactions American
Geophysical Union 35 (6) 951-956
23655-522 Carruthers Creek 2017-07-10 draftdocx 36 Matrix Solutions Inc
- Phase 1 Technical Reports
- Phase 1 Technical Reports
- CCWP_FluvialGeomorphologyReport-Matrix_2017_finalpdf
-
- CCWP_Ph1-techreports-intro-2017_v9_FluvGpdf
-
- Phase 1 Technical Reports
- Phase 1 Technical Reports
-
- CCWP_Ph1-techreports-intro-2017_v9_FluvGpdf
-
- Phase 1 Technical Reports
- Phase 1 Technical Reports
-
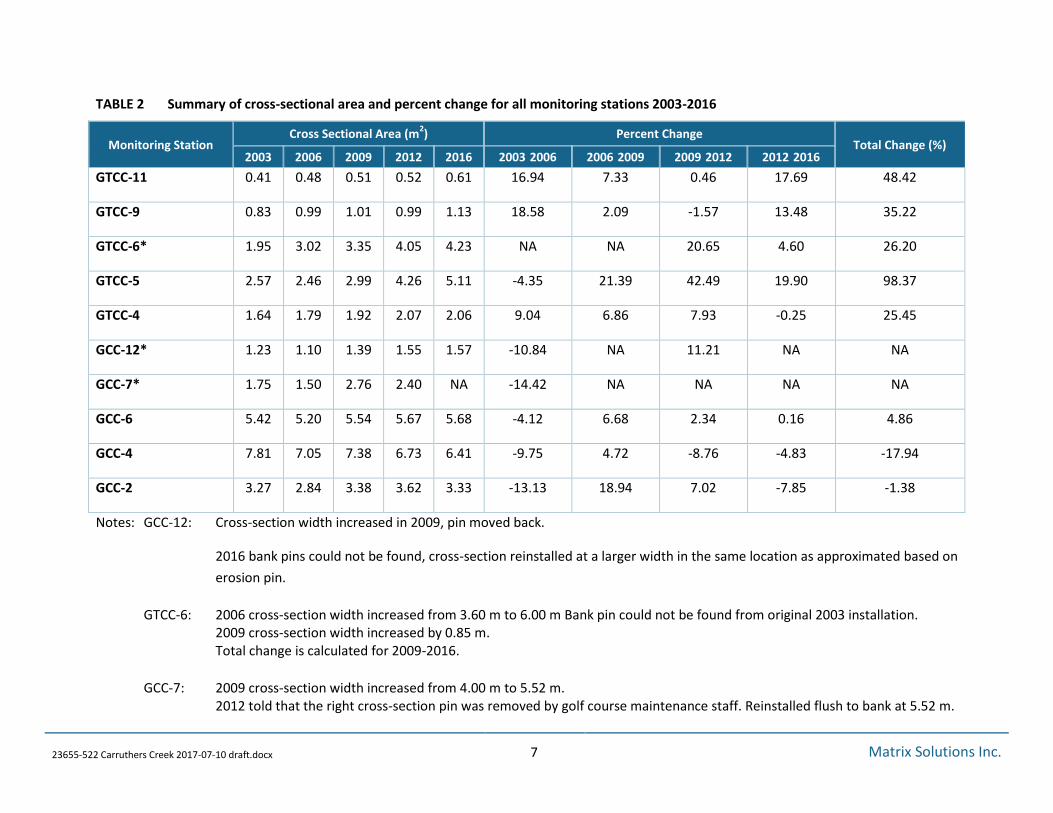
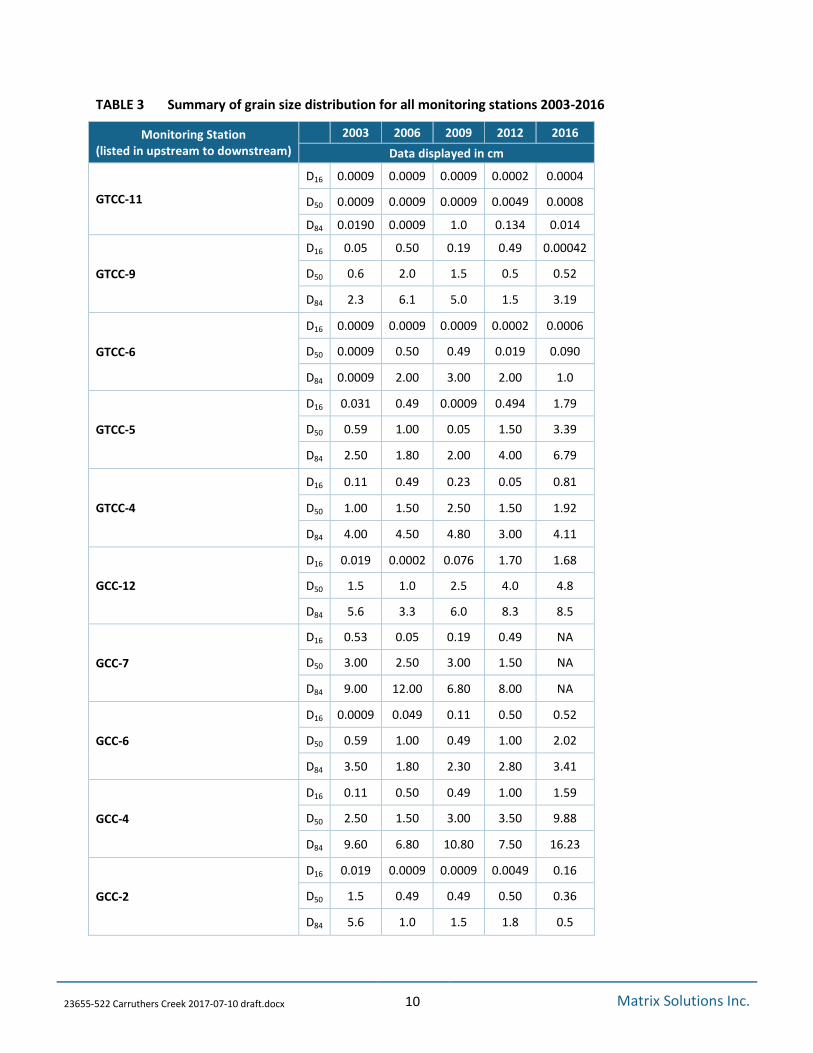
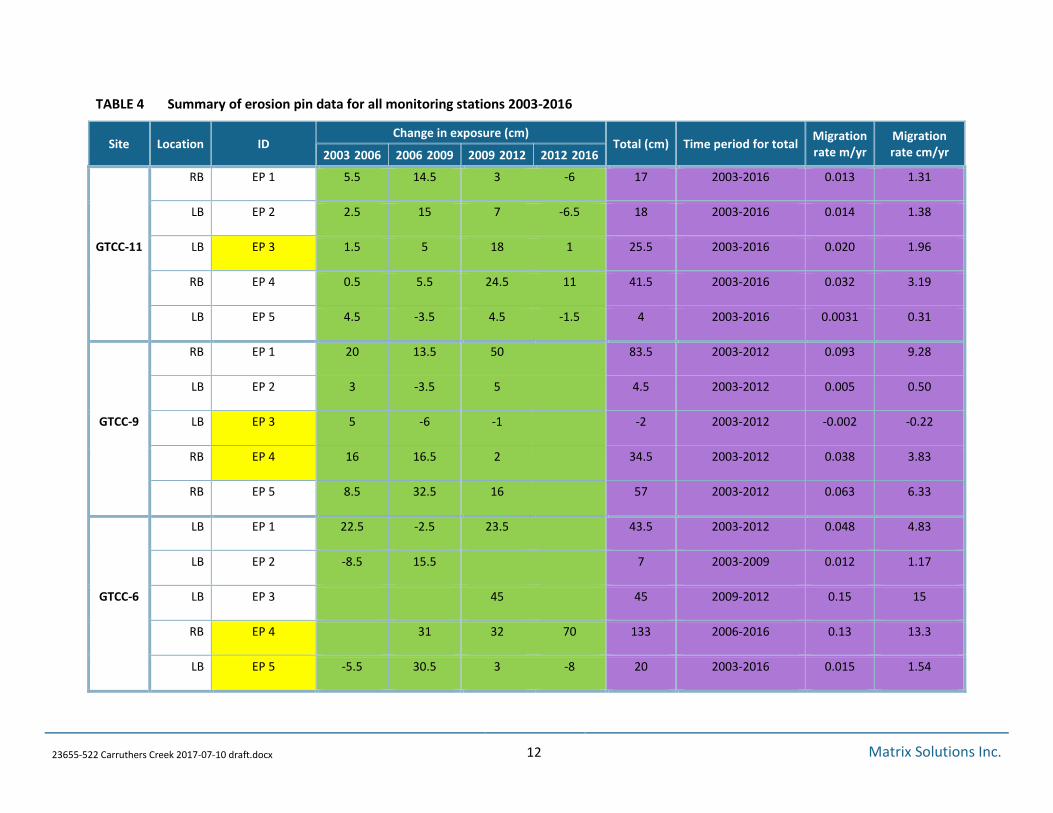
- - - -Site Location ID
Change in exposure (cm) Total (cm) Time period for total
Migration rate myr
Migration rate cmyr 2003 2006 2006 2009 2009 2012 2012 2016
GTCC-5
RB EP 1 36 5 36 2003-2006 0120 12
LB EP 2 -2 1 -05 05 -1 2003-2016 -0001 -008
RB EP 3 195 19 75 46 2003-2012 0051 511
RB EP 4 25 25 2006-2009 0083 833
LB EP 5 -7 6 -55 -65 2003-2012 -0007 -072
GTCC-4
LB EP 1 18 34 52 2006-2012 0087 867
LB EP 2 155 14 6 20 2009-2016 0029 286
RB EP 3 205 12 18 14 645 2003-2016 0050 496
RB EP 4 -145 365 -195 75 10 2003-2016 0008 077
LB EP 5 9 57 13 79 2006-2016 0079 790
GCC-12
LB EP 1 21 255 8 545 2003-2012 0061 606
LB EP 2 34 65 55 43 46 2003-2016 0035 354
LB EP 3 -345 75 -27 2003-2009 -0045 -450
RB EP 4 30 20 50 2006-2012 0083 833
RB EP 5 1 65 14 -5 215 2003-2016 0017 165
GCC-7 RB EP 1 65 85 15 2009-2016 0021 214
23655-522 Carruthers Creek 2017-07-10 draftdocx 13 Matrix Solutions Inc
- - - -Site Location ID
Change in exposure (cm) Total (cm) Time period for total
Migration rate myr
Migration rate cmyr 2003 2006 2006 2009 2009 2012 2012 2016
RB EP 2 145 47 -235 38 2003-2012 0042 422
RB EP 3 30 305 305 2009-2012 0102 1017
LB EP 4 35 -35 -75 -115 -19 2003-2016 -0015 -146
GCC-6
LB EP 1 87 31 69 26 213 2003-2016 0164 1638
LB EP 2 5 155 05 95 305 2003-2016 0023 235
RB EP 3 48 48 2009-2012 0160 16
RB EP 4 555 38 935 2006-2012 0156 1558
RB EP 5 13 135 265 2006-2012 0044 442
GCC-4
LB EP 1 7 11 44 44 2012-2016 0110 11
RB EP 2 44 16 23 39 2009-2016 0056 557
RB EP 3 45 8 2 135 685 2003-2016 0053 527
LB EP 4 45 16 5 7 325 2003-2016 0025 25
RB EP 5 275 1 225 10 61 2003-2016 0047 469
GCC-2
LB EP 1 11 5 5 21 2003-2012 0023 233
RB EP 2 2 -05 -2 -25 -3 2003-2016 -0002 -023
RB EP 3 -10 15 8 95 2009-2016 0014 136
23655-522 Carruthers Creek 2017-07-10 draftdocx 14 Matrix Solutions Inc
- - - -Site Location ID
Change in exposure (cm) Total (cm) Time period for total
Migration rate myr
Migration rate cmyr 2003 2006 2006 2009 2009 2012 2012 2016
RB EP 4 40 21 415 1025 2006-2016 0100 1025
LB EP 5 545 135 405 1085 2003-2012 0120 1206
erosion pins highlighted with yellow are those located at the monitoring cross-section
23655-522 Carruthers Creek 2017-07-10 draftdocx 15 Matrix Solutions Inc
34 Rapid Assessment Results
A rapid assessment was completed for each valley segment in accordance with the RGA (MOE 2003)
and RSAT (Galli 1996) stream assessment protocols Rapid assessment were undertaken to investigate
any significant changes in the geomorphic stability or ecological health of each segment relative to
previously reported results (Parish 2004 TABLE 1) A summary of the 2016 RGA and RSAT results is
presented in TABLE 5 In general 2016 RGA scores were slightly lower than those previously recorded in
2004 suggesting an improvement in channel stability (highlighted in red in TABLE 5) RSAT scores
remained consistent with very little deviation from results reported in 2004 Although the results
suggest improved channel stability within the catchment the rapid assessment protocols are very
subjective and can often be misleading Long term monitoring of geomorphic parameters as those
discussed in previous subsections provides a better method of assessing trends in channel form and
function A detailed description of each valley segment and comprehensive assessment of long term
monitoring results is provided in subsequent sections
TABLE 5 Summary of 2016 Rapid Assessment Results
Valley Segments RGA Stability Index RSAT Stability Index
GTCC-11 009 In Regime 24 Moderate
GTCC-9 013 In Regime 25 Moderate
GTCC-6 016 In Regime 26 Moderate
GTCC-5 032 Transitional 30 Moderate
GTCC-4 025 Transitional 27 Moderate
GCC-12 015 In Regime 28 Moderate
GCC-7 013 In Regime 23 Moderate
GCC-6 020 Transitional 27 Moderate
GCC-4 018 In Regime 34 Moderate
GCC-2 028 Transitional 27 Moderate
23655-522 Carruthers Creek 2017-07-10 draftdocx 16 Matrix Solutions Inc
4 TRIBUTARY A
Tributary A is located at the upstream end of the watershed beginning north of Concession 7 and
confluences with the Main Branch north of Highway 7 The tributary is approximately 4 km in length and
flows through rural area where the dominant surrounding land use is agricultural The riparian corridor
for the tributary is generally 40 to 100 m wide Vegetation consisted of deciduous swamp meadow
marsh buckthorn deciduous thicket and a small area of hardwood deciduous forest downstream of
Highway 407 Two monitoring stations were located on Tributary A GTCC-11 and GTCC-9 The valley
segment containing GTCC-11 was classified as 3M small catchment and high slope The valley segment
containing GTCC-9 was classified as 2M small catchment and moderate slope
41 GTCC-11
The GTCC-11 station is located approximately 200 m upstream of Highway 7 The channel is located in
an area vegetated with shrubs tall grasses and deciduous trees This vegetated area is approximately
60m wide beyond which are agricultural fields The eastern bank is vegetated with poplar trees and red
osier dogwoods while the western bank is vegetated with tall dense grasses
FIGURE 2 Location of GTCC-11 monitoring station
In 2003 the cross-sectional area for the monitoring cross-section was 041 m2 The cross-section had a
narrow ldquoVrdquo shape typical of a small tributary At the time of survey (October) the wetted width was
030 m The bankfull width was approximately 071 m and the max depth was 036 m Over the
monitoring period the cross-section exhibited a steadily increasing cross-sectional area Between 2003
23655-522 Carruthers Creek 2017-07-10 draftdocx 17 Matrix Solutions Inc
and 2016 the cross-sectional area increased by 010 m2 or approximately 48 The cross-section overlay
indicates that this change corresponds to a deepening and widening of the thalweg transitioning the
cross-section from a ldquoVrdquo to a ldquoUrdquo shape The 2006 and 2009 cross-sections show the cross-section
deepening to a maximum depth of 043 m in 2009 The 2012 and 2016 cross-sections then show
widening of the bed through ongoing toe erosion while the maximum depth returns to a consistent
040 m Comparing the 2016 cross-section to the other years also suggests deepening of the floodplain
area This could be a result of higher flows more frequently spilling onto the floodplain and establishing
a larger bankfull cross-section Shifts in floodplain topography can also be tied to growth and die-off of
dense tall grass vegetation These changes in cross-sectional shape are a manifestation of typical
channel processes in a small headwater channel
The erosion pins generally exhibited increased exposure between monitoring periods The maximum
increase in exposure was 245 cm for EP4 between 2009 and 2012 During this monitoring period there
was also a large change in exposure (18 cm) for the erosion pin at the monitoring cross-section (EP3)
Based on these exposures the erosion rates would be approximately 8 cmyr and 6 cmyr respectively
The erosion rates based on the full monitoring period (13 years) ranged from 031 cmyr to 319 cmyr
The average erosion rate is 163 cmyr
The substrate at GTCC-11 is composed of fine grained materials including sand silt and small pebbles
Over the monitoring period this was consistent with no noticeable coarsening
42 GTCC-9
The GTCC-9 station is located approximately 700 m downstream of GTCC-11 It is approximately 2 km
from the confluence with the main channel At GTCC-11 the channel is located on the floor of a valley
which is approximately 20 to 40 m wide The channel meanders across the valley floor periodically
contacting the valley walls The valley floor is vegetated with meadow grasses and woody shrubs such as
buckthorn and red osier dogwoods The slopes are populated by deciduous trees Beyond the top of the
valley are agricultural fields At the monitoring cross-section the right bank (western) is vegetated with
tall grasses and the left bank (eastern) is covered by a large red osier dogwood The monitoring photos
indicate that the cross-section was originally installed immediately downstream of the dogwood
Overtime the dogwood has grown sufficiently large that it encompasses the area where the left bank pin
is located This made it difficult to properly level the measuring tape along the left bank due to the
dense woody vegetation that must be pushed down to allow the tape to lie flat
23655-522 Carruthers Creek 2017-07-10 draftdocx 18 Matrix Solutions Inc
FIGURE 3 Location of GTCC-9 monitoring station
In 2003 the cross-sectional area for the monitoring cross-section was 083 m2 The cross-section had a
notched low-flow channel in the center with a bottom width of approximately 050 m The 2006
cross-section was distinctly different from all other monitoring years and appears to have captured a
transitional period The cross-section bottom width increased to approximately 077 m and no longer
exhibited a defined low-flow area Between 2003 and 2006 cross-sectional area increased by 016 m2
the largest change during the 13-year period Due to the transitional shape it was difficult to define
bankfull for the 2006 cross-section The cross-sections for 2009 2012 and 2016 all indicate that the
channel is migrating towards the right bank This is evidenced by the increasing elevation of the left
bank profile and the consistent retreat of the right bank The cross-section is also deepening along the
right side Over the 13-year monitoring period the bed has deepened by approximately 010m based on
comparison of the max depth values from 2016 and 2003 The overall cross-sectional area has increased
by 030 m2 or 35
Two erosion pins are located at the monitoring cross-section one in each bank Both pins exhibited an
increase in exposure between 2003 and 2006 when the cross-section shape widened From 2006 to
2012 the right bank pin (EP4) exhibited continued increases in exposure while the left bank pin (EP3)
exhibited small reductions in exposure This is consistent with the migration of the channel towards the
right bank Based on the EP4 data the average erosion rate for the right bank at the monitoring
cross-section is 383 cmyr During the monitoring period the largest changes in exposure were noted at
EP1 and EP5 This was a result of their locations both were located on the outer bank of a bend The
average migration rates based on the EP1 and EP5 data are 928 cmyr and 633 cmyr
23655-522 Carruthers Creek 2017-07-10 draftdocx 19 Matrix Solutions Inc
5
The substrate at GTCC-9 is composed of fine grained material and medium sized gravel The substrate
was relatively consistent over the monitoring period with 2006 and 2009 considered coarser than other
years based on the D50 These years may have been coarser because the cross-section was actively
enlarging and more of the fine material had been removed Additionally the 2009 cross-section was
measured in April when high flows are more frequent due to spring melt This leads to seasonally
coarse distributions as fine material is flushed away more regularly
TRIBUTARY B
Tributary B begins northeast of Tributary A south of Concession 8 It is the larger of the two tributaries
approximately 94 km in length more than double the length of Tributary A North of Highway 7 the
channel flows through rural agricultural land with a riparian corridor ranging from approximately 10m
wide in the headwaters to approximately 80 m wide south of Highway 407 South of Highway 7
the channel flows through a small residential development where a channel design has been
implemented The channel then flows through a dense woodlot area before continuing through Deer
Creek Golf Course The confluence with the Main Branch is located near the south end of the golf
course There are three monitoring stations located on Tributary B all of which are located downstream
of Highway 7 The valley segment containing GTCC-6 is classified as 1H small catchment and low slope
The valley segment containing GTCC-5 is classified as 3H small catchment and high slope The valley
segment containing GTCC-4 is classified as 2H small catchment and moderate slope
51 GTCC-6
The GTCC-6 station is the most upstream station located approximately 325 m downstream of Highway
7 near the crossing of Concession 4 On the south side of the channel is a small deciduous woodlot with
meadow grasses The north side is vegetated with tall dense meadow grasses and shrubs The
monitoring cross-section is located in a highly active area of the channel where ongoing erosion of the
right bank is occurring As a result of this there were challenges maintaining the cross-section bank pins
The 2003 cross-section was not considered as part of the results because the cross-section was
reinstalled in 2006 after the right bank pin was completely lost The 2006 cross-section is 23 m wider
than the original 2003 cross-section There also appeared to be an issue with the 2006 cross-section
when compared to subsequent cross-sections This is likely related to the movement of the right pin
from 60 m (2006) to 685 m (2009) Therefore only the 2009 2012 and 2016 cross-sections were
evaluated Based on the different months in which the monitoring was completed (October December
April) the channel is regularly dry during low flow periods such as summer and early fall However based
on the monitoring results it produces sufficient flow during wetter periods such as spring and rainfall
events to result in toe erosion and undercutting
23655-522 Carruthers Creek 2017-07-10 draftdocx 20 Matrix Solutions Inc
FIGURE 4 Location of GTCC-6 monitoring station
The three cross-sections indicate that the cross-section has deepened and also migrated further into the
right bank This is expected given the erosion and severe undercutting of the right bank seen in the
monitoring photos Minimal change to the left bank profile has occurred Between 2009 and 2012 the
cross-section deepened with the maximum depth increasing from 100 m to 113 m The 2016
cross-section exhibits aggradation along the left bank toe and erosion of the right bank toe There were
increases in cross-sectional area both in 2012 and 2016 indicating that the channel is not just migrating
towards the right bank but also enlarging The cross-sectional area in 2009 was 335 m2 and increased to
405 m2 in 2012 and then 423 m2 in 2016 Over the 7-year period this was an increase of 088 m2 or
262
Two erosion pins are located at the monitoring cross-section one in each bank The right bank pin (EP4)
exhibited large increases in exposure every monitoring period Based on the data from EP4 the
migration rate of the right bank is approximately 133 cmyr The left bank pin (EP5) exhibited changes
in exposure ranging from -8cm to 305 cm This would suggest that there is erosion followed by periodic
slumping of material along that bank The other erosion pins indicated that toe erosion is widespread
throughout the reach For example EP2 and EP3 were located in a bend that was actively eroding both
pins were found eroding out of the bank and lying on the bed at two of the monitoring visits This type
of severe toe erosion and undercutting often occurs in channels with grass dominated vegetation
The substrate at GTCC-6 is composed of fine grained materials including sand silt and small pebbles
Over the monitoring period this was consistent with no noticeable coarsening
23655-522 Carruthers Creek 2017-07-10 draftdocx 21 Matrix Solutions Inc
52 GTCC-5
The GTCC-5 station is located in a large woodlot upstream of the Deer Creek Golf Course Through this
area the channel is quite sinuous with tight bends and steep eroding banks Woody debris such as
branches and downed trees was common resulting in jams The banks in this reach were higher than
those upstream ranging from 050 to 125 m This is indicative of incision The monitoring cross-section
is located on the downstream straight section of an ldquoSrdquo bend There is substantial erosion along the
outer bank upstream of the cross-section the bend has over widened and a formed a large pool A large
willow tree fell across the channel at the monitoring cross-section between 2009 and 2012 due to this
the measuring tape would not lie flat in 2012 and 2016 The impact on the cross-section graph could not
be quantified it is assumed that the cross-section shape is representative of field conditions Specific
depth measurements for 2012 and 2016 are likely to be slightly higher than in the field due to the tree
pushing the tape higher in the center of the cross-section The two cross-sections correlate well with
each other signifying that the tree had a consistent impact on measuring tape and cross-section
measurement
FIGURE 5 Location of GTCC-5 monitoring station
The monitoring cross-section at GTCC-5 experienced the most significant change out of all the
monitoring stations The channel has substantially incised at this location as the result of a debris jam
failure Debris jams establish a sharp change in elevation on the channel profile When a debris jam fails
the channel will incise to remove the difference in elevation and re-establish a consistently sloped
profile This process was well documented at the GTCC-5 cross-section Based on the cross-section
overlay and corroboration by the monitoring photos the channel began to incise between 2006 and
23655-522 Carruthers Creek 2017-07-10 draftdocx 22 Matrix Solutions Inc
2009 The cross-section was stable between 2003 and 2006 with some accumulation of material
resulting in a small reduction in area The material likely accumulated as a result of the small debris jam
located immediately downstream of the cross-section (2003 photo) creating a backwater Between 2006
and 2009 the debris jam destabilized as seen in the 2009 photo The 2009 cross-section deepened and
widened along the right bank cross-sectional area increased by 053 m2 or 213 The max depth
increased by 029 m between 2006 and 2009 Between 2009 and 2012 the large willow tree located on
the left bank fell across the cross-section It can be seen in the 2009 photo on the left bank The downed
tree is an additional disturbance altering flow at the cross-section The change in cross-sectional area
between 2009 and 2012 was the most significant during the monitoring period enlarging by 127 m2 or
424 Max depth increased by 036 m this value could be inflated due to the measuring tape issue as a
result of the downed tree Between 2012 and 2016 the cross-section continued to enlarge primarily
through severe undercutting and subsequent retreat of the right bank The bed appears to have
stabilized as there was minimal change in the actual bed elevation A mid-channel bar has also formed
which supports this notion
In total the cross-section has incised approximately 062 m based on the difference in maximum depth
between the 2003 and 2016 cross-sections Over the 13-year monitoring period the cross-sectional area
has increased by 254 m2 or 98 The cross-section enlarged through incision and retreat of the right
bank while the left bank profile remained stable
There are two erosion pins located at the monitoring cross-section EP2 (left bank) and EP3 (right bank)
The data for these two pins is consistent with the cross-section results EP2 exhibited minimal change in
exposure during the monitoring period while EP3 exhibited large changes each monitoring year Based
on the data from EP3 the migration rate for the right bank is approximately 5cmyr The other three
erosion pins were frequently lost during the monitoring which suggests that they were fully eroded out
of the banks due to the severity of erosion For example EP4 was only re-measured once during the
monitoring period in 2009 and had a change in exposure of 25 cm
The substrate at GTCC-5 was dominated by finer material consisting of coarse sand pebbles and silt
from 2003 to 2009 Medium and coarse gravel represented the coarser fraction The distribution
coarsened in 2012 and 2016 this is typical of an incising channel When the debris jam no longer
created a backwater fine sediment would have been flushed out leaving coarser material behind As the
channel incised further additional fine material would have been removed The coarsening of the bed is
also an indication that incision is slowing as the accumulation of coarse material acts to reduce bed
erosion
53 GTCC-4
The GTCC-4 station is located on the Deer Creek Golf Course in a small cedar woodlot downstream of a
cart path bridge The woodlot provides a small buffer from the adjacent manicured golf course The
monitoring cross-section is located between in a straight section between two successive bends or an
23655-522 Carruthers Creek 2017-07-10 draftdocx 23 Matrix Solutions Inc
ldquoSrdquo bend In the upstream bend there was severe woody debris obstruction Upstream of the bend the
channel flows adjacent to a valley wall along the right bank The bend downstream of the cross-section
has severe erosion of the outer bank The bank is steep and elevated with minimal vegetative buffer
from the golf course approximately less than 5m
FIGURE 6 Location of GTCC-4 monitoring station
In 2003 the cross-sectional area for the monitoring cross-section was 164 m2 The maximum depth was
081 m The cross-section had a narrow low-flow area with a bottom width of approximately 060 m
Between 2003 and 2009 the cross-sectional area steadily increased primarily through erosion of the
vertical left bank widening the bottom width of the channel The 2009 cross-section appears to be
capturing a transition between the 20032006 cross-sections and the 20122016 cross-sections In 2009
the cross-section incised to a maximum depth 087 m This is the deepest measured cross-section during
the monitoring period The 2012 cross-section then exhibits a large loss of material from the lower
portion of the right bank where very little change was noted in the previous cross-sections Itrsquos unclear
from the monitoring photos what may have caused this The left bank also exhibited a noticeable retreat
between 2009 and 2012 The change in cross-sectional area between these 2009 and 2012 was 015 m2
or approximately 8 The 2012 and 2016 cross-sections have a wider bottom width of approximately
14 m as compared to approximately 060 m in 2003 Visually comparing the cross-sections the
20032006 cross-sections have a narrow defined low-flow area while the 20122016 cross-sections
have a larger general ldquoUrdquo shape This change in cross-sectional shape is reflected by a 25 increase in
cross-sectional area over the 13-year monitoring period
23655-522 Carruthers Creek 2017-07-10 draftdocx 24 Matrix Solutions Inc
6
One erosion pin is located at the monitoring cross-section in the left bank EP2 The pin exhibited
increases in exposure ranging from 6 to 155 cm Based on this data the average erosion rate for the left
bank was approximately 286 cmyr Erosion pin 4 exhibited variable results ranging from large increases
in exposure (365) to large decreases in exposure (-195) This is indicative of an area which is eroding
destabilizing and collapsing Erosion pin 1 was located in the outer bank of the eroding bend
downstream of the cross-section It was found eroded out of the bank in 2016 and exhibited large
increases in exposure in 2012 and 2009 Based on EP1 the average erosion rate in this bend is
approximately 86 cmyr Overall based on all the erosion pin data for GTCC-4 the average erosion rate
was 503 cmyr
The channel substrate primarily consisted of medium to coarse gravels The material appears to be
relatively large for the size of the channel which reduces vertical erosion As a result the primary mode
of cross-sectional adjustment was lateral erosion The substrate distribution was consistent over the
13-year monitoring period and exhibited no distinct shifts
CARRUTHERS CREEK MAIN BRANCH
The Main Branch of Carruthers Creek originates to the west of Tributary A north of Concession 7 and
east of Westney Road The Main Branch is approximately 27 km long and flows into Lake Ontario The
surrounding land use north of Taunton Road is primarily rural and agricultural South of Taunton Road
the channel corridor is generally contained within residential development particularly between
Taunton Road and Rossland Road Sinuosity also begins to increase noticeably south of Taunton Road
becoming highly sinuous south of Rossland Road This increase in sinuosity corresponds to the reduced
gradient progressing towards the Lake There are five monitoring stations located on the Main Branch
One is located in the headwater area GCC-12 while the other four are located south of Highway 7
There is a large area gap of approximately 9kms between GCC-12 and the next station (GCC-7) The
furthest downstream station is GCC-2 located on the south side of Kingston Road There are no stations
located below Highway 401
61 GCC-12
The GCC-12 station is the most upstream station on the Main Branch of Carruthers Creek It is located
approximately 100 m downstream of Concession 7 The channel flows adjacent to a rural residential
property with agricultural fields surrounding the riparian corridor The riparian corridor is relatively wide
at the monitoring station approximately 80 to 100 m The surrounding vegetation is predominantly tall
meadow grasses and small willow woodlots At the monitoring cross-section both banks are vegetated
with meadow grasses
23655-522 Carruthers Creek 2017-07-10 draftdocx 25 Matrix Solutions Inc
FIGURE 7 Location of GCC-12 monitoring station
There were challenges maintaining the monitoring cross-section at GCC-12 due to ongoing erosion of
the right bank Neither of the cross-section bank pins could be located in 2016 The cross-section was
reinstalled based on an erosion pin that corresponded to the cross-section Therefore the 2016
cross-section should not be compared with other monitoring years It was also noted during the 2016
measurement that the right bank was noticeably higher than the left bank making it difficult to level the
tape Assuming the cross-section was reinstalled at the correct location this difference in bank height
could have impacted previous cross-section measurements Notes from the 2009 cross-section
measurement also indicated that the tape was not level This may have been a result of moving the right
pin back which occurred in 2009 The pin was moved from 43 m to 51 m presumably to prevent loss
due to erosion The movement of the right bank pin in 2009 made comparisons to the earlier years
2003 and 2006 difficult
In general the cross-section is migrating towards the right bank and steadily eroding it It also appears
that the cross-section has deepened based on the overlays and the photo documentation
Two erosion pins are located at the monitoring cross-section EP3 (left bank) and EP4 (right bank)
The erosion pins provide particularly useful data when there are issues maintaining a cross-section The
right bank erosion pin results indicated ongoing retreat of the right bank Twice EP4 was lost or eroded
out of the bank (2006 and 2016) The change in exposure between 2006 and 2009 for EP4 was 30 cm
Between 2009 and 2012 the change in exposure was 20 cm The average migration rate at EP4 was
833 cmyr based on this data The left bank pin at the cross-section EP3 could not be located twice
during the monitoring period in 2012 and 2016 Two of the erosion pins were located in an actively
23655-522 Carruthers Creek 2017-07-10 draftdocx 26 Matrix Solutions Inc
eroding bend downstream of the monitoring cross-section EP1 and EP2 Both EP1 and EP2 exhibited
large increases in exposure between 2003 and 2006 21 cm and 34 cm respectively
The channel substrate at GCC-12 is primarily composed of medium to coarse gravels There appears to
be a coarsening of the distribution in 2012 and 2016 This is indicated by the higher D50 values as well as
D16 values that are comparable to the D50 values from previous monitoring years The coarsening may be
a result of deepening of the cross-section When this occurs finer material is removed while coarser
material which is too large for the channel to transport remains on the bed
62 GCC-7
The GCC-7 monitoring station is located at the south end of the Deer Creek Golf Course Specifically it is
located in a 50m reach of channel between a cart path crossing and a golf course road (Squire Drive)
The channel is surrounded by golf course fairway and has a minimal riparian buffer of less than 5m The
close proximity to golf course operations led to challenges in maintaining the cross-section The 2009
cross-section needed to be reinstalled after the right bank pin was found lying on the bank The pin was
reinstalled 15 m wider than the original cross-section The right bank pin had to be reinstalled again in
2012 due to the removal by golf course maintenance staff A cross-section was not completed in 2016
because neither of the bank pins could be located due to previous issues it was not reinstalled Based
on these issues only the 2003 and 2006 cross-sections could be compared
FIGURE 8 Location of GCC-7 monitoring station
23655-522 Carruthers Creek 2017-07-10 draftdocx 27 Matrix Solutions Inc
Between 2003 and 2006 the cross-section exhibited evidence of erosion along the right side of the
cross-section and right bank face This was paired with a accumulation of material on the left side of the
cross-section The cross-sectional area was reduced from 175 m2 to 15 m2 approximately -14
Based on these two years the channel was migrating towards the right bank Without subsequent years
of data it is unclear if this process continues and if there is a general trend of reduction in cross-sectional
area
The two erosion pins located at the cross-section provide additional insight EP3 was located in the right
bank and EP4 was located in the left bank The data from EP3 indicated that the right bank was
continually eroding through the 13-year monitoring period The pin could not be located in two of the
monitoring years (2009 and 2016) presumably due to severe erosion For both of the monitoring years
that it was measured the exposure increased by 30 cm This suggests an erosion rate of 10 cmyr for the
right bank based on the EP3 data Data from EP4 exhibited decreases in exposure for each monitoring
year between 2006 and 2016 The results ranged from -35 to -115 cm Observations of the left bank in
2016 noted that the bank is slumping The slumping and erosion is likely related to the lack of riparian
buffer to provide additional support to the banks
The channel substrate at GCC-7 is primarily composed of medium to coarse gravel with the largest
material classified as cobbles The grain size distribution was consistent over the 13-year monitoring
period with no observable trends The coarse nature of the material is expected due to the location on
the golf course and the high potential for modification and erosion protection
63 GCC-6
The GCC-6 monitoring station is located immediately south of Taunton Road in a riparian corridor
between two residential areas The residential area to the east was completed between 2005 and 2008
while the area to the west was completed shortly after Stormwater management ponds are located on
either side of the channel corridor as well as a paved trail to the east This is the first of three stations
located in the southern developed portion of the watershed The channel is situated within a woodland
area approximately 125 m wide Vegetation consisted of deciduous trees woody shrubs and tall
grasses The channel is quite sinuous with tight eroding bends Eroding and undercutting banks were
common throughout the reach resulting in frequent slumped vegetated blocks The monitoring
cross-section is located in a straight section of a large bend The left bank at the monitoring
cross-section corresponds with the outer bank of the bend and is vertical while there is a vegetated
point bar located along the right side of the cross-section The wetted width is narrowed by the point
bar and flow is focused along the toe of the left bank This encourages erosion and undercutting
23655-522 Carruthers Creek 2017-07-10 draftdocx 28 Matrix Solutions Inc
FIGURE 9 Location of GCC-6 monitoring station
Out of all the monitoring sites the cross-section at GCC-6 was the most consistent exhibiting minimal
change over the 13-year monitoring period The cross-sectional area in 2003 was 542 m2 with a
maximum depth of 137 m Maximum depth was extremely consistent at 134 m in both 2006 and 2009
and 133 m in 2012 This indicates that the channel bed has not changed The only change in the
cross-section was retreat of the left bank The most significant change during the monitoring period was
noted between 2006 and 2009 cross-sectional area increased from 520 m2 to 554 m2 approximately
66 Over the entire monitoring period the cross-sectional area increased by only 48 The
cross-section can be considered stable
While location of the monitoring cross-section was stable the surrounding reach exhibited frequent
undercutting of banks and slumping of material The erosion pin data indicated that pins were
frequently lost during the monitoring period When erosion pins cannot be located it is assumed that
they have been eroded out of the banks It also occurs when sufficient undercutting has occurred for the
bank to collapse on top of the erosion pin burying it This is likely what has occurred in GCC-6 Erosion
pin 3 was located in an outside bank downstream of a slumped bank area It could not be located in
2006 2009 or 2016 The only year it was located 2012 the exposure increased by 48 cm indicating an
erosion rate of 16 cmyr Erosion pin 1 was located every monitoring year and exhibited dramatic
increases in exposure ranging from 26 to 87 cm Three of the five erosion pins had an average erosion
rate of 16 cmyr Therefore while the cross-section itself was stable the surrounding reach is active
23655-522 Carruthers Creek 2017-07-10 draftdocx 29 Matrix Solutions Inc
The substrate at GCC-6 is primarily composed of medium gravels The grain size was consistent with
minimal variability during the 13-year monitoring period This is expected because the cross-section
graph indicated that the bed of the channel was largely unchanged
64 GCC-4
The GCC-4 monitoring station is located south of a railway crossing in a forested valley Channel
sinuosity is reduced through the reach by the confining effects of the surrounding valley Surrounding
land use is residential development which is located on either side of the valley The residential
development on the east side began around 2005 and was completed around 2014 On the west side
development began around 2012 and was completed around 2015 The forested valley consists of a
variety of both coniferous and deciduous species Leaning and fallen trees were common particularly
along the right bank which coincided with the valley wall
Figure 10 Location of GCC-4 monitoring station
The monitoring cross-section is located in a straight section which flows along the western toe of the
valley The cross-section is wide compared with other monitoring stations located in grass-lined areas
Toe erosion was noted along both banks The cross-sectional area in 2003 was 781 m2 with a maximum
depth of 138 m Over the monitoring period the cross-sectional area steadily reduced to 641 m2 in
2016 and a maximum depth of 113 m The cross-section overlay indicates that the reduction was
primarily through accumulation of bed material There was erosion of the right bank which is expected
because the channel abuts the valley wall along this side The reduction in cross-sectional area was
approximately 18 Generally a reduction in cross-sectional area is related to accumulation of fine
23655-522 Carruthers Creek 2017-07-10 draftdocx 30 Matrix Solutions Inc
material as a result of reduced velocity Reviewing the monitoring photos suggests that the reduction is
a result of accumulation of coarse material across the riffle that the cross-section is located at
There are two erosion pins located at the cross-section EP3 in the right bank and EP4 in the left bank
The data at EP3 indicated that the most substantial increase in exposure was between 2003 and 2006
45 cm Increases in exposure for the subsequent years were much less substantial The left bank erosion
pin EP4 exhibited small increases in exposure ranging from 45 to 16 cm This was relatively consistent
with the other erosion pins Generally the erosion pins exhibited increases in exposure which were
variable but provided similar erosion rates over the 13-year period Three of the five pins provided
average erosion rates of approximately 5cmyr
The substrate at GCC-4 was coarse and consisted primarily of coarse gravel and cobbles The monitoring
data indicated a general coarsening trend The median grain size increased from medium and coarse
gravel to very coarse gravel and small cobbles This indicates that the accumulation of material is
primarily through coarser material armouring the riffle and further reducing transport at the feature
65 GCC-2
The GCC-2 monitoring station is located immediately south of Kingston Road it is the furthest
downstream station The channel flows through a meadow dominated area with some small deciduous
woodlots To the west is a residential development a stormwater management pond and a paved trail
The development was built over the course of the monitoring period completed between 2009 and
2012 To the east is an agricultural field The channel is quite sinuous through this reach The reach was
characterized by tall steep undercutting banks Bank height was frequently 1m with material scoured
out from beneath the upper vegetative root layer Deep scour pools and accumulation of fine material
was also noted The reach can be considered fairly active based on these indicators
23655-522 Carruthers Creek 2017-07-10 draftdocx 31 Matrix Solutions Inc
Figure 11 Location of GCC-2 monitoring station
The monitoring cross-section is located in a short straight section of channel between two bends The
cross-section was highly active during the monitoring period both increasing and decreasing
cross-sectional area The cross-section shape has shifted and changed but when cross-sectional areas
from 2003 and 2016 are compared there is negligable difference The 2003 cross-sectional area was
327 m2 while the 2016 area was 333 m2 Between 2003 and 2006 the cross-sectional area reduced
through bed accumulation reducing maximum depth from 105 to 083m Between 2006 and 2009 the
cross-sectional area increased primarily through erosion of a high point along the right bank and erosion
of both bank toes There was some bed erosion during this time period as well increasing the maximum
depth by 004 m However lateral erosion was the dominant process The 2006 to 2009 period exhibited
the most significant change during the monitoring period cross-sectional area by increased 054 m2 or
19 The cross-section continued to increase through 2012 to 362 m2 with a maximum depth of
095 m This increase was a result of retreat of the right bank erosion along the left bank toe and
deepening of the bed Near the left bank toe there was a narrow notched area where the channel has
cut down This is likely where the thalweg and the strongest forces from the flow are focused In 2016
the cross-sectional area was reduced by 7 to 333 m2 This was primarily due to the accumulation of
sediment above bankfull along the right bank and along the right bank toe It is also worth noting that
during the 2016 assessment the right bank pin was buried under approximately 16 cm of fine material
This could suggest that the higher flows are regularly depositing fine material from bank erosion above
bankfull The bed of the 2016 cross-section exhibits a wider thalweg area than was document in 2012
The area is not as deep (092 m) but it is wider and more defined This could suggest that the channel is
slowly and systematically eroding downward
23655-522 Carruthers Creek 2017-07-10 draftdocx 32 Matrix Solutions Inc
7
Based on the variable changes in the cross-section it can not be definitively said whether it is increasing
or decreasing in size It is clear that the channel is highly active mobilizing sediment from both the bed
and banks in this reach The sediment then periodically accumulates within the channel or overbank
areas due to the excess amount
No erosion pins were located at the monitoring cross-section for GCC-2 Erosion pins 4 and 5 were
located approximately 40m upstream of the cross-section Erosion pin 4 was located at the downstream
end of an overwidened eroding bend with a large scour pool Erosion pin 5 was also located at the
downstream end of an area of severe erosion and undercutting Both EP4 and EP5 exhibited large
increases in exposure and were lost at once Based on the data at these two pins the average erosion
rate was 10 cmyr and 12 cmyr respectively The other three erosion pins were in areas of less active
erosion EP2 exhibited small amount of accumulation during most monitoring periods
The substrate at GCC-2 was predominantly fine material including silt sand and pebbles
This distribution is particularly small given the size of the channel and is likely a reflection of the ongoing
bank erosion The median grain size typically consistents of pebbles
DISCUSSION
The results from the 13-year monitoring period provide insight on channel processes at a variety of
scales Most reliably the data describes the processes occurring at various discrete sites throughout the
watershed Each station is a reflection of the specific governing factors at that location which include
surrounding vegetation land use geology and flow regime Reviewing the stations together based on
their general location within the watershed may reveal broader characteristics of the watercourse The
results of the monitoring program also provide insight into the effectiveness of a long-term program as
very few fluvial geomorphic programs are maintained for such an extensive period This warrants
additional discussion beyond results specific to the Carruthers Creek watershed
Both of the stations on Tributary A have relatively small cross-sectional areas which have enlarged over
the 13-year monitoring period (48 and 35) Due to the small size of the cross-sections small changes
in area result in a large percentage change The evolution of the two cross-sections is markedly
different While GTCC-11 exhibited a gradual consistent transition from a ldquoVrdquo to a ldquoUrdquo shaped
cross-section GTCC-9 appears to have experienced a more complex and abrupt transition The GTCC-9
cross-section exhibited a large change in cross-sectional area between 2003 and 2006 shifting to a
cross-sectional shape that differs from all other years After 2006 the cross-section re-established itself
as a distinctly different shape which consistently migrated towards the right bank and deepened for the
remainder of the monitoring period These results suggest that the 2006 monitoring captured the
cross-section after a specific event a brief instance which is not necessarily representative of the
ongoing long-term process The difference in adjustment between the two sites highlights the
importance of local site-specific characteristics While both cross-sections are enlarging potentially in
response to the same governing factor they do so differently The consistent adjustment at GTCC-11 is
23655-522 Carruthers Creek 2017-07-10 draftdocx 33 Matrix Solutions Inc
reflective of equal resistance of vegetation and bank materials At GTCC-9 the difference in bank
vegetation dense woody dogwood versus dense herbaceous grasses has biased the cross-sectional
adjustment to the right half of the cross-section where less force is required to erode the material
Tributary B is the larger of the two tributaries and has three monitoring stations For Tributary B
interpreting the cross-section adjustment with respect to potential systemic adjustment was
complicated by additional factors for two of the three stations GTCC-6 and GTCC-5 The GTCC-5
cross-section enlarged dramatically (98) doubling in size through incision as a result of a debris jam
failure This adjustment in the response to the local event masks potential channel adjustment which
could be attributed to broader systemic change At GTCC-6 the data was incomplete due to issues with
maintaining the cross-section as a result of severe erosion of the right bank Only the last three
monitoring years (2009 2012 and 2016) were comparable During this period the cross-sectional area
increased by 26 through retreat of the right bank and incision The results definitively indicate that
from 2009-2016 the cross-section is continually enlarging Based on the issues with the right bank pin in
2003 and 2006 it can be inferred that these cross-sections would have exhibited the same trend if the
bank pin had been maintained The third station GTCC-4 did not appear to be impacted by any
identifiable site-specific issues Therefore it is more plausible that adjustment at GTCC-4 is reflective of
potential broader scale influences At GTCC-4 the cross-section adjusted primarily through lateral
erosion as vertical adjustment was limited by coarse bed material The cross-sectional area increased by
25 between 2003 and 2016 transitioning to a distinctly different shape with increased bed width The
enlargement of GTCC-6 and GTCC-4 may be indicative of a broader scale response of Tributary B The
GTCC-5 cross-section may also be support this but it is unclear due to the prominent influence of a local
event
There are five monitoring stations located on the Main Branch of Carruthers Creek Similar to Tributary
B two of the stations had challenges with maintenance and produced incomplete data which was not
definitive At GCC-12 the overall trend of cross-sectional adjustment could not be determined The two
monitoring periods for which cross-sectional area could be compared produced conflicting results
cross-sectional area reduced from 2003 to 2006 and increased from 2009 to 2012 At GCC-7
cross-section graphs after 2006 could not be used due to movement or loss of the right bank pin With
only one monitoring period of data (2003-2006) in which cross-sectional area was reduced no definitive
trends could be identified Both GCC-7 and GCC-12 exhibited ongoing erosion of one of their banks this
could not be attributed to a particular channel process The remainder of the stations GCC-6 GCC-4
and GCC-2 were all located in the lower half of the watershed where ongoing development has occurred
during the monitoring period There does not appear to be an observable trend in the results from the
three stations The GCC-6 cross-section was the least active out of all the monitoring stations
Cross-sectional area increased by 48 during the monitoring period but the cross-sectional shape
remained static The increase in area was the result of erosion of the vertical left bank However
beyond the cross-section the overall GCC-6 reach was active with ongoing erosion slumping and
frequent loss of erosion pins The GCC-4 cross-section was the only monitoring cross-section that
23655-522 Carruthers Creek 2017-07-10 draftdocx 34 Matrix Solutions Inc
exhibited well-documented aggradation reducing cross-sectional area by 18 This is the result of an
accumulation of coarse material which was indicated by a coarsening trend in the grain size
distribution Erosion pin data for the site was relatively consistent with most pins exhibiting average
migration of 5cmyr The GCC-2 cross-section was highly active during the monitoring period increasing
and decreasing cross-sectional area between monitoring years However when comparing the 2003 and
2016 cross-sections there was negligible change in cross-sectional area Throughout the site vertical
banks severe undercutting and bank collapses were common It is assumed that the changes in the
cross-section are a manifestation of the frequent input of fine bank material which temporarily deposits
on the bed and then is periodically flushed downstream This process is supported by the grain size
distribution data which was notably fine for the size of the channel The results of the three downstream
main branch stations did not display a common response which could be attributed to broad scale
influences such as the surrounding ongoing development
The results of the Carruthers Creek monitoring program indicate that the watercourse is an active
channel whether the cross-section is enlarging aggrading or continually adjusting while maintaining a
similar size The sites on both Tributary A and Tributary B suggest that channel dimensions are
increasing The magnitude of increase was larger for the Tributary A sites presumably because it is the
smaller of the two tributaries and is therefore more sensitive to surrounding change Comparatively
while the main branch sites exhibited active channel processes overall change was relatively minimal
There was no indication of a common adjustment response amongst the main branch sites Similar to
the tributaries this is indicative of the larger channelrsquos resilience to accommodate changes to the
surrounding area It should also be considered that the main branch stations are the only stations
located in the developing area of the watershed while most of the tributary sites are located in the
upper agricultural and rural area of the watershed The expectation would be that the ongoing
development would alter the hydrologic regime of the downstream stations and this would manifest as
changes in morphology However this is not supported by the results Channel morphology and flow
regime are intrinsically linked which allows for inferences to be made about both characteristics when
there is sufficient knowledge of one Based on this it can be inferred that the tributary stations are
enlarging as a response to changes in the flow regime However it cannot be definitively determined
without a complementary flow monitoring program
Overall the 13-year monitoring period provided a unique opportunity to document changes in channel
morphology for the purposes of understanding channel processes Fluvial geomorphology monitoring
programs are generally undertaken for 3 to 5 years following the completion of a natural channel
design shorter 1 to 3 year programs are completed for characterization studies After reviewing the
results of the Carruthers Creek monitoring it is clear that a 3 to 5 year monitoring program would not
have adequately captured the ongoing trends The results also revealed the challenges with maintaining
a long-term program such as selecting an appropriate location and establishing a sufficiently wide
cross-section
23655-522 Carruthers Creek 2017-07-10 draftdocx 35 Matrix Solutions Inc
8 REFERENCES
Galli J 1996 Rapid Stream Assessment Technique Field Methods Metropolitan Washington Council of
Governments Washington DC 36pp
Parish Geomorphic Ltd (PARISH) 2003 Valley Segments Carruthers Petticoat and Duffins Creek
Watersheds Report prepared for the Toronto and Region Conservation Authority
September 2003
Ontario Ministry of the Environment (MOE) 2003 Stormwater Management Planning and Design
Manual Queenrsquos Printer Ottawa Ontario March 2003
httpwwwontariocadocumentstormwater-management-planning-and-design-manual
Parish Geomorphic Ltd (PARISH) 2004 Regional Monitoring Program - Fluvial Geomorphology
Component Pettitcoat Creek Carruthers Creek Duffins Creek and Highland Creek Watersheds
Report prepared for the Toronto and Region Conservation Authority April 2004
Toronto and Region Conservation Authority (TRCA) 2015 Crossings Guideline for Valley and Stream
Corridors September 2015 httpwwwtrcaoncadotAsset214493pdf
Toronto and Region Conservation Authority (TRCA) 2003 A Watershed Plan for Duffins Creek and
Carruthers Creek August 2003 httpwwwtrcaoncadotAsset25961pdf
Wolman M G 1954 ldquoA method of sampling coarse river-bed materialrdquo Eos Transactions American
Geophysical Union 35 (6) 951-956
23655-522 Carruthers Creek 2017-07-10 draftdocx 36 Matrix Solutions Inc
- Phase 1 Technical Reports
- Phase 1 Technical Reports
- CCWP_FluvialGeomorphologyReport-Matrix_2017_finalpdf
-
- CCWP_Ph1-techreports-intro-2017_v9_FluvGpdf
-
- Phase 1 Technical Reports
- Phase 1 Technical Reports
-
- CCWP_Ph1-techreports-intro-2017_v9_FluvGpdf
-
- Phase 1 Technical Reports
- Phase 1 Technical Reports
-
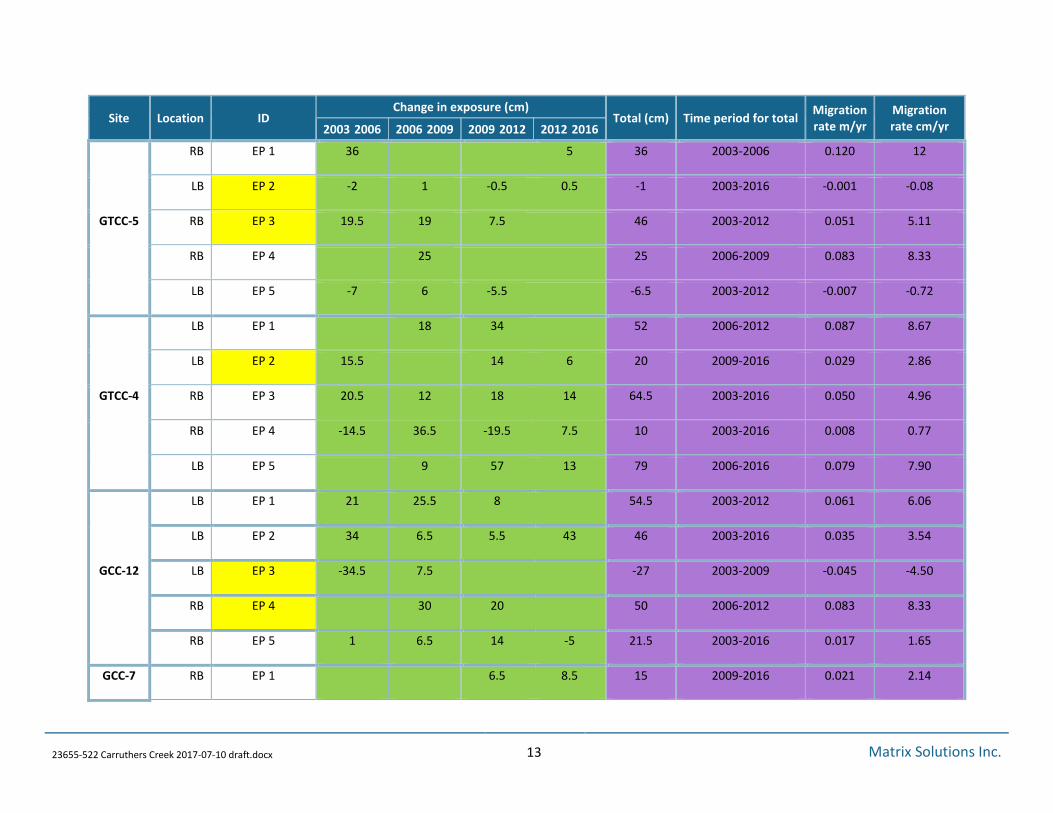
- - - -Site Location ID
Change in exposure (cm) Total (cm) Time period for total
Migration rate myr
Migration rate cmyr 2003 2006 2006 2009 2009 2012 2012 2016
RB EP 2 145 47 -235 38 2003-2012 0042 422
RB EP 3 30 305 305 2009-2012 0102 1017
LB EP 4 35 -35 -75 -115 -19 2003-2016 -0015 -146
GCC-6
LB EP 1 87 31 69 26 213 2003-2016 0164 1638
LB EP 2 5 155 05 95 305 2003-2016 0023 235
RB EP 3 48 48 2009-2012 0160 16
RB EP 4 555 38 935 2006-2012 0156 1558
RB EP 5 13 135 265 2006-2012 0044 442
GCC-4
LB EP 1 7 11 44 44 2012-2016 0110 11
RB EP 2 44 16 23 39 2009-2016 0056 557
RB EP 3 45 8 2 135 685 2003-2016 0053 527
LB EP 4 45 16 5 7 325 2003-2016 0025 25
RB EP 5 275 1 225 10 61 2003-2016 0047 469
GCC-2
LB EP 1 11 5 5 21 2003-2012 0023 233
RB EP 2 2 -05 -2 -25 -3 2003-2016 -0002 -023
RB EP 3 -10 15 8 95 2009-2016 0014 136
23655-522 Carruthers Creek 2017-07-10 draftdocx 14 Matrix Solutions Inc
- - - -Site Location ID
Change in exposure (cm) Total (cm) Time period for total
Migration rate myr
Migration rate cmyr 2003 2006 2006 2009 2009 2012 2012 2016
RB EP 4 40 21 415 1025 2006-2016 0100 1025
LB EP 5 545 135 405 1085 2003-2012 0120 1206
erosion pins highlighted with yellow are those located at the monitoring cross-section
23655-522 Carruthers Creek 2017-07-10 draftdocx 15 Matrix Solutions Inc
34 Rapid Assessment Results
A rapid assessment was completed for each valley segment in accordance with the RGA (MOE 2003)
and RSAT (Galli 1996) stream assessment protocols Rapid assessment were undertaken to investigate
any significant changes in the geomorphic stability or ecological health of each segment relative to
previously reported results (Parish 2004 TABLE 1) A summary of the 2016 RGA and RSAT results is
presented in TABLE 5 In general 2016 RGA scores were slightly lower than those previously recorded in
2004 suggesting an improvement in channel stability (highlighted in red in TABLE 5) RSAT scores
remained consistent with very little deviation from results reported in 2004 Although the results
suggest improved channel stability within the catchment the rapid assessment protocols are very
subjective and can often be misleading Long term monitoring of geomorphic parameters as those
discussed in previous subsections provides a better method of assessing trends in channel form and
function A detailed description of each valley segment and comprehensive assessment of long term
monitoring results is provided in subsequent sections
TABLE 5 Summary of 2016 Rapid Assessment Results
Valley Segments RGA Stability Index RSAT Stability Index
GTCC-11 009 In Regime 24 Moderate
GTCC-9 013 In Regime 25 Moderate
GTCC-6 016 In Regime 26 Moderate
GTCC-5 032 Transitional 30 Moderate
GTCC-4 025 Transitional 27 Moderate
GCC-12 015 In Regime 28 Moderate
GCC-7 013 In Regime 23 Moderate
GCC-6 020 Transitional 27 Moderate
GCC-4 018 In Regime 34 Moderate
GCC-2 028 Transitional 27 Moderate
23655-522 Carruthers Creek 2017-07-10 draftdocx 16 Matrix Solutions Inc
4 TRIBUTARY A
Tributary A is located at the upstream end of the watershed beginning north of Concession 7 and
confluences with the Main Branch north of Highway 7 The tributary is approximately 4 km in length and
flows through rural area where the dominant surrounding land use is agricultural The riparian corridor
for the tributary is generally 40 to 100 m wide Vegetation consisted of deciduous swamp meadow
marsh buckthorn deciduous thicket and a small area of hardwood deciduous forest downstream of
Highway 407 Two monitoring stations were located on Tributary A GTCC-11 and GTCC-9 The valley
segment containing GTCC-11 was classified as 3M small catchment and high slope The valley segment
containing GTCC-9 was classified as 2M small catchment and moderate slope
41 GTCC-11
The GTCC-11 station is located approximately 200 m upstream of Highway 7 The channel is located in
an area vegetated with shrubs tall grasses and deciduous trees This vegetated area is approximately
60m wide beyond which are agricultural fields The eastern bank is vegetated with poplar trees and red
osier dogwoods while the western bank is vegetated with tall dense grasses
FIGURE 2 Location of GTCC-11 monitoring station
In 2003 the cross-sectional area for the monitoring cross-section was 041 m2 The cross-section had a
narrow ldquoVrdquo shape typical of a small tributary At the time of survey (October) the wetted width was
030 m The bankfull width was approximately 071 m and the max depth was 036 m Over the
monitoring period the cross-section exhibited a steadily increasing cross-sectional area Between 2003
23655-522 Carruthers Creek 2017-07-10 draftdocx 17 Matrix Solutions Inc
and 2016 the cross-sectional area increased by 010 m2 or approximately 48 The cross-section overlay
indicates that this change corresponds to a deepening and widening of the thalweg transitioning the
cross-section from a ldquoVrdquo to a ldquoUrdquo shape The 2006 and 2009 cross-sections show the cross-section
deepening to a maximum depth of 043 m in 2009 The 2012 and 2016 cross-sections then show
widening of the bed through ongoing toe erosion while the maximum depth returns to a consistent
040 m Comparing the 2016 cross-section to the other years also suggests deepening of the floodplain
area This could be a result of higher flows more frequently spilling onto the floodplain and establishing
a larger bankfull cross-section Shifts in floodplain topography can also be tied to growth and die-off of
dense tall grass vegetation These changes in cross-sectional shape are a manifestation of typical
channel processes in a small headwater channel
The erosion pins generally exhibited increased exposure between monitoring periods The maximum
increase in exposure was 245 cm for EP4 between 2009 and 2012 During this monitoring period there
was also a large change in exposure (18 cm) for the erosion pin at the monitoring cross-section (EP3)
Based on these exposures the erosion rates would be approximately 8 cmyr and 6 cmyr respectively
The erosion rates based on the full monitoring period (13 years) ranged from 031 cmyr to 319 cmyr
The average erosion rate is 163 cmyr
The substrate at GTCC-11 is composed of fine grained materials including sand silt and small pebbles
Over the monitoring period this was consistent with no noticeable coarsening
42 GTCC-9
The GTCC-9 station is located approximately 700 m downstream of GTCC-11 It is approximately 2 km
from the confluence with the main channel At GTCC-11 the channel is located on the floor of a valley
which is approximately 20 to 40 m wide The channel meanders across the valley floor periodically
contacting the valley walls The valley floor is vegetated with meadow grasses and woody shrubs such as
buckthorn and red osier dogwoods The slopes are populated by deciduous trees Beyond the top of the
valley are agricultural fields At the monitoring cross-section the right bank (western) is vegetated with
tall grasses and the left bank (eastern) is covered by a large red osier dogwood The monitoring photos
indicate that the cross-section was originally installed immediately downstream of the dogwood
Overtime the dogwood has grown sufficiently large that it encompasses the area where the left bank pin
is located This made it difficult to properly level the measuring tape along the left bank due to the
dense woody vegetation that must be pushed down to allow the tape to lie flat
23655-522 Carruthers Creek 2017-07-10 draftdocx 18 Matrix Solutions Inc
FIGURE 3 Location of GTCC-9 monitoring station
In 2003 the cross-sectional area for the monitoring cross-section was 083 m2 The cross-section had a
notched low-flow channel in the center with a bottom width of approximately 050 m The 2006
cross-section was distinctly different from all other monitoring years and appears to have captured a
transitional period The cross-section bottom width increased to approximately 077 m and no longer
exhibited a defined low-flow area Between 2003 and 2006 cross-sectional area increased by 016 m2
the largest change during the 13-year period Due to the transitional shape it was difficult to define
bankfull for the 2006 cross-section The cross-sections for 2009 2012 and 2016 all indicate that the
channel is migrating towards the right bank This is evidenced by the increasing elevation of the left
bank profile and the consistent retreat of the right bank The cross-section is also deepening along the
right side Over the 13-year monitoring period the bed has deepened by approximately 010m based on
comparison of the max depth values from 2016 and 2003 The overall cross-sectional area has increased
by 030 m2 or 35
Two erosion pins are located at the monitoring cross-section one in each bank Both pins exhibited an
increase in exposure between 2003 and 2006 when the cross-section shape widened From 2006 to
2012 the right bank pin (EP4) exhibited continued increases in exposure while the left bank pin (EP3)
exhibited small reductions in exposure This is consistent with the migration of the channel towards the
right bank Based on the EP4 data the average erosion rate for the right bank at the monitoring
cross-section is 383 cmyr During the monitoring period the largest changes in exposure were noted at
EP1 and EP5 This was a result of their locations both were located on the outer bank of a bend The
average migration rates based on the EP1 and EP5 data are 928 cmyr and 633 cmyr
23655-522 Carruthers Creek 2017-07-10 draftdocx 19 Matrix Solutions Inc
5
The substrate at GTCC-9 is composed of fine grained material and medium sized gravel The substrate
was relatively consistent over the monitoring period with 2006 and 2009 considered coarser than other
years based on the D50 These years may have been coarser because the cross-section was actively
enlarging and more of the fine material had been removed Additionally the 2009 cross-section was
measured in April when high flows are more frequent due to spring melt This leads to seasonally
coarse distributions as fine material is flushed away more regularly
TRIBUTARY B
Tributary B begins northeast of Tributary A south of Concession 8 It is the larger of the two tributaries
approximately 94 km in length more than double the length of Tributary A North of Highway 7 the
channel flows through rural agricultural land with a riparian corridor ranging from approximately 10m
wide in the headwaters to approximately 80 m wide south of Highway 407 South of Highway 7
the channel flows through a small residential development where a channel design has been
implemented The channel then flows through a dense woodlot area before continuing through Deer
Creek Golf Course The confluence with the Main Branch is located near the south end of the golf
course There are three monitoring stations located on Tributary B all of which are located downstream
of Highway 7 The valley segment containing GTCC-6 is classified as 1H small catchment and low slope
The valley segment containing GTCC-5 is classified as 3H small catchment and high slope The valley
segment containing GTCC-4 is classified as 2H small catchment and moderate slope
51 GTCC-6
The GTCC-6 station is the most upstream station located approximately 325 m downstream of Highway
7 near the crossing of Concession 4 On the south side of the channel is a small deciduous woodlot with
meadow grasses The north side is vegetated with tall dense meadow grasses and shrubs The
monitoring cross-section is located in a highly active area of the channel where ongoing erosion of the
right bank is occurring As a result of this there were challenges maintaining the cross-section bank pins
The 2003 cross-section was not considered as part of the results because the cross-section was
reinstalled in 2006 after the right bank pin was completely lost The 2006 cross-section is 23 m wider
than the original 2003 cross-section There also appeared to be an issue with the 2006 cross-section
when compared to subsequent cross-sections This is likely related to the movement of the right pin
from 60 m (2006) to 685 m (2009) Therefore only the 2009 2012 and 2016 cross-sections were
evaluated Based on the different months in which the monitoring was completed (October December
April) the channel is regularly dry during low flow periods such as summer and early fall However based
on the monitoring results it produces sufficient flow during wetter periods such as spring and rainfall
events to result in toe erosion and undercutting
23655-522 Carruthers Creek 2017-07-10 draftdocx 20 Matrix Solutions Inc
FIGURE 4 Location of GTCC-6 monitoring station
The three cross-sections indicate that the cross-section has deepened and also migrated further into the
right bank This is expected given the erosion and severe undercutting of the right bank seen in the
monitoring photos Minimal change to the left bank profile has occurred Between 2009 and 2012 the
cross-section deepened with the maximum depth increasing from 100 m to 113 m The 2016
cross-section exhibits aggradation along the left bank toe and erosion of the right bank toe There were
increases in cross-sectional area both in 2012 and 2016 indicating that the channel is not just migrating
towards the right bank but also enlarging The cross-sectional area in 2009 was 335 m2 and increased to
405 m2 in 2012 and then 423 m2 in 2016 Over the 7-year period this was an increase of 088 m2 or
262
Two erosion pins are located at the monitoring cross-section one in each bank The right bank pin (EP4)
exhibited large increases in exposure every monitoring period Based on the data from EP4 the
migration rate of the right bank is approximately 133 cmyr The left bank pin (EP5) exhibited changes
in exposure ranging from -8cm to 305 cm This would suggest that there is erosion followed by periodic
slumping of material along that bank The other erosion pins indicated that toe erosion is widespread
throughout the reach For example EP2 and EP3 were located in a bend that was actively eroding both
pins were found eroding out of the bank and lying on the bed at two of the monitoring visits This type
of severe toe erosion and undercutting often occurs in channels with grass dominated vegetation
The substrate at GTCC-6 is composed of fine grained materials including sand silt and small pebbles
Over the monitoring period this was consistent with no noticeable coarsening
23655-522 Carruthers Creek 2017-07-10 draftdocx 21 Matrix Solutions Inc
52 GTCC-5
The GTCC-5 station is located in a large woodlot upstream of the Deer Creek Golf Course Through this
area the channel is quite sinuous with tight bends and steep eroding banks Woody debris such as
branches and downed trees was common resulting in jams The banks in this reach were higher than
those upstream ranging from 050 to 125 m This is indicative of incision The monitoring cross-section
is located on the downstream straight section of an ldquoSrdquo bend There is substantial erosion along the
outer bank upstream of the cross-section the bend has over widened and a formed a large pool A large
willow tree fell across the channel at the monitoring cross-section between 2009 and 2012 due to this
the measuring tape would not lie flat in 2012 and 2016 The impact on the cross-section graph could not
be quantified it is assumed that the cross-section shape is representative of field conditions Specific
depth measurements for 2012 and 2016 are likely to be slightly higher than in the field due to the tree
pushing the tape higher in the center of the cross-section The two cross-sections correlate well with
each other signifying that the tree had a consistent impact on measuring tape and cross-section
measurement
FIGURE 5 Location of GTCC-5 monitoring station
The monitoring cross-section at GTCC-5 experienced the most significant change out of all the
monitoring stations The channel has substantially incised at this location as the result of a debris jam
failure Debris jams establish a sharp change in elevation on the channel profile When a debris jam fails
the channel will incise to remove the difference in elevation and re-establish a consistently sloped
profile This process was well documented at the GTCC-5 cross-section Based on the cross-section
overlay and corroboration by the monitoring photos the channel began to incise between 2006 and
23655-522 Carruthers Creek 2017-07-10 draftdocx 22 Matrix Solutions Inc
2009 The cross-section was stable between 2003 and 2006 with some accumulation of material
resulting in a small reduction in area The material likely accumulated as a result of the small debris jam
located immediately downstream of the cross-section (2003 photo) creating a backwater Between 2006
and 2009 the debris jam destabilized as seen in the 2009 photo The 2009 cross-section deepened and
widened along the right bank cross-sectional area increased by 053 m2 or 213 The max depth
increased by 029 m between 2006 and 2009 Between 2009 and 2012 the large willow tree located on
the left bank fell across the cross-section It can be seen in the 2009 photo on the left bank The downed
tree is an additional disturbance altering flow at the cross-section The change in cross-sectional area
between 2009 and 2012 was the most significant during the monitoring period enlarging by 127 m2 or
424 Max depth increased by 036 m this value could be inflated due to the measuring tape issue as a
result of the downed tree Between 2012 and 2016 the cross-section continued to enlarge primarily
through severe undercutting and subsequent retreat of the right bank The bed appears to have
stabilized as there was minimal change in the actual bed elevation A mid-channel bar has also formed
which supports this notion
In total the cross-section has incised approximately 062 m based on the difference in maximum depth
between the 2003 and 2016 cross-sections Over the 13-year monitoring period the cross-sectional area
has increased by 254 m2 or 98 The cross-section enlarged through incision and retreat of the right
bank while the left bank profile remained stable
There are two erosion pins located at the monitoring cross-section EP2 (left bank) and EP3 (right bank)
The data for these two pins is consistent with the cross-section results EP2 exhibited minimal change in
exposure during the monitoring period while EP3 exhibited large changes each monitoring year Based
on the data from EP3 the migration rate for the right bank is approximately 5cmyr The other three
erosion pins were frequently lost during the monitoring which suggests that they were fully eroded out
of the banks due to the severity of erosion For example EP4 was only re-measured once during the
monitoring period in 2009 and had a change in exposure of 25 cm
The substrate at GTCC-5 was dominated by finer material consisting of coarse sand pebbles and silt
from 2003 to 2009 Medium and coarse gravel represented the coarser fraction The distribution
coarsened in 2012 and 2016 this is typical of an incising channel When the debris jam no longer
created a backwater fine sediment would have been flushed out leaving coarser material behind As the
channel incised further additional fine material would have been removed The coarsening of the bed is
also an indication that incision is slowing as the accumulation of coarse material acts to reduce bed
erosion
53 GTCC-4
The GTCC-4 station is located on the Deer Creek Golf Course in a small cedar woodlot downstream of a
cart path bridge The woodlot provides a small buffer from the adjacent manicured golf course The
monitoring cross-section is located between in a straight section between two successive bends or an
23655-522 Carruthers Creek 2017-07-10 draftdocx 23 Matrix Solutions Inc
ldquoSrdquo bend In the upstream bend there was severe woody debris obstruction Upstream of the bend the
channel flows adjacent to a valley wall along the right bank The bend downstream of the cross-section
has severe erosion of the outer bank The bank is steep and elevated with minimal vegetative buffer
from the golf course approximately less than 5m
FIGURE 6 Location of GTCC-4 monitoring station
In 2003 the cross-sectional area for the monitoring cross-section was 164 m2 The maximum depth was
081 m The cross-section had a narrow low-flow area with a bottom width of approximately 060 m
Between 2003 and 2009 the cross-sectional area steadily increased primarily through erosion of the
vertical left bank widening the bottom width of the channel The 2009 cross-section appears to be
capturing a transition between the 20032006 cross-sections and the 20122016 cross-sections In 2009
the cross-section incised to a maximum depth 087 m This is the deepest measured cross-section during
the monitoring period The 2012 cross-section then exhibits a large loss of material from the lower
portion of the right bank where very little change was noted in the previous cross-sections Itrsquos unclear
from the monitoring photos what may have caused this The left bank also exhibited a noticeable retreat
between 2009 and 2012 The change in cross-sectional area between these 2009 and 2012 was 015 m2
or approximately 8 The 2012 and 2016 cross-sections have a wider bottom width of approximately
14 m as compared to approximately 060 m in 2003 Visually comparing the cross-sections the
20032006 cross-sections have a narrow defined low-flow area while the 20122016 cross-sections
have a larger general ldquoUrdquo shape This change in cross-sectional shape is reflected by a 25 increase in
cross-sectional area over the 13-year monitoring period
23655-522 Carruthers Creek 2017-07-10 draftdocx 24 Matrix Solutions Inc
6
One erosion pin is located at the monitoring cross-section in the left bank EP2 The pin exhibited
increases in exposure ranging from 6 to 155 cm Based on this data the average erosion rate for the left
bank was approximately 286 cmyr Erosion pin 4 exhibited variable results ranging from large increases
in exposure (365) to large decreases in exposure (-195) This is indicative of an area which is eroding
destabilizing and collapsing Erosion pin 1 was located in the outer bank of the eroding bend
downstream of the cross-section It was found eroded out of the bank in 2016 and exhibited large
increases in exposure in 2012 and 2009 Based on EP1 the average erosion rate in this bend is
approximately 86 cmyr Overall based on all the erosion pin data for GTCC-4 the average erosion rate
was 503 cmyr
The channel substrate primarily consisted of medium to coarse gravels The material appears to be
relatively large for the size of the channel which reduces vertical erosion As a result the primary mode
of cross-sectional adjustment was lateral erosion The substrate distribution was consistent over the
13-year monitoring period and exhibited no distinct shifts
CARRUTHERS CREEK MAIN BRANCH
The Main Branch of Carruthers Creek originates to the west of Tributary A north of Concession 7 and
east of Westney Road The Main Branch is approximately 27 km long and flows into Lake Ontario The
surrounding land use north of Taunton Road is primarily rural and agricultural South of Taunton Road
the channel corridor is generally contained within residential development particularly between
Taunton Road and Rossland Road Sinuosity also begins to increase noticeably south of Taunton Road
becoming highly sinuous south of Rossland Road This increase in sinuosity corresponds to the reduced
gradient progressing towards the Lake There are five monitoring stations located on the Main Branch
One is located in the headwater area GCC-12 while the other four are located south of Highway 7
There is a large area gap of approximately 9kms between GCC-12 and the next station (GCC-7) The
furthest downstream station is GCC-2 located on the south side of Kingston Road There are no stations
located below Highway 401
61 GCC-12
The GCC-12 station is the most upstream station on the Main Branch of Carruthers Creek It is located
approximately 100 m downstream of Concession 7 The channel flows adjacent to a rural residential
property with agricultural fields surrounding the riparian corridor The riparian corridor is relatively wide
at the monitoring station approximately 80 to 100 m The surrounding vegetation is predominantly tall
meadow grasses and small willow woodlots At the monitoring cross-section both banks are vegetated
with meadow grasses
23655-522 Carruthers Creek 2017-07-10 draftdocx 25 Matrix Solutions Inc
FIGURE 7 Location of GCC-12 monitoring station
There were challenges maintaining the monitoring cross-section at GCC-12 due to ongoing erosion of
the right bank Neither of the cross-section bank pins could be located in 2016 The cross-section was
reinstalled based on an erosion pin that corresponded to the cross-section Therefore the 2016
cross-section should not be compared with other monitoring years It was also noted during the 2016
measurement that the right bank was noticeably higher than the left bank making it difficult to level the
tape Assuming the cross-section was reinstalled at the correct location this difference in bank height
could have impacted previous cross-section measurements Notes from the 2009 cross-section
measurement also indicated that the tape was not level This may have been a result of moving the right
pin back which occurred in 2009 The pin was moved from 43 m to 51 m presumably to prevent loss
due to erosion The movement of the right bank pin in 2009 made comparisons to the earlier years
2003 and 2006 difficult
In general the cross-section is migrating towards the right bank and steadily eroding it It also appears
that the cross-section has deepened based on the overlays and the photo documentation
Two erosion pins are located at the monitoring cross-section EP3 (left bank) and EP4 (right bank)
The erosion pins provide particularly useful data when there are issues maintaining a cross-section The
right bank erosion pin results indicated ongoing retreat of the right bank Twice EP4 was lost or eroded
out of the bank (2006 and 2016) The change in exposure between 2006 and 2009 for EP4 was 30 cm
Between 2009 and 2012 the change in exposure was 20 cm The average migration rate at EP4 was
833 cmyr based on this data The left bank pin at the cross-section EP3 could not be located twice
during the monitoring period in 2012 and 2016 Two of the erosion pins were located in an actively
23655-522 Carruthers Creek 2017-07-10 draftdocx 26 Matrix Solutions Inc
eroding bend downstream of the monitoring cross-section EP1 and EP2 Both EP1 and EP2 exhibited
large increases in exposure between 2003 and 2006 21 cm and 34 cm respectively
The channel substrate at GCC-12 is primarily composed of medium to coarse gravels There appears to
be a coarsening of the distribution in 2012 and 2016 This is indicated by the higher D50 values as well as
D16 values that are comparable to the D50 values from previous monitoring years The coarsening may be
a result of deepening of the cross-section When this occurs finer material is removed while coarser
material which is too large for the channel to transport remains on the bed
62 GCC-7
The GCC-7 monitoring station is located at the south end of the Deer Creek Golf Course Specifically it is
located in a 50m reach of channel between a cart path crossing and a golf course road (Squire Drive)
The channel is surrounded by golf course fairway and has a minimal riparian buffer of less than 5m The
close proximity to golf course operations led to challenges in maintaining the cross-section The 2009
cross-section needed to be reinstalled after the right bank pin was found lying on the bank The pin was
reinstalled 15 m wider than the original cross-section The right bank pin had to be reinstalled again in
2012 due to the removal by golf course maintenance staff A cross-section was not completed in 2016
because neither of the bank pins could be located due to previous issues it was not reinstalled Based
on these issues only the 2003 and 2006 cross-sections could be compared
FIGURE 8 Location of GCC-7 monitoring station
23655-522 Carruthers Creek 2017-07-10 draftdocx 27 Matrix Solutions Inc
Between 2003 and 2006 the cross-section exhibited evidence of erosion along the right side of the
cross-section and right bank face This was paired with a accumulation of material on the left side of the
cross-section The cross-sectional area was reduced from 175 m2 to 15 m2 approximately -14
Based on these two years the channel was migrating towards the right bank Without subsequent years
of data it is unclear if this process continues and if there is a general trend of reduction in cross-sectional
area
The two erosion pins located at the cross-section provide additional insight EP3 was located in the right
bank and EP4 was located in the left bank The data from EP3 indicated that the right bank was
continually eroding through the 13-year monitoring period The pin could not be located in two of the
monitoring years (2009 and 2016) presumably due to severe erosion For both of the monitoring years
that it was measured the exposure increased by 30 cm This suggests an erosion rate of 10 cmyr for the
right bank based on the EP3 data Data from EP4 exhibited decreases in exposure for each monitoring
year between 2006 and 2016 The results ranged from -35 to -115 cm Observations of the left bank in
2016 noted that the bank is slumping The slumping and erosion is likely related to the lack of riparian
buffer to provide additional support to the banks
The channel substrate at GCC-7 is primarily composed of medium to coarse gravel with the largest
material classified as cobbles The grain size distribution was consistent over the 13-year monitoring
period with no observable trends The coarse nature of the material is expected due to the location on
the golf course and the high potential for modification and erosion protection
63 GCC-6
The GCC-6 monitoring station is located immediately south of Taunton Road in a riparian corridor
between two residential areas The residential area to the east was completed between 2005 and 2008
while the area to the west was completed shortly after Stormwater management ponds are located on
either side of the channel corridor as well as a paved trail to the east This is the first of three stations
located in the southern developed portion of the watershed The channel is situated within a woodland
area approximately 125 m wide Vegetation consisted of deciduous trees woody shrubs and tall
grasses The channel is quite sinuous with tight eroding bends Eroding and undercutting banks were
common throughout the reach resulting in frequent slumped vegetated blocks The monitoring
cross-section is located in a straight section of a large bend The left bank at the monitoring
cross-section corresponds with the outer bank of the bend and is vertical while there is a vegetated
point bar located along the right side of the cross-section The wetted width is narrowed by the point
bar and flow is focused along the toe of the left bank This encourages erosion and undercutting
23655-522 Carruthers Creek 2017-07-10 draftdocx 28 Matrix Solutions Inc
FIGURE 9 Location of GCC-6 monitoring station
Out of all the monitoring sites the cross-section at GCC-6 was the most consistent exhibiting minimal
change over the 13-year monitoring period The cross-sectional area in 2003 was 542 m2 with a
maximum depth of 137 m Maximum depth was extremely consistent at 134 m in both 2006 and 2009
and 133 m in 2012 This indicates that the channel bed has not changed The only change in the
cross-section was retreat of the left bank The most significant change during the monitoring period was
noted between 2006 and 2009 cross-sectional area increased from 520 m2 to 554 m2 approximately
66 Over the entire monitoring period the cross-sectional area increased by only 48 The
cross-section can be considered stable
While location of the monitoring cross-section was stable the surrounding reach exhibited frequent
undercutting of banks and slumping of material The erosion pin data indicated that pins were
frequently lost during the monitoring period When erosion pins cannot be located it is assumed that
they have been eroded out of the banks It also occurs when sufficient undercutting has occurred for the
bank to collapse on top of the erosion pin burying it This is likely what has occurred in GCC-6 Erosion
pin 3 was located in an outside bank downstream of a slumped bank area It could not be located in
2006 2009 or 2016 The only year it was located 2012 the exposure increased by 48 cm indicating an
erosion rate of 16 cmyr Erosion pin 1 was located every monitoring year and exhibited dramatic
increases in exposure ranging from 26 to 87 cm Three of the five erosion pins had an average erosion
rate of 16 cmyr Therefore while the cross-section itself was stable the surrounding reach is active
23655-522 Carruthers Creek 2017-07-10 draftdocx 29 Matrix Solutions Inc
The substrate at GCC-6 is primarily composed of medium gravels The grain size was consistent with
minimal variability during the 13-year monitoring period This is expected because the cross-section
graph indicated that the bed of the channel was largely unchanged
64 GCC-4
The GCC-4 monitoring station is located south of a railway crossing in a forested valley Channel
sinuosity is reduced through the reach by the confining effects of the surrounding valley Surrounding
land use is residential development which is located on either side of the valley The residential
development on the east side began around 2005 and was completed around 2014 On the west side
development began around 2012 and was completed around 2015 The forested valley consists of a
variety of both coniferous and deciduous species Leaning and fallen trees were common particularly
along the right bank which coincided with the valley wall
Figure 10 Location of GCC-4 monitoring station
The monitoring cross-section is located in a straight section which flows along the western toe of the
valley The cross-section is wide compared with other monitoring stations located in grass-lined areas
Toe erosion was noted along both banks The cross-sectional area in 2003 was 781 m2 with a maximum
depth of 138 m Over the monitoring period the cross-sectional area steadily reduced to 641 m2 in
2016 and a maximum depth of 113 m The cross-section overlay indicates that the reduction was
primarily through accumulation of bed material There was erosion of the right bank which is expected
because the channel abuts the valley wall along this side The reduction in cross-sectional area was
approximately 18 Generally a reduction in cross-sectional area is related to accumulation of fine
23655-522 Carruthers Creek 2017-07-10 draftdocx 30 Matrix Solutions Inc
material as a result of reduced velocity Reviewing the monitoring photos suggests that the reduction is
a result of accumulation of coarse material across the riffle that the cross-section is located at
There are two erosion pins located at the cross-section EP3 in the right bank and EP4 in the left bank
The data at EP3 indicated that the most substantial increase in exposure was between 2003 and 2006
45 cm Increases in exposure for the subsequent years were much less substantial The left bank erosion
pin EP4 exhibited small increases in exposure ranging from 45 to 16 cm This was relatively consistent
with the other erosion pins Generally the erosion pins exhibited increases in exposure which were
variable but provided similar erosion rates over the 13-year period Three of the five pins provided
average erosion rates of approximately 5cmyr
The substrate at GCC-4 was coarse and consisted primarily of coarse gravel and cobbles The monitoring
data indicated a general coarsening trend The median grain size increased from medium and coarse
gravel to very coarse gravel and small cobbles This indicates that the accumulation of material is
primarily through coarser material armouring the riffle and further reducing transport at the feature
65 GCC-2
The GCC-2 monitoring station is located immediately south of Kingston Road it is the furthest
downstream station The channel flows through a meadow dominated area with some small deciduous
woodlots To the west is a residential development a stormwater management pond and a paved trail
The development was built over the course of the monitoring period completed between 2009 and
2012 To the east is an agricultural field The channel is quite sinuous through this reach The reach was
characterized by tall steep undercutting banks Bank height was frequently 1m with material scoured
out from beneath the upper vegetative root layer Deep scour pools and accumulation of fine material
was also noted The reach can be considered fairly active based on these indicators
23655-522 Carruthers Creek 2017-07-10 draftdocx 31 Matrix Solutions Inc
Figure 11 Location of GCC-2 monitoring station
The monitoring cross-section is located in a short straight section of channel between two bends The
cross-section was highly active during the monitoring period both increasing and decreasing
cross-sectional area The cross-section shape has shifted and changed but when cross-sectional areas
from 2003 and 2016 are compared there is negligable difference The 2003 cross-sectional area was
327 m2 while the 2016 area was 333 m2 Between 2003 and 2006 the cross-sectional area reduced
through bed accumulation reducing maximum depth from 105 to 083m Between 2006 and 2009 the
cross-sectional area increased primarily through erosion of a high point along the right bank and erosion
of both bank toes There was some bed erosion during this time period as well increasing the maximum
depth by 004 m However lateral erosion was the dominant process The 2006 to 2009 period exhibited
the most significant change during the monitoring period cross-sectional area by increased 054 m2 or
19 The cross-section continued to increase through 2012 to 362 m2 with a maximum depth of
095 m This increase was a result of retreat of the right bank erosion along the left bank toe and
deepening of the bed Near the left bank toe there was a narrow notched area where the channel has
cut down This is likely where the thalweg and the strongest forces from the flow are focused In 2016
the cross-sectional area was reduced by 7 to 333 m2 This was primarily due to the accumulation of
sediment above bankfull along the right bank and along the right bank toe It is also worth noting that
during the 2016 assessment the right bank pin was buried under approximately 16 cm of fine material
This could suggest that the higher flows are regularly depositing fine material from bank erosion above
bankfull The bed of the 2016 cross-section exhibits a wider thalweg area than was document in 2012
The area is not as deep (092 m) but it is wider and more defined This could suggest that the channel is
slowly and systematically eroding downward
23655-522 Carruthers Creek 2017-07-10 draftdocx 32 Matrix Solutions Inc
7
Based on the variable changes in the cross-section it can not be definitively said whether it is increasing
or decreasing in size It is clear that the channel is highly active mobilizing sediment from both the bed
and banks in this reach The sediment then periodically accumulates within the channel or overbank
areas due to the excess amount
No erosion pins were located at the monitoring cross-section for GCC-2 Erosion pins 4 and 5 were
located approximately 40m upstream of the cross-section Erosion pin 4 was located at the downstream
end of an overwidened eroding bend with a large scour pool Erosion pin 5 was also located at the
downstream end of an area of severe erosion and undercutting Both EP4 and EP5 exhibited large
increases in exposure and were lost at once Based on the data at these two pins the average erosion
rate was 10 cmyr and 12 cmyr respectively The other three erosion pins were in areas of less active
erosion EP2 exhibited small amount of accumulation during most monitoring periods
The substrate at GCC-2 was predominantly fine material including silt sand and pebbles
This distribution is particularly small given the size of the channel and is likely a reflection of the ongoing
bank erosion The median grain size typically consistents of pebbles
DISCUSSION
The results from the 13-year monitoring period provide insight on channel processes at a variety of
scales Most reliably the data describes the processes occurring at various discrete sites throughout the
watershed Each station is a reflection of the specific governing factors at that location which include
surrounding vegetation land use geology and flow regime Reviewing the stations together based on
their general location within the watershed may reveal broader characteristics of the watercourse The
results of the monitoring program also provide insight into the effectiveness of a long-term program as
very few fluvial geomorphic programs are maintained for such an extensive period This warrants
additional discussion beyond results specific to the Carruthers Creek watershed
Both of the stations on Tributary A have relatively small cross-sectional areas which have enlarged over
the 13-year monitoring period (48 and 35) Due to the small size of the cross-sections small changes
in area result in a large percentage change The evolution of the two cross-sections is markedly
different While GTCC-11 exhibited a gradual consistent transition from a ldquoVrdquo to a ldquoUrdquo shaped
cross-section GTCC-9 appears to have experienced a more complex and abrupt transition The GTCC-9
cross-section exhibited a large change in cross-sectional area between 2003 and 2006 shifting to a
cross-sectional shape that differs from all other years After 2006 the cross-section re-established itself
as a distinctly different shape which consistently migrated towards the right bank and deepened for the
remainder of the monitoring period These results suggest that the 2006 monitoring captured the
cross-section after a specific event a brief instance which is not necessarily representative of the
ongoing long-term process The difference in adjustment between the two sites highlights the
importance of local site-specific characteristics While both cross-sections are enlarging potentially in
response to the same governing factor they do so differently The consistent adjustment at GTCC-11 is
23655-522 Carruthers Creek 2017-07-10 draftdocx 33 Matrix Solutions Inc
reflective of equal resistance of vegetation and bank materials At GTCC-9 the difference in bank
vegetation dense woody dogwood versus dense herbaceous grasses has biased the cross-sectional
adjustment to the right half of the cross-section where less force is required to erode the material
Tributary B is the larger of the two tributaries and has three monitoring stations For Tributary B
interpreting the cross-section adjustment with respect to potential systemic adjustment was
complicated by additional factors for two of the three stations GTCC-6 and GTCC-5 The GTCC-5
cross-section enlarged dramatically (98) doubling in size through incision as a result of a debris jam
failure This adjustment in the response to the local event masks potential channel adjustment which
could be attributed to broader systemic change At GTCC-6 the data was incomplete due to issues with
maintaining the cross-section as a result of severe erosion of the right bank Only the last three
monitoring years (2009 2012 and 2016) were comparable During this period the cross-sectional area
increased by 26 through retreat of the right bank and incision The results definitively indicate that
from 2009-2016 the cross-section is continually enlarging Based on the issues with the right bank pin in
2003 and 2006 it can be inferred that these cross-sections would have exhibited the same trend if the
bank pin had been maintained The third station GTCC-4 did not appear to be impacted by any
identifiable site-specific issues Therefore it is more plausible that adjustment at GTCC-4 is reflective of
potential broader scale influences At GTCC-4 the cross-section adjusted primarily through lateral
erosion as vertical adjustment was limited by coarse bed material The cross-sectional area increased by
25 between 2003 and 2016 transitioning to a distinctly different shape with increased bed width The
enlargement of GTCC-6 and GTCC-4 may be indicative of a broader scale response of Tributary B The
GTCC-5 cross-section may also be support this but it is unclear due to the prominent influence of a local
event
There are five monitoring stations located on the Main Branch of Carruthers Creek Similar to Tributary
B two of the stations had challenges with maintenance and produced incomplete data which was not
definitive At GCC-12 the overall trend of cross-sectional adjustment could not be determined The two
monitoring periods for which cross-sectional area could be compared produced conflicting results
cross-sectional area reduced from 2003 to 2006 and increased from 2009 to 2012 At GCC-7
cross-section graphs after 2006 could not be used due to movement or loss of the right bank pin With
only one monitoring period of data (2003-2006) in which cross-sectional area was reduced no definitive
trends could be identified Both GCC-7 and GCC-12 exhibited ongoing erosion of one of their banks this
could not be attributed to a particular channel process The remainder of the stations GCC-6 GCC-4
and GCC-2 were all located in the lower half of the watershed where ongoing development has occurred
during the monitoring period There does not appear to be an observable trend in the results from the
three stations The GCC-6 cross-section was the least active out of all the monitoring stations
Cross-sectional area increased by 48 during the monitoring period but the cross-sectional shape
remained static The increase in area was the result of erosion of the vertical left bank However
beyond the cross-section the overall GCC-6 reach was active with ongoing erosion slumping and
frequent loss of erosion pins The GCC-4 cross-section was the only monitoring cross-section that
23655-522 Carruthers Creek 2017-07-10 draftdocx 34 Matrix Solutions Inc
exhibited well-documented aggradation reducing cross-sectional area by 18 This is the result of an
accumulation of coarse material which was indicated by a coarsening trend in the grain size
distribution Erosion pin data for the site was relatively consistent with most pins exhibiting average
migration of 5cmyr The GCC-2 cross-section was highly active during the monitoring period increasing
and decreasing cross-sectional area between monitoring years However when comparing the 2003 and
2016 cross-sections there was negligible change in cross-sectional area Throughout the site vertical
banks severe undercutting and bank collapses were common It is assumed that the changes in the
cross-section are a manifestation of the frequent input of fine bank material which temporarily deposits
on the bed and then is periodically flushed downstream This process is supported by the grain size
distribution data which was notably fine for the size of the channel The results of the three downstream
main branch stations did not display a common response which could be attributed to broad scale
influences such as the surrounding ongoing development
The results of the Carruthers Creek monitoring program indicate that the watercourse is an active
channel whether the cross-section is enlarging aggrading or continually adjusting while maintaining a
similar size The sites on both Tributary A and Tributary B suggest that channel dimensions are
increasing The magnitude of increase was larger for the Tributary A sites presumably because it is the
smaller of the two tributaries and is therefore more sensitive to surrounding change Comparatively
while the main branch sites exhibited active channel processes overall change was relatively minimal
There was no indication of a common adjustment response amongst the main branch sites Similar to
the tributaries this is indicative of the larger channelrsquos resilience to accommodate changes to the
surrounding area It should also be considered that the main branch stations are the only stations
located in the developing area of the watershed while most of the tributary sites are located in the
upper agricultural and rural area of the watershed The expectation would be that the ongoing
development would alter the hydrologic regime of the downstream stations and this would manifest as
changes in morphology However this is not supported by the results Channel morphology and flow
regime are intrinsically linked which allows for inferences to be made about both characteristics when
there is sufficient knowledge of one Based on this it can be inferred that the tributary stations are
enlarging as a response to changes in the flow regime However it cannot be definitively determined
without a complementary flow monitoring program
Overall the 13-year monitoring period provided a unique opportunity to document changes in channel
morphology for the purposes of understanding channel processes Fluvial geomorphology monitoring
programs are generally undertaken for 3 to 5 years following the completion of a natural channel
design shorter 1 to 3 year programs are completed for characterization studies After reviewing the
results of the Carruthers Creek monitoring it is clear that a 3 to 5 year monitoring program would not
have adequately captured the ongoing trends The results also revealed the challenges with maintaining
a long-term program such as selecting an appropriate location and establishing a sufficiently wide
cross-section
23655-522 Carruthers Creek 2017-07-10 draftdocx 35 Matrix Solutions Inc
8 REFERENCES
Galli J 1996 Rapid Stream Assessment Technique Field Methods Metropolitan Washington Council of
Governments Washington DC 36pp
Parish Geomorphic Ltd (PARISH) 2003 Valley Segments Carruthers Petticoat and Duffins Creek
Watersheds Report prepared for the Toronto and Region Conservation Authority
September 2003
Ontario Ministry of the Environment (MOE) 2003 Stormwater Management Planning and Design
Manual Queenrsquos Printer Ottawa Ontario March 2003
httpwwwontariocadocumentstormwater-management-planning-and-design-manual
Parish Geomorphic Ltd (PARISH) 2004 Regional Monitoring Program - Fluvial Geomorphology
Component Pettitcoat Creek Carruthers Creek Duffins Creek and Highland Creek Watersheds
Report prepared for the Toronto and Region Conservation Authority April 2004
Toronto and Region Conservation Authority (TRCA) 2015 Crossings Guideline for Valley and Stream
Corridors September 2015 httpwwwtrcaoncadotAsset214493pdf
Toronto and Region Conservation Authority (TRCA) 2003 A Watershed Plan for Duffins Creek and
Carruthers Creek August 2003 httpwwwtrcaoncadotAsset25961pdf
Wolman M G 1954 ldquoA method of sampling coarse river-bed materialrdquo Eos Transactions American
Geophysical Union 35 (6) 951-956
23655-522 Carruthers Creek 2017-07-10 draftdocx 36 Matrix Solutions Inc
- Phase 1 Technical Reports
- Phase 1 Technical Reports
- CCWP_FluvialGeomorphologyReport-Matrix_2017_finalpdf
-
- CCWP_Ph1-techreports-intro-2017_v9_FluvGpdf
-
- Phase 1 Technical Reports
- Phase 1 Technical Reports
-
- CCWP_Ph1-techreports-intro-2017_v9_FluvGpdf
-
- Phase 1 Technical Reports
- Phase 1 Technical Reports
-
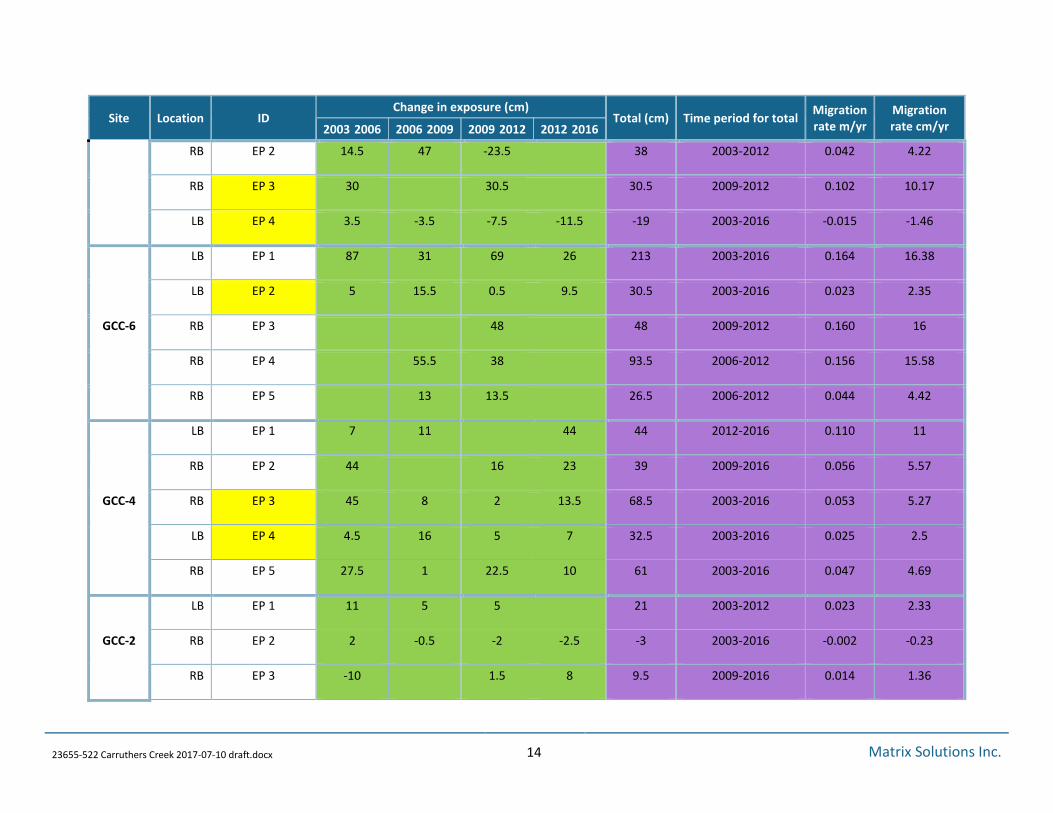
- - - -Site Location ID
Change in exposure (cm) Total (cm) Time period for total
Migration rate myr
Migration rate cmyr 2003 2006 2006 2009 2009 2012 2012 2016
RB EP 4 40 21 415 1025 2006-2016 0100 1025
LB EP 5 545 135 405 1085 2003-2012 0120 1206
erosion pins highlighted with yellow are those located at the monitoring cross-section
23655-522 Carruthers Creek 2017-07-10 draftdocx 15 Matrix Solutions Inc
34 Rapid Assessment Results
A rapid assessment was completed for each valley segment in accordance with the RGA (MOE 2003)
and RSAT (Galli 1996) stream assessment protocols Rapid assessment were undertaken to investigate
any significant changes in the geomorphic stability or ecological health of each segment relative to
previously reported results (Parish 2004 TABLE 1) A summary of the 2016 RGA and RSAT results is
presented in TABLE 5 In general 2016 RGA scores were slightly lower than those previously recorded in
2004 suggesting an improvement in channel stability (highlighted in red in TABLE 5) RSAT scores
remained consistent with very little deviation from results reported in 2004 Although the results
suggest improved channel stability within the catchment the rapid assessment protocols are very
subjective and can often be misleading Long term monitoring of geomorphic parameters as those
discussed in previous subsections provides a better method of assessing trends in channel form and
function A detailed description of each valley segment and comprehensive assessment of long term
monitoring results is provided in subsequent sections
TABLE 5 Summary of 2016 Rapid Assessment Results
Valley Segments RGA Stability Index RSAT Stability Index
GTCC-11 009 In Regime 24 Moderate
GTCC-9 013 In Regime 25 Moderate
GTCC-6 016 In Regime 26 Moderate
GTCC-5 032 Transitional 30 Moderate
GTCC-4 025 Transitional 27 Moderate
GCC-12 015 In Regime 28 Moderate
GCC-7 013 In Regime 23 Moderate
GCC-6 020 Transitional 27 Moderate
GCC-4 018 In Regime 34 Moderate
GCC-2 028 Transitional 27 Moderate
23655-522 Carruthers Creek 2017-07-10 draftdocx 16 Matrix Solutions Inc
4 TRIBUTARY A
Tributary A is located at the upstream end of the watershed beginning north of Concession 7 and
confluences with the Main Branch north of Highway 7 The tributary is approximately 4 km in length and
flows through rural area where the dominant surrounding land use is agricultural The riparian corridor
for the tributary is generally 40 to 100 m wide Vegetation consisted of deciduous swamp meadow
marsh buckthorn deciduous thicket and a small area of hardwood deciduous forest downstream of
Highway 407 Two monitoring stations were located on Tributary A GTCC-11 and GTCC-9 The valley
segment containing GTCC-11 was classified as 3M small catchment and high slope The valley segment
containing GTCC-9 was classified as 2M small catchment and moderate slope
41 GTCC-11
The GTCC-11 station is located approximately 200 m upstream of Highway 7 The channel is located in
an area vegetated with shrubs tall grasses and deciduous trees This vegetated area is approximately
60m wide beyond which are agricultural fields The eastern bank is vegetated with poplar trees and red
osier dogwoods while the western bank is vegetated with tall dense grasses
FIGURE 2 Location of GTCC-11 monitoring station
In 2003 the cross-sectional area for the monitoring cross-section was 041 m2 The cross-section had a
narrow ldquoVrdquo shape typical of a small tributary At the time of survey (October) the wetted width was
030 m The bankfull width was approximately 071 m and the max depth was 036 m Over the
monitoring period the cross-section exhibited a steadily increasing cross-sectional area Between 2003
23655-522 Carruthers Creek 2017-07-10 draftdocx 17 Matrix Solutions Inc
and 2016 the cross-sectional area increased by 010 m2 or approximately 48 The cross-section overlay
indicates that this change corresponds to a deepening and widening of the thalweg transitioning the
cross-section from a ldquoVrdquo to a ldquoUrdquo shape The 2006 and 2009 cross-sections show the cross-section
deepening to a maximum depth of 043 m in 2009 The 2012 and 2016 cross-sections then show
widening of the bed through ongoing toe erosion while the maximum depth returns to a consistent
040 m Comparing the 2016 cross-section to the other years also suggests deepening of the floodplain
area This could be a result of higher flows more frequently spilling onto the floodplain and establishing
a larger bankfull cross-section Shifts in floodplain topography can also be tied to growth and die-off of
dense tall grass vegetation These changes in cross-sectional shape are a manifestation of typical
channel processes in a small headwater channel
The erosion pins generally exhibited increased exposure between monitoring periods The maximum
increase in exposure was 245 cm for EP4 between 2009 and 2012 During this monitoring period there
was also a large change in exposure (18 cm) for the erosion pin at the monitoring cross-section (EP3)
Based on these exposures the erosion rates would be approximately 8 cmyr and 6 cmyr respectively
The erosion rates based on the full monitoring period (13 years) ranged from 031 cmyr to 319 cmyr
The average erosion rate is 163 cmyr
The substrate at GTCC-11 is composed of fine grained materials including sand silt and small pebbles
Over the monitoring period this was consistent with no noticeable coarsening
42 GTCC-9
The GTCC-9 station is located approximately 700 m downstream of GTCC-11 It is approximately 2 km
from the confluence with the main channel At GTCC-11 the channel is located on the floor of a valley
which is approximately 20 to 40 m wide The channel meanders across the valley floor periodically
contacting the valley walls The valley floor is vegetated with meadow grasses and woody shrubs such as
buckthorn and red osier dogwoods The slopes are populated by deciduous trees Beyond the top of the
valley are agricultural fields At the monitoring cross-section the right bank (western) is vegetated with
tall grasses and the left bank (eastern) is covered by a large red osier dogwood The monitoring photos
indicate that the cross-section was originally installed immediately downstream of the dogwood
Overtime the dogwood has grown sufficiently large that it encompasses the area where the left bank pin
is located This made it difficult to properly level the measuring tape along the left bank due to the
dense woody vegetation that must be pushed down to allow the tape to lie flat
23655-522 Carruthers Creek 2017-07-10 draftdocx 18 Matrix Solutions Inc
FIGURE 3 Location of GTCC-9 monitoring station
In 2003 the cross-sectional area for the monitoring cross-section was 083 m2 The cross-section had a
notched low-flow channel in the center with a bottom width of approximately 050 m The 2006
cross-section was distinctly different from all other monitoring years and appears to have captured a
transitional period The cross-section bottom width increased to approximately 077 m and no longer
exhibited a defined low-flow area Between 2003 and 2006 cross-sectional area increased by 016 m2
the largest change during the 13-year period Due to the transitional shape it was difficult to define
bankfull for the 2006 cross-section The cross-sections for 2009 2012 and 2016 all indicate that the
channel is migrating towards the right bank This is evidenced by the increasing elevation of the left
bank profile and the consistent retreat of the right bank The cross-section is also deepening along the
right side Over the 13-year monitoring period the bed has deepened by approximately 010m based on
comparison of the max depth values from 2016 and 2003 The overall cross-sectional area has increased
by 030 m2 or 35
Two erosion pins are located at the monitoring cross-section one in each bank Both pins exhibited an
increase in exposure between 2003 and 2006 when the cross-section shape widened From 2006 to
2012 the right bank pin (EP4) exhibited continued increases in exposure while the left bank pin (EP3)
exhibited small reductions in exposure This is consistent with the migration of the channel towards the
right bank Based on the EP4 data the average erosion rate for the right bank at the monitoring
cross-section is 383 cmyr During the monitoring period the largest changes in exposure were noted at
EP1 and EP5 This was a result of their locations both were located on the outer bank of a bend The
average migration rates based on the EP1 and EP5 data are 928 cmyr and 633 cmyr
23655-522 Carruthers Creek 2017-07-10 draftdocx 19 Matrix Solutions Inc
5
The substrate at GTCC-9 is composed of fine grained material and medium sized gravel The substrate
was relatively consistent over the monitoring period with 2006 and 2009 considered coarser than other
years based on the D50 These years may have been coarser because the cross-section was actively
enlarging and more of the fine material had been removed Additionally the 2009 cross-section was
measured in April when high flows are more frequent due to spring melt This leads to seasonally
coarse distributions as fine material is flushed away more regularly
TRIBUTARY B
Tributary B begins northeast of Tributary A south of Concession 8 It is the larger of the two tributaries
approximately 94 km in length more than double the length of Tributary A North of Highway 7 the
channel flows through rural agricultural land with a riparian corridor ranging from approximately 10m
wide in the headwaters to approximately 80 m wide south of Highway 407 South of Highway 7
the channel flows through a small residential development where a channel design has been
implemented The channel then flows through a dense woodlot area before continuing through Deer
Creek Golf Course The confluence with the Main Branch is located near the south end of the golf
course There are three monitoring stations located on Tributary B all of which are located downstream
of Highway 7 The valley segment containing GTCC-6 is classified as 1H small catchment and low slope
The valley segment containing GTCC-5 is classified as 3H small catchment and high slope The valley
segment containing GTCC-4 is classified as 2H small catchment and moderate slope
51 GTCC-6
The GTCC-6 station is the most upstream station located approximately 325 m downstream of Highway
7 near the crossing of Concession 4 On the south side of the channel is a small deciduous woodlot with
meadow grasses The north side is vegetated with tall dense meadow grasses and shrubs The
monitoring cross-section is located in a highly active area of the channel where ongoing erosion of the
right bank is occurring As a result of this there were challenges maintaining the cross-section bank pins
The 2003 cross-section was not considered as part of the results because the cross-section was
reinstalled in 2006 after the right bank pin was completely lost The 2006 cross-section is 23 m wider
than the original 2003 cross-section There also appeared to be an issue with the 2006 cross-section
when compared to subsequent cross-sections This is likely related to the movement of the right pin
from 60 m (2006) to 685 m (2009) Therefore only the 2009 2012 and 2016 cross-sections were
evaluated Based on the different months in which the monitoring was completed (October December
April) the channel is regularly dry during low flow periods such as summer and early fall However based
on the monitoring results it produces sufficient flow during wetter periods such as spring and rainfall
events to result in toe erosion and undercutting
23655-522 Carruthers Creek 2017-07-10 draftdocx 20 Matrix Solutions Inc
FIGURE 4 Location of GTCC-6 monitoring station
The three cross-sections indicate that the cross-section has deepened and also migrated further into the
right bank This is expected given the erosion and severe undercutting of the right bank seen in the
monitoring photos Minimal change to the left bank profile has occurred Between 2009 and 2012 the
cross-section deepened with the maximum depth increasing from 100 m to 113 m The 2016
cross-section exhibits aggradation along the left bank toe and erosion of the right bank toe There were
increases in cross-sectional area both in 2012 and 2016 indicating that the channel is not just migrating
towards the right bank but also enlarging The cross-sectional area in 2009 was 335 m2 and increased to
405 m2 in 2012 and then 423 m2 in 2016 Over the 7-year period this was an increase of 088 m2 or
262
Two erosion pins are located at the monitoring cross-section one in each bank The right bank pin (EP4)
exhibited large increases in exposure every monitoring period Based on the data from EP4 the
migration rate of the right bank is approximately 133 cmyr The left bank pin (EP5) exhibited changes
in exposure ranging from -8cm to 305 cm This would suggest that there is erosion followed by periodic
slumping of material along that bank The other erosion pins indicated that toe erosion is widespread
throughout the reach For example EP2 and EP3 were located in a bend that was actively eroding both
pins were found eroding out of the bank and lying on the bed at two of the monitoring visits This type
of severe toe erosion and undercutting often occurs in channels with grass dominated vegetation
The substrate at GTCC-6 is composed of fine grained materials including sand silt and small pebbles
Over the monitoring period this was consistent with no noticeable coarsening
23655-522 Carruthers Creek 2017-07-10 draftdocx 21 Matrix Solutions Inc
52 GTCC-5
The GTCC-5 station is located in a large woodlot upstream of the Deer Creek Golf Course Through this
area the channel is quite sinuous with tight bends and steep eroding banks Woody debris such as
branches and downed trees was common resulting in jams The banks in this reach were higher than
those upstream ranging from 050 to 125 m This is indicative of incision The monitoring cross-section
is located on the downstream straight section of an ldquoSrdquo bend There is substantial erosion along the
outer bank upstream of the cross-section the bend has over widened and a formed a large pool A large
willow tree fell across the channel at the monitoring cross-section between 2009 and 2012 due to this
the measuring tape would not lie flat in 2012 and 2016 The impact on the cross-section graph could not
be quantified it is assumed that the cross-section shape is representative of field conditions Specific
depth measurements for 2012 and 2016 are likely to be slightly higher than in the field due to the tree
pushing the tape higher in the center of the cross-section The two cross-sections correlate well with
each other signifying that the tree had a consistent impact on measuring tape and cross-section
measurement
FIGURE 5 Location of GTCC-5 monitoring station
The monitoring cross-section at GTCC-5 experienced the most significant change out of all the
monitoring stations The channel has substantially incised at this location as the result of a debris jam
failure Debris jams establish a sharp change in elevation on the channel profile When a debris jam fails
the channel will incise to remove the difference in elevation and re-establish a consistently sloped
profile This process was well documented at the GTCC-5 cross-section Based on the cross-section
overlay and corroboration by the monitoring photos the channel began to incise between 2006 and
23655-522 Carruthers Creek 2017-07-10 draftdocx 22 Matrix Solutions Inc
2009 The cross-section was stable between 2003 and 2006 with some accumulation of material
resulting in a small reduction in area The material likely accumulated as a result of the small debris jam
located immediately downstream of the cross-section (2003 photo) creating a backwater Between 2006
and 2009 the debris jam destabilized as seen in the 2009 photo The 2009 cross-section deepened and
widened along the right bank cross-sectional area increased by 053 m2 or 213 The max depth
increased by 029 m between 2006 and 2009 Between 2009 and 2012 the large willow tree located on
the left bank fell across the cross-section It can be seen in the 2009 photo on the left bank The downed
tree is an additional disturbance altering flow at the cross-section The change in cross-sectional area
between 2009 and 2012 was the most significant during the monitoring period enlarging by 127 m2 or
424 Max depth increased by 036 m this value could be inflated due to the measuring tape issue as a
result of the downed tree Between 2012 and 2016 the cross-section continued to enlarge primarily
through severe undercutting and subsequent retreat of the right bank The bed appears to have
stabilized as there was minimal change in the actual bed elevation A mid-channel bar has also formed
which supports this notion
In total the cross-section has incised approximately 062 m based on the difference in maximum depth
between the 2003 and 2016 cross-sections Over the 13-year monitoring period the cross-sectional area
has increased by 254 m2 or 98 The cross-section enlarged through incision and retreat of the right
bank while the left bank profile remained stable
There are two erosion pins located at the monitoring cross-section EP2 (left bank) and EP3 (right bank)
The data for these two pins is consistent with the cross-section results EP2 exhibited minimal change in
exposure during the monitoring period while EP3 exhibited large changes each monitoring year Based
on the data from EP3 the migration rate for the right bank is approximately 5cmyr The other three
erosion pins were frequently lost during the monitoring which suggests that they were fully eroded out
of the banks due to the severity of erosion For example EP4 was only re-measured once during the
monitoring period in 2009 and had a change in exposure of 25 cm
The substrate at GTCC-5 was dominated by finer material consisting of coarse sand pebbles and silt
from 2003 to 2009 Medium and coarse gravel represented the coarser fraction The distribution
coarsened in 2012 and 2016 this is typical of an incising channel When the debris jam no longer
created a backwater fine sediment would have been flushed out leaving coarser material behind As the
channel incised further additional fine material would have been removed The coarsening of the bed is
also an indication that incision is slowing as the accumulation of coarse material acts to reduce bed
erosion
53 GTCC-4
The GTCC-4 station is located on the Deer Creek Golf Course in a small cedar woodlot downstream of a
cart path bridge The woodlot provides a small buffer from the adjacent manicured golf course The
monitoring cross-section is located between in a straight section between two successive bends or an
23655-522 Carruthers Creek 2017-07-10 draftdocx 23 Matrix Solutions Inc
ldquoSrdquo bend In the upstream bend there was severe woody debris obstruction Upstream of the bend the
channel flows adjacent to a valley wall along the right bank The bend downstream of the cross-section
has severe erosion of the outer bank The bank is steep and elevated with minimal vegetative buffer
from the golf course approximately less than 5m
FIGURE 6 Location of GTCC-4 monitoring station
In 2003 the cross-sectional area for the monitoring cross-section was 164 m2 The maximum depth was
081 m The cross-section had a narrow low-flow area with a bottom width of approximately 060 m
Between 2003 and 2009 the cross-sectional area steadily increased primarily through erosion of the
vertical left bank widening the bottom width of the channel The 2009 cross-section appears to be
capturing a transition between the 20032006 cross-sections and the 20122016 cross-sections In 2009
the cross-section incised to a maximum depth 087 m This is the deepest measured cross-section during
the monitoring period The 2012 cross-section then exhibits a large loss of material from the lower
portion of the right bank where very little change was noted in the previous cross-sections Itrsquos unclear
from the monitoring photos what may have caused this The left bank also exhibited a noticeable retreat
between 2009 and 2012 The change in cross-sectional area between these 2009 and 2012 was 015 m2
or approximately 8 The 2012 and 2016 cross-sections have a wider bottom width of approximately
14 m as compared to approximately 060 m in 2003 Visually comparing the cross-sections the
20032006 cross-sections have a narrow defined low-flow area while the 20122016 cross-sections
have a larger general ldquoUrdquo shape This change in cross-sectional shape is reflected by a 25 increase in
cross-sectional area over the 13-year monitoring period
23655-522 Carruthers Creek 2017-07-10 draftdocx 24 Matrix Solutions Inc
6
One erosion pin is located at the monitoring cross-section in the left bank EP2 The pin exhibited
increases in exposure ranging from 6 to 155 cm Based on this data the average erosion rate for the left
bank was approximately 286 cmyr Erosion pin 4 exhibited variable results ranging from large increases
in exposure (365) to large decreases in exposure (-195) This is indicative of an area which is eroding
destabilizing and collapsing Erosion pin 1 was located in the outer bank of the eroding bend
downstream of the cross-section It was found eroded out of the bank in 2016 and exhibited large
increases in exposure in 2012 and 2009 Based on EP1 the average erosion rate in this bend is
approximately 86 cmyr Overall based on all the erosion pin data for GTCC-4 the average erosion rate
was 503 cmyr
The channel substrate primarily consisted of medium to coarse gravels The material appears to be
relatively large for the size of the channel which reduces vertical erosion As a result the primary mode
of cross-sectional adjustment was lateral erosion The substrate distribution was consistent over the
13-year monitoring period and exhibited no distinct shifts
CARRUTHERS CREEK MAIN BRANCH
The Main Branch of Carruthers Creek originates to the west of Tributary A north of Concession 7 and
east of Westney Road The Main Branch is approximately 27 km long and flows into Lake Ontario The
surrounding land use north of Taunton Road is primarily rural and agricultural South of Taunton Road
the channel corridor is generally contained within residential development particularly between
Taunton Road and Rossland Road Sinuosity also begins to increase noticeably south of Taunton Road
becoming highly sinuous south of Rossland Road This increase in sinuosity corresponds to the reduced
gradient progressing towards the Lake There are five monitoring stations located on the Main Branch
One is located in the headwater area GCC-12 while the other four are located south of Highway 7
There is a large area gap of approximately 9kms between GCC-12 and the next station (GCC-7) The
furthest downstream station is GCC-2 located on the south side of Kingston Road There are no stations
located below Highway 401
61 GCC-12
The GCC-12 station is the most upstream station on the Main Branch of Carruthers Creek It is located
approximately 100 m downstream of Concession 7 The channel flows adjacent to a rural residential
property with agricultural fields surrounding the riparian corridor The riparian corridor is relatively wide
at the monitoring station approximately 80 to 100 m The surrounding vegetation is predominantly tall
meadow grasses and small willow woodlots At the monitoring cross-section both banks are vegetated
with meadow grasses
23655-522 Carruthers Creek 2017-07-10 draftdocx 25 Matrix Solutions Inc
FIGURE 7 Location of GCC-12 monitoring station
There were challenges maintaining the monitoring cross-section at GCC-12 due to ongoing erosion of
the right bank Neither of the cross-section bank pins could be located in 2016 The cross-section was
reinstalled based on an erosion pin that corresponded to the cross-section Therefore the 2016
cross-section should not be compared with other monitoring years It was also noted during the 2016
measurement that the right bank was noticeably higher than the left bank making it difficult to level the
tape Assuming the cross-section was reinstalled at the correct location this difference in bank height
could have impacted previous cross-section measurements Notes from the 2009 cross-section
measurement also indicated that the tape was not level This may have been a result of moving the right
pin back which occurred in 2009 The pin was moved from 43 m to 51 m presumably to prevent loss
due to erosion The movement of the right bank pin in 2009 made comparisons to the earlier years
2003 and 2006 difficult
In general the cross-section is migrating towards the right bank and steadily eroding it It also appears
that the cross-section has deepened based on the overlays and the photo documentation
Two erosion pins are located at the monitoring cross-section EP3 (left bank) and EP4 (right bank)
The erosion pins provide particularly useful data when there are issues maintaining a cross-section The
right bank erosion pin results indicated ongoing retreat of the right bank Twice EP4 was lost or eroded
out of the bank (2006 and 2016) The change in exposure between 2006 and 2009 for EP4 was 30 cm
Between 2009 and 2012 the change in exposure was 20 cm The average migration rate at EP4 was
833 cmyr based on this data The left bank pin at the cross-section EP3 could not be located twice
during the monitoring period in 2012 and 2016 Two of the erosion pins were located in an actively
23655-522 Carruthers Creek 2017-07-10 draftdocx 26 Matrix Solutions Inc
eroding bend downstream of the monitoring cross-section EP1 and EP2 Both EP1 and EP2 exhibited
large increases in exposure between 2003 and 2006 21 cm and 34 cm respectively
The channel substrate at GCC-12 is primarily composed of medium to coarse gravels There appears to
be a coarsening of the distribution in 2012 and 2016 This is indicated by the higher D50 values as well as
D16 values that are comparable to the D50 values from previous monitoring years The coarsening may be
a result of deepening of the cross-section When this occurs finer material is removed while coarser
material which is too large for the channel to transport remains on the bed
62 GCC-7
The GCC-7 monitoring station is located at the south end of the Deer Creek Golf Course Specifically it is
located in a 50m reach of channel between a cart path crossing and a golf course road (Squire Drive)
The channel is surrounded by golf course fairway and has a minimal riparian buffer of less than 5m The
close proximity to golf course operations led to challenges in maintaining the cross-section The 2009
cross-section needed to be reinstalled after the right bank pin was found lying on the bank The pin was
reinstalled 15 m wider than the original cross-section The right bank pin had to be reinstalled again in
2012 due to the removal by golf course maintenance staff A cross-section was not completed in 2016
because neither of the bank pins could be located due to previous issues it was not reinstalled Based
on these issues only the 2003 and 2006 cross-sections could be compared
FIGURE 8 Location of GCC-7 monitoring station
23655-522 Carruthers Creek 2017-07-10 draftdocx 27 Matrix Solutions Inc
Between 2003 and 2006 the cross-section exhibited evidence of erosion along the right side of the
cross-section and right bank face This was paired with a accumulation of material on the left side of the
cross-section The cross-sectional area was reduced from 175 m2 to 15 m2 approximately -14
Based on these two years the channel was migrating towards the right bank Without subsequent years
of data it is unclear if this process continues and if there is a general trend of reduction in cross-sectional
area
The two erosion pins located at the cross-section provide additional insight EP3 was located in the right
bank and EP4 was located in the left bank The data from EP3 indicated that the right bank was
continually eroding through the 13-year monitoring period The pin could not be located in two of the
monitoring years (2009 and 2016) presumably due to severe erosion For both of the monitoring years
that it was measured the exposure increased by 30 cm This suggests an erosion rate of 10 cmyr for the
right bank based on the EP3 data Data from EP4 exhibited decreases in exposure for each monitoring
year between 2006 and 2016 The results ranged from -35 to -115 cm Observations of the left bank in
2016 noted that the bank is slumping The slumping and erosion is likely related to the lack of riparian
buffer to provide additional support to the banks
The channel substrate at GCC-7 is primarily composed of medium to coarse gravel with the largest
material classified as cobbles The grain size distribution was consistent over the 13-year monitoring
period with no observable trends The coarse nature of the material is expected due to the location on
the golf course and the high potential for modification and erosion protection
63 GCC-6
The GCC-6 monitoring station is located immediately south of Taunton Road in a riparian corridor
between two residential areas The residential area to the east was completed between 2005 and 2008
while the area to the west was completed shortly after Stormwater management ponds are located on
either side of the channel corridor as well as a paved trail to the east This is the first of three stations
located in the southern developed portion of the watershed The channel is situated within a woodland
area approximately 125 m wide Vegetation consisted of deciduous trees woody shrubs and tall
grasses The channel is quite sinuous with tight eroding bends Eroding and undercutting banks were
common throughout the reach resulting in frequent slumped vegetated blocks The monitoring
cross-section is located in a straight section of a large bend The left bank at the monitoring
cross-section corresponds with the outer bank of the bend and is vertical while there is a vegetated
point bar located along the right side of the cross-section The wetted width is narrowed by the point
bar and flow is focused along the toe of the left bank This encourages erosion and undercutting
23655-522 Carruthers Creek 2017-07-10 draftdocx 28 Matrix Solutions Inc
FIGURE 9 Location of GCC-6 monitoring station
Out of all the monitoring sites the cross-section at GCC-6 was the most consistent exhibiting minimal
change over the 13-year monitoring period The cross-sectional area in 2003 was 542 m2 with a
maximum depth of 137 m Maximum depth was extremely consistent at 134 m in both 2006 and 2009
and 133 m in 2012 This indicates that the channel bed has not changed The only change in the
cross-section was retreat of the left bank The most significant change during the monitoring period was
noted between 2006 and 2009 cross-sectional area increased from 520 m2 to 554 m2 approximately
66 Over the entire monitoring period the cross-sectional area increased by only 48 The
cross-section can be considered stable
While location of the monitoring cross-section was stable the surrounding reach exhibited frequent
undercutting of banks and slumping of material The erosion pin data indicated that pins were
frequently lost during the monitoring period When erosion pins cannot be located it is assumed that
they have been eroded out of the banks It also occurs when sufficient undercutting has occurred for the
bank to collapse on top of the erosion pin burying it This is likely what has occurred in GCC-6 Erosion
pin 3 was located in an outside bank downstream of a slumped bank area It could not be located in
2006 2009 or 2016 The only year it was located 2012 the exposure increased by 48 cm indicating an
erosion rate of 16 cmyr Erosion pin 1 was located every monitoring year and exhibited dramatic
increases in exposure ranging from 26 to 87 cm Three of the five erosion pins had an average erosion
rate of 16 cmyr Therefore while the cross-section itself was stable the surrounding reach is active
23655-522 Carruthers Creek 2017-07-10 draftdocx 29 Matrix Solutions Inc
The substrate at GCC-6 is primarily composed of medium gravels The grain size was consistent with
minimal variability during the 13-year monitoring period This is expected because the cross-section
graph indicated that the bed of the channel was largely unchanged
64 GCC-4
The GCC-4 monitoring station is located south of a railway crossing in a forested valley Channel
sinuosity is reduced through the reach by the confining effects of the surrounding valley Surrounding
land use is residential development which is located on either side of the valley The residential
development on the east side began around 2005 and was completed around 2014 On the west side
development began around 2012 and was completed around 2015 The forested valley consists of a
variety of both coniferous and deciduous species Leaning and fallen trees were common particularly
along the right bank which coincided with the valley wall
Figure 10 Location of GCC-4 monitoring station
The monitoring cross-section is located in a straight section which flows along the western toe of the
valley The cross-section is wide compared with other monitoring stations located in grass-lined areas
Toe erosion was noted along both banks The cross-sectional area in 2003 was 781 m2 with a maximum
depth of 138 m Over the monitoring period the cross-sectional area steadily reduced to 641 m2 in
2016 and a maximum depth of 113 m The cross-section overlay indicates that the reduction was
primarily through accumulation of bed material There was erosion of the right bank which is expected
because the channel abuts the valley wall along this side The reduction in cross-sectional area was
approximately 18 Generally a reduction in cross-sectional area is related to accumulation of fine
23655-522 Carruthers Creek 2017-07-10 draftdocx 30 Matrix Solutions Inc
material as a result of reduced velocity Reviewing the monitoring photos suggests that the reduction is
a result of accumulation of coarse material across the riffle that the cross-section is located at
There are two erosion pins located at the cross-section EP3 in the right bank and EP4 in the left bank
The data at EP3 indicated that the most substantial increase in exposure was between 2003 and 2006
45 cm Increases in exposure for the subsequent years were much less substantial The left bank erosion
pin EP4 exhibited small increases in exposure ranging from 45 to 16 cm This was relatively consistent
with the other erosion pins Generally the erosion pins exhibited increases in exposure which were
variable but provided similar erosion rates over the 13-year period Three of the five pins provided
average erosion rates of approximately 5cmyr
The substrate at GCC-4 was coarse and consisted primarily of coarse gravel and cobbles The monitoring
data indicated a general coarsening trend The median grain size increased from medium and coarse
gravel to very coarse gravel and small cobbles This indicates that the accumulation of material is
primarily through coarser material armouring the riffle and further reducing transport at the feature
65 GCC-2
The GCC-2 monitoring station is located immediately south of Kingston Road it is the furthest
downstream station The channel flows through a meadow dominated area with some small deciduous
woodlots To the west is a residential development a stormwater management pond and a paved trail
The development was built over the course of the monitoring period completed between 2009 and
2012 To the east is an agricultural field The channel is quite sinuous through this reach The reach was
characterized by tall steep undercutting banks Bank height was frequently 1m with material scoured
out from beneath the upper vegetative root layer Deep scour pools and accumulation of fine material
was also noted The reach can be considered fairly active based on these indicators
23655-522 Carruthers Creek 2017-07-10 draftdocx 31 Matrix Solutions Inc
Figure 11 Location of GCC-2 monitoring station
The monitoring cross-section is located in a short straight section of channel between two bends The
cross-section was highly active during the monitoring period both increasing and decreasing
cross-sectional area The cross-section shape has shifted and changed but when cross-sectional areas
from 2003 and 2016 are compared there is negligable difference The 2003 cross-sectional area was
327 m2 while the 2016 area was 333 m2 Between 2003 and 2006 the cross-sectional area reduced
through bed accumulation reducing maximum depth from 105 to 083m Between 2006 and 2009 the
cross-sectional area increased primarily through erosion of a high point along the right bank and erosion
of both bank toes There was some bed erosion during this time period as well increasing the maximum
depth by 004 m However lateral erosion was the dominant process The 2006 to 2009 period exhibited
the most significant change during the monitoring period cross-sectional area by increased 054 m2 or
19 The cross-section continued to increase through 2012 to 362 m2 with a maximum depth of
095 m This increase was a result of retreat of the right bank erosion along the left bank toe and
deepening of the bed Near the left bank toe there was a narrow notched area where the channel has
cut down This is likely where the thalweg and the strongest forces from the flow are focused In 2016
the cross-sectional area was reduced by 7 to 333 m2 This was primarily due to the accumulation of
sediment above bankfull along the right bank and along the right bank toe It is also worth noting that
during the 2016 assessment the right bank pin was buried under approximately 16 cm of fine material
This could suggest that the higher flows are regularly depositing fine material from bank erosion above
bankfull The bed of the 2016 cross-section exhibits a wider thalweg area than was document in 2012
The area is not as deep (092 m) but it is wider and more defined This could suggest that the channel is
slowly and systematically eroding downward
23655-522 Carruthers Creek 2017-07-10 draftdocx 32 Matrix Solutions Inc
7
Based on the variable changes in the cross-section it can not be definitively said whether it is increasing
or decreasing in size It is clear that the channel is highly active mobilizing sediment from both the bed
and banks in this reach The sediment then periodically accumulates within the channel or overbank
areas due to the excess amount
No erosion pins were located at the monitoring cross-section for GCC-2 Erosion pins 4 and 5 were
located approximately 40m upstream of the cross-section Erosion pin 4 was located at the downstream
end of an overwidened eroding bend with a large scour pool Erosion pin 5 was also located at the
downstream end of an area of severe erosion and undercutting Both EP4 and EP5 exhibited large
increases in exposure and were lost at once Based on the data at these two pins the average erosion
rate was 10 cmyr and 12 cmyr respectively The other three erosion pins were in areas of less active
erosion EP2 exhibited small amount of accumulation during most monitoring periods
The substrate at GCC-2 was predominantly fine material including silt sand and pebbles
This distribution is particularly small given the size of the channel and is likely a reflection of the ongoing
bank erosion The median grain size typically consistents of pebbles
DISCUSSION
The results from the 13-year monitoring period provide insight on channel processes at a variety of
scales Most reliably the data describes the processes occurring at various discrete sites throughout the
watershed Each station is a reflection of the specific governing factors at that location which include
surrounding vegetation land use geology and flow regime Reviewing the stations together based on
their general location within the watershed may reveal broader characteristics of the watercourse The
results of the monitoring program also provide insight into the effectiveness of a long-term program as
very few fluvial geomorphic programs are maintained for such an extensive period This warrants
additional discussion beyond results specific to the Carruthers Creek watershed
Both of the stations on Tributary A have relatively small cross-sectional areas which have enlarged over
the 13-year monitoring period (48 and 35) Due to the small size of the cross-sections small changes
in area result in a large percentage change The evolution of the two cross-sections is markedly
different While GTCC-11 exhibited a gradual consistent transition from a ldquoVrdquo to a ldquoUrdquo shaped
cross-section GTCC-9 appears to have experienced a more complex and abrupt transition The GTCC-9
cross-section exhibited a large change in cross-sectional area between 2003 and 2006 shifting to a
cross-sectional shape that differs from all other years After 2006 the cross-section re-established itself
as a distinctly different shape which consistently migrated towards the right bank and deepened for the
remainder of the monitoring period These results suggest that the 2006 monitoring captured the
cross-section after a specific event a brief instance which is not necessarily representative of the
ongoing long-term process The difference in adjustment between the two sites highlights the
importance of local site-specific characteristics While both cross-sections are enlarging potentially in
response to the same governing factor they do so differently The consistent adjustment at GTCC-11 is
23655-522 Carruthers Creek 2017-07-10 draftdocx 33 Matrix Solutions Inc
reflective of equal resistance of vegetation and bank materials At GTCC-9 the difference in bank
vegetation dense woody dogwood versus dense herbaceous grasses has biased the cross-sectional
adjustment to the right half of the cross-section where less force is required to erode the material
Tributary B is the larger of the two tributaries and has three monitoring stations For Tributary B
interpreting the cross-section adjustment with respect to potential systemic adjustment was
complicated by additional factors for two of the three stations GTCC-6 and GTCC-5 The GTCC-5
cross-section enlarged dramatically (98) doubling in size through incision as a result of a debris jam
failure This adjustment in the response to the local event masks potential channel adjustment which
could be attributed to broader systemic change At GTCC-6 the data was incomplete due to issues with
maintaining the cross-section as a result of severe erosion of the right bank Only the last three
monitoring years (2009 2012 and 2016) were comparable During this period the cross-sectional area
increased by 26 through retreat of the right bank and incision The results definitively indicate that
from 2009-2016 the cross-section is continually enlarging Based on the issues with the right bank pin in
2003 and 2006 it can be inferred that these cross-sections would have exhibited the same trend if the
bank pin had been maintained The third station GTCC-4 did not appear to be impacted by any
identifiable site-specific issues Therefore it is more plausible that adjustment at GTCC-4 is reflective of
potential broader scale influences At GTCC-4 the cross-section adjusted primarily through lateral
erosion as vertical adjustment was limited by coarse bed material The cross-sectional area increased by
25 between 2003 and 2016 transitioning to a distinctly different shape with increased bed width The
enlargement of GTCC-6 and GTCC-4 may be indicative of a broader scale response of Tributary B The
GTCC-5 cross-section may also be support this but it is unclear due to the prominent influence of a local
event
There are five monitoring stations located on the Main Branch of Carruthers Creek Similar to Tributary
B two of the stations had challenges with maintenance and produced incomplete data which was not
definitive At GCC-12 the overall trend of cross-sectional adjustment could not be determined The two
monitoring periods for which cross-sectional area could be compared produced conflicting results
cross-sectional area reduced from 2003 to 2006 and increased from 2009 to 2012 At GCC-7
cross-section graphs after 2006 could not be used due to movement or loss of the right bank pin With
only one monitoring period of data (2003-2006) in which cross-sectional area was reduced no definitive
trends could be identified Both GCC-7 and GCC-12 exhibited ongoing erosion of one of their banks this
could not be attributed to a particular channel process The remainder of the stations GCC-6 GCC-4
and GCC-2 were all located in the lower half of the watershed where ongoing development has occurred
during the monitoring period There does not appear to be an observable trend in the results from the
three stations The GCC-6 cross-section was the least active out of all the monitoring stations
Cross-sectional area increased by 48 during the monitoring period but the cross-sectional shape
remained static The increase in area was the result of erosion of the vertical left bank However
beyond the cross-section the overall GCC-6 reach was active with ongoing erosion slumping and
frequent loss of erosion pins The GCC-4 cross-section was the only monitoring cross-section that
23655-522 Carruthers Creek 2017-07-10 draftdocx 34 Matrix Solutions Inc
exhibited well-documented aggradation reducing cross-sectional area by 18 This is the result of an
accumulation of coarse material which was indicated by a coarsening trend in the grain size
distribution Erosion pin data for the site was relatively consistent with most pins exhibiting average
migration of 5cmyr The GCC-2 cross-section was highly active during the monitoring period increasing
and decreasing cross-sectional area between monitoring years However when comparing the 2003 and
2016 cross-sections there was negligible change in cross-sectional area Throughout the site vertical
banks severe undercutting and bank collapses were common It is assumed that the changes in the
cross-section are a manifestation of the frequent input of fine bank material which temporarily deposits
on the bed and then is periodically flushed downstream This process is supported by the grain size
distribution data which was notably fine for the size of the channel The results of the three downstream
main branch stations did not display a common response which could be attributed to broad scale
influences such as the surrounding ongoing development
The results of the Carruthers Creek monitoring program indicate that the watercourse is an active
channel whether the cross-section is enlarging aggrading or continually adjusting while maintaining a
similar size The sites on both Tributary A and Tributary B suggest that channel dimensions are
increasing The magnitude of increase was larger for the Tributary A sites presumably because it is the
smaller of the two tributaries and is therefore more sensitive to surrounding change Comparatively
while the main branch sites exhibited active channel processes overall change was relatively minimal
There was no indication of a common adjustment response amongst the main branch sites Similar to
the tributaries this is indicative of the larger channelrsquos resilience to accommodate changes to the
surrounding area It should also be considered that the main branch stations are the only stations
located in the developing area of the watershed while most of the tributary sites are located in the
upper agricultural and rural area of the watershed The expectation would be that the ongoing
development would alter the hydrologic regime of the downstream stations and this would manifest as
changes in morphology However this is not supported by the results Channel morphology and flow
regime are intrinsically linked which allows for inferences to be made about both characteristics when
there is sufficient knowledge of one Based on this it can be inferred that the tributary stations are
enlarging as a response to changes in the flow regime However it cannot be definitively determined
without a complementary flow monitoring program
Overall the 13-year monitoring period provided a unique opportunity to document changes in channel
morphology for the purposes of understanding channel processes Fluvial geomorphology monitoring
programs are generally undertaken for 3 to 5 years following the completion of a natural channel
design shorter 1 to 3 year programs are completed for characterization studies After reviewing the
results of the Carruthers Creek monitoring it is clear that a 3 to 5 year monitoring program would not
have adequately captured the ongoing trends The results also revealed the challenges with maintaining
a long-term program such as selecting an appropriate location and establishing a sufficiently wide
cross-section
23655-522 Carruthers Creek 2017-07-10 draftdocx 35 Matrix Solutions Inc
8 REFERENCES
Galli J 1996 Rapid Stream Assessment Technique Field Methods Metropolitan Washington Council of
Governments Washington DC 36pp
Parish Geomorphic Ltd (PARISH) 2003 Valley Segments Carruthers Petticoat and Duffins Creek
Watersheds Report prepared for the Toronto and Region Conservation Authority
September 2003
Ontario Ministry of the Environment (MOE) 2003 Stormwater Management Planning and Design
Manual Queenrsquos Printer Ottawa Ontario March 2003
httpwwwontariocadocumentstormwater-management-planning-and-design-manual
Parish Geomorphic Ltd (PARISH) 2004 Regional Monitoring Program - Fluvial Geomorphology
Component Pettitcoat Creek Carruthers Creek Duffins Creek and Highland Creek Watersheds
Report prepared for the Toronto and Region Conservation Authority April 2004
Toronto and Region Conservation Authority (TRCA) 2015 Crossings Guideline for Valley and Stream
Corridors September 2015 httpwwwtrcaoncadotAsset214493pdf
Toronto and Region Conservation Authority (TRCA) 2003 A Watershed Plan for Duffins Creek and
Carruthers Creek August 2003 httpwwwtrcaoncadotAsset25961pdf
Wolman M G 1954 ldquoA method of sampling coarse river-bed materialrdquo Eos Transactions American
Geophysical Union 35 (6) 951-956
23655-522 Carruthers Creek 2017-07-10 draftdocx 36 Matrix Solutions Inc
- Phase 1 Technical Reports
- Phase 1 Technical Reports
- CCWP_FluvialGeomorphologyReport-Matrix_2017_finalpdf
-
- CCWP_Ph1-techreports-intro-2017_v9_FluvGpdf
-
- Phase 1 Technical Reports
- Phase 1 Technical Reports
-
- CCWP_Ph1-techreports-intro-2017_v9_FluvGpdf
-
- Phase 1 Technical Reports
- Phase 1 Technical Reports
-
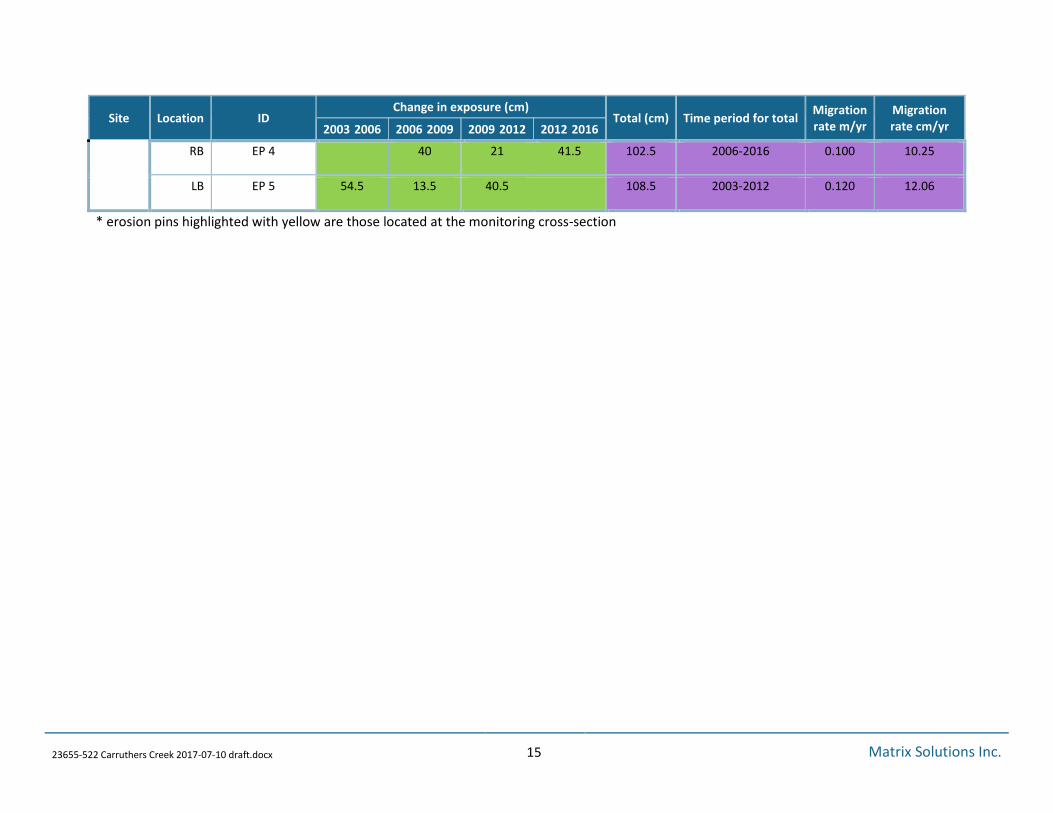
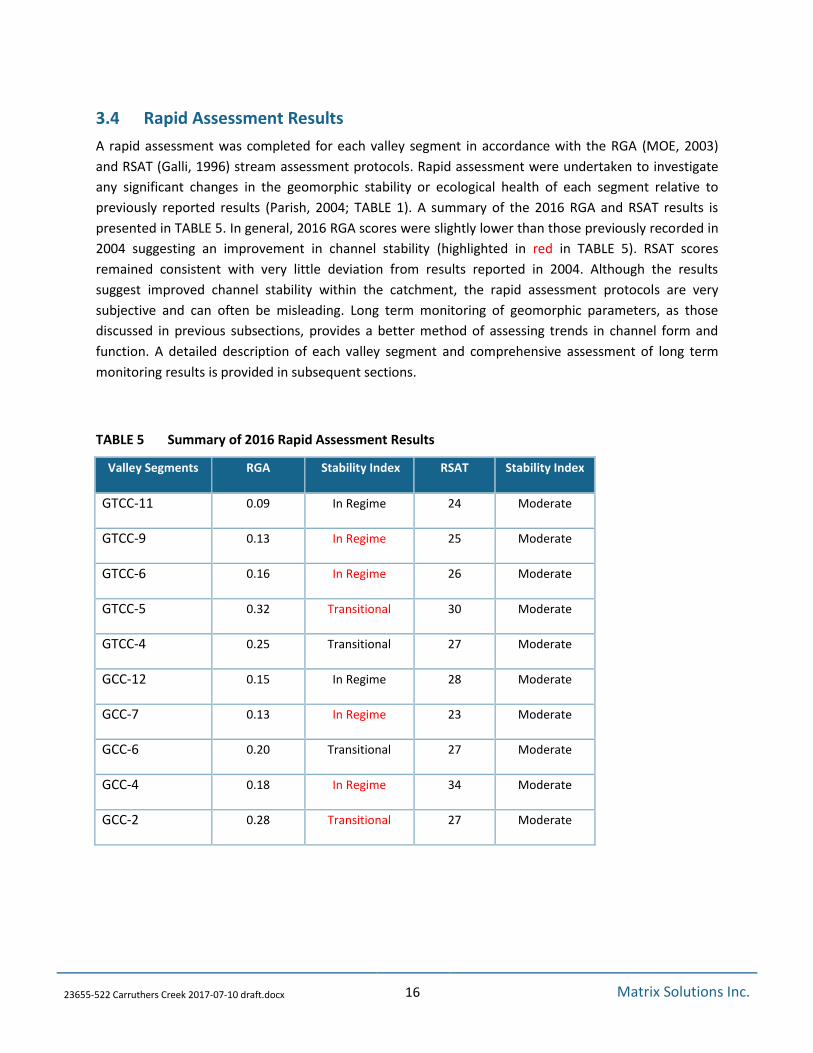
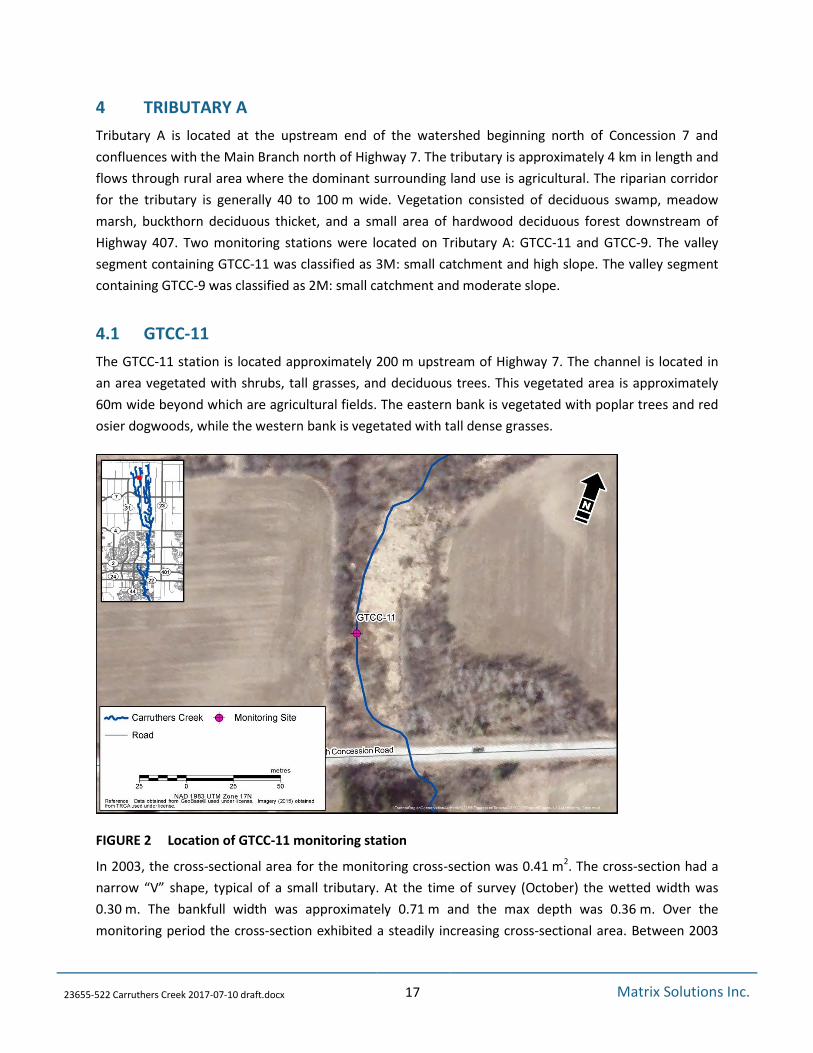
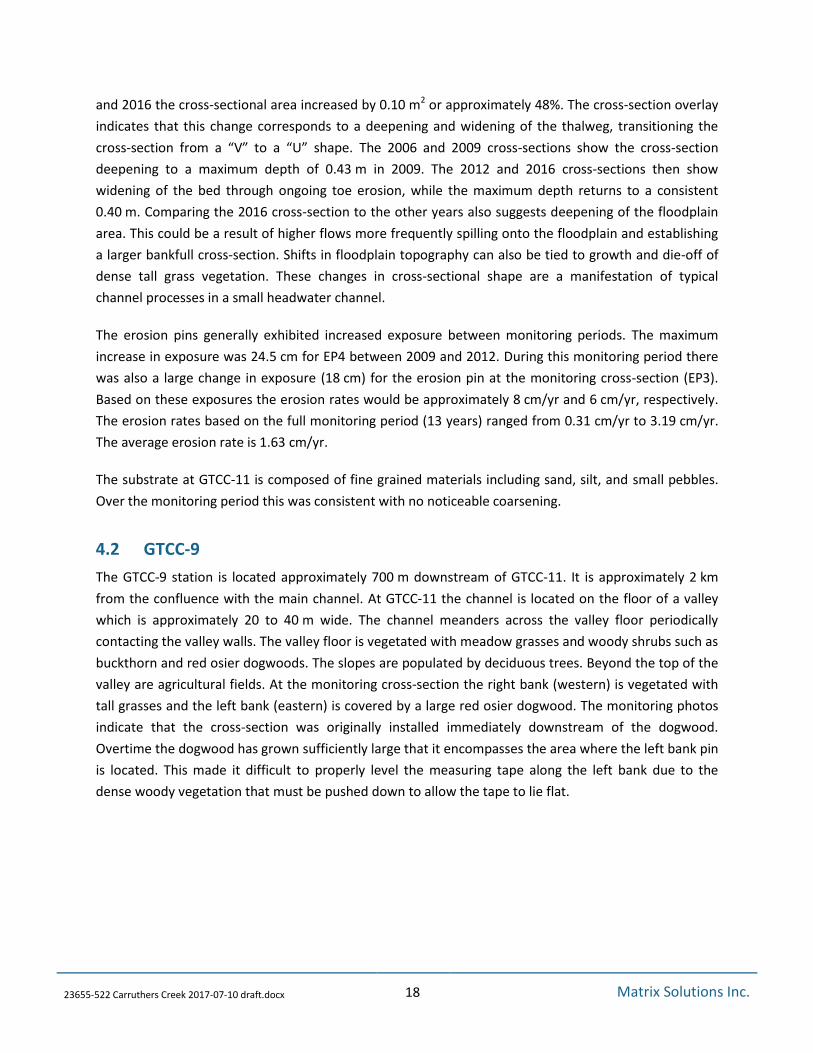
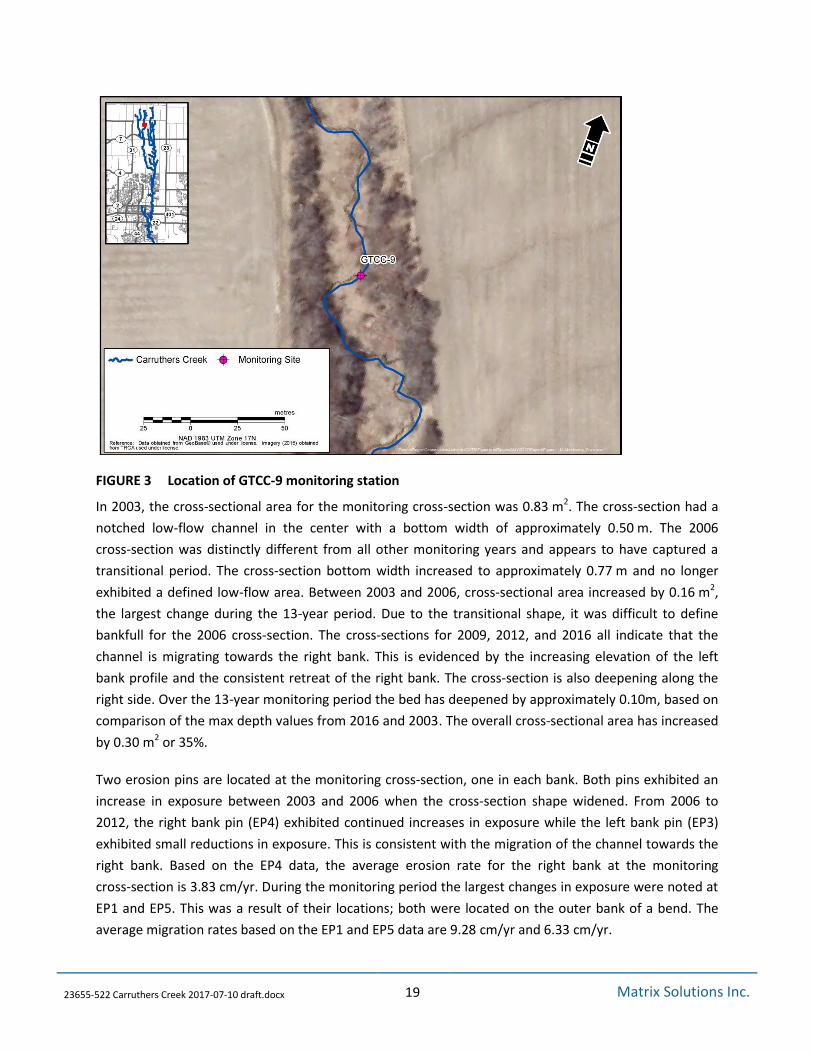
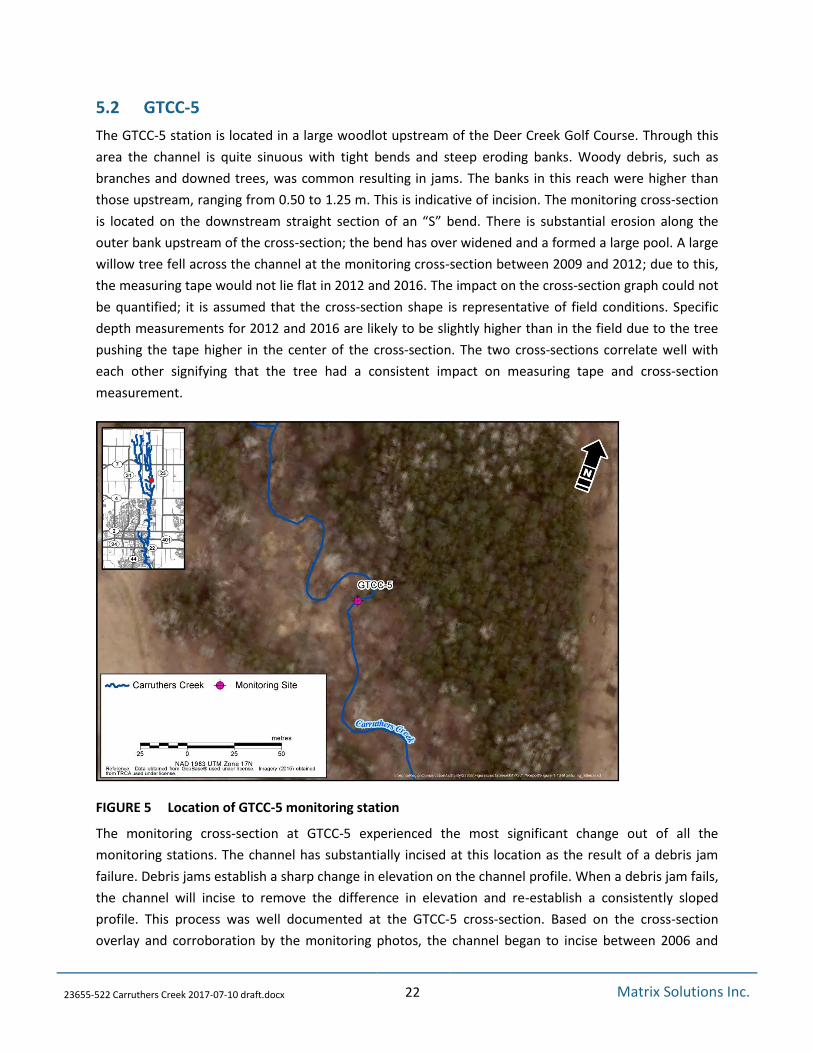
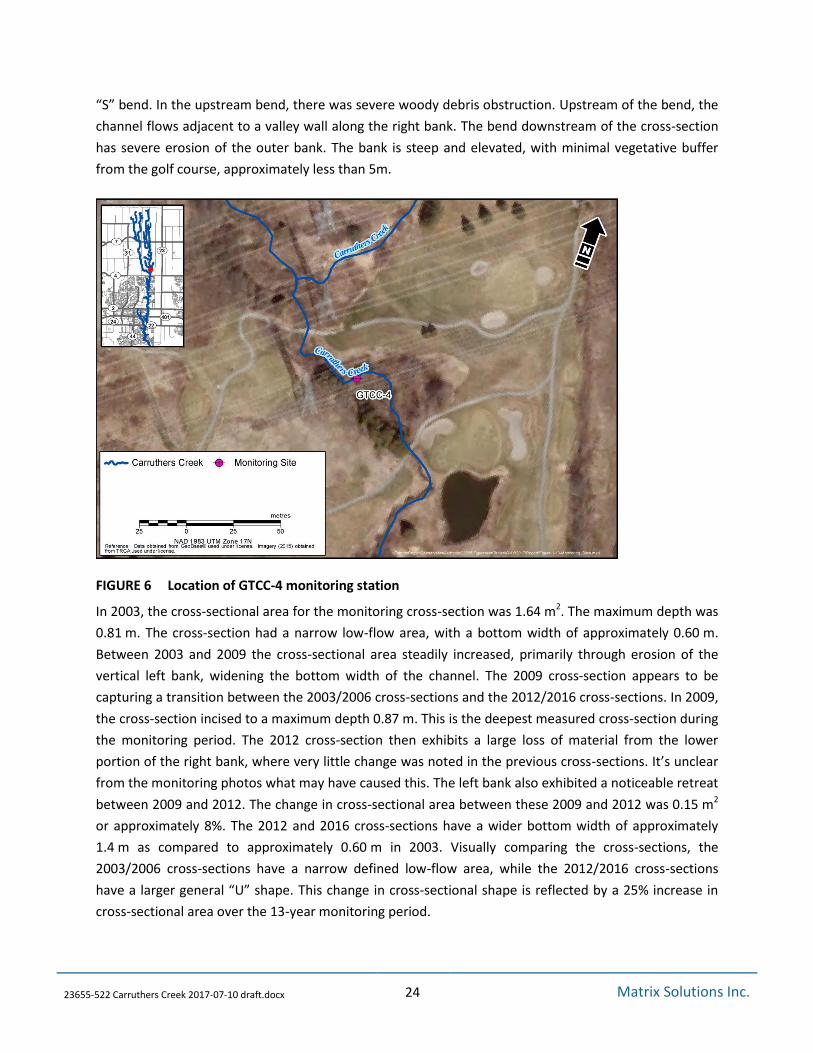
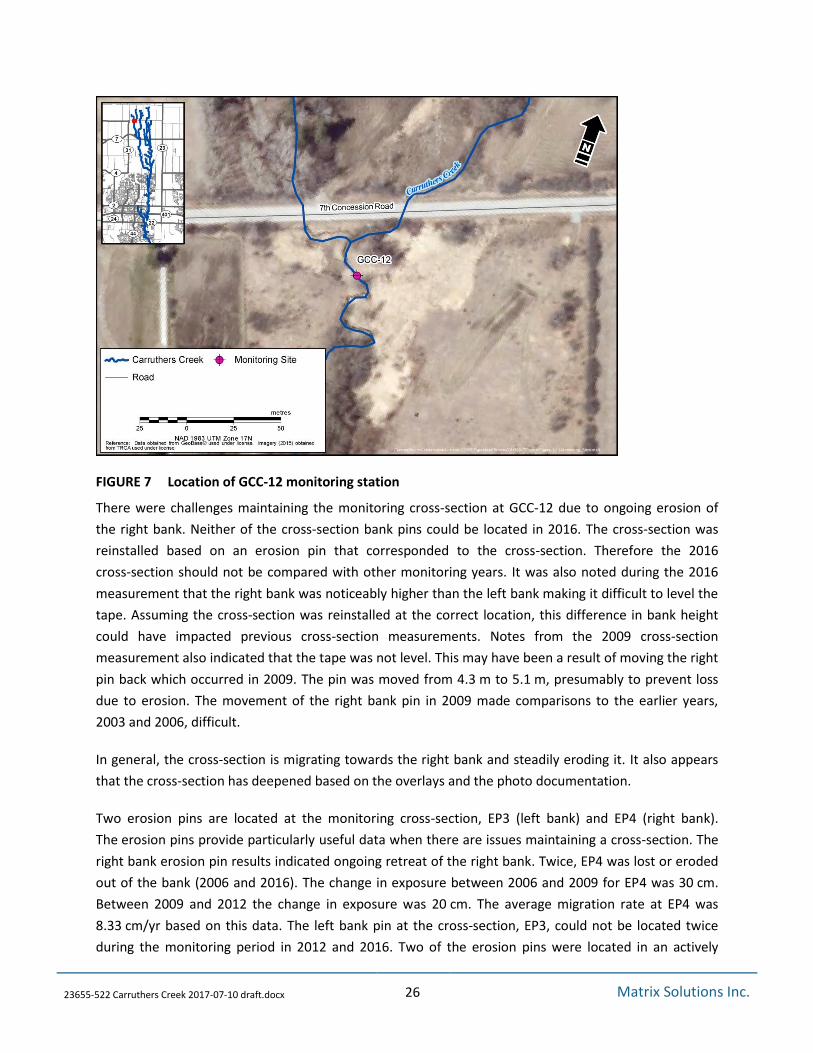
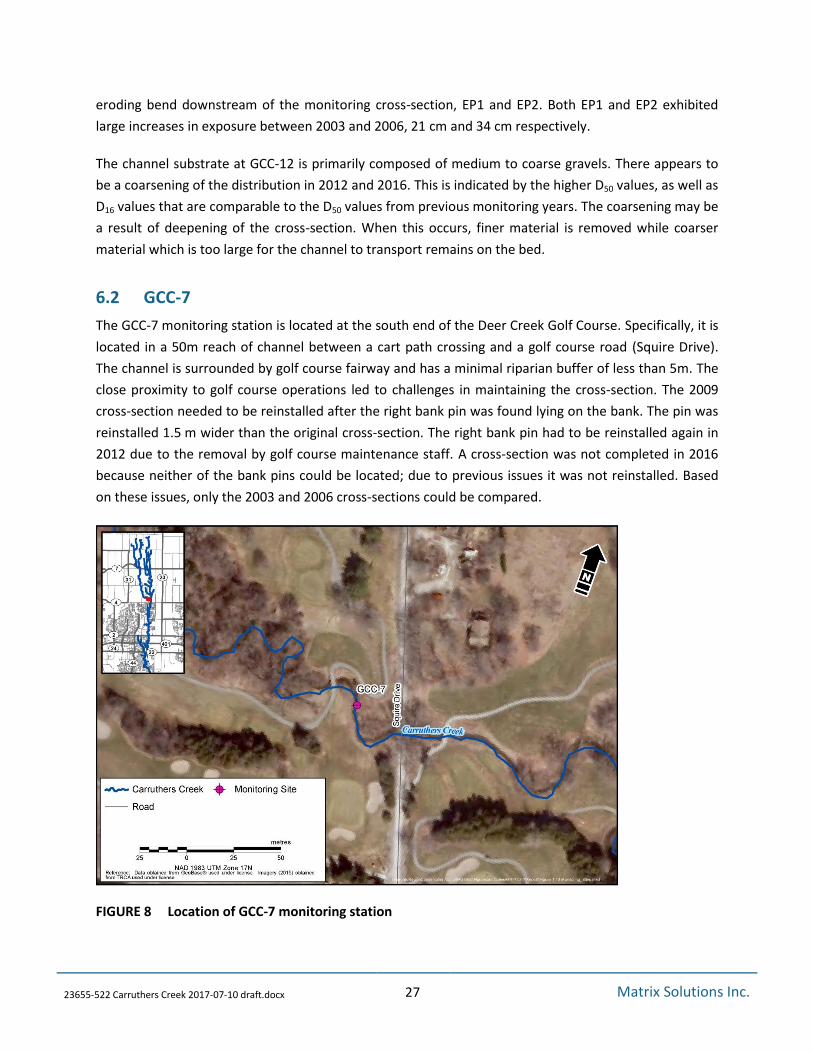
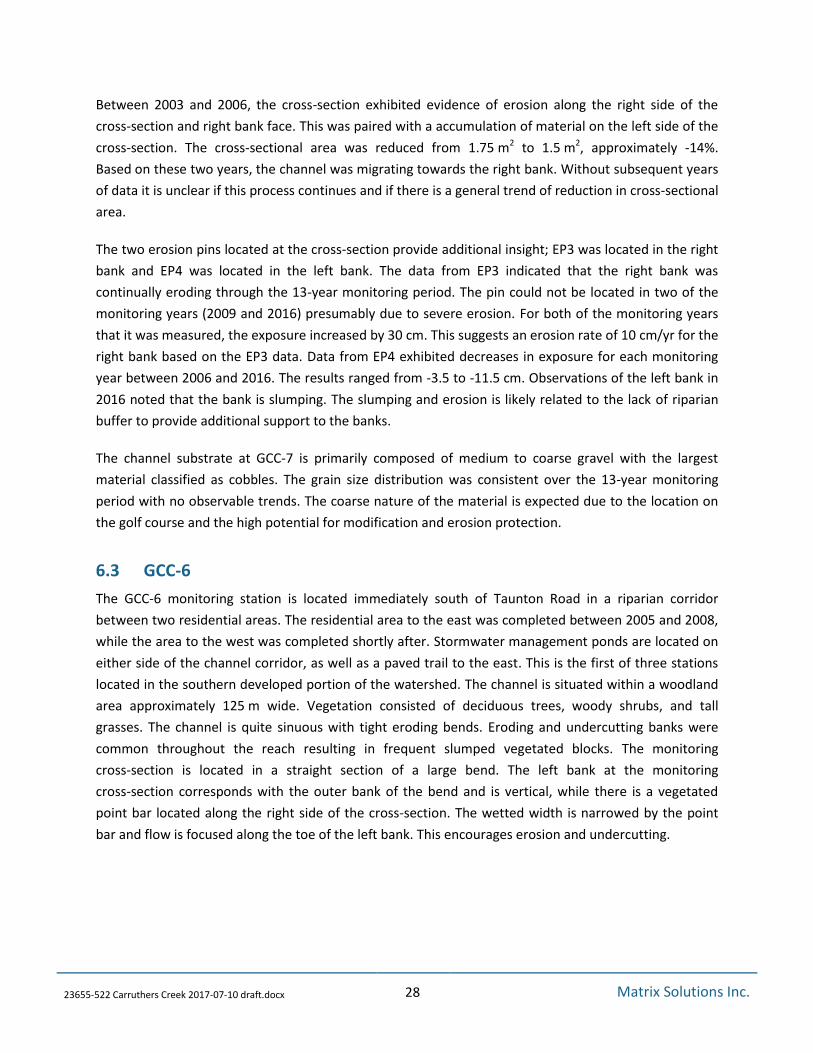
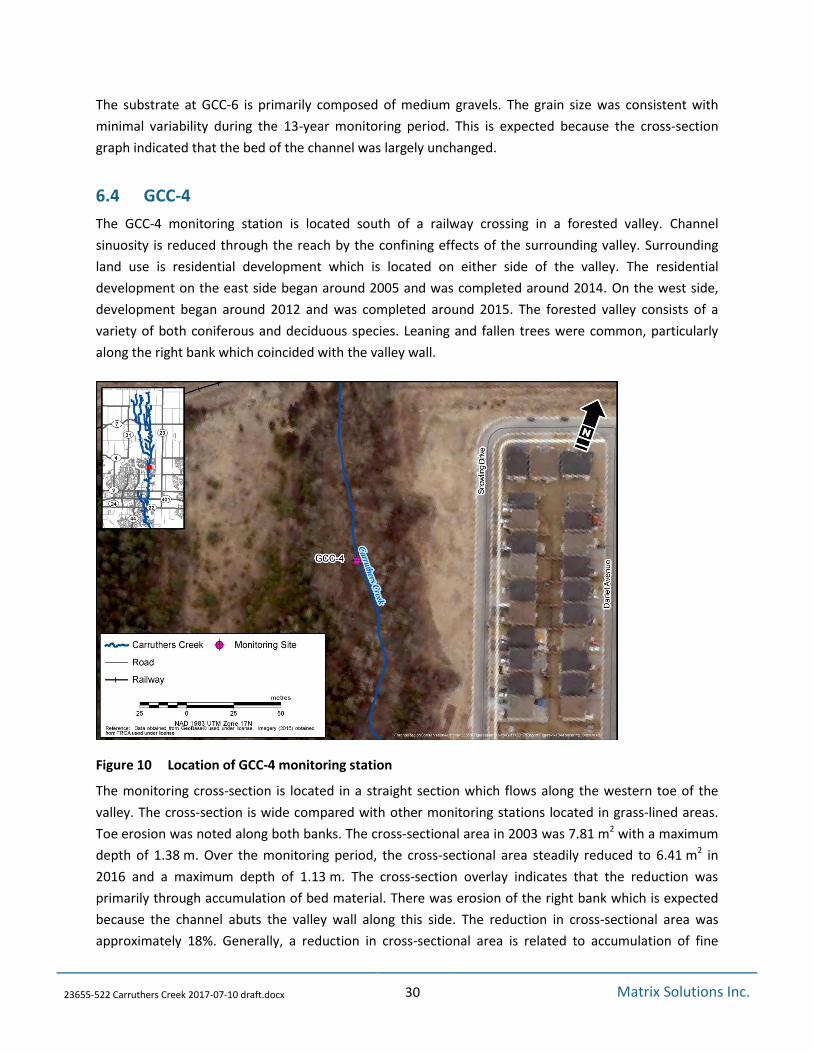
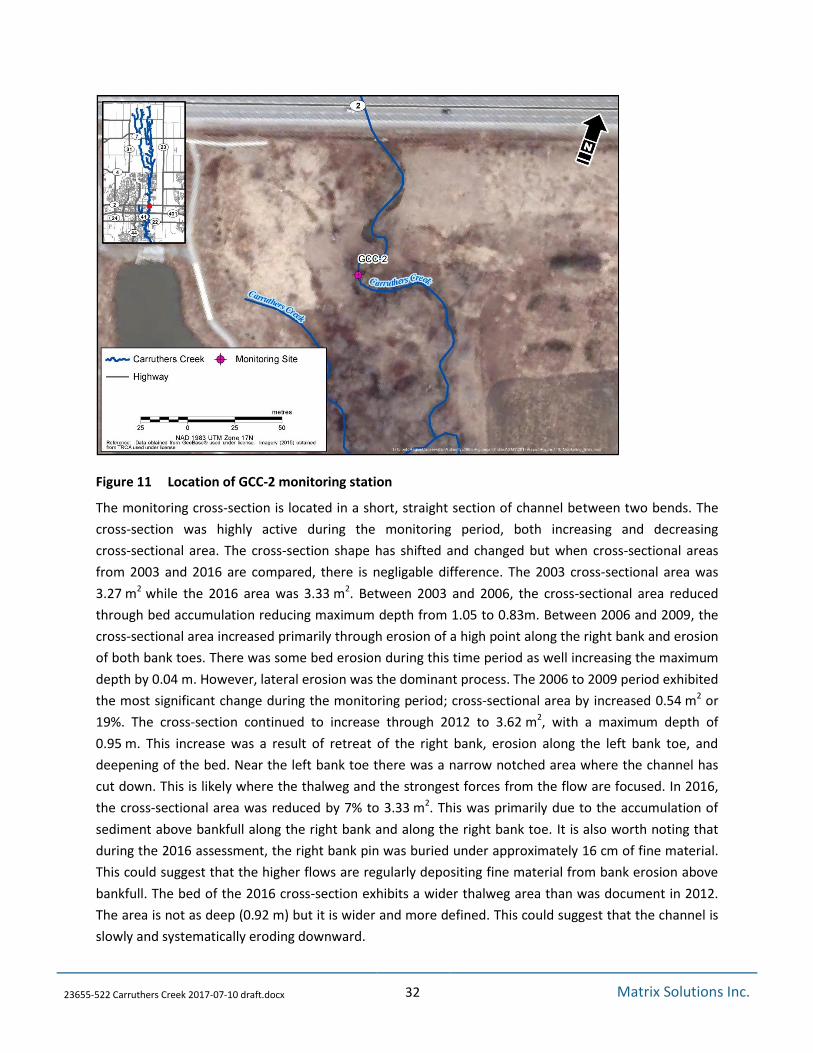