carlos filipe acesso rádio umts, wlan e wimax sobre … · radio over fiber, passive optical...
TRANSCRIPT

Universidade de Aveiro 2008
Departamento de Electrónica, Telecomunicações e Informática
Carlos Filipe Pereira de Almeida
Acesso Rádio UMTS, WLAN e WiMAX sobre Fibra


Universidade de Aveiro 2008
Departamento de Electrónica, Telecomunicações e Informática
Carlos Filipe Pereira de Almeida
Acesso Rádio UMTS, WLAN e WiMAX sobre Fibra
Tese de dissertação apresentada à Universidade de Aveiro para cumprimento dos requisitos necessários à obtenção do grau de Mestre em Engenharia Electrónica e Telecomunicações, realizada sob a orientação científica do Dr. António Luís Jesus Teixeira, Professor Auxiliar do Departamento de Electrónica, Telecomunicações e Informática da Universidade de Aveiro, e do Dr. Mário José Neves de Lima, Professor Auxiliar Convidado do Departamento de Electrónica, Telecomunicações e Informática da Universidade de Aveiro


Dedico este trabalho à minha namorada e aos meus pais.


o júri
presidente Prof. Dr. José Rodrigues Ferreira da Rocha Professor catedrático do Departamento de Electrónica, Telecomunicações e Informática da Universidade de Aveiro Prof. Dr. António Luís Jesus Teixeira Professor auxiliar do Departamento de Electrónica, Telecomunicações e Informática da Universidade de Aveiro
Prof. Dr. Mário José Neves de Lima Professor auxiliar convidado do Departamento de Electrónica, Telecomunicações e Informática da Universidade de Aveiro
Dr. Daniel Diogo Ferrão da Trindade Fonseca Researcher at the Nokia Siemens Networks, Amadora.


agradecimentos
Muitas pessoas contribuíram de forma valiosa para o trabalho apresentado nesta
tese, bem como algumas instituições. Sem menosprezar nenhuma das
contribuições, vou referir-me às que de alguma forma se revelaram mais
substanciais.
Em primeiro lugar, um agradecimento sentido à minha namorada, Carla, pela
paciência e apoio constante na redacção deste documento, mesmo que em alguns
momentos o nosso tempo tenha saído prejudicado. Aos meus pais agradeço toda
a confiança que depositaram em mim tendo me permitido alcançar este nível
académico, bem como todo o encorajamento que sempre tive ao longo do mesmo.
Agradeço também a todos os familiares e amigos pelos ensinamentos dados em
especial ao meu avô Morais, sempre motivo de boas recordações.
Gostaria de agradecer aos dois orientadores: o Prof. Doutor António Luís Jesus
Teixeira e Prof. Doutor Mário José Neves de Lima, por todo o apoio, confiança,
empenho e disponibilidade que demonstraram ao longo do trabalho que
desenvolvi, bem como pelas produtivas discussões científicas que contribuíram
para o enriquecimento deste trabalho e para o meu desenvolvimento profissional.
Gostaria de destacar o André Bastos, grande amigo e companheiro de sempre no
trabalho desenvolvido, bem como o Mestre Cláudio Rodrigues e o Mestre João
Prata pela contribuição que deram ao ajudar-me no trabalho que desenvolvi.
Gostaria ainda de agradecer à Universidade de Aveiro e ao Instituto de
Telecomunicações, Pólo de Aveiro onde realizei o meu trabalho com os apoios do
projecto ROF-WDM e BONE-project.
A todos, o meu muito obrigado!
Carlos Almeida


palavras -chave
Radio sobre Fibra, Rede Óptica Passiva, UMTS, WLAN, WiMAX, Amplificador
Óptico de Semicondutor.
resumo
O presente trabalho tem por objectivo o estudo e implementação de uma rede
óptica passiva para a transmissão de sinais rádio sobre fibra.
Para tal, são estudados e analisados diversos componentes optoelectrónicos que
constituem uma rede óptica passiva, tendo em vista a optimização e
desenvolvimento da mesma.
Por forma a definir os limites, bem como desenvolver conhecimentos sobre os
processos que limitam ondas de rádio em fibra, foram realizadas simulações
computacionais em redes óptica passivas com transmissão de sinais 3G-UMTS,
objectivando estudar possibilidades de acesso múltiplo, bem como os efeitos da
alteração de determinadas propriedades dos dispositivos ópticos.
Para demonstrar os processos limitativos da propagação, laboratorialmente foram
implementadas duas topologias de redes ópticas passivas recorrendo a
amplificadores ópticos e lasers de baixo custo, para estudar a transmissão de
multi-formatos de sinais rádio sobre fibra. A primeira consiste na transmissão de
um canal que consiste na modulação directa de um laser com o sinal rádio que
pode ser 3G-UMTS, WLAN ou WiMAX. A segunda inclui, para além do cenário
apresentado, um canal extra modulado em amplitude num cenário de
multiplexagem no comprimento de onda.


keywords
Radio over Fiber, Passive Optical Networks, UMTS, WLAN, WiMAX,
Semiconductor Optical Amplifiers.
Abstract The present work intends to study and implement a passive optical network for the
transmission of radio signals over optical fiber.
For this intent, several optoelectronic devices used in passive optical networks
were studied and analyzed in order to optimize the developed network.
A passive optical network for the transmission of 3G-UMTS signals was simulated
and the effect of multiple access and other optical factors were studied and
analyzed.
In the laboratory were implemented two different topologies for passive optical
networks using low cost optical amplifiers and lasers in multi-format multi-
wavelength radio over fiber signals. The first consider the transmission of a single
channel consisting of directly modulating the laser with a radio signal that can be
UMTS, WLAN or WiMAX, and the second includes an extra channel with amplitude
modulated signals in a wavelength division multiplexing scenario.


Table of Contents
List of Acronyms .............................................................................................. i
List of Symbols ................................................................................................ ii
Chapter 1 - Introduction ................................................................................ 1
1.1 Motivations .................................................................................................................. 1
1.2 Objectives .................................................................................................................... 3
1.3 Structure ....................................................................................................................... 4
Chapter 2 - Radio communications ............................................................... 5
2.1 Introduction .................................................................................................................. 5
2.2 Radio over Fiber .......................................................................................................... 6
2.2.1 RoF technologies ................................................................................................... 6
2.2.2 Advantages of using RoF in mobile communications .......................................... 7
2.3 UMTS .......................................................................................................................... 8
2.3.1 Physical layer: CDMA .......................................................................................... 8
2.3.2 Spread Spectrum techniques ............................................................................... 10
2.3.3 Spectrum proprieties ........................................................................................... 12
2.4 WLAN ....................................................................................................................... 12
2.4.1 Physical layer: OFDM ......................................................................................... 13
2.4.2 Transmission mechanism .................................................................................... 15
2.4.3 Operational modes............................................................................................... 15
2.5 WiMAX ..................................................................................................................... 17
2.5.1 Physical Layer: OFDM and OFDMA ................................................................. 17
2.5.2 Adaptive Modulation, Coding and Data Rates.................................................... 19
2.5.3 Operational modes............................................................................................... 20

2.6 Comparison of UMTS, WLAN and WiMAX technologies ...................................... 20
2.7 Conclusion ................................................................................................................. 21
Chapter 3 - Optical components of a RoF system ...................................... 23
3.1 Introduction ............................................................................................................... 23
3.2 Optical fiber ............................................................................................................... 24
3.2.1 Linear properties ................................................................................................. 25
3.2.2 Non-linear properties .......................................................................................... 29
3.3 Laser .......................................................................................................................... 33
3.3.1 Laser biasing ....................................................................................................... 34
3.3.2 Modulation of laser diodes .................................................................................. 36
3.3.3 Linewidth and chirp ............................................................................................ 37
3.4 Semiconductor Optical Amplifier ............................................................................. 38
3.4.1 Basic network applications ................................................................................. 39
3.4.2 SOA nonlinearities .............................................................................................. 40
3.4.3 SOA gain saturation ............................................................................................ 41
3.5 Optical filter ............................................................................................................... 42
3.6 PIN photodiode .......................................................................................................... 43
3.7 Conclusion ................................................................................................................. 45
Chapter 4 - Simulation of 3G-UMTS system .............................................. 47
4.1 Introduction ............................................................................................................... 47
4.2 Simulation results ...................................................................................................... 50
4.2.1 Performance using multiple connections ............................................................ 51
4.2.2 Effects due to chirp ............................................................................................. 52
4.2.3 Effects due to the laser linewidth ........................................................................ 54
4.2.4 Effect of varying the laser power ........................................................................ 55

4.2.5 Performance using multiple E/O converters ....................................................... 57
4.3 Conclusion ................................................................................................................. 59
Chapter 5 - Implementation of a PON for RF signal transmission .......... 61
5.1 Introduction ................................................................................................................ 61
5.2 Components characterization on a RoF system ......................................................... 63
5.3 Single-channel RoF system with booster amplifier ................................................... 68
5.4 Multi-channel RoF system with booster amplifier .................................................... 75
5.5 Results comparison for single and multi channel ...................................................... 79
5.6 Conclusion ................................................................................................................. 80
Chapter 6 - Conclusions, contributions and future work ......................... 81
6.1 Conclusions ................................................................................................................ 81
6.2 Contributions ............................................................................................................. 83
6.3 Future work ................................................................................................................ 84
References ...................................................................................................... 87


i
List of Acronyms
BS Base Station
CDMA Code Division Multiple Access
DFB Distributed Feedback
EVM Error Vector Magnitude
FWM Four Wave Mixing
GVD Group Velocity Dispersion
ISI Intersymbol Interference
OFDM Orthogonal Frequency Division Multiplexing
OFDMA Orthogonal Frequency Division Multiple Access
PMD Polarization Mode Dispersion
PON Passive Optical Network
RAU Remote Antenna Unit
RF Radio Frequency
RoF Radio over Fiber
SBS Stimulated Brillouin Scattering
SF Spreading Factor
SGM Self Gain Modulation
SOA Semiconductor Optical Amplifier
SPM Self Phase Modulation
SRS Stimulated Raman Scattering
TDM Time Division Multiplexing
UMTS Universal Mobile Telecommunications System
WCDMA Wideband Code Division Multiple Access
WDM Wavelength Division Multiplexing
WiMAX Worldwide Interoperability for Microwave Access
WLAN Wireless Local Area Network
WMAN Wireless Metropolitan Area Networking
XGM Cross Gain Modulation
XPM Cross Phase Modulation

ii
List of Symbols
a Core radius
Aeff Mode’s effective area
b Normalized propagation constant
c Light velocity of vacuum
C Capacitor
D Dispersion parameter
Dcro Chromatic dispersion
Dm Material dispersion
Dwg Waveguide dispersion
E Electric field vector
fosc Oscillation frequency capable of being produced in the laser cavity
gth Laser gain condition
h Planck’s constant
Ip Photodiode current
Id Dark current
kB Boltzmann’s constant
L Inductor
Lf Fiber length
Lc Cavity length
m Number of longitudinal modes
N Number of propagating signals
n1 Core refractive index
n2 Cladding refractive index
nT Refractive index
nL Linear refractive index
nNL Non-linear refractive index
P(x) Optical power after propagating x km
P0 Optical power at the beginning of propagation
Pol Induced polarization
PolL Linear induced polarization

iii
PolNL Non-linear induced polarization
Po Incident optical power
q Electrical charge
R Resistance
ri Mirror’s reflectivity
T Total delay
TR Resistance temperature
Tc Chip period
Tb Bit period
V Normalized frequency
vg Group velocity
x Propagation distance
ℜ Responsivity
λ0 Central wavelength
η Quantum efficiency
φ Phase rotation
ε0 Vacuum permittivity
σT Differential group delay
γ Non-linear coefficient
αp Attenuation coefficient
αi Material absorption coefficient
β Phase propagation constant
ω Frequency of the emitted signal
ω0 Central frequency of the emitted signal
∆ Core-cladding refractive index difference
∆ω Frequency variation
∆T Delay variation
∆λ Wavelength variation
Ω Beat frequency


“I do not think that the wireless waves I
have discovered will have any practical
application”
Heinrich Rudolf Hertz, 1886.
Invented the prototype of what we call today a
Hertzian dipole


Chapter 1 | Introduction
Page | 1
Chapter 1
Introduction
1.1 Motivations
The continuous evolution of telecommunications on the last few decades has been
followed by the increase on the user’s needs for new applications. The growth on the
number of users is also related to the enormous success that internet brought together with
a new set of technologies that forced research for the next generations.
The exponential growth of requests leads to bandwidth exhaustion in some of the
currently used networks. Nowadays the technologies of fixed and wireless networks still
offer good solutions for a major part of the user needs, but killing applications requiring
high data rate transmission makes essential to use in advantage some of the already
existing solutions.
As result, some of the existing network architectures need many improvements to
adapt to the new realities. An example is the today’s hybrid fiber-coax (HFC) network that
links the operator’s base station (BS) by optical fiber not directly to the user’s home but to
a local station near it. The final link is made over coaxial cable that limits bandwidth and
data rate transmission. The infrastructures of these networks already exists in all residences

Carlos Almeida | UMTS, WLAN and WIMAX Radio Access over Fiber
Page | 2
or commercial buildings, making easy new installations but as the operators are already
offering solutions over its limits of bandwidth and data-rate a restructure of these networks
is a today’s challenge trying to bring fiber to the home.
Passive Optical Networks (PON) are presented as a promising technology for the
implementation of optical access networks allowing data rate transmission in the Gbit/s
range for each user with low cost [1]. Some architectures and methods have been
demonstrated such as time division multiplexing (TDM) and wavelength division
multiplexing (WDM) providing compatibility with the existing protocols such as Ethernet
and supporting asynchronous transfer mode (ATM) [2]. The basic concept of WDM
technology is the capability of simultaneously transmitting information in multiple
wavelengths on a single fiber, supplying a practical solution to the problem of the optic-
electronic-optic transition caused by commuting along the optical network. Thus a solution
that considers a total optical network to link the operator directly to the customer only over
simple fiber can bring some interesting advantages.
The commercial names of such architectures are ATM-PON, broadband PON
(BPON), Ethernet PON (E-PON) and WDM PON [3]. Among these solutions WDM
appears as the natural evolution for the actual transport networks, making possible an
immediate increase on the available capacity of today’s optical infrastructures, and
depending on the gradual user’s needs, offering among others advantages, raised data rate,
flexibility and security, being, however, potentially more expensive to implement due to
the cost of some optical components.
Besides fixed networks, wireless networks become an interesting and even more
auspicious target as they provide mobility together with some quality of service. The
mobile services offered make an extensive use of distributed antennas propagating
different radio frequency (RF) signals depending on the used technology. Overcoming the
RF spectrum limitations, cost and legislation is a serious problem that PON are ready to
help solving using optical fiber in advantage due to its high bandwidth.
The use of optical fiber links to distribute RF signals from a central location to Remote
Antenna Units (RAUs) is the basis of Radio over Fiber (RoF) technology. In
communication systems, RF signal processing functions such as frequency up-conversion,

carrier modulation, and multiplexing are performed at the BS, and immediately fed into the
antenna [4]. Thus, RAUs are
optoelectronic conversion and
1.2 Objectives
Considering the presented,
observe the effects of propagat
currently used.
Considering all the potential of RoF as a solution for many of the actual network
limitations, it can only be a reality if it is proven to be possible to implement in a cost
effective way. In Figure 1.1
share the same trunk fiber and can or not share one of the arms of the PON, depending on
the needs of the location/costumer. The losses of the PON splitting ration
compensated by a booster amplifier located at the central office.
Figure 1
The presence of several signals can limit the
make detection more difficult
performance and propagation
optical sources and amplifiers through
Chapter 1 |
Page | 3
modulation, and multiplexing are performed at the BS, and immediately fed into the
, RAUs are significantly simplified, as they only need to perform
ronic conversion and amplification functions.
Considering the presented, the main purpose of this work is to study RoF systems to
propagating in RF signals on some of the main technologies
ll the potential of RoF as a solution for many of the actual network
can only be a reality if it is proven to be possible to implement in a cost
.1 a possible setup is presented where one or more services will
e the same trunk fiber and can or not share one of the arms of the PON, depending on
the needs of the location/costumer. The losses of the PON splitting ration
compensated by a booster amplifier located at the central office.
Figure 1.1 – Block diagram of a possible scenario.
The presence of several signals can limit the propagation of RF signals as well as
more difficult. It is intended, in this work, to optimize the network
propagation of multi-format multi-wavelength signals
optical sources and amplifiers through long-haul transmission links.
Chapter 1 | Introduction
modulation, and multiplexing are performed at the BS, and immediately fed into the
simplified, as they only need to perform
study RoF systems to
some of the main technologies
ll the potential of RoF as a solution for many of the actual network
can only be a reality if it is proven to be possible to implement in a cost
presented where one or more services will
e the same trunk fiber and can or not share one of the arms of the PON, depending on
the needs of the location/costumer. The losses of the PON splitting ration may need to be
of RF signals as well as
to optimize the network
wavelength signals using low cost

Carlos Almeida | UMTS, WLAN and WIMAX Radio Access over Fiber
Page | 4
1.3 Structure
This document is divided in six chapters all related to RoF systems: its optical
components, the RF signals transmitted and practical implementations.
In this first chapter is presented the description of the context of this work and its main
proposed objectives together with the chapter division and the studied topics.
Second chapter describes more extensively RoF systems together with the study of RF
signals that correspond to some of the actual and emerging technologies. The signals
properties that will be preponderant to understand the performance in a RoF scenario are
presented.
To complement the described RoF system, in the third chapter the required optical
components for the experiments are presented, modeled and used to perform the simulation
work.
The fourth chapter presents the simulation results of a PON for the transmission of
UMTS-3G signal. The effect of multiple access and several devices properties are studied
with the purpose of understanding some of the facing problems that will affect the
laboratorial work.
In fifth chapter the implementation of a PON for RF signal transmission is presented
and analyzed in the presence of multi-format and multi-wavelength.
Finally, sixth chapter summarizes wok and draws the final conclusions of the
performed work, the achieved contributions and some future research directions.

Chapter 2 | Radio Communications
Page | 5
Chapter 2
Radio communications
2.1 Introduction
With the development of new generations on mobile communications, the need of a
fast and reliable connection that can transmit and receive “anytime, anywhere, and
anything” became an essential item. It is nowadays possible to cover areas with difficult
propagation conditions such as airport terminals, shopping centers and outdoor
applications like tunnels or highways due to the development of hybrid forms of
transmission that provide higher capacity, lower cost, lower power and easier installation.
Optical fiber appears to be the perfect solution to overcome some of these difficulties,
since is wide bandwidth, and quite low loss and high immunity to electromagnetic
influences. These conditions can be of help for radio communications to continue its
growth. These arguments make RoF a suitable technology for low propagation conditions
since the wide bandwidth can be multiplexed and distributed over space.
In this chapter RoF technologies are explored together with some mobile services and
local networks like UMTS, WLAN and WiMAX.

Carlos Almeida | UMTS, WLAN and WIMAX Radio Access over Fiber
Page | 6
2.2 Radio over Fiber
Radio waves are nowadays the most popular way to communicate, since they are used
in the very front end of every user, as they provide an extremely important facility:
mobility. On the other hand, the demand and increase of penetration of data and voice, has
pushed the operators into several developments and strategies to enable full time, space
and, whenever possible, bandwidth coverage to the users. This attitude leads the operators
and their suppliers to find all types of technical solutions that can make the three
aforementioned guidelines possible. Some of the challenges are, for example, to manage
bandwidth in highly dense sporadic places, (commercial centers, shows and sport games)
or to allow coverage in places where wave propagation is not easy [5].
PON’s are concurrently being deployed everywhere, in order to allow the operators to
arrive with better quality and in a transparent way to the customers’ home. Radio
distribution over PONs, sharing the media with other native services like G-PON, E-PON
and triple play, can be seen as a promising technique to overcome many of the RF
spectrum limitations. The signal distribution is also improved with the RF signals being
transmitted in their raw form to antennas eliminating some signal processing. Thus, the
transmission equipment will be more simplified and by using micro-cells the required
power level will be reduced, eliminating the need for expensive power amplifiers and
frequency multiplexers [6].
2.2.1 RoF technologies
The third generation of mobile communications makes an extensive use of microcells
allowing an increase on the number of users and also higher available channel bandwidth.
This, combined with the capacity of the optical fiber to interconnect a huge number of
microcells with high transmission rate, enhances the importance of the transmission of
radio signals over fiber, with simple optical to electrical conversion, followed by radiation
at RAU’s.
All the important processing functions such as coding, modulation, multiplexing and
upconversion are done at central location making possible the simplification of RAU’s that
will only contain optoelectronic conversion devices and amplifiers. The impact of this

Chapter 2 | Radio Communications
Page | 7
centralization helps in terms of low equipment and maintenance costs, making life easier
and cheaper for operators [6]. The use of RoF systems brings many advantages such as
enhanced microcellular coverage, higher capacity, lower power, lower cost and easier
installation.
During the last few years RoF cellular products have been developed by several
companies to solve some market problems. One challenge is to solve indoor propagation
limitations, which are currently solved by signals penetrating the walls from the outside.
This seems to be the lowest cost solution but brings many problems specially related with
the variability in the penetration loss and eventual decrease in the radiated power. In-
building coverage can be even more difficult in areas deeper inside where signal levels,
due to attenuation will be very low and with large time fluctuations and modified building.
To overcome these problems, a possible solution can be composed by a pickup antenna
mounted on the building roof linking to a repeater and an indoor antenna system. The latter
depends on the performance needs and can be composed by simple RAU or, if capacity is
important, may have dedicated base stations independent on the outdoor cell [6].
An example of success using radio over fiber systems is the Andrew’s Britecell
distributed antenna system developed for the Sidney Olympics in 2000. The BS’s were
housed in one building, and remote units were located throughout all venues. Single-mode
fiber (SMF) connected the remote units to a rack of electronics that was located with the
BS. The adaptive antenna selection became powerful as coverage could be switched
instantaneously between venues, depending on where the demand was coming from.
Comparing the Britecell system to cover this huge event to the one used 4 years later in
Athens Olympics not involving radio propagation over fiber, the results proved the
reliability and robustness of RoF. The poor connectivity verified in Athens lead to a dropp-
call rate around 20 %, which in Sidney 2000 was less than 1 % [7].
2.2.2 Advantages of using RoF in mobile communications
Distributed antenna systems provide an infrastructure with the potential for adaptive
antenna selection and adaptive channel allocation to increase the spectrum efficiency [6].
Some of the RoF advantages are:

Carlos Almeida | UMTS, WLAN and WIMAX Radio Access over Fiber
Page | 8
• Low RF power RAUs that mitigates the introduced interference and increases
the spectrum efficiency leading to easier network planning;
• Line-of-sight (LOS) operation, minimizing the multipath effects;
• Reduction in the number of handovers;
• Higher reliability and lower maintenance costs;
• Support for future broadband multimedia applications;
• Allowing multiple services on a single fiber.
2.3 UMTS
UMTS (Universal Mobile Telecommunications System) is a third generation mobile
service that allows high transmission data rate and provides multiple access. This service
was developed not to replace the 2G technologies like GSM, but having in account the fact
that forming a new technology would set free new frequency ranges of operation. The 3G
systems were designed to provide certain proposals like: provide compatibility with 2G
systems, have multimedia support, improve the system performance when compared to 2G
and 2.5G cellular systems and guarantees high speed data services ranging from 144 kbps
in wide-area mobile environments to 2 Mbps in fixed or in-building environments [8].
2.3.1 Physical layer: CDMA
The purpose of multiple access is to allow a number of users to share a common
channel. The most common types of multiple access techniques are FDMA (Frequency
Division Multiple Access) where the frequency band is divided in slots and TDMA (Time
Division Multiple Access) that allow users to use the channel for a predefined interval of
time. Another type of multiple access that gives the user the right to use both time and
frequency slots simultaneously is CDMA (Code Division Multiple Access). To make this
possible it is used a technique called Spread Spectrum, where each user is assigned a code
that spreads the signal bandwidth, in a way that only the same code at the receiver can
recover the signal.
The CDMA technology used by UMTS systems is commonly called wideband CDMA
or simply WCDMA. UMTS has also two schemes that are frequency division duplex

Chapter 2 | Radio Communications
Page | 9
(FDD) and time division duplex (TDD). The FDD operation mode provides simultaneous
radio transmission channels for mobiles and BS’s. At the BS, separate transmit and receive
antennas are used to accommodate separate uplink and downlink channels. At the mobile
unit, a single antenna is used for both transmission to and reception from the BS, and a
duplexer is used to enable the same antenna to be used for simultaneous transmission and
reception. On the other hand, TDD mode shares a single radio channel in time so that a
portion of the time is used to transmit from the BS to the mobile, and the remaining time is
used to transmit from the mobile to the BS. TDD is only feasible with digital transmission
formats and digital modulation, and is very sensitive to timing. The TD-CDMA uses this
TDD scheme
The 3G WCDMA and TD-CDMA characteristics are summarized on Table 2.1.
WCDMA TD-CDMA
Duplex scheme FDD TDD
Bit rate 3.84 Mbps 3.84 Mbps
Bandwidth 2 x 5 MHz paired 1 x 5 MHz unpaired
Spreading factor 4 - 256 1, 2, 4, 8, 16
Modulation technologies
QPSK QPSK
Power control Fast: every 667 us Slow: 100 cycles/s
Receiver RAKE Joint detection RAKE
(mobile station)
Table 2.1: WCDMA and TD-CDMA properties.
In CDMA there are two different ways of separating users depending on the
orthogonal or non orthogonal multiple access. The orthogonal CDMA (O-CDMA) requires
user’s synchronization that is assured if the codes assigned to the users are orthogonal
among them. The Walsh-Hadamard sequences are used in spread spectrum and have good
proprieties when used in O-CDMA. Walsh sequences are generated using the following
iterative method of constructing a Hadamard matrix (2.1).
(2.1)

Carlos Almeida | UMTS, WLAN and WIMAX Radio Access over Fiber
Page | 10
The starting condition of this process is H1=[0], and the Walsh-Hadamard sequences
are given by the rows of the Hadamard matrix [10]. The importance of these sequences is
based on the fact that they are used to form orthogonal codes with different spreading
factors. The importance of these proprieties is useful when signals with different spreading
factors need to share the same frequency channel; these codes are called Orthogonal
Variable Spreading Factor (OVSF). The main advantage of these codes is the fact that they
can eliminate the interference between users, based on the fact of being orthogonal, but
their auto-correlation function still does not have good characteristics. This fact may lead
to problems at the receiver to detect the beginning of the codeword when an external
synchronization isn´t used. This is the reason why Walsh-Hadamard codes can only be
used in synchronous CDMA.
The use of non orthogonal CDMA is based on the idea of reducing the interference
between users by using spread spectrum techniques instead of guarantee that the users are
orthogonal. The sequences used to perform this are PN sequences, usually the Gold codes
that have good cross-correlation proprieties. These codes have only three peaks in the
cross-correlation function, which means that despite the fact of not being totally
uncorrelated they can be used in CDMA to perform the separation of users. The fact of
presenting a single peak in the autocorrelation function explains why they are used in
asynchronous CDMA. Other proprieties of these codes also are being balanced allowing
uniform spreading of the signals energy through the spectrum.
2.3.2 Spread Spectrum techniques
In spread spectrum systems, the frequency spectrum of a data signal is spread using a
code uncorrelated with the signal, which in the other hand, is also used to demodulate it at
the receiver. As a result of this process the bandwidth of the signal after spreading is much
higher than the minimum required. The codes used for spreading need to have good cross-
correlation properties, so that the receiver is capable to select the desired signal. This
method has the property of allowing the unwanted signals with different spread codes to
get even more spread by the process, making them look like noise at the receiver.
There are several techniques of Spread Spectrum, and the most known are DS-SS
(Direct Sequence Spread Spectrum) and FH-SS (Frequency Hoping Spread Spectrum). In

Chapter 2 | Radio Communications
Page | 11
DS-SS a code with higher transmission rate is used to spread a data signal as shown in
Figure 2.1.
Figure 2.1: Direct Sequencing example.
The bits of the spreading code are called chips, and in Figure 2.1 a chip period is
represented by Tc and the period of one data bit as Tb.
This process has an associate gain called Spreading Factor (SF) that is defined as the
ratio between the information bit duration and the chip duration:
(2.2)
The gain also represents the number of chips contained in one data bit. So a higher
Spreading Factor means that are more codes available and, consequently, more users
allowed.
There are innumerous advantages of using spread spectrum, but the one with more
impact is the ability of rejecting narrowband interference. At the receiver when the signal
is again multiplied by the spreading code, all the interferences in the signal will be
spectrally spread and may appear like noise. The main problem of using DS-SS is the
Near-Far effect that is present in a situation where an interfering transmitter is much closer
to the receiver than the intended transmitter [9].
Another Spread Spectrum technique is Frequency Hopping where the carrier is
hopping according to a unique sequence. In this case the near far problem effect is not as
problematic as in DS-SS.
Carlos Almeida | UMTS, WLAN and WIMAX Radio Access over Fiber
Page | 12
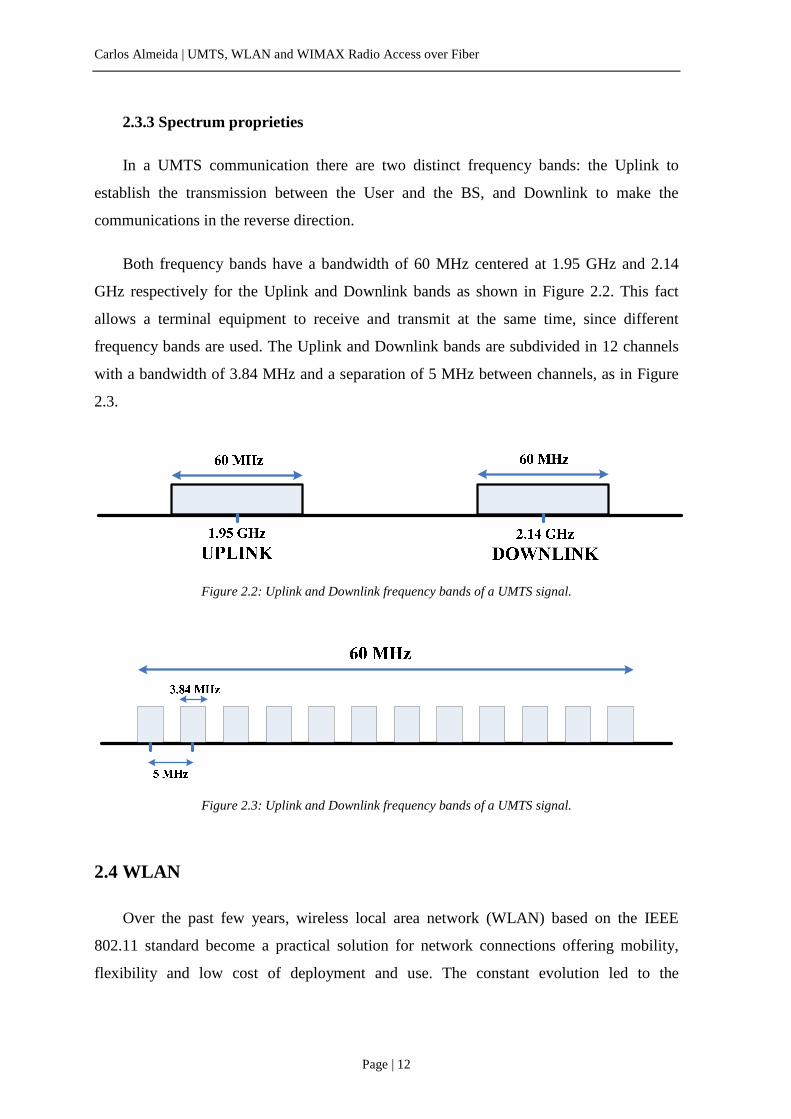
2.3.3 Spectrum proprieties
In a UMTS communication there are two distinct frequency bands: the Uplink to
establish the transmission between the User and the BS, and Downlink to make the
communications in the reverse direction.
Both frequency bands have a bandwidth of 60 MHz centered at 1.95 GHz and 2.14
GHz respectively for the Uplink and Downlink bands as shown in Figure 2.2. This fact
allows a terminal equipment to receive and transmit at the same time, since different
frequency bands are used. The Uplink and Downlink bands are subdivided in 12 channels
with a bandwidth of 3.84 MHz and a separation of 5 MHz between channels, as in Figure
2.3.
Figure 2.2: Uplink and Downlink frequency bands of a UMTS signal.
Figure 2.3: Uplink and Downlink frequency bands of a UMTS signal.
2.4 WLAN
Over the past few years, wireless local area network (WLAN) based on the IEEE
802.11 standard become a practical solution for network connections offering mobility,
flexibility and low cost of deployment and use. The constant evolution led to the
Chapter 2 | Radio Communications
Page | 13
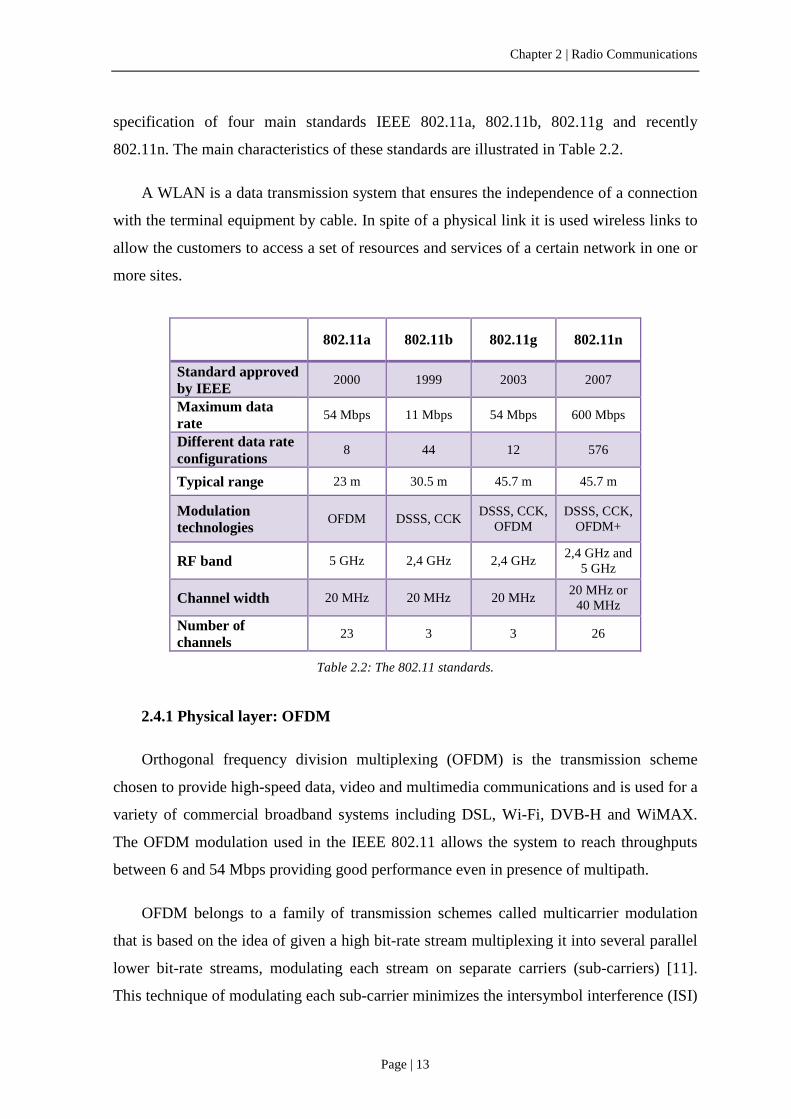
specification of four main standards IEEE 802.11a, 802.11b, 802.11g and recently
802.11n. The main characteristics of these standards are illustrated in Table 2.2.
A WLAN is a data transmission system that ensures the independence of a connection
with the terminal equipment by cable. In spite of a physical link it is used wireless links to
allow the customers to access a set of resources and services of a certain network in one or
more sites.
802.11a 802.11b 802.11g 802.11n
Standard approved by IEEE
2000 1999 2003 2007
Maximum data rate
54 Mbps 11 Mbps 54 Mbps 600 Mbps
Different data rate configurations
8 44 12 576
Typical range 23 m 30.5 m 45.7 m 45.7 m
Modulation technologies
OFDM DSSS, CCK DSSS, CCK,
OFDM DSSS, CCK,
OFDM+
RF band 5 GHz 2,4 GHz 2,4 GHz 2,4 GHz and
5 GHz
Channel width 20 MHz 20 MHz 20 MHz 20 MHz or 40 MHz
Number of channels
23 3 3 26
Table 2.2: The 802.11 standards.
2.4.1 Physical layer: OFDM
Orthogonal frequency division multiplexing (OFDM) is the transmission scheme
chosen to provide high-speed data, video and multimedia communications and is used for a
variety of commercial broadband systems including DSL, Wi-Fi, DVB-H and WiMAX.
The OFDM modulation used in the IEEE 802.11 allows the system to reach throughputs
between 6 and 54 Mbps providing good performance even in presence of multipath.
OFDM belongs to a family of transmission schemes called multicarrier modulation
that is based on the idea of given a high bit-rate stream multiplexing it into several parallel
lower bit-rate streams, modulating each stream on separate carriers (sub-carriers) [11].
This technique of modulating each sub-carrier minimizes the intersymbol interference (ISI)

Carlos Almeida | UMTS, WLAN and WIMAX Radio Access over Fiber
Page | 14
by making the symbol time large enough in order to the induced delays become
insignificant when compared to the symbol duration.
In OFDM the subcarriers are selected to be orthogonal among them, inducing spectral
efficiency. To eliminate completely the ISI guard intervals are used between symbols
according to the expected multipath delay spread. In the other hand, by making the guard
intervals larger this will imply a decrease on the bandwidth efficiency, that is lower as we
increase the symbol period so in fact is reduced by using more subcarriers.
Among all advantages of OFDM in high-speed transmission there are several ones that
can be referred:
• Low implementation complexity: OFDM can be easily implemented using
FFT/IFFT processing and its requirements grow when data-rate and bandwidth are
increased.
• Good performance with the growth of the delay spread: OFDM uses adaptive
modulation and coding, allowing the system to make the best choice available
considering the channel conditions. This is possible by using multiple subcarriers,
thus in a single-carrier system as the delay spread is higher more propagation errors
there will be.
• Using a multi-access scheme: In a multiple access scenario, the different OFDM
subcarriers are partitioned among the multiple users. This can be called OFDMA.
• Robustness for narrowband interference: The use of multiple subcarriers allows
OFDM being robust against narrowband interference in a way that the interference
will only affect a number of subcarriers.
• Easy coherent demodulation: Coherent demodulation is possible with power
efficiency doing pilot-based stimulation in OFDM systems.
A WLAN channel consists of 52 carriers of 300 KHz width that are divided into 48
carriers dedicated to the transport information and 4 carriers for the error correction pilot
carriers. OFDM supports a series of modulation and codes making it possible to offer the
whole set of throughputs [12].

Chapter 2 | Radio Communications
Page | 15
2.4.2 Transmission mechanism
The WLAN transmission chain is summarized by the diagram on Figure 2.4. First it is
executed an automatic mechanism of link adaptation choosing the throughput according to
the wireless link state. After this with the data frames ready they are rearranged according
to a jamming or scrambling procedure. The next step is applying a coding without
backward channel forward error correction (FEC) by adding redundancy and afterwards
mapping the coded bit into constellations of 1, 2, 4 or 6 point to reinforce protection. These
bytes are then assembled to form an OFDM symbol, and a carrier is assigned to each one.
The packet of the physical layer is thus built by adding the remaining fields [12].
Figure 2.4: WLAN transmission chain.
2.4.3 Operational modes
In the IEEE 802.11 standard are considered two types of components: a wireless client
station known as STA (generally a PC with a wireless network interface) and an access
point (AP) that functions as a bridge between the fixed network and the wireless network.
The AP acts similar as a basic station of a wireless network aggregating the multiple
wireless stations to the fixed network.
The operational modes considered by the 802.11 standard are: an infrastructure mode,
an ad hoc mode and a mesh mode. The infrastructure mode consists of at least an AP
connected to the fixed network infrastructure and a set of wireless client stations. This
configuration is based on a cellular architecture where the system is divided into cells.
Each cell is a basic service set (BSS) and is controlled by a BS.
Link
adaptation
Jamming or
ScramblingFEC Intervealing
Mapping OFDMPacket
FramingTransmission
DATA

Carlos Almeida | UMTS, WLAN and WIMAX Radio Access over Fiber
Page | 16
A WLAN can be composed only by a single cell with only one AP where the distances
between stations will be limited by factors like the RF power output and other propagation
conditions. When it is needed to cover a larger area multiple BSSs are used and the APs
are connected through a backbone called a distribution system (DS). A WLAN including at
least two different BSSs with their respective AP and the DS is seen as a single logical
IEEE 802 network to logical link control (LLC) level and is called an extended service set
(ESS). The data transfer occurs between stations within the BSS and also within the DS via
an AP. The example of two wireless networks containing the described components is
illustrated in Figure 2.5.
Figure 2.5: Infrastructure examples in IEEE 802.11.
The Ad hoc mode represents a group of IEEE 802.11 wireless stations that
communicate with each other without having a connection with an AP or with a fixed
network through a DS. Each station may communicate with any other station within the
cell that is called independent basic service set (IBSS). With this mode it is possible to
create a wireless network quickly where there are no fixed infrastructures. This fact can be
useful when there is no need of a fixed infrastructure or when the access to the
infrastructure is difficult or prohibited.
The third operational mode Mesh, is a hybrid configuration combining infrastructure
and ad hoc modes.

Chapter 2 | Radio Communications
Page | 17
2.5 WiMAX
The Worldwide Interoperability for Microwave Access (WiMAX) is based on wireless
metropolitan area networking (WMAN) standards developed by the IEEE 802.16 group.
WiMAX is a wireless broadband solution that offers a rich set of features that are mainly a
good resistance to multipath resultant of its physical layer, OFDM, the capacity of
supporting very high peak data rates and scale it easily with the available bandwidth,
having an adaptive modulation and coding that can change depending on the channel
conditions and consisting of a network architecture based on all-IP platform. The IEEE
802.16 standards are summarized in Table 2.3 by some of their characteristics.
802.16 802.16d 802.16e
Standard approved by IEEE
2001 2004 2005
Maximum data rate
120 Mbps 120 Mbps 15 Mbps
Typical range 1.6 to 48 km 40.8 km 1.6 to 4.8 km
Transmission scheme
Single carrier only
Single carrier, 256 OFDM or 2048
OFDM
Single carrier, 256 OFDM or scalable OFDM with
128, 512, 1,024, or 2,048 subcarriers
Modulation technologies
QPSK, 16QAM, 64 QAM
QPSK, 16QAM, 64 QAM
QPSK, 16QAM, 64 QAM
RF band 10 GHz - 66 GHz 2 GHz – 11 GHz 2GHz–11GHz for fixed; 2GHz–6GHz for mobile
applications
Channel band-width
20MHz, 25MHz, 28MHz
1.75MHz, 3.5MHz, 7 MHz, 14MHz, 1.25MHz, 5MHz, 10MHz, 15MHz,
8.75MHz
1.75MHz, 3.5MHz, 7MHz, 14MHz, 1.25MHz, 5MHz, 10MHz, 15MHz, 8.75MHz
Channel conditions
Fixed LOS Fixed NLOS Fixed and mobile NLOS
Table 2.3: The 802.16 standard characteristics.
2.5.1 Physical Layer: OFDM and OFDMA
The OFDM transmission technique was used in the 802.11 a/g for achieving rate
levels around 50 Mbps in an indoor multipath environment [11]. The WiMAX standards
have proposed various OFDM based methods for use in fixed and mobile solutions.

Carlos Almeida | UMTS, WLAN and WIMAX Radio Access over Fiber
Page | 18
The WiMAX fixed solution uses OFDM as physical layer that is described in 2.4.1,
but the mobile solution uses OFDMA that is based on OFDM operating at low bands in
non-line-of-sight conditions and is also similar in terms of symbols and procedures.
The OFDM subcarriers can be grouped together forming subchannels, allowing in
fixed WiMAX subchannelization in the Uplink band only. The standard defines a
maximum of 16 subchannels that can be assigned to a subscriber station (SS) in the Uplink.
Thus, the transmission by the SS’s can be done using only a fraction 1/16 of the allocated
bandwidth enhancing the system performance. Mobile WiMAX is based on OFDMA that
allows subchannelization in both the uplink and downlink, using a multiple access
mechanism to allocate different subchannels for different users. This means that a group of
subcarriers called a subchannel may be allocated in the downlink to a receiver and in
uplink it could be reserved to a given station.
In OFDMA systems, both time and frequency resources can be used to separate the
multiple user signals. Groups of OFDM symbols or groups of subcarriers are the units used
to separate the transmissions from multiple users [13]. In Figure 2.6, the time-frequency
view of a typical OFDM signal is shown for a three user’s scenario. The user’s signals are
separated either in the time-domain by using different OFDM symbols or in the subcarrier
domain.
The formation of subchannels can be done using either contiguous subcarriers or
pseudo-random subcarriers distributed along the frequency spectrum. The
subchannelization scheme based on contiguous subcarriers is called adaptive modulation
and coding (AMC). With this scheme subchannels are assigned to users based on their
frequency response giving multiuser diversity, but in the other hand loosing frequency
diversity. Thus, this is the mainly scheme used as each user is provided with a subchannel
that maximizes its signal interference plus noise ratio (SINR).

Chapter 2 | Radio Communications
Page | 19
Figure 2.6: Time-frequency view of an OFDMA signal [13].
2.5.2 Adaptive Modulation, Coding and Data Rates
Depending on the channel condition, as referred before, the WiMAX standard may
select from a variety of modulations and coding schemes supported the one that adapts
better. In mobile communications there is a feedback indicator that can provide the BS
with channel quality estimation. Thus the BS can take into account this estimation and
assign a modulation and coding scheme increasing the system capacity and robustness on
each link.
The modulation and coding schemes available are listed in Table 2.4 for the uplink
and downlink. Together with the channel bandwidth, modulation and coding have a
significant impact on the data-rate performance.
Downlink Uplink
Modulation BPSK, QPSK, 16-QAM, 64-QAM; BPSK optional for OFDMA-PHY
BPSK, QPSK, 16-QAM; 64-QAM optional
Coding
Mandatory: convolutional codes at rate 1/2, 2/3, 3/4, 5/6; Optional: convolutional turbo codes at rate 1/2, 2/3, 3/4, 5/6; Repetition codes at rate 1/2, 1/3, 1/6; LDPC, RS-codes for OFDM-PHY
Mandatory: convolutional codes at rate 1/2, 2/3, 3/4, 5/6; Optional: convolutional turbo codes at rate 1/2, 2/3, 3/4, 5/6; Repetition codes at rate 1/2, 1/3, 1/6; LDPC
Table 2.4: Modulation and coding supported by WiMAX [11].

Carlos Almeida | UMTS, WLAN and WIMAX Radio Access over Fiber
Page | 20
2.5.3 Operational modes
Currently the IEEE 802.16 offers two use cases that are fixed backhaul and cellular
like system. A mesh interconnection between these two architectures is an emerging
solution.
The first use case is based on fixed IEEE 802.16 equipment and can be used in the
deployment of point-to-point connections that can reach tens of km in a fixed infrastructure
or developing local loop alternatives to ADSL where the receivers are located inside each
costumer location in point-to-multipoint applications. The largest application proposed for
WiMAX is the broadband access for residential, small office/home office (SOHO) and
small to medium enterprise (SME) markets. Broadband services provided using fixed
WiMAX could include high-speed internet access, telephony services using voice over IP,
and a host of other Internet-based applications. Fixed wireless offers several advantages
over traditional wired solutions. These advantages include lower entry and deployment
costs; faster and easier deployment and revenue realization; ability to build out the network
as needed; lower operational costs for network maintenance, management, and operation;
and independence from the incumbent carriers [11].
Although initial WiMAX deployments are likely to be for fixed applications, the full
potential of WiMAX will be realized only when used for innovative nomadic and mobile
broadband applications. WiMAX technology in its IEEE 802.16e-2005 standard will likely
be deployed by fixed operators to capture part of the wireless mobility value chain in
addition to plain broadband access. As end users get accustomed to high-speed broadband
at home and work, they will demand similar services in a nomadic or mobile context, and
many service providers could use WiMAX to meet this demand [12].
2.6 Comparison of UMTS, WLAN and WiMAX technologies
The UMTS, WLAN and WiMAX services were analyzed describing each physical
layer used and the main operation modes utilized, among other properties. Comparing the
three technologies some conclusions can be taken considering the physical layer used and
the data rates and bandwidth provided.

Chapter 2 | Radio Communications
Page | 21
The WiMAX technology defines a selectable channel bandwidth from 1.25 MHz to 20
MHz which allows a flexible deployment, instead of the imposed fixed channel bandwidth
of 3G systems. In terms of data rates, the WLAN and WiMAX modulation used, OFDM,
allows them to support very high peak rates when compared to UMTS that by using
CDMA and spreading processes makes more difficult to reach higher data rates. More
important than the peak data rate offered over an individual link, is the average throughput
and overall system capacity when deployed in a multi-cellular environment. From a
capacity standpoint, the more pertinent measure of system performance is spectral
efficiency and WiMAX can achieve spectral efficiencies higher than what is typically
achieved in 3G systems. The fact that WiMAX specifications accommodated multiple
antennas right from the start gives it a boost in spectral efficiency. In 3G systems, on the
other hand, multiple-antenna support is being added in the form of revisions [11]. WLAN
and WiMAX OFDM also make it easier to exploit frequency diversity and multiuser
diversity to improve capacity when compared to UMTS.
In terms of supporting IP applications, such as voice, video, and multimedia WiMAX
and WLAN have a media access control layer s capable of supporting a variety of traffic
mixes, including real-time and non-real-time constant bit rate and variable bit rate traffic,
while 3G present’s solutions designed for a variety of QoS levels. In terms of the IP
architecture it simplifies the WiMAX core network, while 3G has a complex and separate
core network for voice and data [11].
The WiMAX capabilities of supporting roaming and high-speed vehicular mobility are
somehow unproven when compared to the 3G features. In fact mobility was an integral
part of the 3G design, while WiMAX and WLAN were designed for fixed solution, with
mobility capabilities developed as an extra feature.
2.7 Conclusion
This chapter described the fundaments and utilizations of RoF technologies for
cellular radio communications systems. The advantages of PON to overcome many of the
RF spectrum limitations were presented together with the characteristics and requirements
of emerging technologies for fixed and mobile services.

Carlos Almeida | UMTS, WLAN and WIMAX Radio Access over Fiber
Page | 22
The study of UMTS, WLAN and WiMAX showed the main applications of each
technology and the specifications provided by each standard, as well the continuous
evolution that is being made. The comparison between the technologies based on its
physical layer characteristics and the performance in terms of bandwidth and data-rate,
shown the preponderance of the WiMAX solution in terms of high peak data-rate’s and
propagation distances.
With the research evolution on RF technologies and the important role that RoF can
play in cellular communications, testing a PON to transmit these RF signals seems to be an
important task.

Chapter 3 | Optical components of a RoF system
Page | 23
Chapter 3
Optical components of a RoF system
3.1 Introduction
The large bandwidth of optical fiber is being used in advantage to overcome some
difficulties on radio signals distribution. The deployment of PON’s is becoming a
generally accepted solution providing and overcoming many spectrum limitations of the
radio signals. To understand the reasons that make PON’s a good solution for many
network applications including RoF it is important to know some of its constituent devices.
In this chapter are analyzed the optical components used in the RoF setups tested in the
following chapters.
Besides the importance of having a transmission channel that provides high bandwidth
(optical fiber) another important component for optical communications is a light radiation
source. The semiconductor laser (light amplification by stimulated emission of radiation)
provides high power outputs with a narrow-linewidth radiation and a better coupling of the
light to the fiber when compared to other light sources such as LED’s (Light Emitting
Diode). In this chapter we also analyze other electro-optic components such as optical
amplifiers, optical filters and optical receivers that have important roles forming a PON.
Carlos Almeida | UMTS, WLAN and WIMAX Radio Access over Fiber
Page | 24
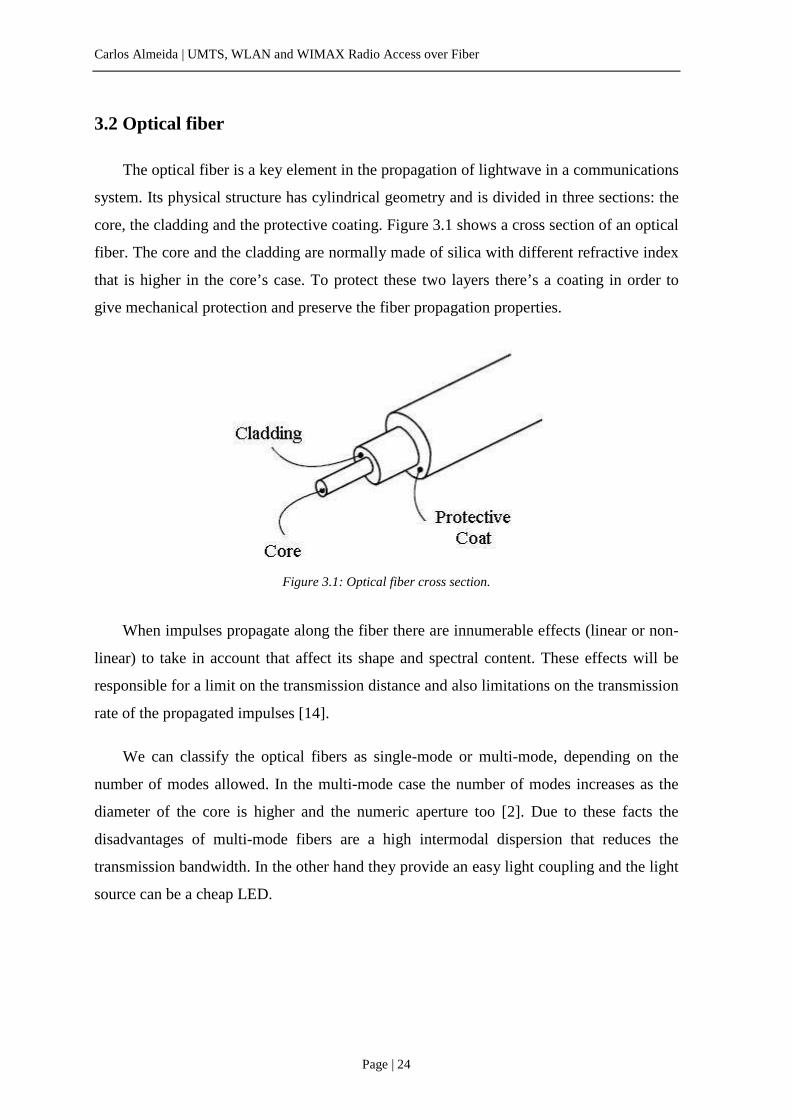
3.2 Optical fiber
The optical fiber is a key element in the propagation of lightwave in a communications
system. Its physical structure has cylindrical geometry and is divided in three sections: the
core, the cladding and the protective coating. Figure 3.1 shows a cross section of an optical
fiber. The core and the cladding are normally made of silica with different refractive index
that is higher in the core’s case. To protect these two layers there’s a coating in order to
give mechanical protection and preserve the fiber propagation properties.
Figure 3.1: Optical fiber cross section.
When impulses propagate along the fiber there are innumerable effects (linear or non-
linear) to take in account that affect its shape and spectral content. These effects will be
responsible for a limit on the transmission distance and also limitations on the transmission
rate of the propagated impulses [14].
We can classify the optical fibers as single-mode or multi-mode, depending on the
number of modes allowed. In the multi-mode case the number of modes increases as the
diameter of the core is higher and the numeric aperture too [2]. Due to these facts the
disadvantages of multi-mode fibers are a high intermodal dispersion that reduces the
transmission bandwidth. In the other hand they provide an easy light coupling and the light
source can be a cheap LED.

Chapter 3 | Optical components of a RoF system
Page | 25
3.2.1 Linear properties
The more important linear properties of the optical fiber are attenuation and chromatic
dispersion that depend on the propagation wavelength among various factors. Attenuation
of a light signal as it propagates along a fiber is an important factor to take in account when
determining the maximum transmission distance between two points, fulfilling certain
requisites. Dispersion is the pulse spreading that occurs when propagating along the fiber,
making harder the signal’s recovery, leading to a signal to noise ratio (SNR) reduction.
Depending on the number of modes of the optical fiber it can be divided in intramodal
dispersion and intermodal dispersion. Intramodal or chromatic dispersion occurs within a
single mode and intermodal dispersion only in multi-mode fibers.
3.2.1.1 Attenuation
Attenuation quantifies the optical signal power losses during the signal transmission
through fiber. The optical impulses suffer attenuation according to an exponential law
depending in the distance x as described in (3.1).
. !"·$ (3.1)
Where αp is the attenuation coefficient of the fiber expressed in km-1 and P0 is the optical
power when starting the propagation. To determine the optical signal attenuation in a fiber,
the common procedure is to express it in dB/km as in (3.2).
%&' ()⁄ +$ · log ./
/$0 4.343 · %3 () + (3.2)
This linear parameter of an optic fiber depends of several variables like the
propagating wavelength as shown in Figure 3.2. The attenuation can be mainly caused by
absorption, scattering and radiation losses. Absorption losses can be caused by three
different mechanisms [15]:
• Absorption by atomic defects in the glass composition;
• Extrinsic absorption by impurity atoms in the glass material;
• Intrinsic absorption by the basic constituent atoms of the fiber material.

Carlos Almeida | UMTS, WLAN and WIMAX Radio Access over Fiber
Page | 26
Figure 3.2: Optical fiber attenuation as a function of wavelength.
The scattering losses are due to microscopic variations in the material density caused
by compositional fluctuations and defects occurred during the fiber manufacture. These
losses can be divided in three types: Rayleigh, Brioullin and Raman scattering. The first is
due to fluctuations of the silica’s (fibers constituting material) density which translate into
refractive index variations. Brioullin and Raman appear when the power level inside the
fiber overcomes a given threshold.
Finally, radiation losses occur when the propagation wave goes through a bend of
finite radius or curvature [16][17]. The existence of irregularities on the core-cladding
interface and micro-bendings is also the cause of this type of losses.
Attenuation can be problematic in long-haul transmission links, introducing
considerable power losses, despite the fact that in the third window attenuation per km was
significantly reduced. In a RoF scenario detecting optical signals RF modulated with low
power is not easy, even considering the high sensibility of photodiodes and some
amplification schemes that are included in commercial models. The use of optical
amplifiers is a valid solution to compensate fiber losses and is commonly used in optical
networks.
3.2.1.2 Chromatic Dispersion
The intramodal dispersion or chromatic dispersion is the pulse spreading that occurs
within a single mode. This phenomenon is also known as group velocity dispersion
(GVD), since it is a result of the group velocity being a function of the wavelength, so

Chapter 3 | Optical components of a RoF system
Page | 27
different spectral components travel at different speeds inside the fiber. An increase on the
spectral width of the optical source will result on signal distortion caused by GVD.
The chromatic dispersion has two components: material dispersion and waveguide
dispersion. The first occurs because the silica’s refractive index changes with frequency,
causing a wavelength dependence of the group velocity for any given mode. The second is
related to how the energy is distributed between the core and the cladding, because only 80
percent of the optical power is confined to the core [15]. Thus, the 20 percent of the light
that is propagated through the cladding travels faster than the light confined to the core.
This makes intramodal dispersion dependent on the optical fiber dimensions.
For an optical fiber of length Lf, a spectral component with frequency w would reach
the other end of the fiber with a total delay of 4 5678 (3.3), where vg is the group velocity
given by:
9: +;< ;=⁄ (3.4)
β is the phase propagation constant.
Consequently, the variation of the delay for a frequency variation of ∆ω, is given by:
∆4 ;;= · ∆? ;
;= · @56A8B · ∆? CD · ;E<
;=E · ∆? (3.5)
Since ω=2π.c/λ0 and ∆ω=(-2 π/λ02) ∆λ in terms of wavelength ∆T is given by:
∆4 ;;FG · @56
A8B · ∆λ CD · I · ∆λ (3.6)
Where, I ;;FG · @ +
A8B (3.7) is the dispersion parameter expressed in ps/(km.nm).
Therefore, by knowing this parameter, for a fiber of length Lf and a light source with
spectral width ∆λ, it is possible to determine the optical pulses broadening. This is a linear
approximation since D was determined by using the group delay derivative in (3.4). The
formula that relates this parameter with the fiber’s dimensions is:

Carlos Almeida | UMTS, WLAN and WIMAX Radio Access over Fiber
Page | 28
IJKL IM N IO: P QGJ
;ER;QGE
P R∆JQG S ;ET7
;7E (3.8)
Where ∆ R ER (3.9) is the core-cladding index difference and S U·V
FG · WX+ P X
(3.10) is the normalized frequency, n1 represents the core refractive index, n2 the cladding
refractive index, b the normalized propagation constant and a is the cores radius.
In (3.8) Dm corresponds to the material dispersion, as Dwg corresponds to the
waveguide dispersion. The possible variation of these of these two components with the
wavelength for a single-mode fiber is shown in Figure 3.3.
Fig. 3.3: Material Dispersion and Waveguide Dispersion versus wavelength [24].
In RoF systems, dispersion is not considered one of the main limitation factors due to
the fact of radio waves not presenting data rates that would implicate a significant decrease
on the SNR and consequently considerable ISI, limiting the signals transmission.
3.2.1.3 Polarization mode dispersion
An optical signal can be considered as the overlapping of two linear modes
orthogonally polarized. Ideally the two modes propagate with identical velocities due to
the circular symmetry of a waveguide, maintaining the same light polarization along
propagation. In fact, when light travels along a SMF its polarization varies due to physical
imperfections during the production process. Thus, the two orthogonal modes present
different propagation velocities, phenomena called birefringence.

Chapter 3 | Optical components of a RoF system
Page | 29
The main effect caused by birefringence is the polarization mode dispersion (PMD)
that leads to the time broadening of pulses and consequently to an ISI increase, penalizing
the system performance. PMD is described by DPMD parameter defined in (3.11).
I/YZ [\W56
(3.11)
Where Lf is the propagation distance and σT the mean value of the differential group delay.
In single mode fibers operating near 1550 nm the temporal broadening introduced by
PMD is not relevant as the effect of GVD, but can also be critical in high-rate long-haul
transmission links [15].
3.2.2 Non-linear properties
The non-linear effects occur due to the non-linearity response of optical fiber to high
power optical signals. These effects can be divided in two categories: the modulation of the
refractive index due to intensity variations of the signal’s power and the stimulated
dispersion due to interactions between optical signals and vibrations.
When an electric field is applied to a dielectric material the electrons and the nucleuses
of the molecules are subjected to opposite forces which lead to the molecules polarization.
This also happens in an optical fiber. Polarization can be characterized by two components
a linear one due to the first order susceptibility and a non-linear component due to the third
order susceptibility.
The non-linear part of polarization becomes particularly important for high optical
powers. The non-linear effects taken into account are only the ones due to the third order
susceptibility, since the effects of the second order susceptibility can be ignored for the
contemporary single-mode fibers [18].
As consequence of non-linear polarization the refractive index also exhibits a non-
linear behavior:
X], X5] N X_5 /`a66
(3.12)

Carlos Almeida | UMTS, WLAN and WIMAX Radio Access over Fiber
Page | 30
X–Refractive index
X5 – Linear Refractive index
X_5 – Non-linear refractive index
Aeff – Mode’s effective area
P – Optical power
The variations in the refractive index induce variations in the phase propagation
constant, as shows the following equation:
bc], b] N d · (3.13)
Where d is the non linear coefficient given by d ef·OGJ·`a66
(3.14)
The non linear refractive index can originate phenomena’s like self phase modulation
(SPM), cross phase modulation (XPM) and four wave mixing (FWM).
Besides these nonlinear effects proceeding from third order susceptibility classified as
elastic, due to not involving energy exchanges between the electromagnetic field and the
dielectric medium, there are other nonlinear effects where a part of the light energy is
transferred to the fiber exciting the silica vibrational modes [19]. These are considered
non-elastic effects that can be divided into two important phenomena’s the stimulated
Brillouin scattering (SBS) and the Stimulated Raman scattering (SRS) that in point to point
communications considering moderate bandwidth and power can be disdained [20].
3.2.2.1 Self phase modulation
The variation of an optical signal power leads to variations in the refractive index that
modify the phase propagation constant as it can be verified by (3.13). Thus, the amplitude
modulation of an optical signal is converted by the nonlinearities of the refractive index in
phase variations that causes variation on the optical frequency [19].
Time variations on the signal’s power create a SPM effect that can be understood as a
chirp contribution to the laser source. The SPM effect penalizes a system by causing an
increase on the channel bandwidth and a temporal broadening of pulses due to GVD.
The electrical field during the propagation acquires a non-linear phase shift given by:

Chapter 3 | Optical components of a RoF system
Page | 31
g_5h, i d · h, i · h (3.15)
Where P(z,t) is the optical power of the pulses.
This shift leads to variations on the instantaneous frequency along the impulse [14].
Thus, in the ascendant part of the impulse, the wavelength is expanded and in the
descendant zone it is compressed.
3.2.2.2 Cross phase modulation
When more than one optical signal is propagated along fiber, the dependence of the
refractive index on the signals power variation leads to phase variations and consequently
frequency variations of the optical signal that can be caused not only by the amplitude
variation of one signal but by the effects of the remain signals on it.
The chirp contribution on the optical signal caused by SPM can also be extended to a
WDM system where the channels power variation can create a frequency variation that
increases with the number of channels called XPM, becoming one of the important
limitations on WDM systems [21].
The non-linear phase of each of the propagating signals is proportional to the power of
the other signal as demonstrated in (3.16). Comparing this result with the verified in SPM,
the contribution to the variation of the non-linear phase is double in the XPM case.
g_5,jh, i d · kjh, i N 2 · m jh, in · h (3.16)
RoF systems using directly modulated lasers will be affected by refractive index
variations due to power variations of the incident signal that may lead to SPM or XPM
effects depending on the considered channels. These limitations induced by the fiber
nonlinearities are responsible by phase shifts that affect the radio signal propagation,
especially the frequency modulated.
3.2.2.3 Four wave mixing
In SPM and XPM the undesired effects are due to the dependence between the
refractive index and variations of the signals power producing a phase modulation. In

Carlos Almeida | UMTS, WLAN and WIMAX Radio Access over Fiber
Page | 32
FWM the existence of multiple channels can lead to power changes between frequencies
and the possibility of generating new frequencies as a result of the beatings of the different
channels.
The interaction of more than one optical signal in a WDM system originates new
optical signals corresponding to the frequency beatings three on three. The generic formula
that represents the number of signals created by FWM due to the interaction between N
signals is given by (3.15). In Figure 3.4 is illustrated the frequencies originated by four
optical channels in a WDM system.
opqY + om P o (3.15)
In a WDM system constituted by multiple channels, the new frequencies created by
FWM can sometimes overlap other channel frequencies degrading the system performance
by crosstalk [22][23]. This effect of phase matching can be the nonlinear predominant
effect in dispersion shifted fibers (DSF) [22], but becomes insignificant on SMF’s
operating in third window where the existing dispersion minimizes the FWM effect
[14][21].
Figure 3.4: FWM products created by 4 channels with frequencies corresponding to the positions 1, 2, 3 and
4. Under each signal are the indices of the signals used in the combination [14].
3.2.2.4 Others
As referred before, besides the effects related to the refractive index modulation there
are also two important phenomena’s: SBS and SRS. The origin of SBS and SRS is similar

Chapter 3 | Optical components of a RoF system
Page | 33
differing in the fact of SRS being related to optical phonons and SBS to acoustic phonons.
Both effects contribute lo power losses of the transmitted optical signal depending on the
intensity of the electromagnetic field propagated. For lower levels of the signal transmitted
these nonlinear effects are mitigated, only becoming relevant above a determine threshold
[24].
3.3 Laser
In optical communications the light source mostly used is a semiconductor laser diode.
When compared to other optical sources, laser diodes generate high power outputs with a
narrow-linewidth radiation, providing a better coupling of the light to the fiber and have
greater bandwidth when compared to LED’s.
The elements that constitute a semiconductor laser are an active laser medium that is
constituted by atoms, molecules and ions capable of emitting radiation, an external energy
pump source to stimulate the atoms in the active medium, and a resonant optical cavity
formed by mirrors where the photons are constantly reflected.
The four main laser types are the Fabry-Perot (FP) laser, the distributed feedback
(DFB) laser, tunable lasers and the vertical cavity surface-emitting laser (VCSEL). The FP
laser has a lasing cavity define by two end faces acting like reflecting mirrors. Since the
cavity is fairly long, the laser will oscillate simultaneously in several modes or frequencies
creating a spectral broad output that does not make the FP laser a good solution for high-
speed or long-haul transmissions. In a DFB laser, a series of closely spaced reflectors
provide the light feedback throughout the cavity making possible that light will only
oscillate in a single mode, with very narrow linewidth. For multi-wavelength networks
where many lasers are used to transmit in closely spaced wavelengths on the same fiber,
the ability of tuning a precisely wavelength for each channel leads to the importance of
using tunable lasers. At last the VCSEL consists of a stack of up to 30 thin mirroring layers
placed on both sides of a semiconductor wafer to form a lasing cavity [18]. The
manufacture of these lasers is difficult, but they provide easy and highly efficient coupling
into optical fibers.

Carlos Almeida | UMTS, WLAN and WIMAX Radio Access over Fiber
Page | 34
3.3.1 Laser biasing
The basic principles of a laser operation are the result of three main processes: photon
absorption, spontaneous emission and stimulated emission. Figure 3.5 summarizes these
processes. When a photon with energy hν enters the laser cavity an electron on state E1 can
absorb its energy and excites to the E2 state. If this state is unstable, the electron will return
quickly to the origin state emitting a photon with energy hν. When a photon is emitted
without external stimulation this phenomenon is called spontaneous emission. The other
situation is stimulated emission that only occurs when the electron is stimulated by an
external source originating a new photon in phase with the first used to stimulate.
A laser diode is essentially an oscillator with amplification, feedback and frequency
selection mechanisms. Only the frequencies fosc that verify the following condition can be
produced by the cavity:
rLsJ M·J5 , ) 1,2 … (3.16)
Where Lc is the cavity length.
This is the necessary condition for all the photons to add in phase. To each value m, a
corresponding longitudinal mode exists. Although there are numerous possible modes,
only for those which the cavity’s material presents a gain higher than a given threshold will
be produced. The higher the number of modes that fulfil this condition, the higher will the
laser’s spectral width.
Figure 3.5: Schematic illustration of the main operation processes of a laser: a) spontaneous emission, b)
stimulated emission, c) absorption.
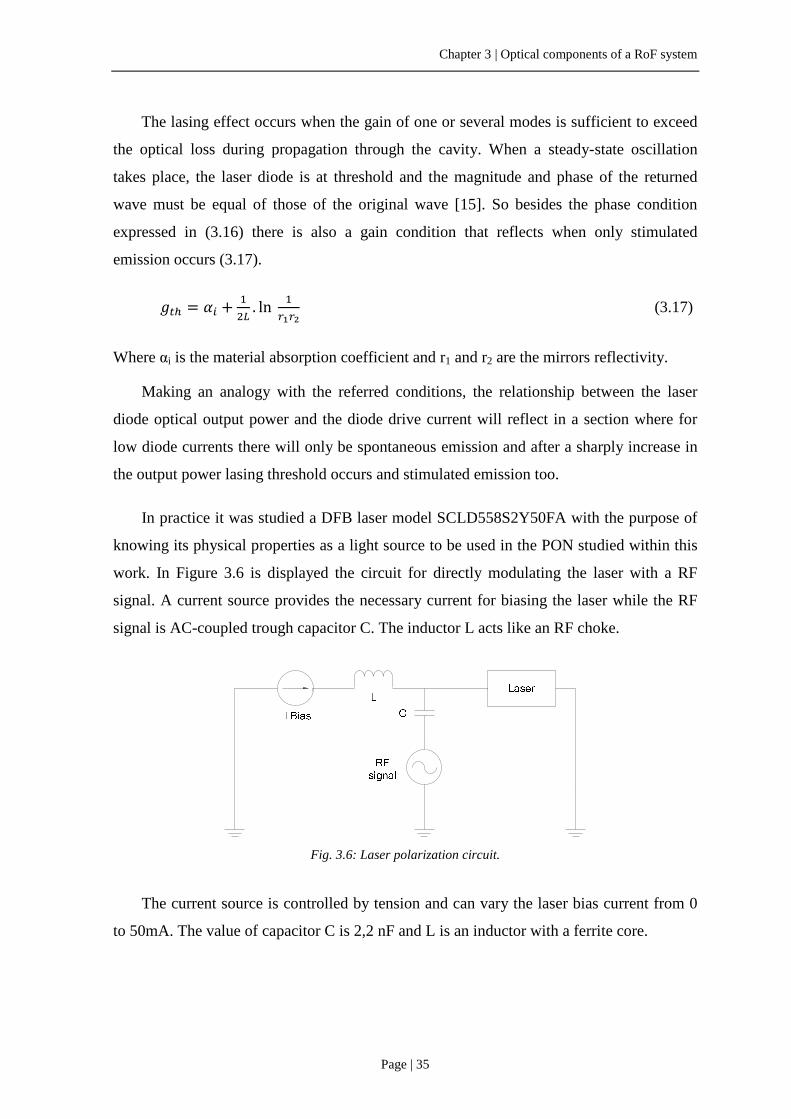
Chapter 3 | Optical components of a RoF system
Page | 35
The lasing effect occurs when the gain of one or several modes is sufficient to exceed
the optical loss during propagation through the cavity. When a steady-state oscillation
takes place, the laser diode is at threshold and the magnitude and phase of the returned
wave must be equal of those of the original wave [15]. So besides the phase condition
expressed in (3.16) there is also a gain condition that reflects when only stimulated
emission occurs (3.17).
vwx %j N +5 . ln +
KRKE (3.17)
Where αi is the material absorption coefficient and r1 and r2 are the mirrors reflectivity.
Making an analogy with the referred conditions, the relationship between the laser
diode optical output power and the diode drive current will reflect in a section where for
low diode currents there will only be spontaneous emission and after a sharply increase in
the output power lasing threshold occurs and stimulated emission too.
In practice it was studied a DFB laser model SCLD558S2Y50FA with the purpose of
knowing its physical properties as a light source to be used in the PON studied within this
work. In Figure 3.6 is displayed the circuit for directly modulating the laser with a RF
signal. A current source provides the necessary current for biasing the laser while the RF
signal is AC-coupled trough capacitor C. The inductor L acts like an RF choke.
Fig. 3.6: Laser polarization circuit.
The current source is controlled by tension and can vary the laser bias current from 0
to 50mA. The value of capacitor C is 2,2 nF and L is an inductor with a ferrite core.

Carlos Almeida | UMTS, WLAN and WIMAX Radio Access over Fiber
Page | 36
The optical output power of the laser for its different biasing currents is presented in
Figure 3.7 and as it can be observed the laser’s threshold occurs for a biasing current of 8
mA. Thus, for biasing currents above this value the light emitted is essentially due to
spontaneous emission. When modulating this laser it is important to take this fact in
account because for biasing currents below 8 mA the laser is not already in its linear
region, thus not stabilized.
Figure 3.7: Laser output power versus biasing current
3.3.2 Modulation of laser diodes
An important process in optical communications is the modulation of a laser diode to
transmit information on a light stream. To realize this proposal it can be used two forms of
modulating the laser: directly varying the laser drive current to vary the output optical
power of the laser or use external modulation to vary the steady optical power level
emitted by the laser.
Usually external modulation is used in systems that transmit information at high rates
(> 2.5 Gbps) in order to minimize the undesirable non-linear effects such as chirping [15].
When using direct modulation the limitations on the transmission rate are related to the
spontaneous and stimulated carrier lifetimes and the photon lifetime.
0
0,5
1
1,5
2
2,5
3
3,5
0 5 10 15 20 25 30 35 40
Pou
t (m
W)
Current (mA)

Chapter 3 | Optical components of a RoF system
Page | 37
3.3.3 Linewidth and chirp
The laser linewidth is an important factor when using it as an optical source for
transmitting signals in optical systems. When considering the transmission on a WDM
system the laser linewidth will depend on the chirp [19]. Chirp consists on the undesirable
frequency variation of the emitted light that leads to an increase on the bandwidth of each
signal. Thus, in a WDM system to avoid channels overlapping, the solution is to choose
frequencies more spaced among them.
Chirp can also be problematic when joined with chromatic dispersion, leading to the
pulses broadening creating ISI that penalizes the system performance. For directly
modulated lasers, chirp is in fact a problem to take in account and can be reduced by
controlling the biasing current of the laser [25] or using an external Bragg grating [26]. If
external modulation is possible, by operating the laser in continuous chirp effect is reduced
and as referred before higher transmission rates are possible.
The DFB laser spectrum obtained in an optical spectrum analyzer (OSA) model Apex
AP2441A for a biasing current of 20 mA is displayed in Figure 3.8. With the result obtain
we can affirm that the main spectral component of the laser is at 1549.76 nm and that the
maximum wavelengths near the center have less 40 dB. The variation of the center
wavelength of the laser when compared with the specified for the model (1550 nm) can be
explained by the non existence of a temperature control system and some chirp produced.
Figure 3.8: Optical spectrum of the laser for a biasing current of 20 mA.

Carlos Almeida | UMTS, WLAN and WIMAX Radio Access over Fiber
Page | 38
3.4 Semiconductor Optical Amplifier
The growth in the deployment and capacity of optical communication networks has
been made possible by the usage of optical amplifiers. The simple utilization of these
devices to amplify signals in order to compensate the fiber losses, evolved to supply other
needs of optical communications networks. The advances on the manufacture techniques
and design device of semiconductor optical amplifiers (SOA) made possible other
utilizations of an optical amplifier such as optical switching and wavelength conversion.
Another interesting usage of SOA is to amplify modulated light signals in optical
communication networks.
SOA is a device driven by an electrical current that amplifies the optical signal via
stimulated emission in the active region. Within this process it is introduced noise to the
system that is called amplified spontaneous emission (ASE) noise.
The gain of an SOA is influenced by the input signal power, in fact as its power
increases the gain will decrease due to the amplifier saturation. The gain saturation is a
serious problem because it can cause signal distortion making difficult the signals
transmission. In fact the reason to this problem is that the amplifier gain dynamics is not a
slow process. In SOAs the gain dynamics is determined by the carrier recombination
lifetime (few hundred picoseconds), this means that the amplifier gain will react relatively
quickly to changes in the input signal power. This dynamic gain can cause problems that
become more severe as the modulated signal bandwidth increases. These effects are even
more important in multi-channel systems where the dynamic gain leads to interchannel
crosstalk. In contrast, optical fiber amplifiers present recombination lifetimes of the order
of milliseconds leading to negligible signal distortion [27].
Not having a linear behavior is also another problem of SOA that can cause problems
such as frequency chirping and generation of intermodulation products. These facts may be
problematic in most situations but are also used in advantage when per example
wavelength conversion is needed.

Chapter 3 | Optical components of a RoF system
Page | 39
3.4.1 Basic network applications
The applications of SOA in optical communications networks can be divided into
three principal functions: booster amplifier to increase transmitter laser power, in-line
amplifier to compensate losses due to the transmission through fiber links and preamplifier
to improve the receiver sensitivity. These applications are illustrated in Figure 3.9.
Figure 3.9: SOA functions on optical communication networks.
Boosting laser power is used when the construction of medium and long-hauls is
needed providing high transmission distances and good power budget respectively. Not
involving active components in the transmission links improves the system performance
and reliability. In distribution networks, SOA is also a good solution to solve the losses
caused by many splitting, being important in WDM transmission.
Preamplifiers provide an increase on the power level of signals before its detection and
demodulation. With this the receiver sensitivity is increased helping to construct longer
unrepeated links.
Finally in-line optical amplifiers are used to compensate fiber losses, overcoming the
needs of optical regeneration. The usage of SOA in such situations is approved by its
transparency to data rate and modulation formats, being a bidirectional device and having
the capability to be used in WDM situations [27].
In RoF systems more than one service can be shared over a same trunk of fiber and
this will implicate that different signals may be coupled coming from different arms of the
optical network. As it was specified before, PON is a good solution for radio signals
propagation and the use of a booster amplifier located at the central office is a reliable
solution to compensate the losses due to the PON splitting.

Carlos Almeida | UMTS, WLAN and WIMAX Radio Access over Fiber
Page | 40
3.4.2 SOA nonlinearities
The SOA nonlinearities are a major limiting factor in the deployment of high-speed
optical communication networks. The main cause is the carrier density change induced by
the input signal of the amplifier. The main types of SOA nonlinearities are cross gain
modulation (XGM), cross phase modulation (XPM), self gain modulation (SGM), self
phase modulation (SPM) and four-wave mixing (FWM).
The refractive index of an SOA active region is not constant, but is dependent on the
carrier density and so the material gain. This implies that the phase and gain of an optical
wave propagating through the amplifier are coupled via gain saturation. The material gain
spectrum of an SOA is homogenously broadened. This means that carrier density changes
in the amplifier will affect all of the input signals creating SGM when having only one
channel. In the other hand it is possible that a strong signal at one wavelength to affect the
gain of a weak signal at another wavelength. This non-linear mechanism is called XGM
and occurs in WDM systems. When injecting a single channel in the SOA, changes on its
optical power may lead to phase shifts creating SPM. If more than one signal is injected
into an SOA, there will be XPM between the signals. XPM can be used to create
wavelength converters and other functional devices.
FWM is a coherent nonlinear process that can occur in an SOA, between two optical
fields, a strong pump with an wavelength of ω0 and a weaker signal at ω0 - Ω, having the
same polarization. The injected fields cause the amplifier gain to be modulated at the beat
frequency Ω. This gain modulation in turn gives rise to a new field at ω0 + Ω, as shown in
Figure 3.10. FWM generated in SOAs can be used in many applications including
wavelength converters, dispersion compensators and optical demultiplexers [27].
Figure 3.10: FWM process.

Chapter 3 | Optical components of a RoF system
Page | 41
3.4.3 SOA gain saturation
The gain saturation of a SOA with a laser pump at 1548.63 nm to saturate the
amplifier was studied. The setup used is the one in Figure 3.11 that considers the possible
utilization of a control mechanism in order to maintain the SOA always at saturation.
Anyway this was not used and was studied the SOA response without the pump laser and
for different biasing currents of the pump
Figure 3.11: SOA used setup
In Figure 3.12 is illustrated the relation between the input power on the SOA and its
output power for four situations: without laser pump and considering a biasing current of
the pump of 10 mA, 20 mA and 30 mA. The respective gain curves for the input power of
the laser for the different schemes are illustrated in Figure 3.13.
Figure 3.12: SOA output power versus input power for different biasing currents of the pump laser.
-25
-20
-15
-10
-5
0
5
10
-30 -25 -20 -15 -10 -5 0
Out
pu p
ower
(dB
m)
Input power(dBm)
Ilaser=0mA Ilaser=10mA Ilaser=20mA Ilaser=30mA

Carlos Almeida | UMTS, WLAN and WIMAX Radio Access over Fiber
Page | 42
For the different biasing currents it is observed the SOA saturation behavior evidenced
by its gain decrease and stabilization for the higher currents. Without the pump laser, the
gain falls 3 dB when the input signal reaches -11dBm. For the other biasing currents the
gain is mainly constant with the increase of the input signal power, showing that the
amplifier is already in saturation.
Figure 3.13: SOA gain curves with the input power for different biasing currents of the pump laser.
The effects of SOA gain saturation can be studied in the performed RoF system using
it as a booster amplifier an analyzing the system response to the amplifier saturation with
different biasing currents.
3.5 Optical filter
The utilization of optical filters in WDM systems is essential to eliminate the
remaining channels. Ideally the optical filter should present a rectangular spectral response,
rejecting all the frequencies out of the channels band. In practise these devices do not fulfil
these conditions but also modify the signal distorting it due to the non ideal spectral
response and nonlinear phase of the filter [28]. Other limitation of optical filters is the
insertion loss that can lead to extra amplification when the signal level is limited.
0
5
10
15
20
25
-25 -20 -15 -10 -5 0
Gai
n (d
Bm
)
Input power (dBm)
Ilaser=0mA Ilaser=10mA Ilaser=20mA Ilaser=30mA

Chapter 3 | Optical components of a RoF system
Page | 43
The transfer function of an optical filter can be altered by modifications on the
operation conditions caused by temperature changes and the device aging. These
modifications are the responsible for changes on spectral and phase response.
The transmittivity of the optical filter used in the implemented PON is illustrated in
Figure 3.14. For the wavelength of 1550 nm the filter presents an insertion loss of 4.1 dB.
In the SOA setup the laser pump wavelength is 1548.6 that has a rejection of -40 dB
compared to the DFB laser.
Figure 3.14: Optical filter transmittivity.
3.6 PIN photodiode
A photodiode allows the conversion of the received optical power into electric current.
The PIN photodiode has two regions of semiconductor material, one of type N and other of
type P, separated by a lightly doped intrinsic region. Thus, when inversely polarized, the
depletion region is increased and the junction’s capacity is reduced which enables them to
provide higher bandwidth. The presence of the intrinsic region also increases the
sensibility to light and provides a region of elevated electric field.
The PIN photodiode usage in fiber optic communications is normally to detect very
weak optical signals. To fulfil this condition the photodiode and its following amplification
circuit must be optimized to maintain a given signal-to-noise ratio, thus they should keep
their noise as low as possible.
-60
-50
-40
-30
-20
-10
0
1548 1548,5 1549 1549,5 1550 1550,5 1551 1551,5 1552
Tra
nsm
issi
vity
(dB
)
Wavelength (nm)

Carlos Almeida | UMTS, WLAN and WIMAX Radio Access over Fiber
Page | 44
The principal noises associated with photodiodes are the shot or quantum noise, the
thermal noise and the noise due to the dark current. Shot noise is a consequence of the
random characteristic of the process of photon detection, while thermal noise is originated
by the resistive components variation with temperature and the noise due to the dark
current occurs even in the absence of light due to current leaks and to the thermal
excitation of carriers.
When a photon reaches the depletion region, it originates an electron-hole pair. Due to
the presence of the electric field, the electron and the hole will be accelerated in opposite
directions producing an electric current. The relationship between the photodiode’s current
Ip and the incident optical power P0 is given by:
ℜ y"/G z·
x·| z··Qx·J (3.18)
Where η is the quantum efficiency, q is the electron’s charge, λ the wavelength, h the
Planck’s constant and c the speed of light in vacuum.
In the implemented PON was used a photodiode model Hewlett Packard 11982A
Lightwave converter 1200 – 1600 nm. The response of this photodiode to a CW optical
signal was tested for a wavelength of 1550 nm and the obtained results for the responsivity
are displayed in Figure 3.15. To perform this analysis was used the laser referred on 3.3.4
with an optical attenuator before the photodiode and an oscilloscope model Hewlett
Packard 54120B to measure the electrical signal current. For the linear relation between the
electrical current and the optical power was obtained a responsivity of 4.966 A/W. It is
important to notice that this model includes electrical amplification leading to a
responsivity value greater than 1 A/W.

Chapter 3 | Optical components of a RoF system
Page | 45
Figure 3.15: PIN responsivity.
3.7 Conclusion
In this chapter were presented the main properties of important optical devices used in
a PON such as optical source, optical fiber, optical amplifier, optical filter and photodiode.
The main problems associated to these devices were also discussed together with the
impact they have in a PON performance, especially in a RoF system.
The optical fiber, especially SMF, was studied as a reliable solution in terms of high
bandwidth provided and the semiconductor laser as a light source that provides good
coupling of light to the optical fiber. The limitations of these two components in a RoF
were analyzed and concluded that fiber attenuation can be problematic in long-haul links,
and its non-linear effects created by the non-linear refractive index variation are also
limitative in terms of the system performance. The laser chirp and linewidth were also
discussed as a limitation on directly modulated laser’s that is the common modulation
technique used in RoF systems.
The SOA was presented as a good solution to compensate the power losses due to the
PON splitting and its gain saturation was studied in a scheme including a pump laser
together with the propagating signal. The optical filter revealed being a good solution to
eliminate other spectral components, besides the channel containing the RF signal and the
PIN photodiode studied including pos-amplification scheme showed great sensibility.
y = 4,966x + 0,018
0
1
2
3
4
5
6
7
8
9
10
0 0,5 1 1,5 2
Cur
rent
(m
A)
Optical power (mW)

Carlos Almeida | UMTS, WLAN and WIMAX Radio Access over Fiber
Page | 46
These studied properties of each component that form a PON for the transmission of
radio signals are to take into account when simulating the system in the next chapter and
also in the practical implementation.

Chapter 4 | Simulation of 3G-UMTS system
Page | 47
Chapter 4
Simulation of 3G-UMTS system
4.1 Introduction
In this chapter are presented the simulation results of a 3G-UMTS RoF system
developed in the OSIP software with the purpose of studying some effects, which will have
interest to complement with laboratorial tests. To build a RoF system with the purpose of
transmitting UMTS signals it was needed to develop a function that simulates the
generation of such signals. So respecting the physical layer and modulation described in
section 2.3, the diagram on Figure 4.1 summarizes the generation process.
First the information passes through a spreading operation, where the signal’s
bandwidth is increased. This process can also be called channelization and consists of
assigning a Walsh-Hadamard code for each connection, whose length can vary from 8 to
256 chips/bit, depending on the number of accesses required. The lack of synchronism and
the vulnerability to multi-path are also overcome by using Gold codes in the scrambling
process. The use of these codes is explained by their good autocorrelation proprieties that
give the receiver the ability to synchronize users.
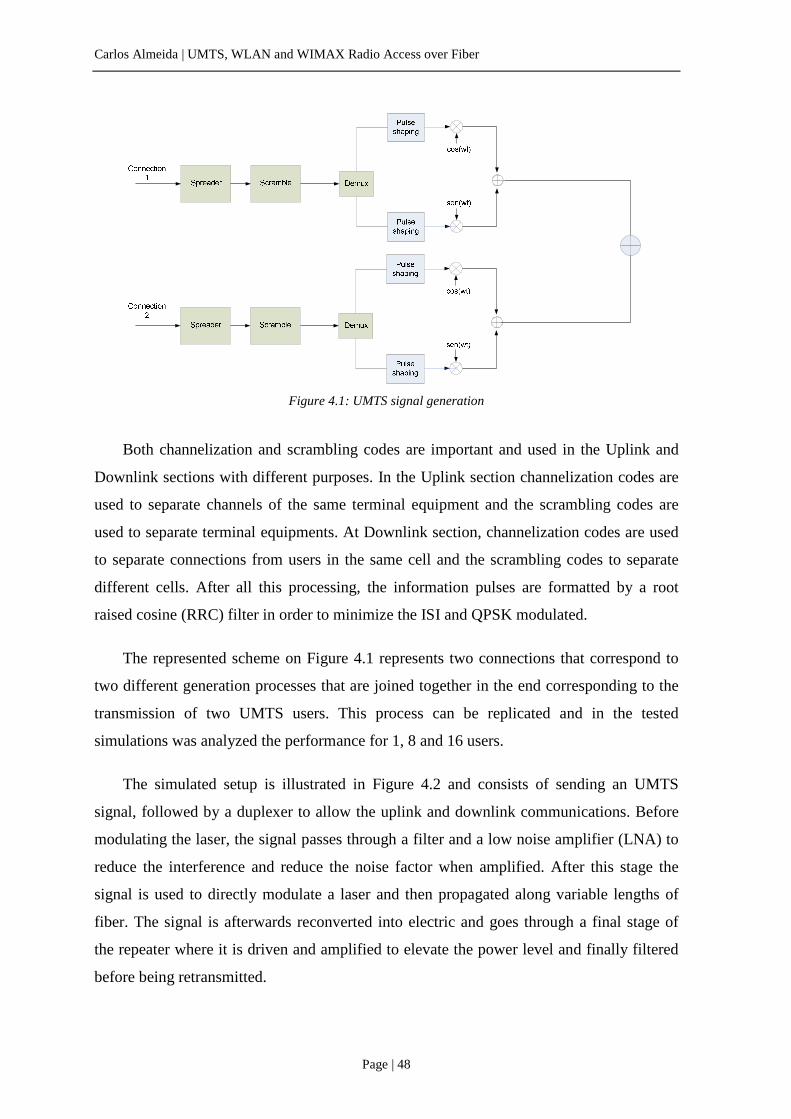
Carlos Almeida | UMTS, WLAN and WIMAX Radio Access over Fiber
Page | 48
Figure 4.1: UMTS signal generation
Both channelization and scrambling codes are important and used in the Uplink and
Downlink sections with different purposes. In the Uplink section channelization codes are
used to separate channels of the same terminal equipment and the scrambling codes are
used to separate terminal equipments. At Downlink section, channelization codes are used
to separate connections from users in the same cell and the scrambling codes to separate
different cells. After all this processing, the information pulses are formatted by a root
raised cosine (RRC) filter in order to minimize the ISI and QPSK modulated.
The represented scheme on Figure 4.1 represents two connections that correspond to
two different generation processes that are joined together in the end corresponding to the
transmission of two UMTS users. This process can be replicated and in the tested
simulations was analyzed the performance for 1, 8 and 16 users.
The simulated setup is illustrated in Figure 4.2 and consists of sending an UMTS
signal, followed by a duplexer to allow the uplink and downlink communications. Before
modulating the laser, the signal passes through a filter and a low noise amplifier (LNA) to
reduce the interference and reduce the noise factor when amplified. After this stage the
signal is used to directly modulate a laser and then propagated along variable lengths of
fiber. The signal is afterwards reconverted into electric and goes through a final stage of
the repeater where it is driven and amplified to elevate the power level and finally filtered
before being retransmitted.

Chapter 4 | Simulation of 3G-UMTS system
Page | 49
Figure 4.2: Simulation setup.
The main simulation conditions of the system considered in Figure 4.2 are following described:
• When 16 connections are used:
o Number of bits for each connection=64 (1024 chips)
o Bit rate 240 Kbps → SF=16
• When 8 connections are used:
o Number of bits for each connection=64 (512 chips)
o Bit rate 480 Kbps → SF=8
• Samples/bit=131072
• Laser average power=1 mW; Ibias=70mA; Ipeak=10mA
• Pulse shaping at emitter
o Root raised cosine α=0.22
• Receiver filtering
o Root raised cosine α=0.22
• Fiber model:
o D=17 ps/(Km.nm)
o Attenuation=0,2 dB/Km
• SNR=15dB
• fo=2167,5 MHz (UMTS frequency channel 12)
Depending on the simulation purposes some of these properties may be changed, but
only when it is described. The value of SNR refers to the ratio between the signal’s power
and the power of the white Gaussian noise added at the receiver. The UMTS signal
transmitted corresponds to the 12th channel of the downlink band centered in 2.1675 GHz.

Carlos Almeida | UMTS, WLAN and WIMAX Radio Access over Fiber
Page | 50
4.2 Simulation results
The purpose of the simulations done is studying the effects of transmitting multiple
users and modifying multiple laser factors like chirp, linewidth and power level. The
performance measure is the error vector magnitude (EVM) of the signal received that
according to ETSI [29] “is a measure of the difference between the theoretical waveform
and a modified version of the measured waveform. (…) The measured waveform is
modified by first passing it through a matched root raised cosine filter with bandwidth 3.84
MHz and roll-off α=0.22. The waveform is then further modified by selecting the
frequency, absolute phase, absolute amplitude and chip clock timing so as to minimise the
error vector. The EVM result is defined as root of the ratio of the mean error vector power
to the mean reference signal power expressed as a %.”
A signal modulated in phase and amplitude can be written as:
i · sin]i N ~ · cos]i (4.1)
Thus, the EVM can be defined through the expression on (4.2) or alternatively be
defined trough the symbol constellation from Figure 4.3.
S Re·∑ y yEeR E
| (4.2)
Where jI and jQ are the I and Q components of the jth symbol of the received signal
and jI~
and ~ are the I and Q components of the ideal signal.
Figure 4.3: Error vector magnitude (EVM).

Chapter 4 | Simulation of 3G-UMTS system
Page | 51
Also according to the ETSI [29] the main requirement of a system should be to meet
an EVM lower than 12% imposed for a UMTS repeater. At the receiver the phase shifts
introduced along the systems are compensated readjusting the phase of the local carrier and
are obtained the results before and after the phase correction.
4.2.1 Performance using multiple connections
In this part, the performance analysis of the system when a different number of users
are defined at the UMTS signal generator is discussed. The results were obtained for 1, 8
and 16 users and are summarized in Figure 4.4 and Figure 4.5.
The results obtained for the transmission of one single user show that until 110 km of
the fiber length the transmission is possible assuring the 12% limit value for EVM. The
results are expressed before and after phase correction and it is observed some
improvement on the system performance by phase correction of the local carrier.
Figure 4.4: Performance for the transmission of a single user through variable fiber lengths.
When transmitting 8 and 16 users the degradation on the signals received is more
penalizing for the second case where for several fiber lengths the results are worst, not
making possible the transmission for more than 100 km. The phase correction done at the
receiver for the situation of 8 users leads to a oscillating performance behavior for low
distances, different from they are in fact for 1 and 16 users.
0
5
10
15
20
25
0 20 40 60 80 100 120 140
EV
M (%
)
Fiber length (km)1 user - before phase correction 1 user - after phase correction

Carlos Almeida | UMTS, WLAN and WIMAX Radio Access over Fiber
Page | 52
Figure 4.5: Performance for the transmission of 8 and 16 users through variable fiber lengths.
4.2.2 Effects due to chirp
The setup used for UMTS signal transmission over fiber uses direct modulation of the
laser to convert the modulated signals into the optical carrier. This fact when compared to
external modulation brings some disadvantages, as referred before, penalizing the system
performance. The one studied in this part is the laser chirp that consists of changes on the
wavelength of the emitted light caused by variations during its modulation. These
frequency variations of the laser output through time is a consequence of the laser bias
current variation associated with the direct modulation. The module of the laser used in
simulation allows the introduction of phase rotations on the optical signal according to
(4.3)
gi ∆? · i · &iw (4.3)
The results obtained by simulation of the setup from Figure 4.2 considering laser’s
chirp of 100 MHz/mA and 200 MHz/mA are illustrated in Figure 4.6 and Figure 4.7,
respectively. The results were obtained for both situations considering 8 users and 16
users.
0
5
10
15
20
25
30
35
0 20 40 60 80 100 120 140
EV
M (%
)
Fiber length (km)8 users - before phase correction 8 users - after phase correction16 users - before phase correction 16 users - after phase correction
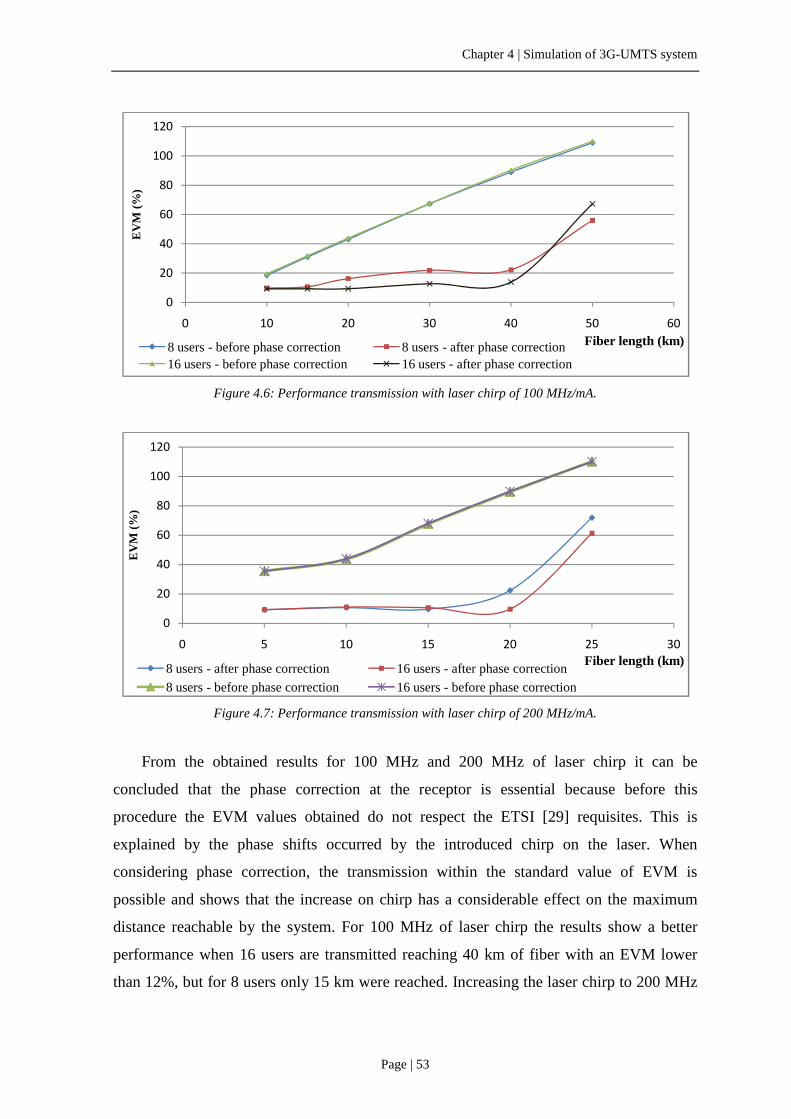
Chapter 4 | Simulation of 3G-UMTS system
Page | 53
Figure 4.6: Performance transmission with laser chirp of 100 MHz/mA.
Figure 4.7: Performance transmission with laser chirp of 200 MHz/mA.
From the obtained results for 100 MHz and 200 MHz of laser chirp it can be
concluded that the phase correction at the receptor is essential because before this
procedure the EVM values obtained do not respect the ETSI [29] requisites. This is
explained by the phase shifts occurred by the introduced chirp on the laser. When
considering phase correction, the transmission within the standard value of EVM is
possible and shows that the increase on chirp has a considerable effect on the maximum
distance reachable by the system. For 100 MHz of laser chirp the results show a better
performance when 16 users are transmitted reaching 40 km of fiber with an EVM lower
than 12%, but for 8 users only 15 km were reached. Increasing the laser chirp to 200 MHz
0
20
40
60
80
100
120
0 10 20 30 40 50 60
EV
M (%
)
Fiber length (km)8 users - before phase correction 8 users - after phase correction16 users - before phase correction 16 users - after phase correction
0
20
40
60
80
100
120
0 5 10 15 20 25 30
EV
M (%
)
Fiber length (km)8 users - after phase correction 16 users - after phase correction
8 users - before phase correction 16 users - before phase correction

Carlos Almeida | UMTS, WLAN and WIMAX Radio Access over Fiber
Page | 54
has an impact on the transmission distances making possible the transmission over 20 km
for 16 users and 15km when 8 users are transmitted.
To understand the reason that makes possible the transmission with 16 connections
over greater distances than with 8 connections, in Figure 4.8 is displayed the envelope of
the laser current for this two situations. As it can be observed the lasers envelope presents
peaks of great amplitude in both situations but with smaller duration in the 16 connections
case. The increase on the number of connections has consequences in increasing the
number of points in the constellation. Since the maximum current swing is always kept
constant, the amplitude of transitions between two adjacent points is reduced as the number
of connections increases. This leads to a reduction of the laser current variations because
the minimum current swing is now smaller. Thus, from (4.3) it is possible to conclude that
smaller variations in the laser current will cause a smaller phase rotations, explaining the
performance increase from 8 to 16 connections.
Figure 4.8: Laser envelope current for 8 and 16 users.
4.2.3 Effects due to the laser linewidth
Ideally the laser response would correspond to a Dirac pulse in the respective desired
central frequency. In fact various factors contribute to the laser spectral broadening like the
noise introduced by spontaneous emission. The effect of having spectral broadening can
originate that some frequencies close to the central one become significant, penalizing the
system performance. This can be studied by varying the laser’s linewidth and the results on
Figure 4.9 were obtained for linewidth of 1 GHz and 2 GHz.

Chapter 4 | Simulation of 3G-UMTS system
Page | 55
Figure 4.9: Performance transmission with laser linewidth of 1 GHz and 2 GHz.
As it can be seen on the results above, an increase on the laser linewidth has a
significant impact on the systems performance. So for 2 GHz of the laser linewidth,
transmission is only possible until 55 km of fiber, whereas for 1 GHz the system can reach
110 km of propagation distance. These results were expectable since the laser spectral
broadening also causes the spectral broadening of the UMTS signal leading to intersymbol
interferences that affects the signal constellation as it can be seen by worst EVM results.
4.2.4 Effect of varying the laser power
The laser response to its biasing current is not a linear relation. Like it has been
explained before in section 3.3 the lasers threshold occurs when there is only stimulated
emission instead of spontaneous emission. In fact it is important to study the system
response for different lasers biasing that correspond to different laser output powers. The
simulations done are summarized in Figure 4.10 where the transmission is tested for 1
mW, 10 mW and 50 mW of the laser power and in Figure 4.11 testing the system for a
same fiber length of 110 km and different laser output powers.
0
10
20
30
40
0 20 40 60 80 100 120 140
EV
M (%
)
Fiber length (km)Linewidth=1GHz - before phase correction Linewidth=1GHz - after phase correctionLinewidth=2GHz - before phase correction Linewidth=2GHz - after phase correction

Carlos Almeida | UMTS, WLAN and WIMAX Radio Access over Fiber
Page | 56
Figure 4.10: Performance transmission for variable laser output powers over different fiber lengths.
When increasing the output power of the laser if this was a linear device it was
expected to obtain better results at the receptor due to the fact that for the same fiber
length, the attenuation factor would not be so penalizing. In fact this behavior is not linear
and as it can be seen in Figure 4.10 for 10 mW the results turn to be better than for 1 mW
but for 50 mW they are not. So analyzing the effect of increasing the laser power in a more
extensive case was tested by fixing a same fiber length and increasing the laser power. The
results obtained show first a performance improvement but for higher power of the laser
the system performance is gradually penalized. This fact can be explained by the fiber
nonlinearities mainly the SPM effect caused by variations on the power of the propagating
optical signal creating phase shifts that penalizes the system performance.
Figure 4.11: Performance transmission for variable laser output powers and 110 km of fiber.
0
10
20
30
40
50
60
0 50 100 150 200 250
EV
M (%
)
Fiber length (km)Laser power=1mW -after phase correction Laser power=10mW - after phase correctionLaser power=50mW -after phase correction
0
5
10
15
20
25
30
35
0 20 40 60 80 100
EV
M (%
)
Laser power (mW)Before phase correction After phase correction

Chapter 4 | Simulation of 3G-UMTS system
Page | 57
4.2.5 Performance using multiple E/O converters
When multiple optical sources are used and modulated with different signals, they
must have different wavelengths so that the desired information channel can be selected
trough optical filtering. This is the principle of wavelength division multiplex (WDM).
However, the electrical CDMA of the UMTS signal can be used to share the medium by
operating the different optical sources with the same wavelength.
In Figure 4.12 is displayed the setup used to simulate a multiple electro-optic (E/O)
converters scenario in this case two channels considering that the UMTS signals used to
modulate the lasers have both 8 connections but separated by different channelisation
codes composing user 1 and user 2. After modulating the lasers with the same wavelength,
both are connected to an optical coupler through 1 km of fiber and then propagated
together along various fiber distances before being converted to electric by the photodiode
and retransmitted.
Figure 4.12: Simulation setup for the transmission with two E/O converters.
It was tested the transmission for a wavelength of 1550 nm in both lasers and was
studied the effect of progressively increasing the laser chirp. In Figure 4.13 is presented the
results without laser chirp and considering 4 MHz/mA of chirp. In both cases transmission
within the standard EVM value of 12 % is possible until almost 130 km, but when
considering chirp, the phase correction mechanism is preponderant to reach the
propagation distance. The increase of the laser chirp to 10 MHz/mA made transmission
only possible until 100 km and for 50 MHz/mA over 60 km.

Carlos Almeida | UMTS, WLAN and WIMAX Radio Access over Fiber
Page | 58
Figure 4.13: Transmission of two E/O converters with and without chirp for variable fiber lengths.
In Figure 4.14 when considering laser chirp of 100 MHz/mA and 200 MHz/mA the
UMTS signal transmission is compromised since these values are sufficient to reduce the
propagation distance to 5 km in the first case and completely impair transmission for 200
MHz/mA. These results were expected since each UMTS frequency slot has only 3.84
MHz of bandwidth and the chirp causes spectral broadening due to an instantaneous
frequency change.
Figure 4.14: Transmission of two E/O converters with 100 MHz/mA and 200 MHz/mA chirp for variable
fiber lengths.
0
5
10
15
20
25
30
35
0 20 40 60 80 100 120 140 160 180
EV
M (%
)
Fiber length (km)No chirp, before phase correction No chirp, after phase correctionChirp 4 MHz, before phase correction Chirp 4 MHz, after phase correction
0
10
20
30
40
50
60
0 2 4 6 8 10
EV
M (%
)
Fiber (km)Chirp 100 MHz, before phase correction Chirp 100 MHz, after phase correctionChirp 200 MHz, before phase correction Chirp 200 MHz, after phase correction

Chapter 4 | Simulation of 3G-UMTS system
Page | 59
4.3 Conclusion
With the simulation work done the transmission of UMTS signals was possible under
innumerous conditions, modifying the generators block and introducing laser effects such
as chirp and linewidth. Each situation was analyzed and were studied the effects of each
parameter in the system performance.
Considering the UMTS signal characteristics and the studied situations it can be
concluded that the laser’s chirp is the parameter that has more influence on the system
performance due to the higher phase shifts introduced that have great impact on UMTS due
to its modulation being QPSK. It is also important to enhance the fact that CDMA allows
the transmission of multiple channels consisting of the same wavelength but separated by
different channelization codes, thus not needing optical or electrical filtering simplifying
the RoF system.

Carlos Almeida | UMTS, WLAN and WIMAX Radio Access over Fiber
Page | 60

Chapter 5 | Implementation of a PON for RF signal transmission
Page | 61
Chapter 5
Implementation of a PON for RF signal transmission
5.1 Introduction
In this chapter is described the implemented PONs for the transmission of RF signals.
In particular is studied the transmission of UMTS, WLAN and WiMAX signals described
in chapter two that are provided by a vector signal generator Rohde & Schwarz [30].
The setup used to perform the radio over fiber system, consists of directly modulating
a DFB laser (1550 nm) described in section 3.3.1 with the RF signal, amplifying it together
with a pump laser through a SOA and transmitting it along different fiber distances. After,
the optical signal is filtered and reconverted into electrical by a PIN photodiode and
analyzed at a signal analyzer Rohde & Schwartz where some performance metrics can be
observed [31]. This setup is illustrated in Figure 5.1.

Carlos Almeida | UMTS, WLAN and WIMAX Radio Access over Fiber
Page | 62
Figure 5.1: Single channel PON.
Other different scenario implemented is a WDM PON that considers not only one
laser modulated with an RF signal but another channel consisting in an external cavity
laser (ECL) with internal amplitude modulation. This ECL is an Anritsu model that uses
tunics technology providing high output power over the whole tuning range. The optical
signals proceeding from the two light sources are coupled through an optical coupler 50/50
and propagated through the SOA together with a pump laser over different fiber lengths.
Afterwards the wavelength corresponding to the signal RF modulated is filtered and
reconverted into electric, being analyzed at the signal analyzer. The schematic of this
WDM-PON is displayed in Figure 5.2.
Figure 5.2: WDM PON.
Besides the description of the UMTS, WLAN and WiMAX standards in Chapter 2, it
is important to know the RF signals properties provided by the Rohde & Schwartz
generator that are displayed in Table 5.1. It is important to notice that the performance
metric used is the EVM that should be under the imposed limits.
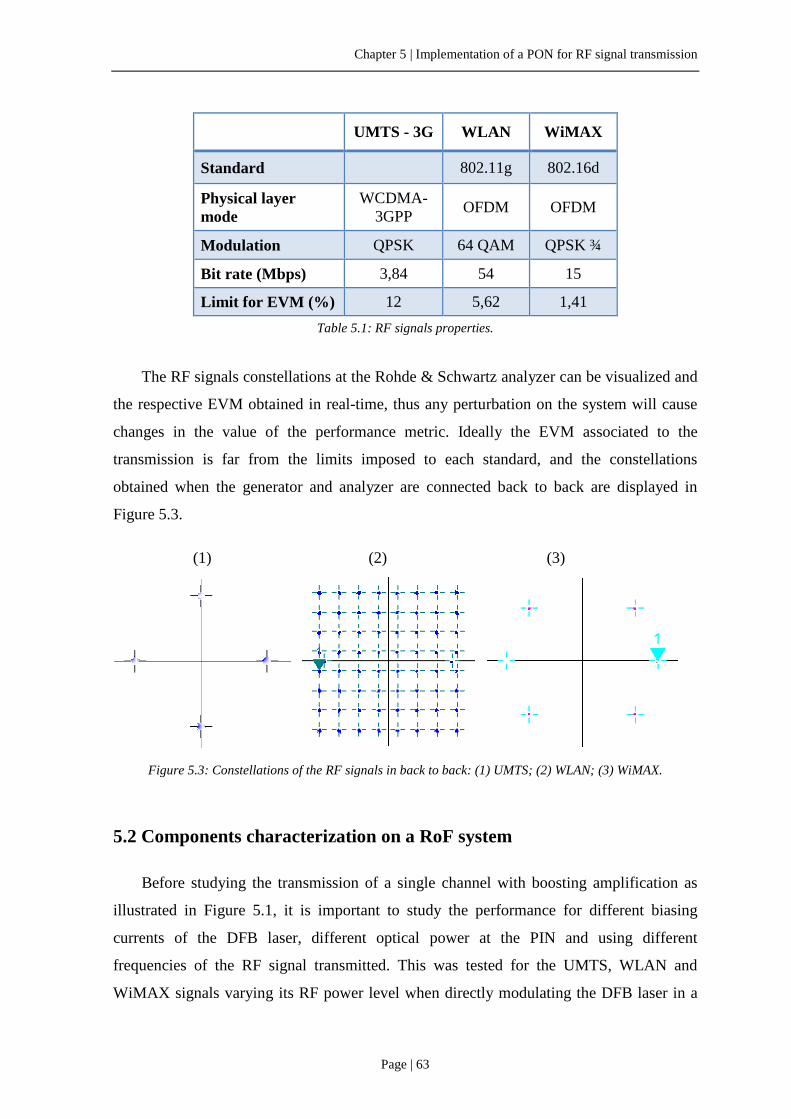
Chapter 5 | Implementation of a PON for RF signal transmission
Page | 63
UMTS - 3G WLAN WiMAX
Standard 802.11g 802.16d
Physical layer mode
WCDMA-3GPP
OFDM OFDM
Modulation QPSK 64 QAM QPSK ¾
Bit rate (Mbps) 3,84 54 15
Limit for EVM (%) 12 5,62 1,41
Table 5.1: RF signals properties.
The RF signals constellations at the Rohde & Schwartz analyzer can be visualized and
the respective EVM obtained in real-time, thus any perturbation on the system will cause
changes in the value of the performance metric. Ideally the EVM associated to the
transmission is far from the limits imposed to each standard, and the constellations
obtained when the generator and analyzer are connected back to back are displayed in
Figure 5.3.
(1) (2) (3)
Figure 5.3: Constellations of the RF signals in back to back: (1) UMTS; (2) WLAN; (3) WiMAX.
5.2 Components characterization on a RoF system
Before studying the transmission of a single channel with boosting amplification as
illustrated in Figure 5.1, it is important to study the performance for different biasing
currents of the DFB laser, different optical power at the PIN and using different
frequencies of the RF signal transmitted. This was tested for the UMTS, WLAN and
WiMAX signals varying its RF power level when directly modulating the DFB laser in a
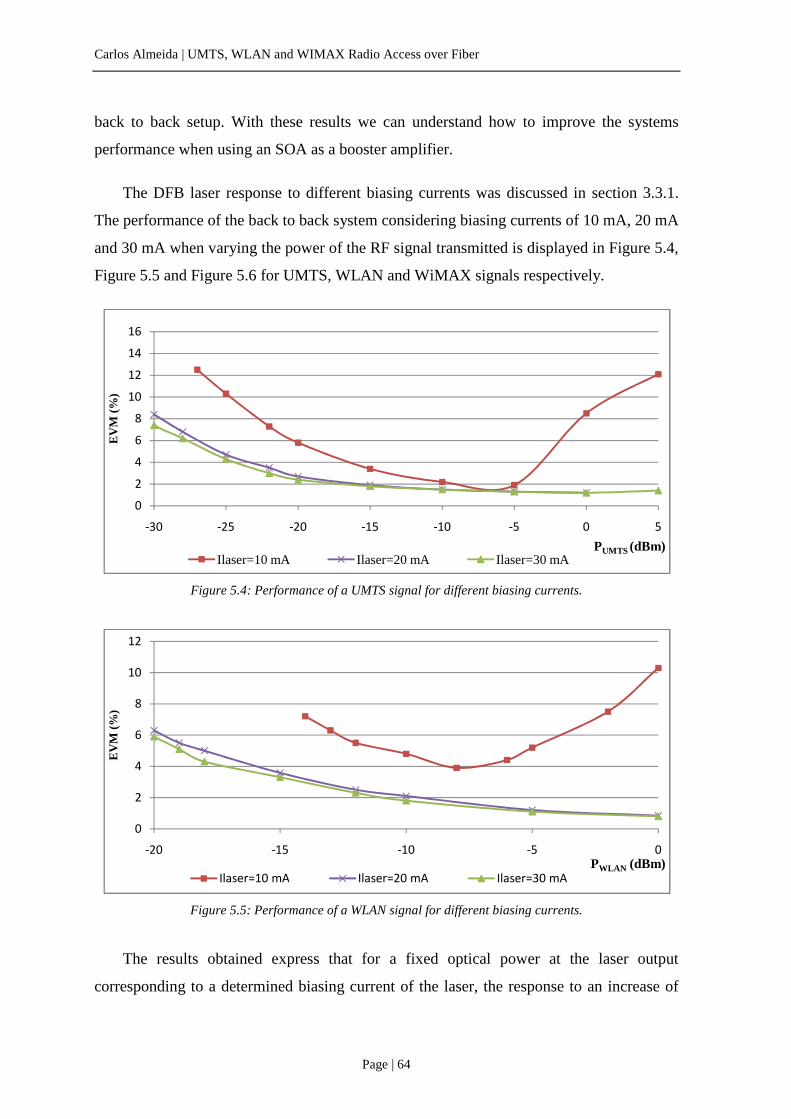
Carlos Almeida | UMTS, WLAN and WIMAX Radio Access over Fiber
Page | 64
back to back setup. With these results we can understand how to improve the systems
performance when using an SOA as a booster amplifier.
The DFB laser response to different biasing currents was discussed in section 3.3.1.
The performance of the back to back system considering biasing currents of 10 mA, 20 mA
and 30 mA when varying the power of the RF signal transmitted is displayed in Figure 5.4,
Figure 5.5 and Figure 5.6 for UMTS, WLAN and WiMAX signals respectively.
Figure 5.4: Performance of a UMTS signal for different biasing currents.
Figure 5.5: Performance of a WLAN signal for different biasing currents.
The results obtained express that for a fixed optical power at the laser output
corresponding to a determined biasing current of the laser, the response to an increase of
0
2
4
6
8
10
12
14
16
-30 -25 -20 -15 -10 -5 0 5
EV
M (%
)
PUMTS (dBm)Ilaser=10 mA Ilaser=20 mA Ilaser=30 mA
0
2
4
6
8
10
12
-20 -15 -10 -5 0
EV
M (%
)
PWLAN (dBm)Ilaser=10 mA Ilaser=20 mA Ilaser=30 mA

Chapter 5 | Implementation of a PON for RF signal transmission
Page | 65
the RF signal power improves the performance of the system that can be seen by lower
EVM values. This is valid for all the signals tested; only varying in the standard EVM
values of each one. Comparing the results for the different biasing currents of the DFB
laser it is observed a great difference between the results obtained for 10 mA when
compared to the ones with 20 mA or 30 mA. This is related to the fact that for a current of
10 mA the laser is near the threshold leading to worst results on the transmission and also a
different curve behavior for high RF powers. When the powers are low, the noise is
dominant; therefore increased power will lead to decreased EVM. However when RF
power becomes enough to cause distortion due to the nonlinear current-power behavior of
the laser, it becomes distorted leading now to an increased EVM with the increased RF
Power. This occurs specially to current near the threshold of the laser (eg 10mA).
Figure 5.6: Performance of a WiMAX signal for different biasing currents.
In order to analyze the PIN photodiode sensitivity for the detection of low power
optical signals it was tested the same setup but considering an optical attenuator before the
photodiode. The obtained results are displayed in Figure 5.7, Figure 5.8 and Figure 5.9
respectively for UMTS, WLAN and WiMAX signals varying the power at the PIN for
different powers of the RF signals.
0
0,5
1
1,5
2
2,5
3
3,5
-40 -35 -30 -25 -20 -15 -10 -5 0
EV
M (%
)
PWIMAX (dBm)Ilaser=10 mA Ilaser=20 mA Ilaser=30 mA

Carlos Almeida | UMTS, WLAN and WIMAX Radio Access over Fiber
Page | 66
Figure 5.7: Performance of a UMTS signal for different optical powers at the PIN.
In this case for a fixed power of the RF signal, considering the laser biased with a
current of 20 mA, the optical power is attenuated before the PIN in order to analyze the
lower level where the system still not exceeding the EVM standard value for each signal.
Varying the RF signal power for a same optical power at the PIN it can be concluded that
the systems performance decreases as the power level of the signal becomes lower. This is
valid for the three signals, deferring on the EVM values for each standard.
Figure 5.8: Performance of a WLAN signal for different optical powers at the PIN.
After analyzing the effects of varying the RF power of the transmitted signals and of
attenuating the optical power before the PIN, it can concluded that among the three signals,
WiMAX requires lower RF levels, and the WLAN requires the highest levels. For the
0
2
4
6
8
10
12
14
16
18
20
-20 -15 -10 -5 0 5
EV
M (%
)
PPIN(dBm)PUMTS=-20 dBM PUMTS=-10 dBm PUMTS=-5 dBm PUMTS=0 dBm
0
1
2
3
4
5
6
7
8
-15 -13 -11 -9 -7 -5 -3 -1 1 3
EV
M (%
)
PPIN(dBm)PWLAN=-15 dBm PWLAN=-10 dBm PWLAN=-5 dBm PWLAN=0 dBm

Chapter 5 | Implementation of a PON for RF signal transmission
Page | 67
optical power level at the PIN that still grants signal transmission according to the
standards, WiMAX allows transmission until -21 dBm and UMTS and WLAN respectively
-19 dBm and -13 dBm.
Figure 5.9: Performance of a WiMAX signal for different optical powers at the PIN.
Despite the fact that the RF signal standards only allow some frequency bands, it was
tested the laser modulation with the UMTS, WLAN and WiMAX signals varying the
signals frequency. The obtained results for the different signals, considering the same laser
current (20 mA) are displayed in Figure 5.10, for -10 dBm of the RF signal power.
(1) (2)
Figure 5.10: Performance of UMTS (1), WLAN (1) and WiMAX (2) for different frequencies of the signal.
0
0,5
1
1,5
2
2,5
-25 -20 -15 -10 -5 0 5
EV
M (%
)
PPIN(dBm)
PWIMAX=-30 dBm PWIMAX=-20 dBm PWIMAX=-10 dBm PWIMAX=0 dBm
0
1
2
3
4
5
6
7
0 1 2 3 4 5 6
EV
M (
%)
PRF (dBm)UMTS signal WLAN signal
0
0,005
0,01
0,015
0,02
0,025
0,03
0 1 2 3 4 5 6
EV
M (
%)
PRF (dBm)WIMAX signal

Carlos Almeida | UMTS, WLAN and WIMAX Radio Access over Fiber
Page | 68
For a frequency of 3 GHz of all three modulating signals it is observed a maximum on
the EVM values for the signal transmission. The EVM decreases until 5 GHz and has a
new peak over 6 GHz. This behavior may be related to adaptation problems of the RF
circuit for direct modulation of the DFB laser.
5.3 Single-channel RoF system with booster amplifier
Considering the setup on Figure 5.1, it is used an SOA as a booster amplifier to
amplify the optical channel together with a laser pump as illustrated before, in Figure 3.11.
The laser pump is used to saturate the SOA by varying its biasing current, providing the
gain decrease. In this setup it is also important to notice that before detecting and analyzing
the RF signal it is needed to filter the 1550 nm DFB laser channel eliminating the pump
laser and other spectral components originated by FWM. In Figure 5.11 is displayed the
optical spectrum, visualized in an OSA model APEX AP2441A after filtering the signal
proceeding from the amplifier. Besides the DFB laser signal at 1549.76 nm there are also
two other spectral components, one corresponding to the laser pump at 1548.63 and other
created by FWM at 1550.7 nm. The rejection of both channels is 47 dB, thus it is expected
that the system will not be too penalized by this fact.
Figure 5.11: Optical spectrum after the optical filter.

Chapter 5 | Implementation of a PON for RF signal transmission
Page | 69
The DFB laser biased with 20 mA or 30 mA presents an output power higher than 1
dBm leading to the conclusion that the SOA will be saturated, according to the gain curves
obtained, in section 3.4. Thus, when considering the pump laser the SOA will be even
more at saturation, effect that can be confirmed by comparing the results for the two
situations.
For each RF signal it was tested the transmission in back to back and along 20, 40 and
60 km of SMF considering SOA saturation with and without pump laser biased with a
current of 30 mA. The results are summarized in Figure 5.12, Figure 5.13 and Figure 5.14
for UMTS, WLAN and WiMAX respectively.
Figure 5.12: EVM versus input UMTS power considering unsaturated SOA and saturated SOA with a pump
laser current of 30mA for back to back and different fiber lengths.
Figure 5.13: EVM versus input WLAN power considering unsaturated SOA and saturated SOA with a pump
laser current of 30mA for back to back and different fiber lengths
0
5
10
15
20
-20 -15 -10 -5 0 5
EV
M (%
)
PUMTS(dBm)back to back back to back, with SOA saturation40 km of fiber 40 km of fiber, with SOA saturation60 km of fiber 60 km of fiber with SOA sauration
0
1
2
3
4
5
6
7
-20 -15 -10 -5 0
EV
M (%
)
PWLAN(dBm)back to back back to back with SOA saturation
20 km of fiber 20 km of fiber with SOA saturation
40 km of fiber

Carlos Almeida | UMTS, WLAN and WIMAX Radio Access over Fiber
Page | 70
In each figure is presented the propagation over the same fiber length but with SOA at
saturation with the pump laser biased with 30 mA and without pump. From this analysis it
can be noticed that with the SOA in saturation, when considering transmission over 20, 40
and 60 km, the results become worst due to its internal dynamics (SPM and SGM), but in
back to back the results with pump saturation leads to better results. This behavior, when
the SOA is directly linked to the PIN, can be explained by the fact that when the amplifier
is less saturated, phase rotations can lead to a high and quick transient peak that do not
occur when the SOA is saturated with the pump. Nevertheless, the transmission of UMTS
and WiMAX signals is assured over 60 km of fiber, but the WLAN standard leads to
considerably worst results, with transmission only possible until 40 km, not considering
saturation with the pump laser. This fact is due to the format used which is based in quite
close constellation, where any distortion can induce errors.
Figure 5.14: EVM versus input WiMAX power considering unsaturated SOA and saturated SOA with a pump
laser current of 30mA for back to back and different fiber lengths.
When transmitting the RF signals for different biasing currents of the laser pump over
the same fiber distance the results obtained are displayed on Figure 5.15, Figure 5.16 and
Figure 5.17. The best results are for the unsaturated operation (pump laser off) due to
higher gain.
0
0,5
1
1,5
2
2,5
3
-25 -20 -15 -10 -5 0
EV
M (%
)
PWIMAX(dBm)back to back back to back with SOA saturation
40 km of fiber 40 km of fiber with SOA saturation
60 km of fiber 60 km of fiber with SOA saturation

Chapter 5 | Implementation of a PON for RF signal transmission
Page | 71
Figure 5.15: EVM versus input UMTS power for SOA with different biasing currents over 40 km of fiber.
When biasing the pump laser with 10 mA, the results show higher degradation when
compared to the other pump biasing currents. This fact can be explained by the observation
of the SOA saturation curves, presented before in Figure 3.13, that show a more linear
behavior for higher input powers at the SOA, in the case of 20 and 30 mA. Thus, the gain
saturation can be more relevant when pump is biased with 10 mA. When comparing the
results for 20 and 30mA, they are similar, but with higher EVM values for 30 mA, due to
higher saturation, therefore lower gain.
Figure 5.16: EVM versus input WLAN power for SOA with different biasing currents over 20 km of fiber.
0
2
4
6
8
10
12
14
16
18
-15 -13 -11 -9 -7 -5 -3 -1 1 3 5
EV
M (%
)
PUMTS(dBm)Ipump=0 mA Ipump=10mA Ipump=20 mA Ipump=30 mA
0
1
2
3
4
5
6
7
8
-14 -12 -10 -8 -6 -4 -2 0
EV
M (%
)
PWLAN(dBm)Ipump=0 mA Ipump=30 mA Ipump=10 mA Ipump=20 mA

Carlos Almeida | UMTS, WLAN and WIMAX Radio Access over Fiber
Page | 72
Figure 5.17: EVM versus input WiMAX power for SOA with different biasing currents over 40 km of fiber.
In Figure 5.18 are displayed the constellations obtained at the analyzer for the
transmission of UMTS signals considering a power level of 0 dBm at the generator. The
presented constellations differ on the propagation distance and the saturation of the SOA
(1) (2)
(3) (4)
Figure 5.18: Constellations of the UMTS received signals for the single channel setup: (1) 40 km of fiber with unsaturated SOA; (2) 40 km of fiber with SOA saturation (30 mA); (3) 60 km of fiber with unsaturated SOA; (4) 60 km of fiber with SOA saturation (30 mA);
0
0,5
1
1,5
2
2,5
-20 -15 -10 -5 0
EV
M (%
)
PWIMAX(dBm)Ipump=0 mA Ipump=10mA Ipump=20 mA Ipump=30 mA

Chapter 5 | Implementation of a PON for RF signal transmission
Page | 73
It is observed the degradation when comparing to Figure 5.3 (1) that is even more
evident when comparing the results considering the saturation with the laser pump biased
with 30 mA and without it. This behavior is related with the SOA nonlinearities like it has
been explained before.
The transmission of the WLAN signals is more penalized by the SOA nonlinearities
allowing transmission until 40 km of fiber but with unsaturated SOA. The effect of the
SOA saturation is observed in Figure 5.19 when comparing the constellations obtained
with and without the pump laser biased with 15 mA. As it is observed the SOA saturation
penalizes the transmission and completely destroys the constellation for higher biasing
currents of the laser pump. This fact is related to the modulation used (64-QAM) that, due
to the very close constellation associated leads to smaller robustness penalizing the EVM
and consequently the transmission conditions.
(1) (2)
Figure 5.19: Constellations of the WLAN received signals for the single channel setup: (1) 40 km of fiber with unsaturated SOA; (2) 40 km of fiber with SOA saturation (15 mA);
WiMAX signals are the ones less penalized allowing transmission over higher
distances with lower power levels when comparing to the UMTS. The effects of saturating
the SOA is more penalizing when propagating along 60 km as it can be seen in Figure 5.20
by some amplitude fluctuations on the constellation symbols.

Carlos Almeida | UMTS, WLAN and WIMAX Radio Access over Fiber
Page | 74
(1) (2)
Figure 5.20: Constellations of the WiMAX received signals for the single channel setup: (1) 60 km of fiber with unsaturated SOA; (2) 60 km of fiber with SOA saturation (30 mA);
In both WLAN and WiMAX constellations there are two points that can be observed
over the axis of the I component that correspond to BPSK pilots that are used in the
demodulation process.

Chapter 5 | Implementation of a PON for RF signal transmission
Page | 75
5.4 Multi-channel RoF system with booster amplifier
In the described WDM scenario (Figure 5.2), when transmitting an Amplitude
Modulated (AM) signal together with the referred RF signals, considering the SOA
saturation with the pump laser, the separation between channels will be much more
relevant. The AM signal is provided as referred before by an ECL tunic’s model, thus it
was selected a central wavelength of 1552 nm in order to mitigate the FWM between
channels. The AM signal has a frequency of 1 MHz and the optical signal at the output of
the laser presents a mean power corresponding to the biasing chosen.
In this setup, besides SPM and SGM, there will be also XPM and XGM, caused by
phase and gain changes induced by the AM modulated signal on the RF one. To analyze
the effect of the SOA nonlinearities when considering both channels, was tested the
transmission with a laser pump biasing current of 20 mA to saturate the amplifier over
different SMF distances. The results are summarized in Figure 5.21, Figure 5.22 and
Figure 5.23.
Figure 5.21: EVM versus input UMTS power for the WDM setup considering a laser pump current of 20 mA.
The obtained results show that transmission of WLAN signals in this scenario was not
possible within the standard values even in back to back, however for UMTS and WiMAX
signals the transmission has reached 40 km, however for higher RF powers in the UMTS
case. This fact is justified by the same reason of the single-channel scenario, due to the
modulation characteristics of WLAN signals that difficult the demodulation.
0
2
4
6
8
10
12
14
-20 -15 -10 -5 0 5
EV
M (%
)
PUMTS (dBm)back to back 20 km of fiber 40 km of fiber

Carlos Almeida | UMTS, WLAN and WIMAX Radio Access over Fiber
Page | 76
Figure 5.22: EVM versus input WLAN power for the WDM setup considering a laser pump current of 20 mA.
Figure 5.23: EVM versus input WiMAX power for the WDM setup considering a laser pump current of 20 mA.
The effects of crosstalk can be confirmed observing the constellations of UMTS
signals obtained when varying the laser pump current of the SOA, for a fixed power of -5
dBm on the AM laser, we observe the degradation on the results obtained by XGM (Figure
5.24). The increase on the biasing current of the pump laser has a considerable effect on
the constellation obtained with the some symbols starting to disperse leading to higher
EVM values.
0
2
4
6
8
10
12
-6 -5 -4 -3 -2 -1 0
EV
M (%
)
PWLAN (dBm)back to back
0
0,5
1
1,5
2
2,5
-25 -20 -15 -10 -5 0 5
EV
M (%
)
PWIMAX (dBm)back to back 20 km of fiber 40 km of fiber

Chapter 5 | Implementation of a PON for RF signal transmission
Page | 77
(1) (2)
Figure 5.24: Constellations of the received UMTS signal: (1) SOA saturation with 20 mA on the laser pump;
and (2) SOA saturation with 30 mA on the laser pump.
On the next experiment, varying the attenuation of the AM laser output, the
modulation index and mean power of this channel will decrease, resulting on an improved
received RF signal, due to less significant inter-channel crosstalk and lower saturation.
With the purpose of measuring the modulation index of the AM channel it was
obtained the extinction ratio of the signal by attenuating the laser power and directly
connecting it to the PIN followed by an oscilloscope. Considering the PIN photodiode
responsivity determined in section 3.6 it was determined the modulation index at the SOA
input for a same pump laser biasing.
In Figure 5.25 are summarized four graphics that represents the EVM versus the
optical power of the AM laser and the EVM versus the modulation index of the AM laser
for the transmission of UMTS and WiMAX signals, with the pump laser polarized with 30
mA.
Like it was expected the decrease on the modulation index of the AM channel
obtained by attenuating the output power of the laser and maintaining the same power on
the pump laser to saturate the SOA, showed a system performance increase. This behavior
is justified by less interchannel crosstalk effects, thus the results will be less affected by the
SOA non-linearity like XPM and XGM.

Carlos Almeida | UMTS, WLAN and WIMAX Radio Access over Fiber
Page | 78
(1) (2)
(3) (4)
Figure 5.25: System performance for the transmission of multiple channels with SOA saturation (30 mA): (1) EVM of UMTS signal versus optical power of the AM laser (2) EVM of WiMAX signal versus optical power of the AM laser
(3) EVM of UMTS signal versus modulation index of the AM laser (4) EVM of WiMAX signal versus modulation index of the AM laser
In Figure 5.26 (1) for 3 dBm of the AM laser corresponding to a modulation index of
0.54, are observed besides the amplitude fluctuations, phase changes in the constellation
due to the strong saturation and gain dynamics. In (2) and (3) for a modulation index of 0.4
and 0.2 respectively, the crosstalk effects are reduced and the symbols are more
concentrated improving the EVM results.
0
2
4
6
8
10
12
14
16
18
-15 -10 -5 0 5
EV
M (
%)
Plaser AM (dBm)
0
0,2
0,4
0,6
0,8
1
1,2
1,4
1,6
1,8
-12 -7 -2 3
EV
M (
%)
Plaser AM (dBm)
0
2
4
6
8
10
12
14
16
18
0 0,2 0,4 0,6
EV
M (
%)
Mod. index
0
0,2
0,4
0,6
0,8
1
1,2
1,4
1,6
1,8
0 0,2 0,4 0,6
EV
M (
%)
Mod. index

Chapter 5 | Implementation of a PON for RF signal transmission
Page | 79
(1) (2) (3)
Figure 5.26: Constellations of the received UMTS signal: (1) - Mod. index=0.54, (2) - Mod. index=0.4 and (3)- Mod. index=0.2.
5.5 Results comparison for single and multi channel
Table 5.2 summarizes the obtained results for the three RF signals considering SOA
saturation without pump laser for the two setups. Two EVM values for each situation were
taken: one for the higher power of the RF signal leading to best transmission conditions,
another for the worst condition where transmission was still possible within the standards.
RF
signal
Single Channel WDM
Direct link 40 km 60 km Direct link 20 km 40 km
PRF (dBm)
EVM (%)
PRF (dBm)
EVM (%)
PRF (dBm)
EVM (%)
PRF (dBm)
EVM (%)
PRF (dBm)
EVM (%)
PRF (dBm)
EVM (%)
UMTS -18 11,8 -12 11 -2 10,9 -15 10 -10 10,4 1 11,5
5 1,9 5 2,7 5 4,9 5 4,7 5 6,1 5 9,2
WLAN -12 4,7 -4 5,4
0 10,5 0 7,2 0 11,4 Not possible 0 1,6 0 3,8
WiMAX -24 1,26 -15 1,05 -8 1,38 -20 0,93 -15 1,2 -4 1,32
3 0,026 3 0,063 3 0,19 3 0,15 3 0,29 3 0,52
Table 5.2 – Transmission metric EVM values for all setups tested.
Analyzing the performance of the RF signals tested in the different setups, the
WiMAX was the signal less affected by the nonlinearities providing the transmission
within the standard EVM values with the lower RF level. UMTS signals also allowed the
transmission over considerable distances but more affected by the nonlinear effects
referred producing phase shifts on the received constellations, thus limiting the
transmission within the standard. The signal that shown more limited was the WLAN. This
fact is related to the modulation used (64-QAM) that, due to the very close constellation

Carlos Almeida | UMTS, WLAN and WIMAX Radio Access over Fiber
Page | 80
used leading to smaller robustness penalizing the EVM and consequently the transmission
conditions, not even allowing the transmission with another AM signal.
5.6 Conclusion
The feasibility of a RoF network, for transporting UMTS, WLAN and WiMAX
signals, was experimentally demonstrated. Results demonstrate that the use of a cost
effective solution for the optical link, recurring to directly modulated lasers and SOAs, can
still provide EVM lower than the standard limits for 60 km on the UMTS and WiMAX
cases, and 40 km for the WLAN. It is also shown that a WDM system with SOA,
considering a UMTS or WiMAX modulated signal and an AM signal, allows the
transmission for 20 km and 40 km. By decreasing the modulation index of the AM laser
the results will not be so penalized by the crosstalk effects.
This chapter also contributed to study the SOA nonlinearities with implications on the
constellations of the RF signals received, especially when considering two channels where
the crosstalk effect leads to the constellation distortion with some symbols starting to
exchange position.

Chapter 6 | Conclusions and future work
Page | 81
Chapter 6
Conclusions, contributions and future
work
6.1 Conclusions
This work has been presented in six chapters, with themes related to RoF technologies,
RF signal properties, description of applications and theoretical definitions of optical
components that compose a PON for the transmission of RF signals. Also, were presented
the results of a computational simulation of a 3G-UMTS over fiber system and the
practical implementation of a PON for the transmission of UMTS, WLAN and WiMAX
signals.
The analysis of some optical devices like optical fiber, laser, SOA, optical filter and
PIN photodiode in chapter three revealed to be an important help to understand the system
behavior in many situations and ease the development of some used models in the
simulation work developed in the OSIP software.

Carlos Almeida | UMTS, WLAN and WIMAX Radio Access over Fiber
Page | 82
Together with some existing components, it was possible to simulate a 3G-UMTS
system including the repeater components by directly modulating a laser and propagating
along different fiber distances. The obtained results, when comparing to the practical
implementation in chapter five showed a limitation on the EVM values obtained even
when propagating through small trunks of fiber. It can be concluded that the justification to
the EVM being higher than 7 or 8% in all tests may be related to difficulties to adapt the
root raised cosine filter at the UMTS generator and receiver, leading to a stabilization
around those values for several fiber distances instead of a continuous evolution as it was
obtained in practice. Nevertheless, the simulation work studied the propagation of multiple
users in the WCDMA-3GPP layer and the effect of directly modulating a laser for the
transmission of such signals when varying chirp, linewidth or polarization. These results
were important to optimize the transmission of different radio waves in chapter five.
The implementation of a PON for the transmission of single channel RF modulated
laser, proved the reliability of RoF systems to overcome the RF spectrum limitations and
assure propagation coverage on difficult environments provided by distributed antenna
systems. The WDM-PON implemented showed that the transmission of multi-wavelength
considering multi-formats is possible sharing the same trunk of fiber, compensating the
losses of the PON splitting ration with a booster amplifier located at the central office.
Testing the transmission of a channel consisting of a AM signal than can be Ethernet
or other, together with RF modulated one demonstrate that optical fiber can be used
providing high bandwidths on each channel, increasing the users bandwidth and data-rate
in a real scenario.
Comparing the results obtained for the different tested standards, WiMAX showed
great versatility, as it provides mobile and fixed communications and its physical layer and
modulation format used leads to better transmission conditions in a RoF system. WLAN in
comparison with WiMAX, provides low data rate transmission and the PON performance
for this standard showed less robustly, due to its modulation format with very close
constellations points. In a cellular system, UMTS transmission over fiber was also proved
to be a reliable solution, providing the signals distribution over long haul links.

Chapter 6 | Conclusions and future work
Page | 83
6.2 Contributions
The performed work described on this document contributed to explore the reliability
of RoF systems and the implementation of a PON for the radio signals transmission, made
possible the characterization of some of the used components. The DFB laser response to
its biasing current and its directly modulation with RF signals varying the modulation
frequency showed that a low cost laser with a simple circuit to make the electro-optic
conversion is a robust solution for RoF systems. The characterization of the SOA gain
saturation and its performance as a booster amplifier in a PON is also another contribution
of this work that can be helpful in future implementations.
In terms of the simulation work done, the adaptation of some of the used models to
perform in a RoF scenario was also deployed and the implementation of other setups was
also tested but not with complete success due to lack of time.
Besides this final work, other documents were done and submitted for the proceedings
of some conferences. It is important to enhance the acceptance of the following papers:
• C. Almeida, A. Teixeira, M. Lima, “Performance analysis of multi-format multi-
wavelength radio over fiber systems based on low cost optical components”, Proc.
Conf. on 10th Anniversary International Conference on Transparent Optical
Networks (ICTON), Athens, Greece, June 2008.
• C. Almeida, A. Teixeira, M. Lima, “Experimental analysis of multi-format WDM-
RoF links based on low cost optical components”, Proc. Conf. on SEON 2008,
Porto, Portugal, June 2008.
• C. Almeida, A. Teixeira, M. Lima, “Performance analysis of multi-format WDM-
RoF links based on low cost Laser and SOA”, Proc. Conf. on Third International
Conference on Access Networks (AccessNets 2008), Las Vegas, Nevada, USA,
October 2008.
It was also submitted the following paper:

Carlos Almeida | UMTS, WLAN and WIMAX Radio Access over Fiber
Page | 84
• C. Almeida, A. Teixeira, M. Lima, “Effects of amplification and propagation in
multi-format multi-wavelength Radio over Fiber systems”, Proc. Conf. on ECOC
2008, Brussels Expo, Belgium, September 2008.
6.3 Future work
Science will always need to answer the needs of the upcoming societies reacting to
globalization and the frenetic rhythm of telecommunications developments allowing new
technologies to join reliability and robustness. The presented work contributes to what is
pretended to be a telecommunications solution that fulfills much of the wanted conditions
for the new generations.
The work done studies the usage of RoF to transmit some of the radio waves actually
used in UMTS, WLAN and WiMAX networks. The optical fiber proved to be a good
solution for transmitting radio waves solving its spectrum limitations and providing the
transmission even along considerable distances. The use of low cost optical equipment
such as coarse WDM DFB uncooled laser to be directly modulated by the RF signals
proved to be a reliable solution.
The limitation of this project duration only allowed exploring some of the interesting
experiences that can be made in RoF systems, but the work done also opened the
possibility of testing new propagation schemes considering other signals transmission or
new configurations, as well to optimize the simulation models developed for the simulation
work. In concrete the possibility of deploying a system containing multiple channels that
can be different RF signals together with AM signals or others is an auspicious objective.
The main reason to not exploring this purpose was the fact that the Signal Vector
Generator only allowed the generation of a single RF signal, and the use of other generator
would imply the usage of another directly modulated laser.
By increasing the number of channels, analyzing the effect of a RF signal in other
different RF ones would imply the need to be more careful in the signal filtering process,
so a study of the best optical filter for RoF applications is also a good perspective work,
together with the study of the SOA response when amplifying more than two channels like
it was tested.

Chapter 6 | Conclusions and future work
Page | 85
In terms of simulations, it is expected to continue developing the OSIP software as a
simulator for RoF, and the possibility of creating new blocks to simulate the transmission
of other RF signal can be explored despite not being an easy task due to the need of
simulating a huge number of bits that increases a lot the simulation time. Anyway the
exploration of other modulation formats as the presented OFDM can also be a challenging
task to develop in simulation generation models.

Carlos Almeida | UMTS, WLAN and WIMAX Radio Access over Fiber
Page | 86

References
Page | 87
References
[1] – Jun Zheng and Hussein T. Mouftah,”Optical WDM Networks, Concept and Design
Principles”, IEEE Press, Wiley-Interscience, A John Wiley & SONS, INC., Publication,
2004.
[2] – C. Rodrigues, Estudo de redes ópticas passivas, Tese de Mestrado, Universidade de
Aveiro , 2007
[3] – Soo-Jin Park, Chang-Hee Lee, Ki-Tae Jeong, Hyung-Jin Park, Jeong-Gyun Ahn and
Kil-Ho Song, “Fiber-to-the-Home Services Based on Wavelength-Division-Multiplexing
Passive Optical Network”, (Invited Paper), IEEE,2004.
[4] – Francisca Martínez, Jaime Campos, Antonio Ramírez, Valentín Polo, Alejandro
Martínez, David Zorrilla, Javier Martí, “Transmission of IEEE802.16d WiMAX signals
over radio-over-fibre IMDD links”, WWIC 2007, Coimbra, Portugal.
[5] – A. Koonen, et al., “Perspectives of Radio over Fiber Technologies”, OFC/NFOEC
08, San Diego, USA, pp OThP3.
[6] – Hamed Al-Raweshidy, Ahozo Komaki, Radio over Fiber Technologies for Mobile
Communication Networks, Artech House, Inc., 2002.
[7] – Nadya Anscombe, “Demand for indoor coverage drives radio over fiber”, Wireless
Europe magazine.
[8] – Hsiao-Hwa Chen, The Next Generation CDMA Technologies, John Wiley & Sons
Ltd, 2007.
[9] – GLASS, Jack, The principles of Spread Spectrum communication,
http://cas.et.tudelft.nl/~glas/ssc/techn/techniques.html
[10] – PELLETIER, Benoit, CDMA technology, McGill University,
http://www.tsp.ece.mcgill.ca/Telecom/Docs/cdma.html#TOP

Carlos Almeida | UMTS, WLAN and WIMAX Radio Access over Fiber
Page | 88
[11] – Jeffrey G. Andrews, Arunabha Ghosh, Rias Muhamed, Fundamentals of WiMAX
Understanding Broadband Wireless Networking, Prentice Hall, 2007.
[12] – H. Labiod, H. Afifi, C. De Santis, Wi-FiTM, BluetoothTM, ZigBeeTM and WiMAXTM,
Springer, 2007.
[13] – Srikanth S., Kumaran V., Manikandan C., “Orthogonal Frequency Division Multiple
Access : Is it the Multiple Access System of the Future?”.
[14] – P.Andre, Componentes optoelectronicos para redes fotonicas de alto debito, Tese
de Doutoramento, Universidade de Aveiro, 27 de Setembro de 2002.
[15] – Keiser, Gerd, Optical Fiber Communications, Third edition, Mcgraw-Hill, 2000.
[16] – D. Marcuse, “Curvature loss formula for optical fibers”, Proc. IEEE, vol. 61, 1973.
[17] – J. D. Love, “Application of low-loss criterion to optical waveguides and devices”,
IEEE Proc., August 1989.
[18] – Keiser, Gerd, Optical communications essentials, Mcgraw-Hill, 2003.
[19] – M. Lima, Optimização de sistemas de comunicação baseados na tecnologia WDM,
Universidade de Aveiro, 2003.
[20] – A. Teixeira, Optimização de sistemas de comunicação óptica multicanal (WDM) de
alta densidade, Universidade de Aveiro, 1999
[21] – G. P. Agrawal, Multichannel lightwave systems, Fiber –Optic Communications
Systems, 2nd Ed., John Wiley &Sons, Inc., New York, 1997
[22] – K. Inoue, K. Nakanishi, K. Oda, H. Toba, “ Crosstalk and power penalty due to fiber
Four-Wave Mixing in mulyichannel transmissions”, IEEE/OSA Journal Ligthwave
Technology, vol.12, 1994
[23] – A. Boskovic, S. Tem, V. L. da Silva, “Four-Wave Mixing Q-penalty measurements
in dense WDM, 10 Gbit/s systems”, Proceedings of Optical Fiber Communications
Conference 1998 (OFC’98), paper WM”, San Jose, USA.

References
Page | 89
[24] – G. P. Agrawal, Optical Fibers, Fiber-Optic Communications Systems, 2nd Ed., John
Wiley & Sons, Inc., New York, 1997.
[25] – L. Bickers, L. D. Westbrook, “Electronic Letters”, 1985.
[26] – N. A. Olsson, C. H. Henry, R. F. Kazarinov, H. J. Lee, K. J. Orlowsky, IEEE
Journal of Quantum Electronics, 1988.
[27] – Michael Connelly, “Semiconductor Optical Amplifiers and their Applications “.
[28] – G. Lenz, B. J. Eggleton, C. K. Madsen, C. R. Giles, G. Nykolak, “Optimal
dispersion of optical filters for WDM systems”, IEEE Photonics Technology Letters, 1998.
[29] – ETSI, Universal Mobile Telecommunications System (UMTS); UTRA repeater
radio transmission and reception (3GPP TS 25.106 version 7.2.0 Release 7).
[30] – Rohde & Schwarz SMJ100A Vector Signal Generator datasheet,
http://www2.rohde-schwarz.com/file_7182/SMJ100A_bro_en_WEB.pdf.
[31] – Rohde & Schwarz FMU36 Signal Analyzer datasheet, http://www2.rohde-
schwarz.com/file_6751/FMU36_bro_en.pdf.