career pathways - 1gyhoq479ufd3yna29x7ubjn … · career pathways: five ways to connect college and...
TRANSCRIPT

CAREER PATHWAYS: FIVE WAYS TO CONNECT COLLEGE AND CAREERS
Centeron Education
and the Workforce
McCourt School of Public Policy
2017
Anthony P. Carnevale Tanya I. Garcia Artem Gulish

Reprint PermissionThe Georgetown University Center on Education and the Workforce carries a Creative Commons license, which permits noncommercial re-use of any of our content when proper attribution is provided.
You are free to copy, display, and distribute our work, or include our content in derivative works, under the CEW’s following conditions:
Attribution: You must clearly attribute the work to the Center on Education and the Workforce and provide a print or digital copy of the work to [email protected].
Our preference is to cite figures and tables as follows:
Source: Georgetown University Center on Education and the Workforce, Career Pathways: Five Ways to Connect College and Careers, 2017.
Noncommercial: You may not use this work for commercial purposes. Written permission must be obtained from the owners of the copy/literary rights and from Georgetown University for any publication or commercial use of reproductions.
Approval: If you are using one or more of our available data representations (figures, charts, tables, etc), please visit our website at cew.georgetown.edu/publications/reprint-permission for more information.
For the full legal code of this Creative Commons license, please visit creativecommons.org.
Should you need a form to be filled out by us, please [email protected] and we will respond in a timely manner.
CC

Centeron Education
and the Workforce
McCourt School of Public Policy
Anthony P. Carnevale, Tanya I. Garcia, and Artem Gulish | 2017
CAREER PATHWAYS: FIVE WAYS TO CONNECT COLLEGE AND CAREERS
ACKNOWLEDGEMENTS
We are grateful for the individuals and organizations whose generous support has made this report possible: Lumina Foundation (Jamie Merisotis, Holly Zanville, and Susan D. Johnson), the Bill & Melinda Gates Foundation (Daniel Greenstein and Jennifer Engle), and The Joyce Foundation (Sameer Gadkaree). We are honored to be partners in their shared mission of promoting postsecondary access and completion for all Americans.
Many have contributed their thoughts and feedback throughout the production of this report. We owe a debt of gratitude to John Dorrer for his thoughts during the conceptualization of the Learning and Earning Exchange. We also benefited greatly from the insights of Kathy Booth, Jay Pfeiffer, Jeff Sellers, Barry Stern, David Stevens, and Christina Whitfield. Kish Rajan, Lori Sanchez, and Richard Verches reviewed a final draft and we are grateful for their advice.
This report would not have been possible without feedback from the state leaders whose tools we feature: Van Ton-Quinlivan of the California Community Colleges Chancellor’s Office, Kim Hunter Reed and Beth Bean of the Colorado Department of Higher Education, Andrew Condon of the Connecticut Department of Labor, Mark Lawrance of the Indiana Chamber of Commerce, Shawntera Hardy of the Minnesota Department of Employment and Economic Development, Pam Hoberman and Ronnie Kauder of the New York City Labor Market Information Service at the City University of New York Graduate Center, Michael Bettersworth of Texas State Technical College, and Craig Herndon and Chris Pfautz of the Virginia Community College System.
We are especially grateful for our talented designers, meticulous editorial advisors, and trusted printers whose tireless efforts were vital to our success. In addition, Georgetown CEW’s economists, analysts, and communications and operations staff were instrumental in the production of this report from conception to publication:
Q Jeff Strohl for initial impetus and research direction; Q Andrea Porter for strategic guidance; Q Neil Ridley for support, guidance, and critical review throughout; Q Andrew Hanson for contributing to earlier drafts of the report; Q Cary Lou, Jessica Clarke, and Justin Goss for research assistance; Q Martin Van Der Werf, Nicole Smith, and Ban Cheah for editorial and qualitative
feedback; Q Hilary Strahota, Vikki Hartt, Wendy Chang, and Axel Dávila for broad communications
efforts, including design development and public relations; and Q Joe Leonard and Coral Castro for assistance with logistics and operations.
The views expressed in this publication are those of the authors and do not necessarily represent those of Lumina Foundation, the Bill & Melinda Gates Foundation, or The Joyce Foundation, or their officers or employees.

TABLE OF CONTENTS
Foreword: How We Came to Need a Learning and Earning Exchange 1
Introduction 4 Postsecondary education is the gateway to the middle class in the 21st century. 4
The Five Ways 7 Education Projections, Business Expansion, and Workforce Quality 8 Program Alignment with Labor Market Demand 9 Curriculum Alignment with Workforce Requirements 10 Counseling and Career Pathways 11 Job Placement and Skills Gap Analysis 13
Conclusion 14
References 15
Appendix: Labor Market Information Data Sources, Characteristics, and Potential Uses 19 Survey Data 19 American Community Survey (ACS) 19 Current Population Survey (CPS) 20 CPS Annual Socioeconomic Supplement 20 Current Employment Statistics (CES) 20 Occupational Employment Statistics (OES) 21 Administrative Data 21 State unemployment insurance (UI) wage records 21 State tax records 22 Federal Employment Data Exchange System (FEDES) 22 Internal Revenue Service (IRS) records 23 Social Security Administration (SSA) records 23 Aggregated Databases 24 Occupational Information Network (O*NET) 24 Longitudinal Employer-Household Dynamics (LEHD) 24 Emerging Data Sources 25 Job postings data 25 Resume/profile data 25 Table 1: Labor Market Information Data Sources at a Glance 26 Appendix References 28

Career Pathways: Five Ways to Connect College and CareersF

Career Pathways: Five Ways to Connect College and Careers 1
The old rules of thumb no longer apply.
Go to college. Study hard. Get good grades. Get a degree. Get a job. This is great advice that has served many generations well. But these simple principles are no longer enough in today’s more complex world. The relationship between education after high school and jobs has become trickier and harder to navigate.1 Learners and workers need a clear guidance system that will help them make good college and career decisions and enable them to lead fulfilling, purposeful lives while supporting their families.
People want to know the value they are getting from one of the biggest investments they will make in their lives.
Colleges have become very expensive, with tuition and fees at public four-year colleges and universities growing 19 times faster than the median family income since 1980.2 The trend toward state disinvestment in postsecondary education for the past three decades has shifted the financial burden to students and their families.3 If students are investing more to go to college, they need to have answers to basic questions about the value of postsecondary education.4 They need better information to make decisions that have lifelong economic consequences, and this information should be delivered in new ways.5
In addition, the governance, accreditation, and financing of postsecondary education must go beyond student completion as a goal and be connected to measurable post-college outcomes. While completion is an important metric for improving efficiency, it ignores the relationship between learning and earning in particular fields of study, as well as the social and economic value of general education. If we don’t change the way we think about providing postsecondary education and training, we will continue to have a system with runaway costs driven by institutional prestige rather than learning and earning outcomes.6
How did we get here?
Higher education is struggling to adjust in the transition from an industrial to a post-industrial economy. As a result, the sector is finding it increasingly difficult to serve
1 About 40 percent of students are attending community colleges, where the complexity of choosing a program might pose a greater challenge both because of the higher number of options and greater granularity of labor market outcomes. Community college students also are more likely to be first generation, and come from low-income families and historically underrepresented groups, and therefore are more likely to lack information and guidance they need in making education and career decisions. Baker et al., “The Effect of Labor Market Information on Community College Students’ Major Choice,” 2017.
2 Georgetown University Center on Education and the Workforce analysis of the College Board, Trends in College Pricing 2015, 2015, Table 2A; U.S. Census Bureau and Bureau of Labor Statistics, Current Population Survey, March Supplement, 1980, 2016.
3 State Higher Education Executive Officers, “SHEF FY 2016,” 2017.4 Engle, Answering the Call, 2016.5 Harris, “Little College Guidance,” 2014.6 Higher education remains vital, but it must be more efficient, transparent, and equitable. We cannot
afford all the postsecondary education we need without more efficiency, and we cannot achieve more equity without more efficiency (Carnevale, We Need a New Deal between Higher Education and Democratic Capitalism, 2017).
Foreword: How We Came to Need a Learning and Earning Exchange

Career Pathways: Five Ways to Connect College and Careers2
simultaneously the needs of learners, workers, and employers. The two organizational models typical of the industrial era – the top-down vertically integrated institutions (e.g., automakers and government) and the fragmented model of service delivery (e.g., healthcare and education) – are being displaced in the post-industrial service economy by networks of institutions and individuals that foster direct consumer participation and compel measured outcomes. Just like other industries before it, higher education is going through the growing pains of modernization. It is being asked to deliver more quality, innovation, customization, convenience, and speed.7
The growing complexity of today’s economy is making it difficult for higher education to deliver efficiency and consistent quality.
Today’s economy is more intricate than those of decades past. We have more occupations, programs of study, colleges and universities, and students than ever before:
Q Occupations grew from 270 in 1950 to 840 in 2010;8
Q Postsecondary programs of study more than quintupled between 1985 and 2010 – from 410 to 2,260;9
Q The number of colleges and universities more than doubled from 1,850 to 4,720 between 1950 and 2014;10 and
Q The number of college students swelled almost tenfold in the period between 1949 and 2014 – from 2.4 million to 20.2 million.11
The variety of postsecondary credentials available has multiplied rapidly in recent years, including degrees, certificates, certifications, licenses, and badges and other micro-credentials. New providers as well as delivery modes and models, such as online and competency-based education, have added further to the growing complexity and confusion. This has translated into an explosion of choices and decisions that make it hard for people to navigate in and out of college and careers.12 We need better information connecting higher education to the economy.
No one really knows what a postsecondary credential represents.
Today’s ecosystem of postsecondary credentials is complex, fragmented, and multilayered, and presents significant challenges to learners, employers, and policymakers.13 We don’t know enough about the learning and competencies required to receive specific credentials. We also don’t know how various credentials across diverse fields are valued, or how they interact with one another. Employers traditionally have used specific credentials as signals of workers’ competencies. But today they are unable to assess the value of different credentials and want to know how their underlying competencies match job requirements. Without clear, comprehensive, and actionable information, mediocrity prevails, and reputation rather than quality (captured by earnings returns) is rewarded.14
7 Widely distributed information technology allows the shift to complex learning networks driven by widely shared information, measured outcome standards, and direct consumer participation – making these new networks the dominant form of organization for both consumption and production in all industries (Carnevale and Rose, The Economy Goes to College, 2015).
8 Wyatt and Hecker, “Occupational changes during the 20th Century,” 2006; Bureau of Labor Statistics, Occupational Employment Statistics, 2015.
9 National Center for Education Statistics, Integrated Postsecondary Education Data System, Classification of Instructional Programs (CIP) Resources, 1985-2010.
10 National Center for Education Statistics, Digest of Education Statistics tables, table 317.10, 2015.11 National Center for Education Statistics, Digest of Education Statistics tables, table 303.10, 2015.12 Cappelli, Will College Pay Off?, 2015.13 ConnectingCredentials.org, “Connecting Credentials: A Beta Credentials Framework,” 2015.14 Akerlof, “The market for ‘lemons,’ ” 1970; Shapiro, “Consumer information, product quality, and seller
reputation,” 1982.

Career Pathways: Five Ways to Connect College and Careers 3
We need new rules to help us understand the connection between college and careers.
Measuring learning and earning at the program level is the key to unbundling the value of postsecondary education options. Currently we have ways to measure earning, but we are far away from being able to measure learning. Why is measuring learning important? General education competencies make workers more flexible and more adaptable to changing technology, which is advantageous over the course of a career.15 In the long term, we will need to figure out which combination of general and specific competencies prepare workers better for occupations. For now, the new relationship between postsecondary programs and the economy comes with new rules that require much more detailed information on the connection between individual postsecondary programs and career pathways:
RULE 1.On average, more education yields more pay. Over a career, a high school graduate earns $1.4 million; an Associate’s degree holder earns $1.8 million; a Bachelor’s degree holder earns $2.5 million; a Master’s degree holder earns $2.9 million; a PhD holder earns $3.5 million; and a professional degree holder earns $4 million.16
RULE 2. What a person makes depends on what that person takes. A major in early childhood education pays $3.4 million less over a career than a major in petroleum engineering.17
RULE 3. Sometimes less education is worth more. IT certificate holders who work in field earn $70,000 per year compared with $61,000 per year for the average Bachelor’s degree holder. Thirty percent of Associate’s degree holders make more than the average Bachelor’s degree holder.18
RULE 4. Programs are often the same in name only. The value of programs and college majors varies according to the alignment between particular curricula and regional labor market demand.19
15 Hanushek et al., “General education, vocational education, and labor-market outcomes of the life-cycle,” 2011.16 Georgetown University Center on Education and the Workforce analysis of U.S. Census Bureau,
American Community Survey: 2009-2015, pooled one-year person level micro data files.17 Carnevale et al., The Economic Value of College Majors, 2015.18 Carnevale et al., Certificates, 2012; Carnevale et al., The Economic Value of College Majors, 2015.19 Carnevale et al., Learning While Earning, 2015.

Career Pathways: Five Ways to Connect College and Careers4
The information age20 has given us digital maps on phones with directions to restaurants, reviews from previous diners, and other nearby dining options. We can get electronic reminders of meetings accompanied by information about weather and traffic conditions. Yet when it comes to navigating education and career pathways, learners and workers mostly have been left on their own, operating with outmoded methods and incomplete information from different sources that are difficult to reconcile and apply toward a particular purpose. This is not the way to equip more Americans with the skills they need in the 21st-century economy, nor offer employers the skilled workforce they demand. We need a better way: one that will remove the guesswork and allow the postsecondary education and training system to catch up to the modern world.
State leaders are rising to this challenge to improve postsecondary and workforce outcomes. Advances in data systems are enabling state leaders and other stakeholders to respond to pressures from learners, workers, and employers. Stakeholders are using these advances to inform how they prioritize postsecondary and workforce investments and make decisions that are efficient, effective, and equitable.
The data exist, and they are getting more comprehensive. A number of states have done pioneering work in assembling data to connect college and careers. A framework that integrates postsecondary education and workforce data, primarily in public-facing websites, will serve the interests of all parties: governors, legislators, state higher education and workforce executives, postsecondary leaders, and, ultimately, learners, workers, and employers. State leaders can draw from the best ideas of other states, adopt the ones that work for them, or use the ideas as a basis to devise new and improved solutions. This report is meant to describe the ideal system — what we call the Learning and Earning Exchange — and how data can be used to create such a system.
Postsecondary education is the gateway to the middle class in the 21st century.
Postsecondary education is increasingly a prerequisite for entering the middle class.21 However, escalating costs coupled with rising uncertainty about college value are creating mounting pressure to increase transparency and improve outcomes within and across the postsecondary and workforce sectors. This pressure is stimulating innovation in public policy development because all the parties involved seek answers to basic questions about the value of postsecondary education, how to access and provide it, and what it means for individual and collective success.
Innovative efforts in eight states could be models for others about where investments can make a strong impact. These solutions integrate postsecondary and workforce data22 in a way that provides actionable information which can be used to improve postsecondary
20 The amount of information we collect and store has grown exponentially since the early 2000s. This explosion in information has given rise to big data and machine learning algorithms, which together have supported the creation of new information and guidance tools, allowing consumers, businesses, institutions, and policymakers to benefit from experiences and outcomes of people in different spheres of society (King, “Too Much Content,” 2011; Lohr, “The Age of Big Data,” 2012).
21 Carnevale and Rose, The Economy Goes to College, 2015.22 Since 2009, the State Higher Education Executive Officers Association (SHEEO) has documented
changes in state postsecondary data systems in its Strong Foundations reports, including data sharing with the workforce sector. For more information, see Armstrong and Whitfield (2016), Garcia and L’Orange (2012), and Garcia and L’Orange (2010).
INTRODUCTION

Career Pathways: Five Ways to Connect College and Careers 5
education and training programs, connect learners and workers to career pathways, and satisfy employers’ workplace needs.
If done well:
Q Learners and workers will better understand how their choices of postsecondary programs can prepare them for fulfilling lives and careers;
Q Colleges will refresh and strengthen programs to improve student outcomes; Q Employers will be able to identify and hire talented workers more precisely; and Q Policymakers will allocate resources effectively and efficiently in order to build
strong economies.
This report shows how state leaders are using technological advances to improve the use of data in five critical areas:
Q Helping economic and workforce developers, businesses, and colleges to reduce the high costs resulting from uninformed education and workforce decisions;
Q Assisting college leaders in making program-related decisions that take into account labor market needs;
Q Ensuring that postsecondary education and training programs strike a balance between learners’ foundational knowledge and what they’ll need to know and be able to do in the workplace;
Q Enhancing high school counseling and college advising to make the process of exploring, entering, and finishing college easier for learners; and
Q Helping workers understand how to take advantage of postsecondary education and training options as they change jobs and navigate their careers.
These five ways would increase transparency and accountability across the postsecondary and workforce sectors.23
No state has built out all of the five areas we describe in this report (Figure 1). In addition, each featured state example is in the early stages. While their development is likely to mature over time, these are early innovations in each of the five practices. We believe that all states are experiencing common challenges to improve the efficiency, equity, and effectiveness of public investments, which makes these examples worthy of attention. Although each state faces slightly different issues, investments in these areas can address the needs of key stakeholders in ways that can transcend state borders.
Several characteristics emerged when we analyzed the featured examples. Each seeks to turn integrated data into information. The examples also demonstrate the various states’ commitment to making this information accessible via public-facing websites, rather than merely embedding it in reports. The existence of multisector partnerships emphasizes the importance of creating mutually reinforcing relationships. We also suspect that the extent and effectiveness of each state’s marketing and outreach efforts, along with how
23 Legislation to increase transparency and accountability is gaining momentum in Congress. The College Transparency Act of 2017, introduced by two Republican and two Democratic senators, would lift the so-called “student record ban,” which would allow for more accurate data on graduation rates, workplace outcomes, and how students are performing at individual colleges, among other things. Meanwhile, the Student Right to Know Before You Go Act, known for its sponsors Sen. Ron Wyden (D-Oregon) and Sen. Marco Rubio (R-Florida), would require colleges to release new data, such as institutional graduation rates, average wages of students who earn a degree, graduation rates and wage outcomes by major.

Career Pathways: Five Ways to Connect College and Careers6
they leveraged state and federal funding,24 played an important role in the development, pilot, and implementation phases. These tools will be more effective as state leaders foster a culture of data use,25 including helping users understand the data, turning the data into information, and changing organizational practices as a result.26
Education Projections, Business Expansion, and Workforce Quality tools help state economic development leaders attract and retain new employers with data demonstrating that the state postsecondary education and training systems can provide workers with the needed skills.
Program Alignment with Labor Market Demand tools help college administrators, faculty, and deans make program-related decisions that address labor market needs, while college and system administrators can demonstrate return on investment to state leaders.
Curriculum Alignment with Workforce Requirements tools help faculty members create curricula aligned with the applied skills and abilities that learners will need to succeed in their careers.
Counseling and Career Pathways tools help advisors support students in their educational and career decisions, as well as identify and reach out to the learners who need additional support.
Job Placement and Skills Gap Analysis tools help workers determine if and how the knowledge, skills, abilities, interests, and work values they possess are transferable to new jobs. These tools also help workers assess skill gaps and provide connections to postsecondary education and training options that can prepare them for a career change.
Our aim is to give state leaders a view of what is possible. For states that have initiatives in some areas, these practices can provide guidance for the next investment. For states just beginning to plan, this report provides insight into how states have used data and technology to provide valuable information for improved decision-making.
24 Between 2005 and 2015, the U.S. Department of Education invested more than $700 million in statewide longitudinal data systems (Armstrong and Zaback, “Assessing and Improving State Postsecondary Data Systems,” 2016).
25 Engle and Greenstein, “Leading with Data,” 2015.26 Phillips and Horowitz, “Big Data Alone Won’t Help Students,” 2017.
Figure 1. The Five Ways feature web-based tools to support policy- and decision-making.

Career Pathways: Five Ways to Connect College and Careers 7
THE FIVE WAYSThese five practices call for the integration of
postsecondary education and workforce data to
support individual, organizational, and policy decisions.
Together, they represent closer alignment between
the postsecondary education and workforce sectors.
Alignment does not mean that the postsecondary sector
becomes the pawn of the workforce sector, or vice versa;
rather, the two sectors work in concert to contribute to a
state’s overall success.
The tools featured in this report represent how leaders
within and across eight geographically diverse states
are using labor market information27 to build a more
complete picture of what happens to learners and
workers before, during, and after they complete their
postsecondary studies. In each of the following sections,
we include an overview and describe the data being
integrated, as well as the intended audience for each of
the Five Ways. Each section concludes with one or more
state examples.
27 See the appendix for a listing of Labor Market Information (LMI) data sources, characteristics, and potential uses.

Career Pathways: Five Ways to Connect College and Careers8
Overview
28 The International Economic Development Council advocates a tripartite alliance among postsecondary institutions, employers, and economic developers to address the nationwide mismatch between jobs and workers (Brown, Shifting Workforce Development into High Gear, 2015).
29 IndianaSkills, http://www.indianaskills.com/; Network Indiana, “Indiana Chamber Unveils Database for Job Seekers,” 2012; Indiana Chamber, “Chamber’s IndianaSkills.Com Site Now Also Features Supply and Demand Job Info,” 2014.
30 Recovery 2020 is the second installment of the Georgetown Center’s jobs and education projections. Its predecessor, Help Wanted, came out in 2010. The third iteration, which is forthcoming, will project educational demand through 2025 (Carnevale et al., 2010; 2013).
31 For more information on Labor Market Information (LMI) data sources, see the appendix.
Workforce development can be thought of from three perspectives: being prepared for the future, attracting new business, and ensuring continued workforce quality that meets the needs of both existing employers and prospective ones. Business expansion policies have relied heavily in recent years on tax incentives, but state policymakers are turning more to projections of education demand to frame how the state plans to meet the need for a highly skilled workforce. This contextual framing is transforming the role of workforce development, which is tasked with meeting workforce needs, avoiding skill gaps, and being flexible in the face of change brought on by globalization. Employer demand for talent has elevated the importance of workers with specific skills gained through postsecondary education and training. While partnerships between economic developers and businesses – as well as those between postsecondary institutions and businesses – are common, strong alliances among all three groups can together better address the mismatch between jobs and workers.28
State example: Indiana
The Indiana Chamber of Commerce and Indiana Chamber Foundation created IndianaSkills in 2012 as an online job database for learners, job seekers, and career counselors.29 Originally, this was a supply-demand resource of occupations requiring short-term credentials (Associate’s degrees, certificates, and certifications), but it was expanded in 2014 to occupations calling for Bachelor’s degrees and higher. Employers can use the information to compare educational requirements by job, view wages that Indiana employees earn in distinct occupations, and create job descriptions. Economic developers can access information on the wages and the percentage of those who complete education and training programs who are employed, jobs with the highest demand, and the training and certifications most in demand.
Data to be integrated Projections of educational demand in the workforce,30 proprietary analytical information, and college administrative data can be linked with state wage records into the process of retaining and attracting employers and industries to the state.31
Audience Economic development agencies, workforce boards, and employers
EDUCATION PROJECTIONS, BUSINESS EXPANSION, AND WORKFORCE QUALITY

Career Pathways: Five Ways to Connect College and Careers 9
Data to be integratedOccupation- and industry-specific employment and earnings data can be linked with student enrollment data to aid program design, planning, and review.37
Audience College and system administrators, deans, and faculty
PROGRAM ALIGNMENT WITH LABOR MARKET DEMAND
Overview
32 LaunchBoard, https://www.calpassplus.org/Launchboard/Home.aspx. 33 Booth and Perry, "The CCC 'CTE LaunchBoard,' ” 2015.34 Ibid.35 Training and Education Planning System (TEPS), http://www1.ctdol.state.ct.us/
TEPS/Default.aspx; Connecticut Academy of Science and Engineering, “Strategies for Evaluating the Effectiveness of Programs and Resources,” 2012.
36 A full list of caveats is available at the TEPS website, http://www1.ctdol.state.ct.us/TEPS/FAQs.aspx#caveats.
37 For more information on LMI data sources, see the appendix.
Administrators at the college and systems levels are using workforce data to measure demand for different career fields in their local labor markets in order to make decisions about which programs to add, expand, contract, or discontinue. When college leaders are aware of the demand for their programs’ graduates, it signals to both learners and state leaders the college’s commitment to preparing students for careers.
State example: California
In California, the LaunchBoard was conceived in 2012 by a group of career and technical education (CTE) stakeholders. The California Community College Chancellor’s Office released a beta version of the LaunchBoard in 2013 and launched its second iteration in 2016.32 Designed as an internal tool for California community college and K-12 school district leaders, its purpose is to help modify and improve CTE programs. It includes supply and demand information on earnings outcomes of graduates, student enrollment patterns, and impact of programs on groups such as veterans and first-generation students.33 The 2016 improvements realigned existing metrics to state and federal initiatives and feature dynamic reports with answers to practitioners’ common questions.34
State example: Connecticut
The Training and Education Planning System was created in 2008 by the Connecticut Department of Labor to allow state college administrators to consider labor market skill shortages or surpluses for the programs they offer.35 The system incorporates state occupational projections and information about people who completed programs, using data from federal sources, the Connecticut Office of Higher Education, and the Connecticut Department of Education. The results are organized by occupation and program of study, and include a short description for each profession, average earnings for selected jobs, and tables projecting the annual number of graduates in each field compared to the number of available jobs.3637

Career Pathways: Five Ways to Connect College and Careers10
Data to be integrated Occupational data and employer/industry expert feedback can be combined with the process of developing competencies and learning outcomes for postsecondary education and training programs.42
Audience Faculty, curriculum developers, and administrators
Overview
38 Lumina Foundation’s Connecting Credentials initiative identifies the development of a common language to serve as the basis for a connected credentialing system as one of seven priority areas in its action plan, http://connectingcredentials.org/wp-content/uploads/2016/09/Action-Plan.pdf.
39 Skills Outcomes Analysis, https://sws.tstc.edu/soahome/soa/9/zpublic.php. The Skills Outcome Analysis tool was developed as a pilot project that will undergo changes and improvements in the implementation phase.
40 Bettersworth, “Announcing C4EO,” 2014.41 Curriculum Alignment Initiative, http://www.c4eo.org/curriculum-alignment.
Other agency partners are the Texas Higher Education Coordinating Board and the Texas Education Agency.
42 For more information on LMI data sources, see the appendix.
Learners, workers, educators, and employers differ in their descriptions of the competencies gained, taught, and valued in the job market.38 Whether as part of a competency-based or traditional education program, curriculum alignment that starts with data analysis is necessary for colleges to keep student learning relevant to the competencies demanded by industry, as well as to establish stronger ties to employers. Employers also can tailor their job ads to include academic competencies that employees need. These activities can build bidirectional, mutually reinforcing partnerships in which the contribution of each party is valued.
State example: Texas
The Center for Employability Outcomes, an applied research center of Texas State Technical College, created the Skills Outcome Analysis in 2014 to help colleges match what is taught in the classroom with work performed in business and industry.39 The online analytical tool incorporates more than 3,000 skills for more than 900 occupations from 1,400 Texas employers.40 The skills were validated by 4,000 subject matter experts. In all, 26 Texas colleges have used the tool to align 1,300 courses and 83 postsecondary credentials.4142
CURRICULUM ALIGNMENT WITH WORKFORCE REQUIREMENTS

Career Pathways: Five Ways to Connect College and Careers 11
COUNSELING AND CAREER PATHWAYS
Overview
43 Virginia Education Wizard, https://www.vawizard.org/wizard/home; Langhorne, “Virginia Launches 'Education Wizard,'” 2009.
44 rccinfo, community contributor, “Updated ‘Virginia Education Wizard’ to be Launched,” 2016.
45 Center for Urban Research, Career Maps, http://www.gc.cuny.edu/lmis/information/career_maps.
46 For more information on LMI data sources, see the appendix.
Many learners, especially those with little or no work experience, often make life-altering decisions under a cloud of uncertainty about how their postsecondary choices will affect their employment outcomes, the path needed to reach those outcomes, the likelihood of success, and whether their career will line up with their abilities, preferences, and interests. High school counselors and college advisors are designated to guide students through these tough decisions, but these professionals often have scarce time and resources and are unable to address the needs of all students. States and postsecondary systems have been looking to provide additional guidance to those who need it most, including low-income and first-generation college students. Many colleges are using predictive analytics to identify course-taking patterns, course completion rates, and other factors that might help determine the keys that lead to student progress and success. If provided with proper information and guidance, students leave high school better prepared for college, choose majors aligned to their personality and interests, and develop reasonable career expectations.
State example: Virginia
In 2009, the Virginia Community College System (VCCS) created the Virginia Education Wizard, an online portal that takes into account the skills, interests, and values of learners and helps them make decisions about careers and postsecondary education and training options.43 The newest version, released in January 2016, updates existing information on career pathways, curricula, and financial assistance, adds a new portal designed by and for veterans attending VCCS institutions, and features a game for teenagers, Imagine, that suggests occupations, with wages, that would allow them to afford the particular lifestyle they wish to enjoy.44
State example: New York
The NYC Labor Market Information Service at the City University of New York (CUNY) Graduate Center began creating Career Maps in 2014.45 The five career maps produced to date allow CUNY students to plan career trajectories for themselves as they acquire more skills or attain higher levels of education. The maps include flowcharts of
Data to be integrated Occupational and labor market data, employment projections, wages, and student skill, value, and interest assessment data can all be added to the student career counseling process to inform college major and career selection.46
Audience College advisors and middle school and high school counselors

Career Pathways: Five Ways to Connect College and Careers12
different tiers of the most common career progressions based on actual work histories. They also include the median annual salary of workers in each position, the typical educational requirements needed to hold that position, and details on which CUNY institutions offer the necessary credentials to advance in those careers. The careers that are mapped include medical assisting, home health, bookkeeping and accounting, tech support, and cooks and chefs.47
State example: Colorado
Launch My Career Colorado is an online dashboard that allows high school students to visualize the return on investment from a credential at a particular Colorado postsecondary institution.48 College Measures at the American Institutes for Research developed the dashboard in 2016 with data from the Colorado Department of Labor and Employment, the Colorado Department of Higher Education, and Gallup. Learners and workers can select jobs and view an occupational description, the expected earnings over a 20-year period compared to those of high school graduates, a list of associated skills common to the industry, and the highest degrees common to workers in the field. They can also view how many years it will take for them to break even after paying off their college loans given their current and expected spending habits.49
47 Additional maps are being developed for human services and social work, network support and administration, web development and web design, and software development.
48 Launch My Career Colorado, http://launchmycareercolorado.org/. 49 Hendee, “New Colorado Website Shows Career Value of College Majors,” 2016.
Career Pathways: Five Ways to Connect College and Careers 13
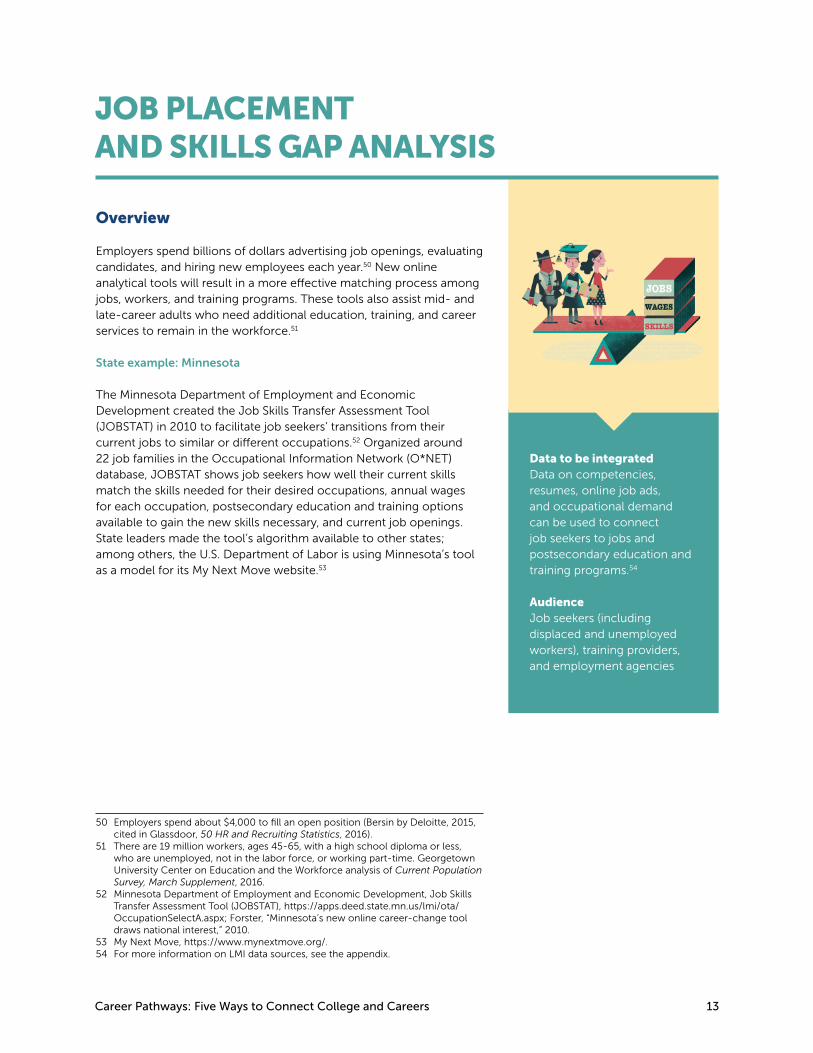
Data to be integrated Data on competencies, resumes, online job ads, and occupational demand can be used to connect job seekers to jobs and postsecondary education and training programs.54
Audience Job seekers (including displaced and unemployed workers), training providers, and employment agencies
Overview
50 Employers spend about $4,000 to fill an open position (Bersin by Deloitte, 2015, cited in Glassdoor, 50 HR and Recruiting Statistics, 2016).
51 There are 19 million workers, ages 45-65, with a high school diploma or less, who are unemployed, not in the labor force, or working part-time. Georgetown University Center on Education and the Workforce analysis of Current Population Survey, March Supplement, 2016.
52 Minnesota Department of Employment and Economic Development, Job Skills Transfer Assessment Tool (JOBSTAT), https://apps.deed.state.mn.us/lmi/ota/OccupationSelectA.aspx; Forster, “Minnesota’s new online career-change tool draws national interest,” 2010.
53 My Next Move, https://www.mynextmove.org/. 54 For more information on LMI data sources, see the appendix.
Employers spend billions of dollars advertising job openings, evaluating candidates, and hiring new employees each year.50 New online analytical tools will result in a more effective matching process among jobs, workers, and training programs. These tools also assist mid- and late-career adults who need additional education, training, and career services to remain in the workforce.51
State example: Minnesota
The Minnesota Department of Employment and Economic Development created the Job Skills Transfer Assessment Tool (JOBSTAT) in 2010 to facilitate job seekers’ transitions from their current jobs to similar or different occupations.52 Organized around 22 job families in the Occupational Information Network (O*NET) database, JOBSTAT shows job seekers how well their current skills match the skills needed for their desired occupations, annual wages for each occupation, postsecondary education and training options available to gain the new skills necessary, and current job openings. State leaders made the tool’s algorithm available to other states; among others, the U.S. Department of Labor is using Minnesota’s tool as a model for its My Next Move website.5354
JOB PLACEMENT AND SKILLS GAP ANALYSIS

Career Pathways: Five Ways to Connect College and Careers14
The state examples featured in the Five Ways are a good start toward building what America needs. State data systems that connect college with careers are becoming more common, and we now have more data than ever. State leaders realize, however, that existing data has not been translated into useful information to support decision-making. The tools developed to date hold much promise and are a step in the right direction, but if their implementation is piecemeal rather than part of a coordinated statewide process, the gulf between the postsecondary and workforce sectors is likely to remain.
Learners and workers may want to choose their college and select their major based on the workforce outcomes of graduates,55 but without a true navigational system, the process is mostly guesswork. As our economy becomes more knowledge-based, information is becoming our greatest resource. But all the data and consumer information now being collected must be converted to smart data.56 Until then, it will be difficult for learners and workers to make sound college and career choices. And it will be harder for employers to pick the best talent.
The Learning and Earning Exchange is a framework for the next generation of data use that capitalizes on integrated data available to states. The five practices featured in this report are the beginning of a smart education and career guidance system. As the state examples show, these tools are not static; in many states, they have evolved from the pilot stage to implementation, and they are constantly being improved. They also require an active outreach component to attract the intended audience. The good news is that states can borrow ideas from other states and implement tools in any one of these five practices within a year or two. What is needed now is to promote their use more broadly within and across states.
Harnessing the power of integrated data to provide learners, workers, families, colleges, employers, and policymakers with information can help state leaders improve their economies and also the quality of life for their residents. Connecting the education system to careers has the potential to help state governments use public education and training funds more efficiently and promote economic development and growth. This would revitalize the American education system as the gateway to economic opportunity.
55 Fishman, “2015 College Decisions Survey,” 2015.56 The federal College Scorecard does not go far enough in helping learners, since it presents aggregate,
average salary information for an entire institution and not individual programs of study (Sandeen, “Here's the Score for Obama's College Scorecard,” 2015).
CONCLUSION

Career Pathways: Five Ways to Connect College and Careers 15
Akerlof, George A. “ The Market for ‘Lemons’: Quality Uncertainty and the Market Mechanism.” The Quarterly Journal of Economics (1970): 488-500.
Armstrong, John, and Christina Whitfield. Strong Foundations: The State of State Postsecondary Data Systems: 2016. Boulder, CO: State Higher Education Executive Officers, 2016.
Armstrong, John, and Katie Zaback. “Assessing and Improving State Postsecondary Data Systems.” Washington, DC: Institute for Higher Education Policy, 2016.
Baker, Rachel, Eric Bettinger, Brian Jacob, and Ioana Marinescu. “The Effect of Labor Market Information on Community College Students’ Major Choice.” National Bureau of Economic Research Working Paper 23333, 2017. http://www.nber.org/papers/w23333.
Bettersworth, Michael. “Announcing C4EO – A Response to the Employability Mandate.” TSTC Forecasting, 2014. http://forecasting.tstc.edu/featured/c4eo/.
Booth, Kathy, and Patrick Perry. “The CCC ‘CTE LaunchBoard’: How a Program-Specific Labor Market Information Portal Is Redefining the Use of and Demand for Dashboards.” Presentation at California Association for Institution Research 40th Annual Conference.” San Francisco, CA, November 4-6, 2015. http://www.cair.org/conferences/past-conferences/cair-2015-conference-papers-and-presentations/.
Brown, Emily J. Shifting Workforce Development into High Gear. Washington, DC: International Economic Development Council, 2015.
Cappelli, Peter. Will College Pay Off?: A Guide to the Most Important Financial Decision You’ll Ever Make. New York, NY: PublicAffairs, 2015.
Carnevale, Anthony P. We Need a New Deal Between Higher Education and Democratic Capitalism. Washington, DC: Georgetown University Center on Education and the Workforce, 2017.
Carnevale, Anthony P., and Stephen J. Rose. The Economy Goes to College: The Hidden Promise of Higher Education in the Post-Industrial Service Economy. Washington, DC: Georgetown University Center on Education and the Workforce, 2015.
Carnevale, Anthony P., Ban Cheah, and Andrew R. Hanson. The Economic Value of College Majors. Washington, DC: Georgetown University Center on Education and the Workforce, 2015.
Carnevale, Anthony P., Stephen J. Rose, and Andrew R. Hanson. Certificates: Gateway to Gainful Employment and College Degrees. Washington, DC: Georgetown University Center on Education and the Workforce, 2012.
Carnevale, Anthony P., Nicole Smith, Michelle Melton, and Eric W. Price. Learning While Earning: The New Normal. Washington, DC: Georgetown University Center on Education and the Workforce, 2015.
REFERENCES

Career Pathways: Five Ways to Connect College and Careers16
Carnevale, Anthony P., Nicole Smith, and Jeff Strohl. Help Wanted: Projections of Jobs and Education Requirements through 2018. Washington, DC: Georgetown University Center on Education and the Workforce, 2010.
Carnevale, Anthony P., Nicole Smith, and Jeff Strohl. Recovery: Job Growth and Education Requirements through 2020. Washington, DC: Georgetown University Center on Education and the Workforce, 2013.
Center for Employability Outcomes, Texas State Technical College, “Skills Outcomes Analysis: A Detailed Occupational Skill & Learning Outcome Alignment and Gap Analysis System,” 2013. https://sws.tstc.edu/soahome/soa/9/zpublic.php.
Center for Employability Outcomes, Texas State Technical College. “Curriculum Alignment Initiative,” 2016. http://www.c4eo.org/curriculum-alignment.
Center for Urban Research, City University of New York. “Career Maps,” 2014-2016. http://www.gc.cuny.edu/lmis/information/career_maps.
The College Board. Trends in College Pricing 2015. New York, NY: The College Board, 2015.
Connecticut Academy of Science and Engineering. Strategies for Evaluating the Effectiveness of Programs and Resources for Assuring Connecticut’s Skilled Workforce Meets the Needs of Business and Industry Today and in the Future, 2012. http://www.ctcase.org/summaries/workforce_sum.pdf.
Connecticut Department of Labor. “Training and Education Planning System (TEPS).” n.d. http://www1.ctdol.state.ct.us/TEPS/Default.aspx.
ConnectingCredentials.org. Connecting Credentials: From National Dialogue to Collective Action: Building Learning-based Credentialing Systems. Indianapolis, IN: Lumina Foundation and Corporation for a Skilled Workforce, 2016. http://connectingcredentials.org/wp-content/uploads/2016/09/Action-Plan.pdf.
Engle, Jennifer. Answering the Call: Institutions and States Lead the Way Toward Better Measures of Postsecondary Performance. Seattle, WA: Bill & Melinda Gates Foundation, 2016. http://postsecondary.gatesfoundation.org/wp-content/uploads/2016/02/AnsweringtheCall.pdf.
Engle, Jennifer, and Daniel Greenstein. “Leading with Data.” Impatient Optimists, October 22, 2015.
Fishman, Rachel. “2015 College Decisions Survey: Part I: Deciding to Go to College.” Washington, DC: New America, 2015. https://www.newamerica.org/education-policy/edcentral/collegedecisions/.
Forster, Julie. “Minnesota’s New Online Career-Change Tool Draws National Interest.” Twin Cities Pioneer Press, June 9, 2010 (updated November 12, 2015). http://www.twincities.com/2010/06/09/minnesotas-new-online-career-change-tool-draws-national-interest/.
Garcia, Tanya I., and Hans Peter L’Orange. Strong Foundations: The State of State Postsecondary Data Systems. Boulder, CO: State Higher Education Executive Officers, 2010.

Career Pathways: Five Ways to Connect College and Careers 17
Garcia, Tanya I., and Hans Peter L’Orange. Strong Foundations: The State of State Postsecondary Data Systems: 2012 Update on Data Sharing with K-12 and Labor. Boulder, CO: State Higher Education Executive Officers, 2012.
Glassdoor. 50 HR and Recruiting Statistics for 2016: A Statistical Reference for Savvy Recruiters. Mill Valley, CA: Glassdoor for Employers, 2016.
Hanushek, Eric A., Ludger Woessmann, and Lei Zhang. “General Education, Vocational Education, and Labor-Market Outcomes over the Life-Cycle.” NBER Working Paper No. 17504. National Bureau of Economic Research, 2011.
Harris, Elizabeth A. “Little College Guidance: 500 High School Students Per Counselor.” The New York Times, December 25, 2014.
Hendee, Caitlin. “New Colorado Website Shows Career Value of College Majors.” Denver
Business Journal, June 9, 2016 (updated June 10, 2016). http://www.bizjournals.com/denver/news/2016/06/09/new-colorado-website-shows-career-value-of-college.html.
Indiana Chamber of Commerce. IndianaSkills, 2012-2017. http://www.indianaskills.com/.
Indiana Chamber of Commerce. “Chamber’s IndianaSkills.Com Site Now Also Features Supply and Demand Job Info for Bachelor’s Degree Level and Higher.” Indiana Chamber of Commerce. November 20, 2014. http://www.indianachamber.com/index.php/media-center/press-releases/3200-chamber-s-indianaskills-com-site-now-also-features-supply-and-demand-job-info-for-bachelor-s-degree-level-and-higher.
King, Brett. “Too Much Content: A World of Exponential Information Growth.” Huffington Post, January 18, 2011 (updated May 25, 2011). http://www.huffingtonpost.com/brett-king/too-much-content-a-world-_b_809677.html.
Langhorne, Nicholas. “Virginia Launches ‘Education Wizard.’” Richmond Times-Dispatch, March 12, 2009. http://www.richmond.com/news/local/chesterfield/article_ba11e35e-c190-59e2-934a-07b44238e580.html.
Lohr, Steve. “The Age of Big Data.” The New York Times, February 11, 2012. http://www.nytimes.com/2012/02/12/sunday-review/big-datas-impact-in-the-world.html.
Minnesota Department of Employment and Economic Development. “Job Skills Transfer Assessment Tool (JOBSTAT),” 2013-2017. https://apps.deed.state.mn.us/lmi/ota/OccupationSelectA.aspx.
Network Indiana. “Indiana Chamber Unveils Database For Job Seekers.” Indiana Public Media, October 29, 2012. http://indianapublicmedia.org/news/indiana-chamber-unveils-database-job-seekers-38936/.
Phillips, Brad C., and Jordan E. Horowitz. “Big Data Alone Won’t Help Students: Educators Must Know How to Make Sense of and Use the Information.” The Chronicle of Higher Education, April 9, 2017.
“rccinfo,” community contributor. “Updated ‘Virginia Education Wizard’ to be Launched.” Tidewater Review, January 20, 2016. http://www.dailypress.com/tidewater-review/news/community/tr-ugc-article-updated-virginia-education-wizard-to-be-lau-2016-01-22-story.html.

Career Pathways: Five Ways to Connect College and Careers18
San Joaquin Delta College and Educational Results Partnership. LaunchBoard. Cal-Pass Plus. n.d. https://www.calpassplus.org/Launchboard/Home.aspx.
Sandeen, Cathy. “Here’s the Score for Obama’s College Scorecard: More Minuses Than Pluses.” The Conversation, September 18, 2015. http://theconversation.com/heres-the-score-for-obamas-college-scorecard-more-minuses-than-pluses-47731.
Shapiro, Carl. “Consumer Information, Product Quality, and Seller Reputation.” The Bell Journal of Economics (1982): 20-35.
State Higher Education Executive Officers. “SHEF: FY 2016: State Higher Education Finance.” Boulder, CO: State Higher Education Executive Officers Association, 2017.
State of Colorado. Launch My Career Colorado. n.d. http://launchmycareercolorado.org/.
U.S. Census Bureau, American Community Survey: 2009-2015. Washington, DC: U.S. Census Bureau, 2015. http://www2.census.gov/.
U.S. Census Bureau and Bureau of Labor Statistics, Current Population Survey, March Supplement (Annual Economic and Social Supplement). Washington, DC: U.S. Census Bureau and Bureau of Labor Statistics, 1980, 2016. https://thedataweb.rm.census.gov/ftp/cps_ftp.html.
U.S. Department of Education. National Center for Education Statistics. Integrated Postsecondary Education Data System, Classification of Instructional Programs Resources, 1985-2010. https://nces.ed.gov/ipeds/cipcode/resources.aspx?y=55.
U.S. Department of Education. National Center for Education Statistics. Digest of Education Statistics tables, 2015. https://nces.ed.gov/programs/digest/.
U.S. Department of Labor, Bureau of Labor Statistics. Occupational Employment Statistics, 2015. https://www.bls.gov/oes/.
U.S. Department of Labor, Employment and Training Administration. My Next Move, n.d. https://www.mynextmove.org/.
Virginia Community College System (VCCS). Virginia Education Wizard, 2008-2016. https://www.vawizard.org/wizard/home.
Wyatt, Ian D., and Hecker, Daniel E. “Occupational changes during the 20th Century.” Monthly Labor Review. 129 (2006): 35.

Career Pathways: Five Ways to Connect College and Careers 19
The Five Ways call for integration of postsecondary and workforce data to support individual, organizational, and policy decisions. The federally funded Statewide Longitudinal Data Systems (SLDS) program that began in 2005 has evolved to become the primary repository for integrated data from preschool through the workforce. This appendix provides an overview of the sources of labor market information (LMI) and the type of information the sources can provide. Some sources are publicly available and accessible, others are accessible to authorized state or federal policymakers for limited purposes, and other sources are available through third-party vendors.
Survey Data
The U.S. Census Bureau and the Bureau of Labor Statistics conduct surveys of households and employer establishments. Results are publicly available and provide a good snapshot of the employment, earnings, occupation, and industry makeup of the labor market and of worker demographics. While surveys are a good source of data about general labor market demand, states must connect administrative workforce and education data to reach the level of insights detailed in this report. Survey data can be used to augment information from these databases, especially in areas for which legal, privacy, or availability issues make the use of administrative data impractical.
AMERICAN COMMUNITY SURVEY (ACS)
An annual household survey that includes the following data:
Q Demographics Q Employment Q Earnings Q Occupation Q Industry Q Number of hours worked per week Q Number of weeks worked per year Q Place of residence/employment (for state and local
level analysis)
Examples of what this data source has to offer:
» Occupations in demand in the local labor market » Earnings by educational attainment in the local
labor market » Highest paid jobs by occupation and industry
APPENDIX: LABOR MARKET INFORMATION DATA SOURCES, CHARACTERISTICS, AND POTENTIAL USES

Career Pathways: Five Ways to Connect College and Careers20
CURRENT POPULATION SURVEY (CPS)
Monthly survey of a rotating group of households that includes the following data:
Q Demographics Q Employment Q Earnings Q Occupation Q Industry Q Number of hours worked per week Q Number of weeks worked per year Q Place of residence/employment
(for state level analysis)
Examples of what this data source has to offer:
» Employment levels in different occupations » Distribution of education level for workers in
different occupations
CPS ANNUAL SOCIOECONOMIC SUPPLEMENT
Annual household survey that includes the following data:
Q Demographics Q Employment Q Earnings Q Occupation Q Industry Q Number of hours worked per week Q Number of weeks worked per year Q Place of residence/employment
(for state-level analysis)
Examples of what this data source has to offer:
» Employment levels in different occupations » Earnings by educational attainment » Distribution of education level for workers in
different occupations
CURRENT EMPLOYMENT STATISTICS (CES)
Monthly survey of employers that includes the following data:
Q Employment Q Earnings Q Industry Q Number of hours employees worked per week Q Location of the firm (for state-level analysis)
Examples of what this data source has to offer:
» Top-paying industries in the state » Industry sectors in the state that employ the largest
numbers of workers

Career Pathways: Five Ways to Connect College and Careers 21
OCCUPATIONAL EMPLOYMENT STATISTICS (OES)
Semi-annual survey of employers that includes the following data:
Q Occupational employment Q Earnings by occupation Q Breakdown of occupations by industry Q Geography: for analysis of occupations at the state
and local level
Examples of what this data source has to offer:
» List of growing occupations » Distribution of earnings within occupations
Administrative Data
Administrative data is collected in the process of administering specific government programs at the federal and state levels, such as unemployment insurance (UI) and Social Security. The advantage of these data sources is that they contain individual records on the vast majority of workers, which theoretically could be connected to other data sources to determine each individual’s specific education and training history, as well as career paths. While these data generally are not publicly accessible and involve strict limitation on who can use them and for what purposes, states are finding ways to incorporate administrative data, in particular from state UI wage records, into their SLDS.
State Administrative Data Sources
STATE UNEMPLOYMENT INSURANCE (UI) WAGE RECORDS
State UI wage records are often the main sources of administrative labor market information (LMI) that states use to create informational tools for consumers and stakeholders. UI wage records cover the majority of employees in any state (the exceptions are federal government workers, the self-employed, and individuals working for employers outside of the state). The de-identified, aggregated information from these records is also reported in the Quarterly Census of Employment and Wages (QCEW). At a minimum, all states collect employment and wages on a quarterly basis. Outside of collecting and reporting federally mandated data, some states also collect information on hours and weeks worked, tips and bonuses, gender of workers, work site location, etc. Occupational data is one enhancement that is gaining traction because of its potential in connecting fields of study to careers. In general, UI data is accessible to authorized users and is the primary source of LMI in SLDS. States can also get LMI on residents who work out of state and students who move out of state through the Wage Record Interchange System (WRIS) 2 sharing agreements.
UI wage records include the following data:
Q Employment Q Earnings Q Industry Q Employer Q Place of employment Q Other (state-dependent, which may include
demographics)
Examples of what this data source has to offer:
» Employment and earnings of graduates from different institutions and programs of study
» Types of education and training options that lead to jobs in a particular career field

Career Pathways: Five Ways to Connect College and Careers22
STATE TAX RECORDS
The states annually collect information on employed workers through state tax returns. The data in tax returns potentially could be linked to other individual data at the state level and made available in de-identified, aggregated form. State tax returns include the following data:
Q Employment Q Earnings Q Occupation (self-reported) Q Employer Q Place of residence/employment
Examples of what this data source has to offer:
» Employment and earnings of workers residing in the state
» Occupation of workers residing in the state » Workforce outcomes of high school graduates who
do not pursue postsecondary education » Share of graduates who find jobs in their field
within a certain period following graduation
Federal Administrative Data Sources
FEDERAL EMPLOYMENT DATA EXCHANGE SYSTEM (FEDES)
The U.S. Office of Personnel Management collects quarterly information on federal military and civilian employees (except the U.S. Postal Service). Under the FEDES pilot program, extracts of individual federal employee records are provided to the 41 participating states and the District of Columbia and include the following types of data:
Q Employment Q Earnings
Examples of what this data source has to offer:
» Supplementing state UI wage records with information on employment and earnings of federal government employees working in the state
» Tracking earnings of college graduates who enter the military

Career Pathways: Five Ways to Connect College and Careers 23
INTERNAL REVENUE SERVICE (IRS) RECORDS
Information is reported annually to the IRS through tax forms that include the following data:
Q Employment Q Earnings Q Industry (for some records) Q Occupation (self-reported) Q Employer Q Place of residence/employment
Examples of what this data source has to offer:
» Employment and wage outcomes for all students who attended different programs of study at different institutions in the state
» Career pathways based on changes in jobs and wages of graduates over a certain period of time
» Supplementing financial aid records from SLDS with information on student loan interest rate deduction and other education tax credits
SOCIAL SECURITY ADMINISTRATION (SSA) RECORDS
Information collected annually from tax forms includes the following data:
Q Employment Q Earnings Q Industry (for some records)
Examples of what this data source has to offer:
» Employment and wage outcomes for all students who attended different programs of study at different institutions in the state
» Geographic distribution of college graduates relative to colleges attended
» Number of workers who hold multiple jobs
Federal administrative data sources currently not accessible for creation of state tools
While LMI from the Internal Revenue Service (IRS) and Social Security Administration (SSA) is not accessible to states, it represents a potentially rich source of data with which to supplement other administrative data sources. These data sources are more comprehensive and would offer a greater level of accuracy if their use was authorized.

Career Pathways: Five Ways to Connect College and Careers24
Aggregated Databases
These databases are large aggregated sources of survey, administrative, and other data developed for particular purposes. These databases offer a more comprehensive view of the world of work and the state of the labor market. Some of these are publicly accessible; others are limited by law and require authorized access.
OCCUPATIONAL INFORMATION NETWORK (O*NET)
This U.S. Department of Labor, Employment and Training Administration database contains descriptive occupational information that is continually updated through surveys of workers in each occupation as well as expert input.
The information includes the education, knowledge, skills, and abilities necessary to perform jobs in each occupation; occupational interests, work values, and work styles associated with each occupation; and tasks, work activities, and organizational and work contexts that are part of performing job duties within each occupation.
Examples of what this data source has to offer:
» Knowledge, skills, and abilities required for jobs in different occupations
» Assessment of how well a program’s curriculum matches competencies demanded in particular occupations
» Different occupations that require similar skills, so workers considering a career change can identify new possibilities
» Identification of what workers in a particular career (occupation) do
LONGITUDINAL EMPLOYER-HOUSEHOLD DYNAMICS (LEHD)
The U.S. Census Bureau coordinates the state-federal Local Employment Dynamics (LED) Partnership project that collects and disseminates LEHD data. It combines state administrative data with federal administrative and survey data from employers and workers to provide a more complete picture of the labor market.
LEHD information includes employment, earnings, hires, separations, job changes, worker demographics (gender, age, race, and ethnicity), and worker education, along with industry, sector, age, and size of the employer. Information is available at the state and local level. OnTheMap is an interactive mapping and reporting tool using LEHD data that shows the overlap between where workers live and work.
Examples of what this data source has to offer:
» Geographic distribution of jobs in the local area for workers with a particular level of education
» Hiring practices of large and small businesses with regard to worker demographics in the local geographic area
» Worker mobility from declining sectors

Career Pathways: Five Ways to Connect College and Careers 25
Emerging Data Sources
The Internet has become a central place for job search and recruitment. These activities leave a digital footprint that can be analyzed to get a “real-time” picture of demand and supply in local labor markets.
JOB POSTINGS DATA
Employers are increasingly posting job openings online, in particular when they are looking for workers with a college education. Employers post job openings both on their own websites and on electronic job boards, such as Monster.com and Careerbuilder.com. There is no standard format for online job postings. The number of job postings, which employers post job openings, and the industries and sectors of the economy they represent all provide important information on the current employer demand within state and local labor markets. The job titles for the postings add another layer of important information, especially if titles can be tied to occupations. The contents of the postings offer information about qualifications employers are looking for from workers. When aggregated across a variety of different sources and large swaths of the labor market, they can reveal important trends that can inform the decisions of learners, workers, education and training providers, economic and workforce developers, and state policymakers. A number of private vendors, such as Burning Glass and EMSI, are involved in efforts to aggregate information from job postings data.
Examples of what this data source has to offer:
» Employers posting the most job ads » Occupations with the highest online demand based
on numbers of jobs ads » Skills employers are requesting of employees in
different career fields
RESUME/PROFILE DATA
The flipside of the online job marketplace are resumes and profiles that workers post on job boards and professional networking sites, such as LinkedIn. When aggregated and made anonymous, these data can offer significant insights into workers’ current and desired occupations, education and training, previous job experience, technical and soft skills, credentials, career interests, and career pathways. States often have their own resume banks. Another option is third-party vendors, who either collect resumes themselves or aggregate resume data across different sources.
Examples of what this data source has to offer:
» Examination of education and career pathways for individuals moving within and between different career fields and education and training experiences
» Identification of related job titles, responsibilities, and skill sets in typical workers’ career progressions

Career Pathways: Five Ways to Connect College and Careers26
Table 1: Labor Market Information Data Sources at a Glance
Basic Information Types of Data Characteristics
Source Type Source Unit of Analysis
Employment Earnings Demographics Occupation Industry Employer Characteristics
Occupational Characteristics
Other Publicly accessible
Authorized users only
Snapshot/ trend analysis
Longitudinal analysis
Local analysis
Individual outcomes
analysis
Survey American Community Survey (ACS)
Household Sample
Current Population Survey (CPS)
Household Sample
CPS Annual Socioeconomic Supplement
Household Sample
Current Employment Statistics (CES)
Employer Sample
Occupational Employment Statistics (OES)*
Occupation* * * * *
Administrative State Unemployment Insurance (UI) wage records**
Individual **
State tax records Individual
Federal Employment Data Exchange System (FEDES)***
Individual
Internal Revenue Service (IRS) Individual
Social Security Administration (SSA)
Individual
Aggregated Occupational Information Network (O*NET)
Occupation
Longitudinal Employer-Household Dynamics (LEHD)
State/local area
Emerging Job postings Job ads
Resumes Individual
Note: Though all administrative data is not publicly accessible, state UI wage records, state tax records and FEDES data are potentially accessible to authorized users within state governments, while SSA and IRS data are not currently accessible to the states for use in information tools.* OES provides occupational employment, average and median wages, and distribution of occupations by industry. ** Collection of demographic data depends on the state.*** FEDES data cover federal civilian and military employees.

Career Pathways: Five Ways to Connect College and Careers 27
Table 1: Labor Market Information Data Sources at a Glance
Basic Information Types of Data Characteristics
Source Type Source Unit of Analysis
Employment Earnings Demographics Occupation Industry Employer Characteristics
Occupational Characteristics
Other Publicly accessible
Authorized users only
Snapshot/ trend analysis
Longitudinal analysis
Local analysis
Individual outcomes
analysis
Survey American Community Survey (ACS)
Household Sample
Current Population Survey (CPS)
Household Sample
CPS Annual Socioeconomic Supplement
Household Sample
Current Employment Statistics (CES)
Employer Sample
Occupational Employment Statistics (OES)*
Occupation* * * * *
Administrative State Unemployment Insurance (UI) wage records**
Individual **
State tax records Individual
Federal Employment Data Exchange System (FEDES)***
Individual
Internal Revenue Service (IRS) Individual
Social Security Administration (SSA)
Individual
Aggregated Occupational Information Network (O*NET)
Occupation
Longitudinal Employer-Household Dynamics (LEHD)
State/local area
Emerging Job postings Job ads
Resumes Individual
Note: Though all administrative data is not publicly accessible, state UI wage records, state tax records and FEDES data are potentially accessible to authorized users within state governments, while SSA and IRS data are not currently accessible to the states for use in information tools.* OES provides occupational employment, average and median wages, and distribution of occupations by industry. ** Collection of demographic data depends on the state.*** FEDES data cover federal civilian and military employees.

Career Pathways: Five Ways to Connect College and Careers28
Appendix References
Administrative Wage Record Enhancement Study Group. Enhancing Unemployment Insurance Wage Records Potential Benefits, Barriers and Opportunities: A Summary of First Year Study Activities and Findings. Washington, DC: Workforce Information Council, 2014.
The Aspen Institute. Using Labor Market Data to Improve Student Success. Washington DC: The Aspen Institute, 2014.
Booth, Kathy, John Carrese, Laura Coleman, Evgeniya Lindstrom, Theresa Milan, Lori Sanchez, and Nick Kremer. Making Use of Labor Market Information: Where to Find Data for Common Community College Decisions. Sacramento, CA: California Community Colleges Chancellor’s Office Vocational Education Research and Technical Advisory Committee, 2015.
Booth, Kathy, John Carrese, Laura Coleman, Evgeniya Lindstrom, Theresa Milan, Lori Sanchez, and Nick Kremer. Understanding Labor Market Information Resources: Descriptions, Benefits and Limitations. Sacramento, CA: California Community Colleges Chancellor’s Office Vocational Education Research and Technical Advisory Committee, 2015.
The Jacob France Institute, University of Baltimore. Federal Employment Data Exchange System (FEDES), 2016. v://www.ubalt.edu/jfi/fedes/.
The Jacob France Institute, University of Baltimore. Federal Employment Data Exchange System (FEDES) Fact Sheet, 2016. http://www.ubalt.edu/jfi/fedes/documents/FEDES-Factsheet-May-2016.pdf.
National Center for O*NET Development. O*NET OnLine. n.d. https://www.onetonline.org/.
Office of Child Support Enforcement, Administration for Children and Families. “Overview of National Directory of New Hires,” 2015. http://www.acf.hhs.gov/css/resource/overview-of-national-directory-of-new-hires.
Schiorring, Eva. Research Brief: Effective Use of Labor Market Information. Sacramento, CA: The Research and Planning Group for California Community Colleges, 2013.
U.S. Bureau of Labor Statistics. Current Employment Statistics – CES (National), Washington, DC: U.S. Department of Labor, 2016. http://www.bls.gov/ces/.
U.S. Bureau of Labor Statistics. Labor Force Statistics for the Current Population Survey. Washington, DC: U.S. Department of Labor, 2016. http://www.bls.gov/cps/.
U.S. Bureau of Labor Statistics. Occupational Employment Statistics. Washington, DC: U.S. Department of Labor, 2016. http://www.bls.gov/oes/.
U.S. Census Bureau. American Community Survey (ACS), n.d. http://www.census.gov/programs-surveys/acs/.
U.S. Census Bureau. Current Population Survey (CPS), n.d. https://www.census.gov/programs-surveys/cps.html.
U.S. Census Bureau. Local Employment Dynamics (LED) Partnership, Longitudinal Employer-Household Dynamics (LEHD), n.d. https://lehd.ces.census.gov/.
U.S. Department of Labor, Employment and Training Administration, “Wage Record Interchange System 2,” 2016. https://doleta.gov/performance/wris_2.cfm.
Voight, Mamie, Alegenta A. Long, Mark Huelsman, and Jennifer Engle. Mapping the Postsecondary Data Domain: Problems and Possibilities Technical Report. Washington, DC: Institute for Higher Education Policy, 2014.
Zinn, Rachel. Classroom to Career: Leveraging Employment Data to Measure Labor Market Outcomes, Washington, DC: Workforce Data Quality Campaign, 2016.
Zinn, Rachel, and John Dorrer. Employing WRIS2: Sharing wage records across states to track program outcomes, Washington, DC: Workforce Data Quality Campaign, 2014.
Zinn, Rachel, and Andy Van Kleunen. Making Workforce Data Work: How Improved Education and Workforce Data Systems Could Help the U.S. Compete in the 21st Century Economy. Washington, DC: Workforce Data Quality Campaign, 2014.


facebook.com/GeorgetownCEW
twitter.com/GeorgetownCEW
linkedin.com/company/GeorgetownCEW
Centeron Education
and the Workforce
McCourt School of Public Policy
Georgetown UniversityCenter on Education and the Workforce3300 Whitehaven St. NW, Suite 3200Washington, D.C. 20007cew.georgetown.edu
Career Pathways: Five Ways to Connect College and Careerscan be accessed online at
cew.georgetown.edu/CareerPathways