career and technical education five ways that pay...career and technical education: five ways that...
TRANSCRIPT
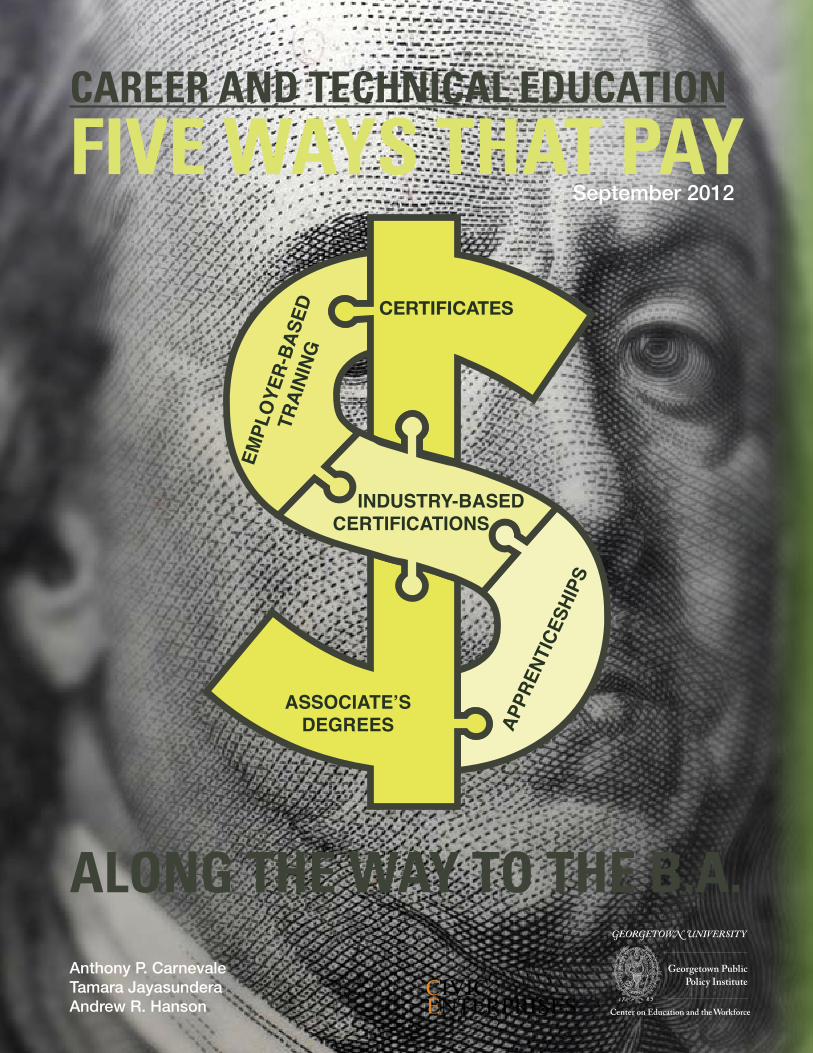
Career and TeChniCal eduCaTion
Five Ways ThaT Pay
along The Way To The B.a.
CERTIFICATES
EMPL
OYE
R-BA
SED
TRA
ININ
G
INDUSTRY-BASEDCERTIFICATIONS
APPR
ENTI
CESH
IPS
ASSOCIATE’S DEGREES
CIVIC ENTERPRISES
Anthony P. CarnevaleTamara JayasunderaAndrew R. Hanson
September 2012

EMBA
RGOED

EMBA
RGOED
Acknowledgements
We would like to express our gratitude to the individuals and organizations that have made this report possible. First, we thank Lumina Foundation and the Bill and Melinda Gates Foundation for their support of our research over the past few years, and in particular, we are grateful for the support of Jamie Merisotis, Holly Zanville, Dewayne Matthews, Daniel Greenstein, Daniel Pitasky, Elizabeth Gonzalez, and Elise Miller. We are honored to be partners in their mission of promoting postsecondary access and completion for all Americans.
Special thanks to John M. Bridgeland, chief executive officer and president of Civic Enterprises, for his strong leadership on these issues. Thanks as well to the rest of his team including policy analyst Tess Mason-Elder and chief of staff Megan Hoot for their support in the production of this report. Civic Enterprises is a public policy firm that helps corporations, nonprofits, foundations, universities and governments develop and spearhead innovative public policies to strengthen our communities and country.
Many have contributed their thoughts and feedback throughout the production of this report. That said, all errors, omissions, and views remain the responsibility of authors.
We would also like to thank Ryan Clennan and Amy Orr from Studiografik, the report’s designers; Nancy Lewis, the report’s editor; and everyone at Mosaic, the report’s printers, especially Michael Orr and Tim Keagy. Our thanks also go to our colleagues, whose support was vital to our success:
• Nicole Smith and Jeff Strohl provided strong data and research expertise and contributed to both strategic and editorial decisions.
• Stephen J. Rose advised our methodological decisions. • Artem Gulish provided superb research and editorial assistance throughout. • Andrea Porter provided strategic guidance in the design and production of the report. • Marilyn Downs assisted with the logistics and provided overall support.
The views expressed in this publication are those of the authors and do not necessarily represent those of Lumina Foundation or the Bill and Melinda Gates Foundation, their officers, or employees.

EMBA
RGOED
EMBA
RGOED
Table of Contents
Acknowledgements X
Introduction: Career and Technical Education and Middle Jobs 1
Part One: Five Education and Training Pathways That Pay Along the Way to the B.A. 15 Employer-based Training and Work Experience 15 Informal (On-the-job) Training 16 Formal (Classroom-based) Training 18 Related Work Experience 19 Industry-based Certifications 19 Apprenticeships 22 Postsecondary Certificates 26 Associate’s Degrees 28
Part Two: Middle Jobs That Pay 33
Conclusion: Using Transcript Data and Wage Records to Track Career Pathways 39
Appendix: Employment of Middle-Education Workers, Average Annual Wages, and Projected Growth of Top 10 Paying Middle Jobs by Occupational Group 40
References 42

iv | Career and Technical Education: Five Ways That Pay Along the Way to the B.A.
EMBA
RGOED
Career and Technical Education: Five Ways That Pay Along the Way to the B.A. | 1
EMBA
RGOED
Introduction: Career and Technical Education and Middle Jobs
In the United States, postsecondary education and training has become more necessary than ever.
For recent high school graduates, life is tough. In the past year, one in four young high school graduates was unemployed and over half were underemployed.1 In the past decade, recent high school graduates’ wages have fallen by 12 percent to just $19,400 annually in 2011, below the poverty threshold for a family of four.
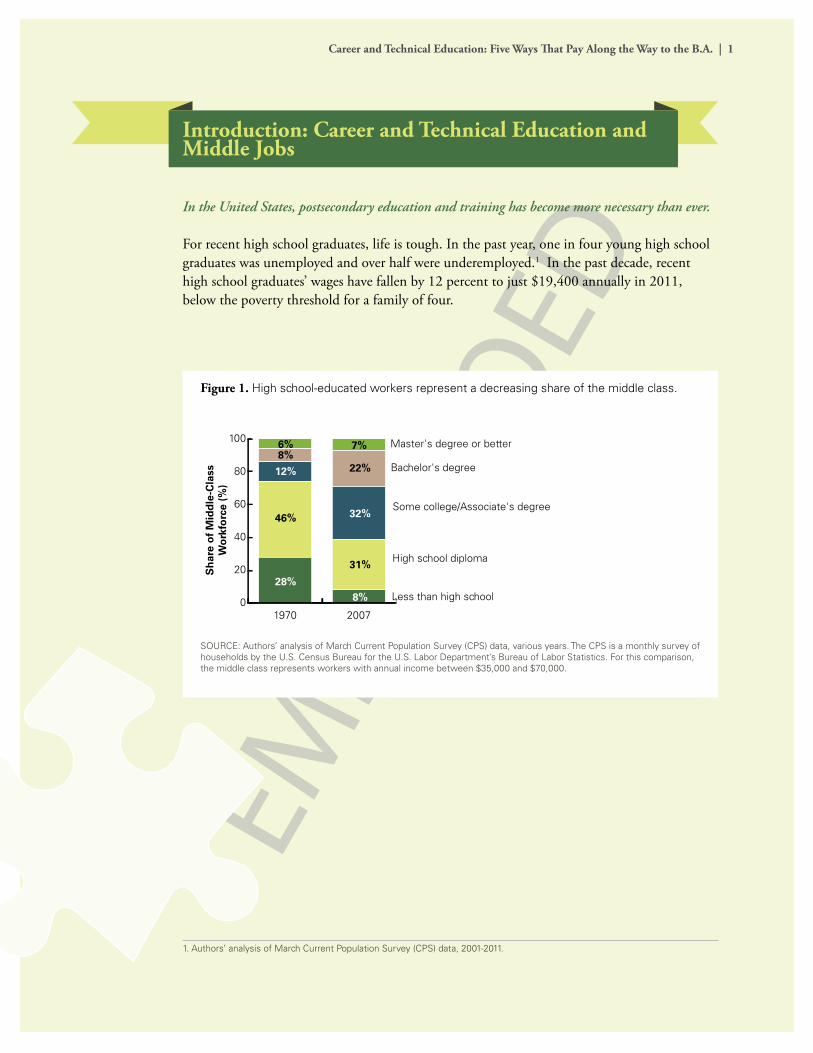
Figure 1. High school-educated workers represent a decreasing share of the middle class.
SOURCE: Authors’ analysis of March Current Population Survey (CPS) data, various years. The CPS is a monthly survey of households by the U.S. Census Bureau for the U.S. Labor Department’s Bureau of Labor Statistics. For this comparison, the middle class represents workers with annual income between $35,000 and $70,000.
1. Authors’ analysis of March Current Population Survey (CPS) data, 2001-2011.
0
20
40
60
80
100 Master's degree or better6%8%
12%
28%
46%
7%
22%
32%
8%
31%
Bachelor's degree
Some college/Associate's degree
High school diploma
Less than high school
20071970
Sh
are
of
Mid
dle
-Cla
ss
Wo
rkfo
rce
(%)

2 | Career and Technical Education: Five Ways That Pay Along the Way to the B.A.
EMBA
RGOED
Figure 2. By 2020, nearly two out of every three U.S. jobs will require some postsecondary education and training.
SOURCE: Authors’ analysis of March Current Population Survey data, various years; forecast of educational demand to 2020NOTE: The ‘some college’ category was not measured in 1973.
The downward plight of high school graduates did not begin yesterday. It is a story that goes back at least 40 years and represents a structural change in the United States economy, demarcated by rising educational requirements across the labor market and a smaller share of the economic pie for high school-educated workers. In 1970, workers with a high school diploma or less represented 74 percent of the middle class (Figure 1). By 2007, fewer than two out of five workers with a high school diploma or less. In 1973, nearly three out of four jobs required only a high school education or less (Figure 2). By 2020, two out of three jobs will require some postsecondary education or training.
As jobs that require only high school or less have disappeared, postsecondary education and training on the job and in schools have become the gateways to the middle class. Most postsecondary education and training discussions focus on the baccalaureate pathway, but there has been an increasing interest in so-called “middle jobs.” These are jobs that require education and training beyond high school but less than a Bachelor’s degree, and secure middle-class earnings. The education and training programs that prepare Americans for these jobs are commonly referred to as career and technical education (CTE).2
2. Career and Technical Education as defined by the Carl D. Perkins Career and Technical Education Improvement Act of 2006.
0
20
40
60
80
100
2020201019921973
Master's degree or better
Bachelor's degree
Some college/no degree
High school diploma
Less than high school
Associate's degree
7%
19%
34%
8%
19%
10%
10% 11%
21%
30%
10%
11% 12%
18%
12%
24%
24%
11%
17%
9%
40%
12%
32%
Shar
e of
Jobs
(%)
Career and Technical Education: Five Ways That Pay Along the Way to the B.A. | 3
EMBA
RGOED
In the remainder of this report, the terms middle-education jobs (or workers), middle-class earnings, and middle jobs are used frequently.
Middle-education jobs (or workers) are those that require (or have) some postsecondary education and training, but do not require (or have) a Bachelor’s degree.
Middle-class earnings are earnings above $35,000 per year and below $95,000 per year.
Middle jobs are occupations that require some postsecondary education and training, but not a Bachelor’s degree, and have average earnings of $35,000 per year or more.
This report has two parts. Part One explores in detail the five major CTE pathways at the sub-baccalaureate level: employer-based training, industry-based certifications, apprenticeships, postsecondary certificates, and Associate’s degrees. Part Two lists the occupations for which CTE prepares American workers. Middle jobs are defined in terms of both education and earnings. The first criterion is that jobs require more education and training than high school but less than a Bachelor’s degree. The second criterion is a minimum earnings threshold (MET) of an average of $35,000 a year, which was 185 percent of the poverty line earnings for a family of four in 2011.
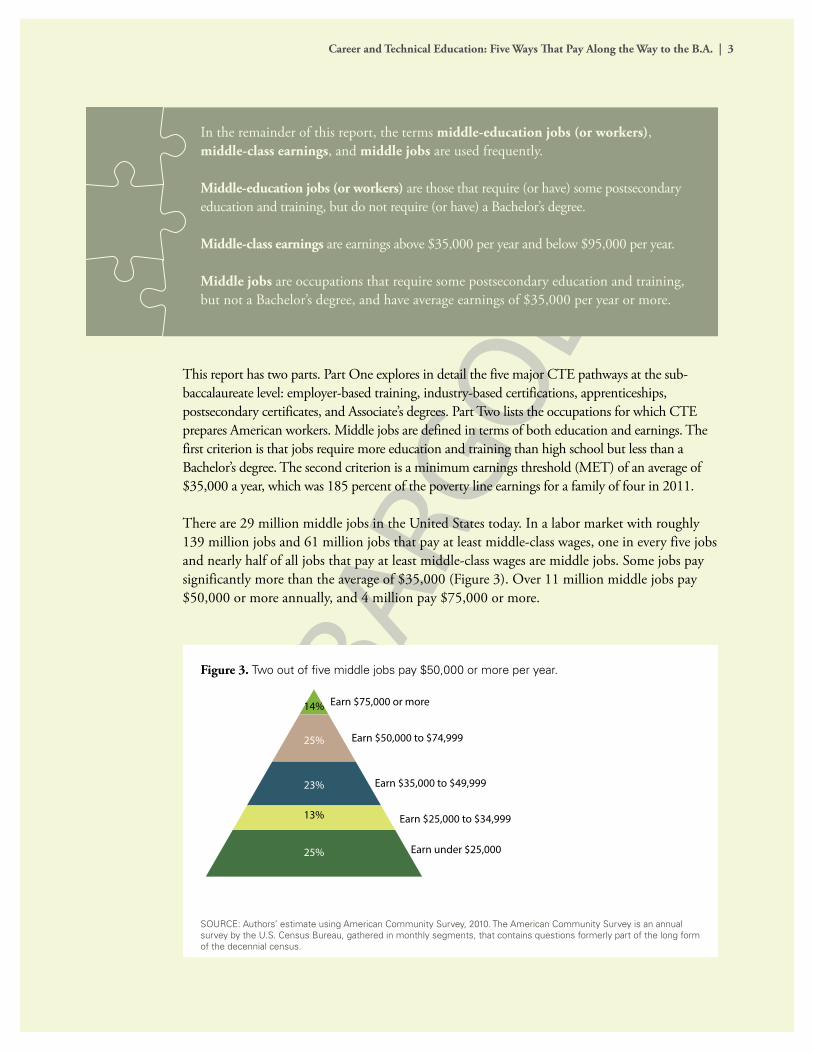
There are 29 million middle jobs in the United States today. In a labor market with roughly 139 million jobs and 61 million jobs that pay at least middle-class wages, one in every five jobs and nearly half of all jobs that pay at least middle-class wages are middle jobs. Some jobs pay significantly more than the average of $35,000 (Figure 3). Over 11 million middle jobs pay $50,000 or more annually, and 4 million pay $75,000 or more.
Figure 3. Two out of five middle jobs pay $50,000 or more per year.
SOURCE: Authors’ estimate using American Community Survey, 2010. The American Community Survey is an annual survey by the U.S. Census Bureau, gathered in monthly segments, that contains questions formerly part of the long form of the decennial census.
Earn $75,000 or more
Earn $50,000 to $74,999
Earn $35,000 to $49,999
Earn $25,000 to $34,999
Earn under $25,00025%
13%
23%
25%
14%
4 | Career and Technical Education: Five Ways That Pay Along the Way to the B.A.
EMBA
RGOED
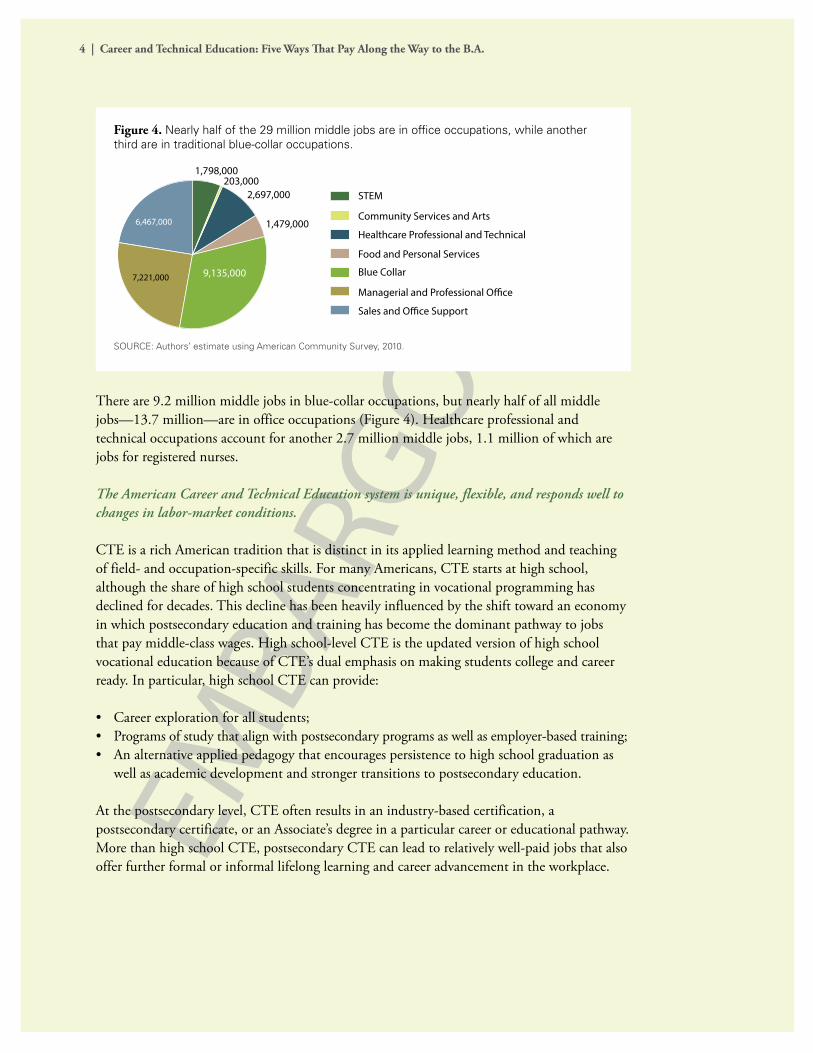
Figure 4. Nearly half of the 29 million middle jobs are in office occupations, while another third are in traditional blue-collar occupations.
SOURCE: Authors’ estimate using American Community Survey, 2010.
There are 9.2 million middle jobs in blue-collar occupations, but nearly half of all middle jobs—13.7 million—are in office occupations (Figure 4). Healthcare professional and technical occupations account for another 2.7 million middle jobs, 1.1 million of which are jobs for registered nurses.
The American Career and Technical Education system is unique, flexible, and responds well to changes in labor-market conditions.
CTE is a rich American tradition that is distinct in its applied learning method and teaching of field- and occupation-specific skills. For many Americans, CTE starts at high school, although the share of high school students concentrating in vocational programming has declined for decades. This decline has been heavily influenced by the shift toward an economy in which postsecondary education and training has become the dominant pathway to jobs that pay middle-class wages. High school-level CTE is the updated version of high school vocational education because of CTE’s dual emphasis on making students college and career ready. In particular, high school CTE can provide:
• Careerexplorationforallstudents;• Programsofstudythatalignwithpostsecondaryprogramsaswellasemployer-basedtraining;• Analternativeappliedpedagogythatencouragespersistencetohighschoolgraduationas
well as academic development and stronger transitions to postsecondary education.
At the postsecondary level, CTE often results in an industry-based certification, a postsecondary certificate, or an Associate’s degree in a particular career or educational pathway. More than high school CTE, postsecondary CTE can lead to relatively well-paid jobs that also offer further formal or informal lifelong learning and career advancement in the workplace.
Sales and O�ce Support
Managerial and Professional O�ce
Blue Collar
Food and Personal Services
Healthcare Professional and Technical
Community Services and Arts
STEM
9,135,000
6,467,000
7,221,000
2,697,000
1,479,000
1,798,000203,000
Career and Technical Education: Five Ways That Pay Along the Way to the B.A. | 5
EMBA
RGOED
The American CTE system is a mix of learning activities and awards that is the informal market-based cousin to the more highly regulated European apprenticeship systems. While other industrialized nations have adopted hardline educational tracks that are set at early ages, the U.S. system is flexible and dynamic—characteristics that allow it to respond well to changes in labor markets and promote educational and career mobility.
CTE is education and training that pays along the way to college.
Career and technical education can make further education affordable. According to the National Center of Education Statistics, four out of five students work while enrolled in postsecondary institutions and two of those four are working full-time. On average, students are working 30 hours per week. More than 40 percent are older than 24; almost half are financially independent, and a quarter of all postsecondary students have children of their own.3 Recent evidence suggests that “earning while learning” can lead to better employment opportunities and higher wages when school-term employment is related to an individual’s field of study.4 Because CTE is career-focused, it has a unique advantage for working learners. In the short run, students with relevant knowledge and skills can secure positions that pay more than routine low-level jobs at fast-food restaurants. In the long run, students will have developed career-relevant skills and gained work experience that pays dividends as they advanced their careers and saved for further education and training.
Americans who pursue alternatives to the baccalaureate pathway are not necessarily forgoing a college degree. For example, 28 percent of Americans who earned a Bachelor’s degree in 2009 started at a two-year community college. Americans who earn awards at community colleges are not precluded from earning a Bachelor’s degree later on. One out of every four Americans who earns a postsecondary certificate—typically awarded by a community college or a for-profit institution—goes on to earn a college degree,5 and 17 percent of Bachelor’s degree-holders earned an Associate’s degree beforehand.6
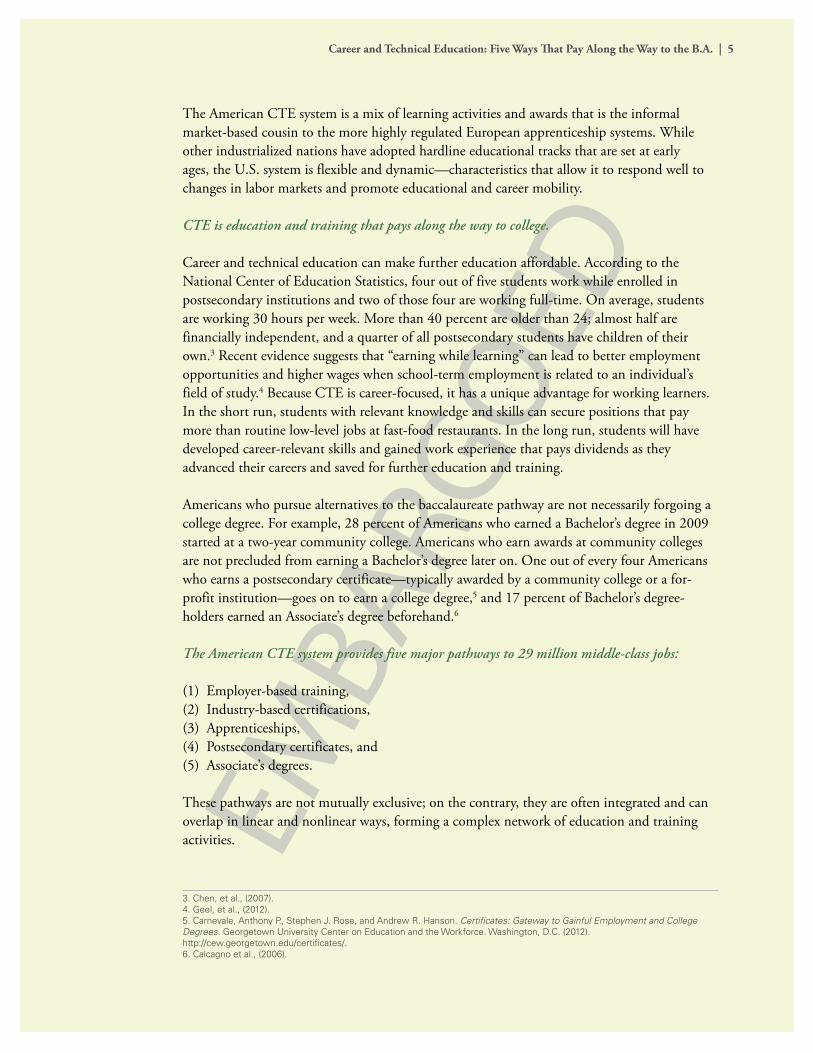
The American CTE system provides five major pathways to 29 million middle-class jobs:
(1) Employer-based training,(2) Industry-based certifications, (3) Apprenticeships,(4) Postsecondary certificates, and(5) Associate’s degrees.
These pathways are not mutually exclusive; on the contrary, they are often integrated and can overlap in linear and nonlinear ways, forming a complex network of education and training activities.
3. Chen, et al., (2007).4. Geel, et al., (2012).5. Carnevale, Anthony P., Stephen J. Rose, and Andrew R. Hanson. Certificates: Gateway to Gainful Employment and College Degrees. Georgetown University Center on Education and the Workforce. Washington, D.C. (2012). http://cew.georgetown.edu/certificates/.6. Calcagno et al., (2006).
6 | Career and Technical Education: Five Ways That Pay Along the Way to the B.A.
EMBA
RGOED
Five Ways That Pay Along the Way to the B.A.
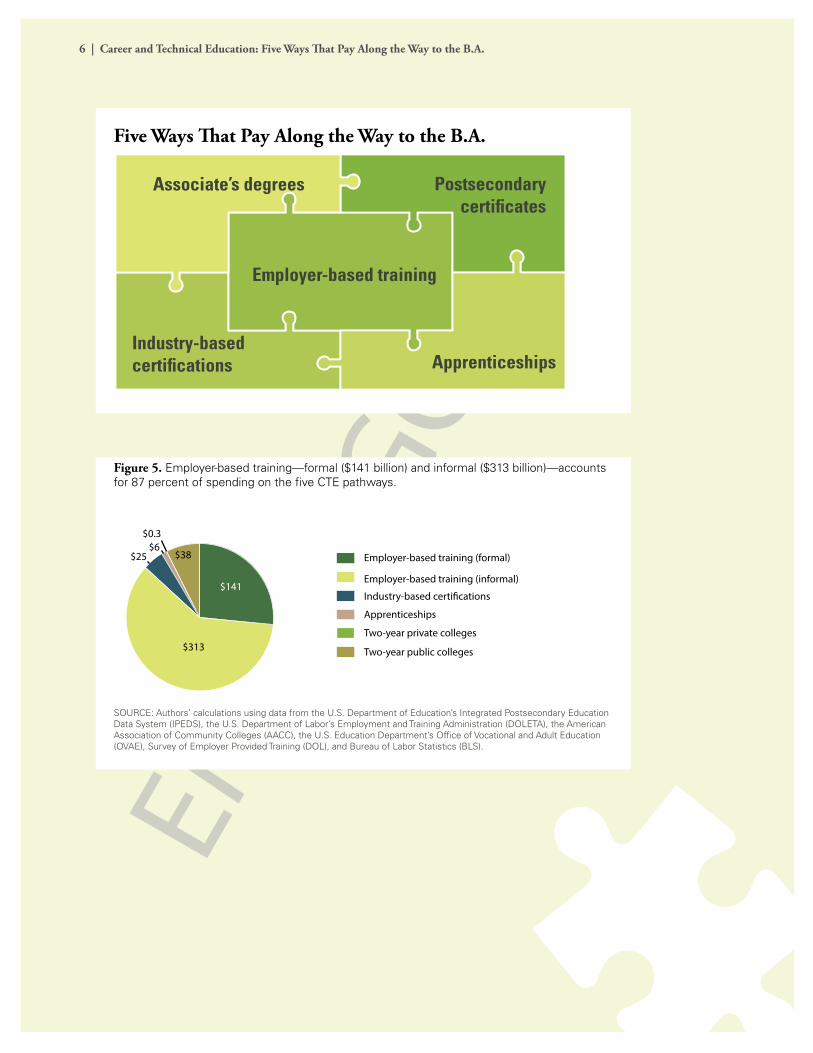
Figure 5. Employer-based training—formal ($141 billion) and informal ($313 billion)—accounts for 87 percent of spending on the five CTE pathways.
SOURCE: Authors’ calculations using data from the U.S. Department of Education’s Integrated Postsecondary Education Data System (IPEDS), the U.S. Department of Labor’s Employment and Training Administration (DOLETA), the American Association of Community Colleges (AACC), the U.S. Education Department’s Office of Vocational and Adult Education (OVAE), Survey of Employer Provided Training (DOL), and Bureau of Labor Statistics (BLS).
employer-based training
associate’s degrees
industry-based certifications
Postsecondary certificates
apprenticeships
Two-year public colleges
Two-year private colleges
Apprenticeships
Industry-based certi�cations
Employer-based training (informal)
Employer-based training (formal)
$141
$25
$313
$38$6
$0.3
Career and Technical Education: Five Ways That Pay Along the Way to the B.A. | 7
EMBA
RGOED
The United States spends roughly $1.4 trillion on human capital development each year. Of this,
• $536billionisspentonprimaryandsecondaryeducation7 • $772billionisspentonpostsecondaryeducationandtraining
– $248 billion is spent on four-year colleges and universities– $524 billion is spent on the five major CTE pathways (Figure 5)
$454 billion is spent on formal and informal employer-based training Roughly $70 billion is spent on the other four major pathways: industry-based
certifications, apprenticeships, postsecondary certificates, and Associate’s degrees
Since 2001, the United States has produced more than 3 million high school graduates each year.8 For those who pursue a Bachelor’s degree and complete it, the payoff is substantial. Americans with Bachelor’s degrees or better make twice as much in annual income on average as those with a high school education or less.9 Over a lifetime, college graduates make nearly a million dollars more in earnings than those with a high school diploma alone.10
7. 2006 U.S. Budget, Historical Tables8. U.S. Department of Education, (2011).9. Carnevale, Anthony P., Tamara Jayasundera, and Ban Cheah. The College Advantage: Weathering the Economic Storm. George-town University Center on Education and the Workforce. Washington, D.C.. (2012).http://cew.georgetown.edu/collegeadvantage/.10. Carnevale, Anthony P., Stephen J. Rose, and Ban Cheah. The College Payoff: Education, Occupations, and Lifetime Earnings. Georgetown University Center on Education and the Workforce. Washington, D.C. (2011).http://cew.georgetown.edu/collegepayoff/.
The United States spends roughly $1.4
trillion on human capital development
each year.
EMBA
RGOED
HIGH-SCHOOLGRADUATES
STUDENTTRANSCRIPTS
WAGERECORDS
DATACOLLECTION
EXCHANGEDATABASE
LEARNING & EARNING EXCHANGE
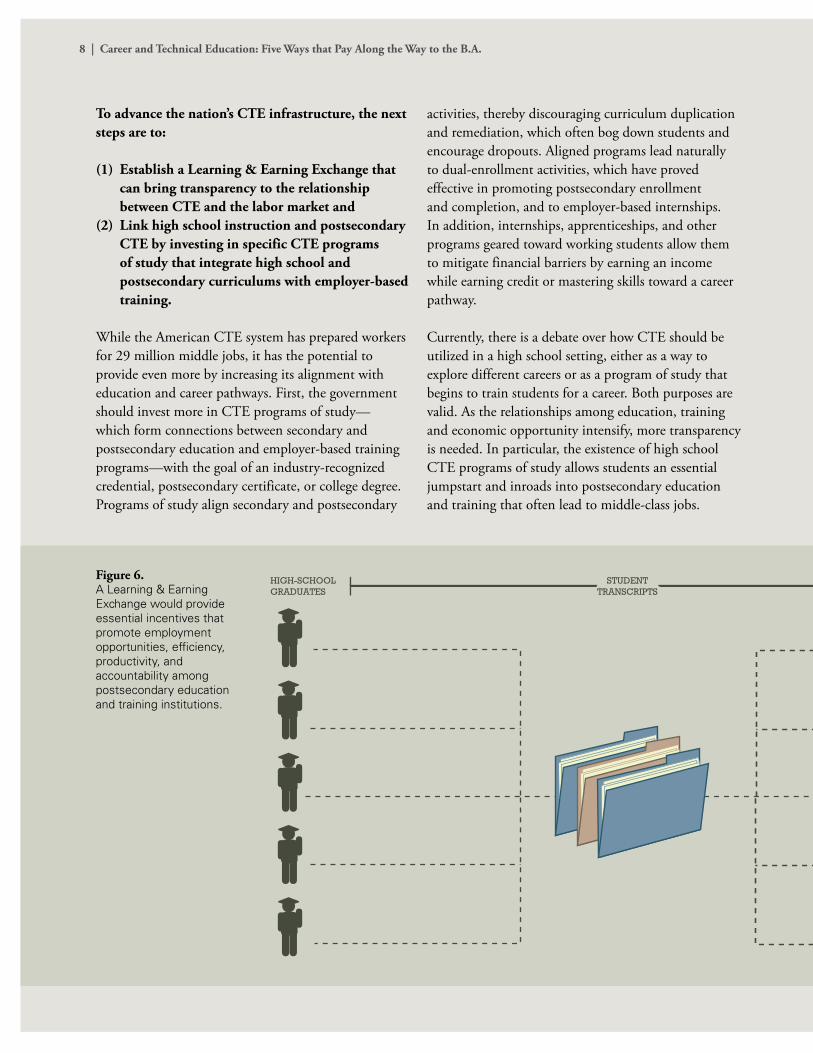
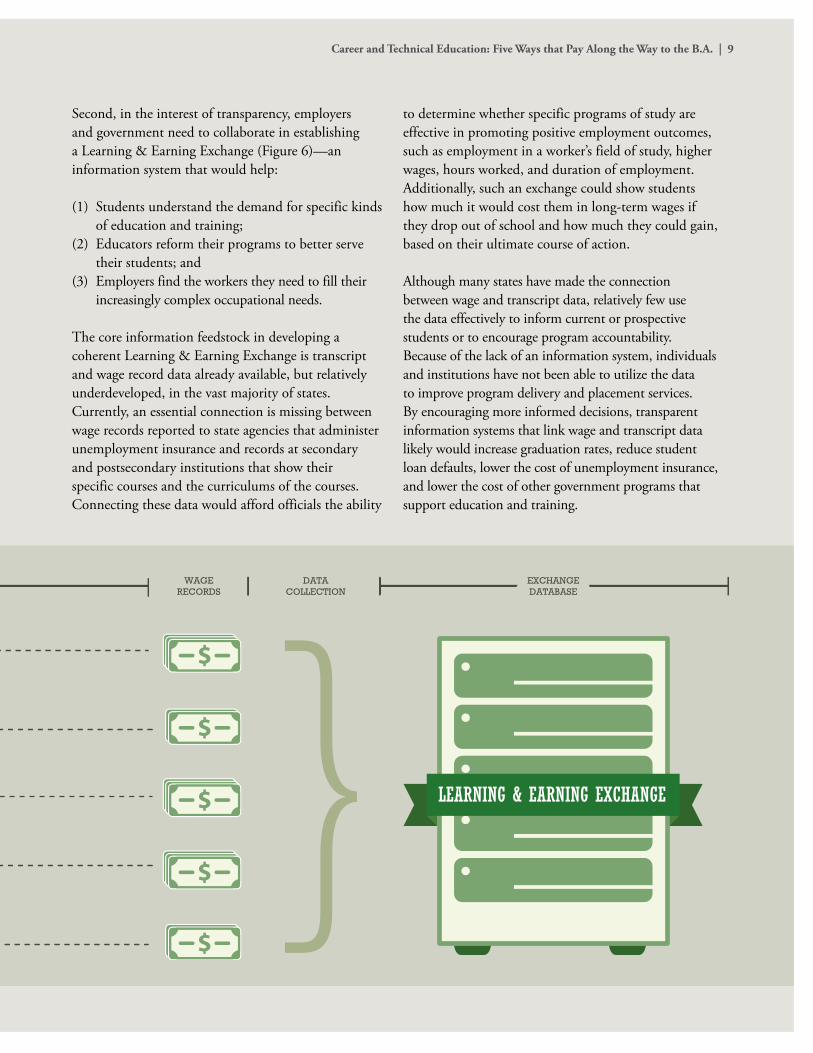
Figure 6. A Learning & Earning Exchange would provide essential incentives that promote employment opportunities, efficiency, productivity, and accountability among postsecondary education and training institutions.
8 | Career and Technical Education: Five Ways that Pay Along the Way to the B.A.
To advance the nation’s CTE infrastructure, the next steps are to:
(1) Establish a Learning & Earning Exchange that can bring transparency to the relationship between CTE and the labor market and
(2) Link high school instruction and postsecondary CTE by investing in specific CTE programs of study that integrate high school and postsecondary curriculums with employer-based training.
While the American CTE system has prepared workers for 29 million middle jobs, it has the potential to provide even more by increasing its alignment with education and career pathways. First, the government should invest more in CTE programs of study—which form connections between secondary and postsecondary education and employer-based training programs—with the goal of an industry-recognized credential, postsecondary certificate, or college degree. Programs of study align secondary and postsecondary
activities, thereby discouraging curriculum duplication and remediation, which often bog down students and encourage dropouts. Aligned programs lead naturally to dual-enrollment activities, which have proved effective in promoting postsecondary enrollment and completion, and to employer-based internships. In addition, internships, apprenticeships, and other programs geared toward working students allow them to mitigate financial barriers by earning an income while earning credit or mastering skills toward a career pathway.
Currently, there is a debate over how CTE should be utilized in a high school setting, either as a way to explore different careers or as a program of study that begins to train students for a career. Both purposes are valid. As the relationships among education, training and economic opportunity intensify, more transparency is needed. In particular, the existence of high school CTE programs of study allows students an essential jumpstart and inroads into postsecondary education and training that often lead to middle-class jobs.
EMBA
RGOED
HIGH-SCHOOLGRADUATES
STUDENTTRANSCRIPTS
WAGERECORDS
DATACOLLECTION
EXCHANGEDATABASE
LEARNING & EARNING EXCHANGE
Career and Technical Education: Five Ways that Pay Along the Way to the B.A. | 9
Second, in the interest of transparency, employers and government need to collaborate in establishing a Learning & Earning Exchange (Figure 6)—an information system that would help:
(1) Students understand the demand for specific kinds of education and training;
(2) Educators reform their programs to better serve their students; and
(3) Employers find the workers they need to fill their increasingly complex occupational needs.
The core information feedstock in developing a coherent Learning & Earning Exchange is transcript and wage record data already available, but relatively underdeveloped, in the vast majority of states. Currently, an essential connection is missing between wage records reported to state agencies that administer unemployment insurance and records at secondary and postsecondary institutions that show their specific courses and the curriculums of the courses. Connecting these data would afford officials the ability
to determine whether specific programs of study are effective in promoting positive employment outcomes, such as employment in a worker’s field of study, higher wages, hours worked, and duration of employment. Additionally, such an exchange could show students how much it would cost them in long-term wages if they drop out of school and how much they could gain, based on their ultimate course of action.
Although many states have made the connection between wage and transcript data, relatively few use the data effectively to inform current or prospective students or to encourage program accountability. Because of the lack of an information system, individuals and institutions have not been able to utilize the data to improve program delivery and placement services. By encouraging more informed decisions, transparent information systems that link wage and transcript data likely would increase graduation rates, reduce student loan defaults, lower the cost of unemployment insurance, and lower the cost of other government programs that support education and training.
10 | Career and Technical Education: Five Ways That Pay Along the Way to the B.A.
EMBA
RGOED
Increasing Demand for Education and Skill in the 20th Century
Today, the link between increased education and good jobs is stronger than ever. From 1947 to 1973, the income of the median American family doubled (from $25,000 to $52,000 in 2009 dollars) as more Americans attended and graduated from high school than ever before.11 By and large, these middle-education jobs were concentrated in the American manufacturing industry. Beginning around 1973, the economy underwent another transformation marked by the decline of jobs for high school graduates alongside enormous wage growth for high-education workers and increasing returns for postsecondary education and training.
Globalization and automation created structural changes in the U.S. economy beginning in the 1970s that led to increased demand for skilled workers and more educated workers.
Automation first arose as the result of industrialization, pushing workers off farms and into cities and factories, and has been spreading ever since. Automation works through a machine or robot that performs simple and repetitive tasks and operates via a computer program or algorithm. Automation does not necessarily displace only low-skill workers—innovators are automating tasks of increasing complexity, such as Google’s self-driving car. But as automated programs have moved from simple to complex, low- and middle-education jobs—which involve simpler, more repetitive tasks—have been the first to go. Because technological innovation and postsecondary education and training are complements, jobs that require more education have been created in their stead.
The effect of globalization on jobs in the United States has reinforced the effects of automation: Exposing the American workforce to global competition has placed significant pressure on low-education workers’ wages and employment. Many American companies have decided to ship parts of their production chains overseas to lower costs and improve profit margins.
The forces of technological innovation and globalization need not be problems for the United States. The structure of the economy is constantly changing, and the strength of the U.S. economy has persisted in part because, throughout history, the country has met these structural changes head on. Economists Claudia Goldin and Lawrence Katz have called the 20th century both “America’s Century” and the “Human Capital Century,” referring to America’s ability to invest in a dynamic secondary and postsecondary education system that has been responsible, in large part, for America’s economic vitality and growth over the last 100 years.12
11. Authors’ analysis of US Census Bureau’s Historical Income Tables.12. Goldin, Claudia and Lawrence Katz, (2008).
Career and Technical Education: Five Ways That Pay Along the Way to the B.A. | 11
EMBA
RGOED
Postsecondary CTE in the United States and the world
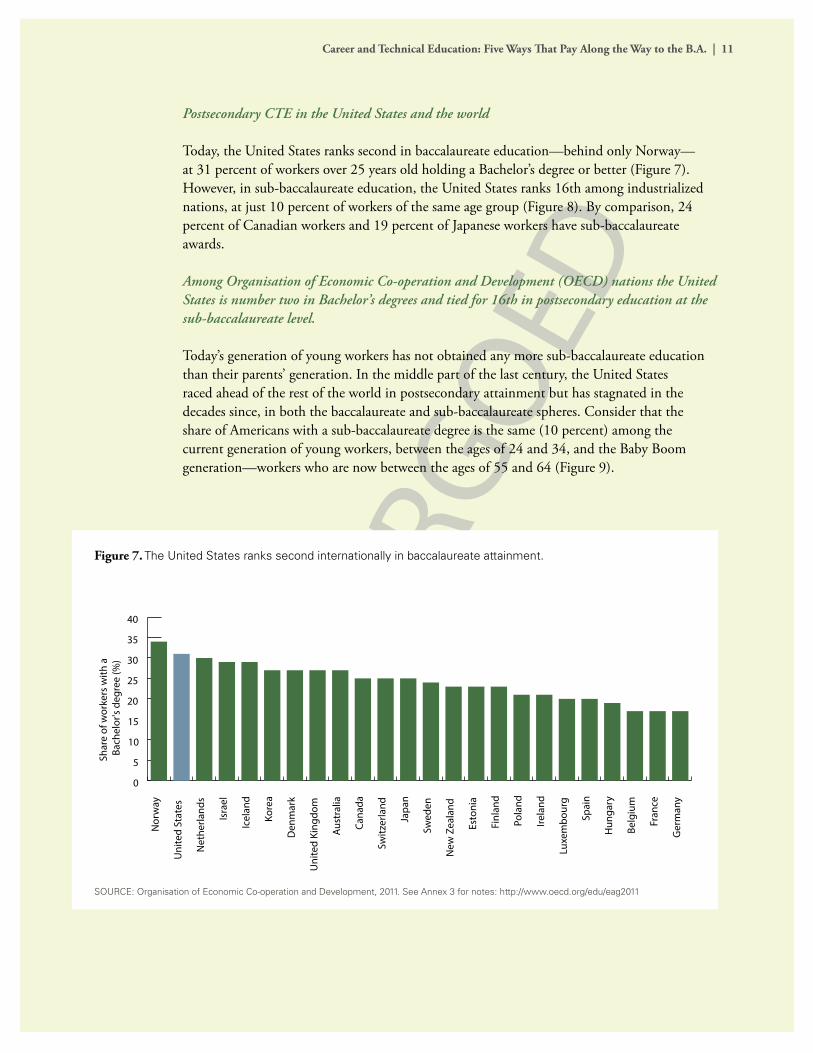
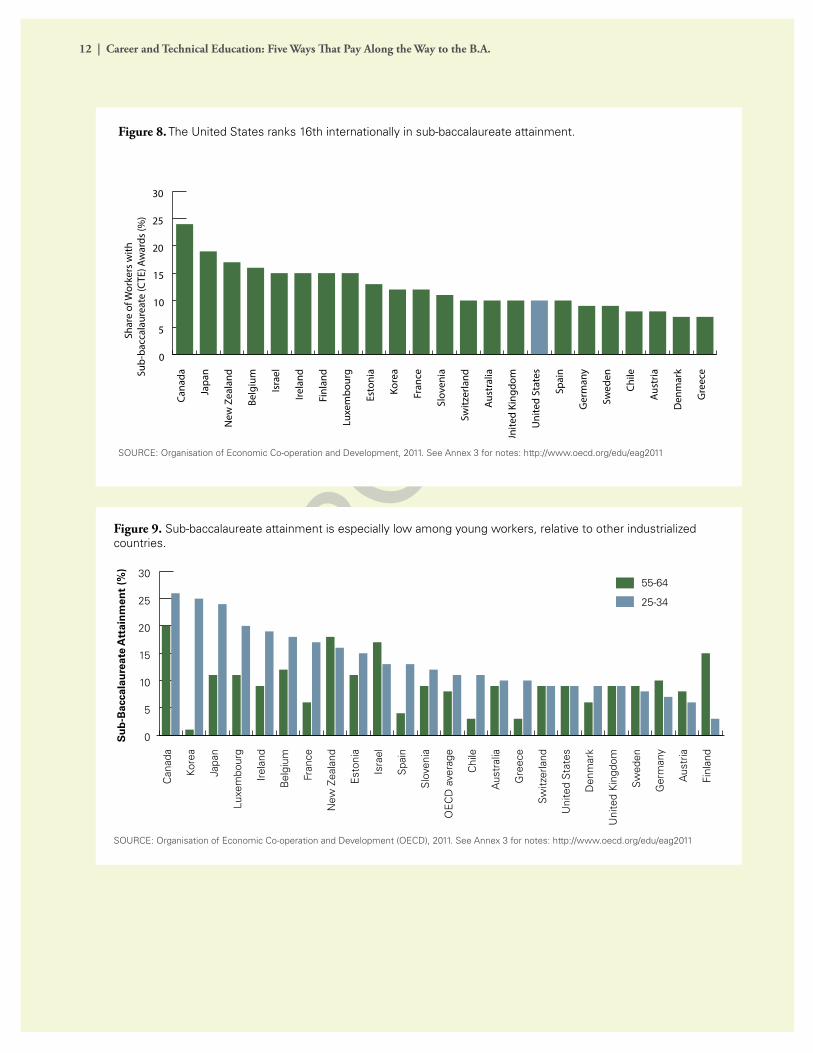
Today, the United States ranks second in baccalaureate education—behind only Norway—at 31 percent of workers over 25 years old holding a Bachelor’s degree or better (Figure 7). However, in sub-baccalaureate education, the United States ranks 16th among industrialized nations, at just 10 percent of workers of the same age group (Figure 8). By comparison, 24 percent of Canadian workers and 19 percent of Japanese workers have sub-baccalaureate awards.
Among Organisation of Economic Co-operation and Development (OECD) nations the United States is number two in Bachelor’s degrees and tied for 16th in postsecondary education at the sub-baccalaureate level.
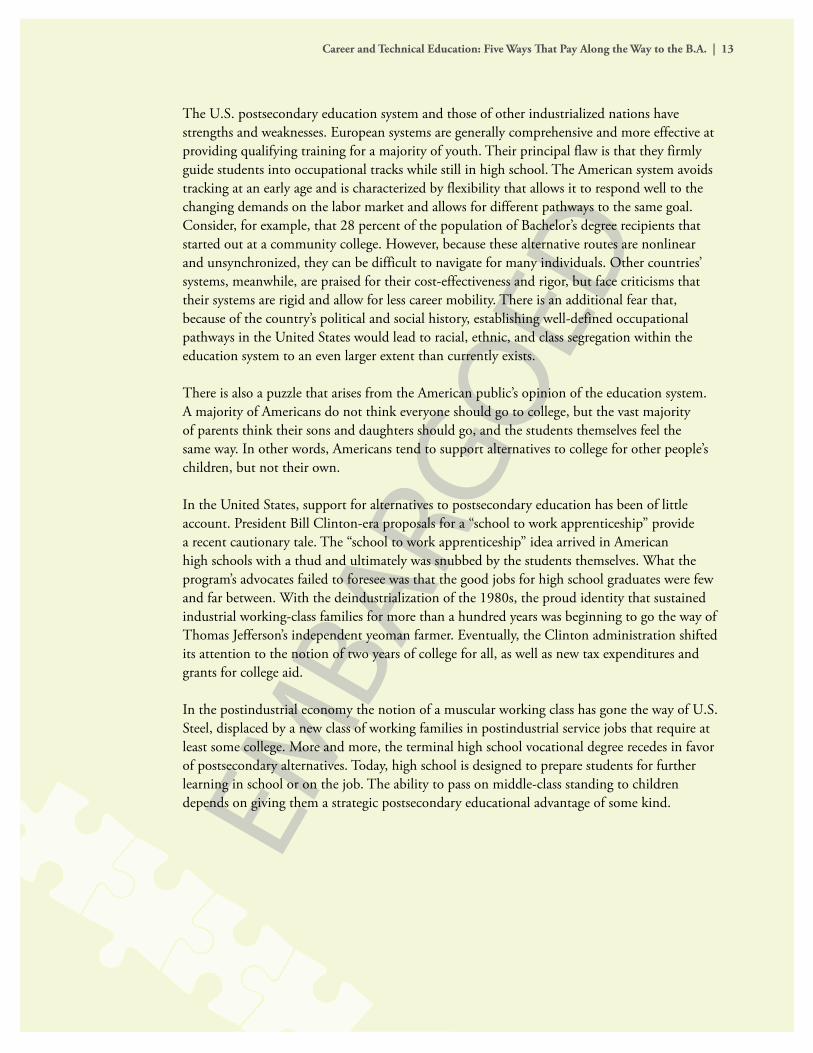
Today’s generation of young workers has not obtained any more sub-baccalaureate education than their parents’ generation. In the middle part of the last century, the United States raced ahead of the rest of the world in postsecondary attainment but has stagnated in the decades since, in both the baccalaureate and sub-baccalaureate spheres. Consider that the share of Americans with a sub-baccalaureate degree is the same (10 percent) among the current generation of young workers, between the ages of 24 and 34, and the Baby Boom generation—workers who are now between the ages of 55 and 64 (Figure 9).
Figure 7. The United States ranks second internationally in baccalaureate attainment.
SOURCE: Organisation of Economic Co-operation and Development, 2011. See Annex 3 for notes: http://www.oecd.org/edu/eag2011
0
5
10
15
20
25
30
35
40
Ger
man
y
Fran
ce
Belg
ium
Hun
gary
Spai
n
Luxe
mbo
urg
Irela
nd
Pola
nd
Finl
and
Esto
nia
New
Zea
land
Swed
en
Japa
n
Switz
erla
nd
Cana
da
Aust
ralia
Uni
ted
King
dom
Den
mar
k
Kore
a
Icel
and
Isra
el
Net
herla
nds
Uni
ted
Stat
es
Nor
way
Shar
e of
wor
kers
with
a
Bach
elor
's de
gree
(%)
12 | Career and Technical Education: Five Ways That Pay Along the Way to the B.A.
EMBA
RGOED
Figure 8. The United States ranks 16th internationally in sub-baccalaureate attainment.
SOURCE: Organisation of Economic Co-operation and Development, 2011. See Annex 3 for notes: http://www.oecd.org/edu/eag2011
0
5
10
15
20
25
30
Gre
ece
Den
mar
k
Aust
ria
Chile
Swed
en
Ger
man
y
Spai
n
Uni
ted
Stat
es
Uni
ted
King
dom
Aust
ralia
Switz
erla
nd
Slov
enia
Fran
ce
Kore
a
Esto
nia
Luxe
mbo
urg
Finl
and
Irela
nd
Isra
el
Belg
ium
New
Zea
land
Japa
n
Cana
da
Shar
e of
Wor
kers
with
Su
b-ba
ccal
aure
ate
(CTE
) Aw
ards
(%)
Figure 9. Sub-baccalaureate attainment is especially low among young workers, relative to other industrialized countries.
SOURCE: Organisation of Economic Co-operation and Development (OECD), 2011. See Annex 3 for notes: http://www.oecd.org/edu/eag2011
55-64
25-34
0
5
10
15
20
25
30
Finl
and
Aus
tria
Ger
man
y
Swed
en
Uni
ted
Kin
gdom
Den
mar
k
Uni
ted
Sta
tes
Switz
erla
nd
Gre
ece
Aus
tral
ia
Chi
le
OE
CD
ave
rage
Slo
veni
a
Spa
in
Isra
el
Est
onia
New
Zea
land
Fran
ce
Bel
gium
Irel
and
Luxe
mbo
urg
Japa
n
Kore
a
Can
ada
Su
b-B
acca
lau
reat
e A
ttai
nm
ent
(%)
Career and Technical Education: Five Ways That Pay Along the Way to the B.A. | 13
EMBA
RGOED
The U.S. postsecondary education system and those of other industrialized nations have strengths and weaknesses. European systems are generally comprehensive and more effective at providing qualifying training for a majority of youth. Their principal flaw is that they firmly guide students into occupational tracks while still in high school. The American system avoids tracking at an early age and is characterized by flexibility that allows it to respond well to the changing demands on the labor market and allows for different pathways to the same goal. Consider, for example, that 28 percent of the population of Bachelor’s degree recipients that started out at a community college. However, because these alternative routes are nonlinear and unsynchronized, they can be difficult to navigate for many individuals. Other countries’ systems, meanwhile, are praised for their cost-effectiveness and rigor, but face criticisms that their systems are rigid and allow for less career mobility. There is an additional fear that, because of the country’s political and social history, establishing well-defined occupational pathways in the United States would lead to racial, ethnic, and class segregation within the education system to an even larger extent than currently exists.
There is also a puzzle that arises from the American public’s opinion of the education system. A majority of Americans do not think everyone should go to college, but the vast majority of parents think their sons and daughters should go, and the students themselves feel the same way. In other words, Americans tend to support alternatives to college for other people’s children, but not their own.
In the United States, support for alternatives to postsecondary education has been of little account. President Bill Clinton-era proposals for a “school to work apprenticeship” provide a recent cautionary tale. The “school to work apprenticeship” idea arrived in American high schools with a thud and ultimately was snubbed by the students themselves. What the program’s advocates failed to foresee was that the good jobs for high school graduates were few and far between. With the deindustrialization of the 1980s, the proud identity that sustained industrial working-class families for more than a hundred years was beginning to go the way of Thomas Jefferson’s independent yeoman farmer. Eventually, the Clinton administration shifted its attention to the notion of two years of college for all, as well as new tax expenditures and grants for college aid.
In the postindustrial economy the notion of a muscular working class has gone the way of U.S. Steel, displaced by a new class of working families in postindustrial service jobs that require at least some college. More and more, the terminal high school vocational degree recedes in favor of postsecondary alternatives. Today, high school is designed to prepare students for further learning in school or on the job. The ability to pass on middle-class standing to children depends on giving them a strategic postsecondary educational advantage of some kind.

14 | Career and Technical Education: Five Ways That Pay Along the Way to the B.A.
EMBA
RGOED
Career and Technical Education: Five Ways That Pay Along the Way to the B.A. | 15
EMBA
RGOED
Part One: Five Education and Training Pathways That Pay Along the Way to the Bachelor’s Degree
Employer-based Training and Work Experience
The old model for career mobility allowed workers to start at the bottom and, through hard work and determination, be promoted through the ranks to managerial/supervisory roles. The model is crystallized by stories of “mailroom moguls”—executives such as Dan Adler, vice president of the Walt Disney Co.—who worked their way from mailroom clerk to vice president of operations. That is increasingly no longer the case as manager positions increasingly demand a Master of Business Administration (MBA) degree.
Virtually all employees at all levels of the corporate ladder require some degree of training. Entry-level blue-collar employees are often asked to shadow more experienced workers to learn job-specific “tricks of the trade” and worker safety; new management trainees with the highest college honors must acquire industry- and occupation-specific skills and master corporate culture in order to function adequately in their new jobs. One key to understanding just how workforce training functions within the larger schema of job readiness is an appreciation of the overall landscape of employability and the symbiotic roles that postsecondary education and specific job training—whether formal or informal—play in attaining this goal.
Employer-based training sits at the heart of career readiness and is a crucial component in the American workforce development puzzle.
Postsecondary education—a traditional route toward middle-class status—is only one piece of the puzzle. Colleges and universities represent only 35 percent of the entire postsecondary education and training system. The rest consists of on-the-job training, formal employer-provided education programs, military training, apprenticeships, and a variety of other programs. For many middle jobs, however, training is key.
The source of public funding for training services outside the education system and employer-provided training is mostly available through the Workforce Investment Act (WIA) and the Trade Adjustment Assistance Program (TAA). The funding for these federal programs has declined as a share of the federal budget since 1979. Other state-specific employment programs also offer limited funding for training programs—especially in occupations designated as high-growth, high-demand, and high-wage jobs. Some Pell funds may also be available if training is offered through academic institutions.
Employer-based training is the end game in the U.S. human capital development system, but gaining access requires ever-higher levels of secondary and postsecondary education.
Employer-based learning is the largest provider of career-related human capital development in the United States, but qualifications for access are rising. In the new knowledge economy,

16 | Career and Technical Education: Five Ways That Pay Along the Way to the B.A.
EMBA
RGOED
access to good jobs and earnings in the American system are driven by the complementary relationships among general education, occupational preparation, and the resultant access to learning and technology on the job.13
Workers with the least education are likely to encounter further barriers to earnings increases once on the job because they are less likely to receive employer training and less likely to gain access to technology that lead to earnings advantages. College graduates are almost twice as likely as high school graduates to receive formal training from their employer, while they receive less informal on-the-job training. Training can increase employee wages by 3 percent to 11 percent, with formal training providing higher returns than informal training.14 And those who receive training earn more, on average, than more-educated workers who do not.15 High school dropouts who use technology on the job earn about 15 percent more than high school dropouts who do not, but the earnings premium for college graduates who use technology is nearly twice as high. The Occupational Information Network (O*NET)16 database provides extensive detail on the education and training required to perform the requisite duties of a particular occupation. O*NET identifies two distinct types of training that employees engage in to perform their jobs; these are:
• On-the-jobtraining(providedbyamoreexperiencedworker)and• On-sitetraining(formalclassroomtrainingprovidedbytheemployer).
These categories are not applied distinctly to each occupation. Rather, a worker might find that he or she might utilize various levels of foreman-based on-the-job training or classroom-based, on-site training at different points in their career. Science, technology, engineering, and mathematics (STEM), healthcare, and blue-collar jobs are much more likely to utilize formal classroom training because occupational licenses and certifications are often prerequisites for entry into the labor force.
Informal (On-the-job) Training
Short-term training (up to three months)
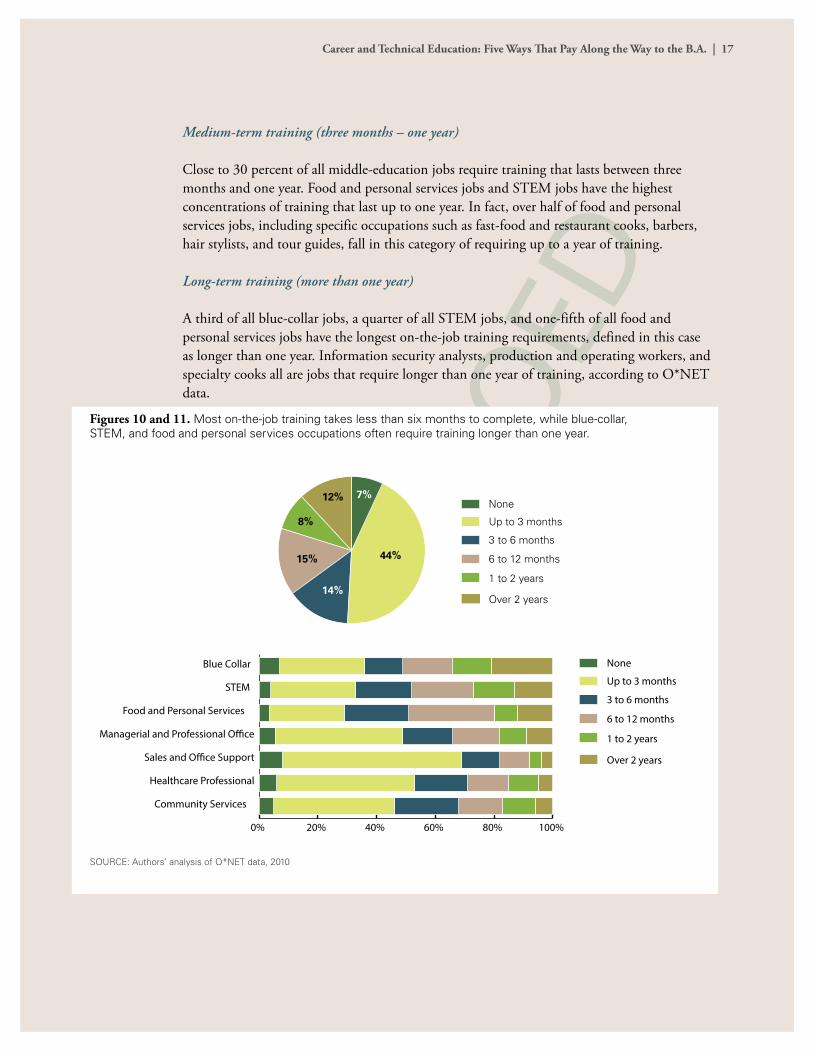
Almost 45 percent of all middle-education occupations require at least three months of informal on-the-job training—that is, training that involves a more experienced worker providing a trainee with the acquisition of job-specific skills.
13. Education, occupational, or professional preparation and access to training, and technology on the job tend to be sequential and complementary in producing productivity and earnings. The career and earnings advantages of the sequence of academic, occupa-tional, and work-based learning accumulate rapidly. Higher levels of formal education not only increase access to jobs with training, they also increase access to technology that complements rather than replaces skills. More highly educated workers use technologies that increase worker autonomy and complement skill—for instance, desktop computers and flexible machine tools. To some extent, educa-tion, training, and technology can be substitutes as well as complements for one another. Technology can substitute for both education and training by de-skilling jobs. Less-educated workers tend to use technology that reduces the level of skill required—for instance, cash registers with pictures of foods on keyboards rather than numbers. Narrow training can substitute for broader educational deficien-cies, although it does not provide longer-term adaptability, especially if narrow tasks are automated or shifted offshore.14. Altonji and Spletzer, (1991); Bishop (1996); Loewenstein and Spletzer (1998); Mincer (1988).15. Eck (1993).16. The O*NET 16.0 database specifies the full set of occupational competencies required for success in particular occupations and related clusters of similar careers. Operated by the National O*NET Consortium and funded by the U.S. Department of Labor, the database includes occupational knowledge, skills, abilities, work values, work contexts, and work interests, as well as key performances (tasks and activities). Its primary use so far has been as a counseling tool for career planning, delivered online through a user-friendly interface.
Career and Technical Education: Five Ways That Pay Along the Way to the B.A. | 17
EMBA
RGOED
Medium-term training (three months – one year)
Close to 30 percent of all middle-education jobs require training that lasts between three months and one year. Food and personal services jobs and STEM jobs have the highest concentrations of training that last up to one year. In fact, over half of food and personal services jobs, including specific occupations such as fast-food and restaurant cooks, barbers, hair stylists, and tour guides, fall in this category of requiring up to a year of training.
Long-term training (more than one year)
A third of all blue-collar jobs, a quarter of all STEM jobs, and one-fifth of all food and personal services jobs have the longest on-the-job training requirements, defined in this case as longer than one year. Information security analysts, production and operating workers, and specialty cooks all are jobs that require longer than one year of training, according to O*NET data.
Over 2 years
1 to 2 years
6 to 12 months
3 to 6 months
Up to 3 months
None7%
14%
44%
12%
15%
8%
0% 20% 40% 60% 80% 100%
Community Services
Healthcare Professional
Sales and O�ce Support
Managerial and Professional O�ce
Food and Personal Services
STEM
Blue Collar
Over 2 years
1 to 2 years
6 to 12 months
3 to 6 months
Up to 3 months
None
Figures 10 and 11. Most on-the-job training takes less than six months to complete, while blue-collar, STEM, and food and personal services occupations often require training longer than one year.
SOURCE: Authors’ analysis of O*NET data, 2010
18 | Career and Technical Education: Five Ways That Pay Along the Way to the B.A.
EMBA
RGOED
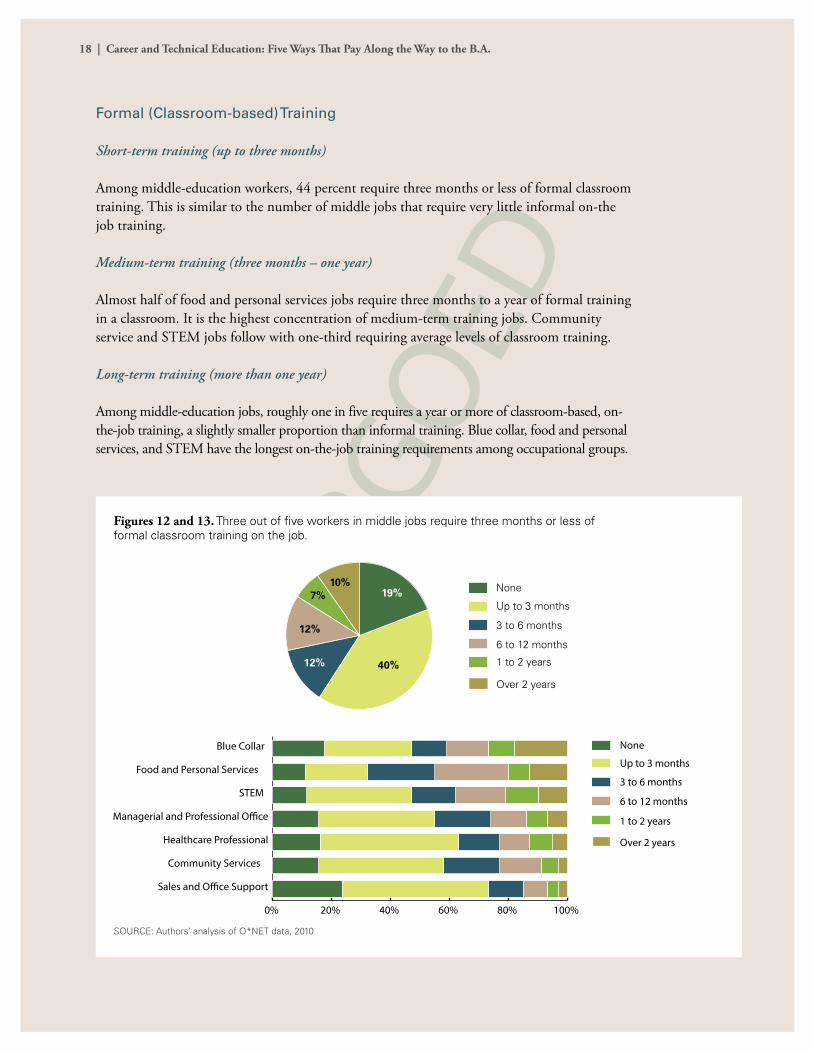
Formal (Classroom-based) Training
Short-term training (up to three months)
Among middle-education workers, 44 percent require three months or less of formal classroom training. This is similar to the number of middle jobs that require very little informal on-the job training.
Medium-term training (three months – one year)
Almost half of food and personal services jobs require three months to a year of formal training in a classroom. It is the highest concentration of medium-term training jobs. Community service and STEM jobs follow with one-third requiring average levels of classroom training.
Long-term training (more than one year)
Among middle-education jobs, roughly one in five requires a year or more of classroom-based, on-the-job training, a slightly smaller proportion than informal training. Blue collar, food and personal services, and STEM have the longest on-the-job training requirements among occupational groups.
Figures 12 and 13. Three out of five workers in middle jobs require three months or less of formal classroom training on the job.
SOURCE: Authors’ analysis of O*NET data, 2010
Over 2 years
1 to 2 years
6 to 12 months
3 to 6 months
Up to 3 months
None19%
12% 40%
10%
12%
7%
0% 20% 40% 60% 80% 100%
Sales and O�ce Support
Community Services
Healthcare Professional
Managerial and Professional O�ce
STEM
Food and Personal Services
Blue Collar
Over 2 years
1 to 2 years
6 to 12 months
3 to 6 months
Up to 3 months
None
Career and Technical Education: Five Ways That Pay Along the Way to the B.A. | 19
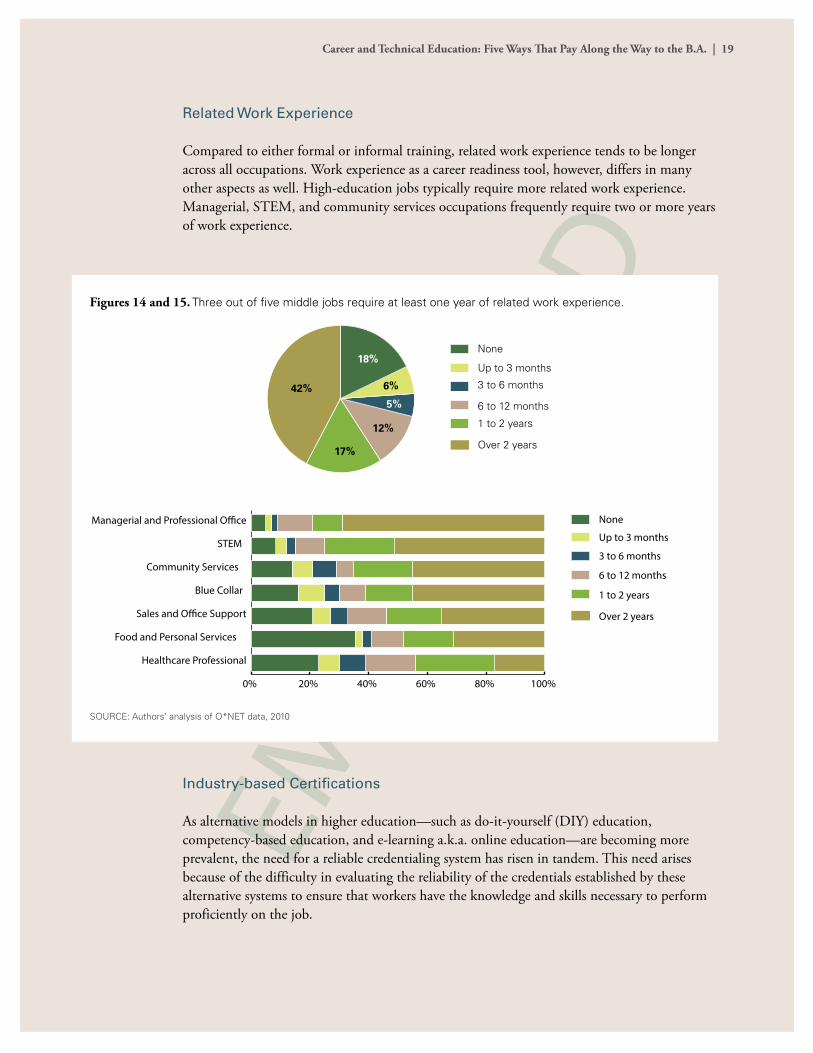
EMBA
RGOEDFigures 14 and 15. Three out of five middle jobs require at least one year of related work experience.
SOURCE: Authors’ analysis of O*NET data, 2010
Related Work Experience
Compared to either formal or informal training, related work experience tends to be longer across all occupations. Work experience as a career readiness tool, however, differs in many other aspects as well. High-education jobs typically require more related work experience. Managerial, STEM, and community services occupations frequently require two or more years of work experience.
Industry-based Certifications
As alternative models in higher education—such as do-it-yourself (DIY) education, competency-based education, and e-learning a.k.a. online education—are becoming more prevalent, the need for a reliable credentialing system has risen in tandem. This need arises because of the difficulty in evaluating the reliability of the credentials established by these alternative systems to ensure that workers have the knowledge and skills necessary to perform proficiently on the job.
18%
5%
6%42%
12%
17%Over 2 years
1 to 2 years
6 to 12 months
3 to 6 months
Up to 3 months
None
0% 20% 40% 60% 80% 100%
Healthcare Professional
Food and Personal Services
Sales and O�ce Support
Blue Collar
Community Services
STEM
Managerial and Professional O�ce
Over 2 years
1 to 2 years
6 to 12 months
3 to 6 months
Up to 3 months
None
20 | Career and Technical Education: Five Ways That Pay Along the Way to the B.A.
EMBA
RGOED
Industry-based certifications (IBCs) are one model that is being embraced by educators, employers, and policymakers. Market forces, not the educational system, drove the creation of IBCs. They differ greatly from other kinds of postsecondary credentials and awards in that they are exam-based, administered and accredited by third parties, and developed by the private sector with little to no involvement from public institutions. They are not tied to particular programs of study, but can serve as both alternatives and supplements to traditional postsecondary awards, such as college degrees and certificates.
IBCs represent an assessment of learning, not any particular program a student has pursued. In most cases, it does not matter where the learning occurred, so long as the individual attempting to gain certification demonstrates proficiency on the assessment. For this reason, IBCs should most often be seen as working in conjunction with occupational programs of study at community colleges and for-profit institutions, such as postsecondary certificate and associate of applied science (AAS) degree programs, as these are the most common pathways to prepare for certification.
IBCs address several problems that postsecondary credentials currently face: relevance, accountability, consistency, and portability. Because IBCs are more flexible than traditional degrees, they better reflect current industry standards and competencies, which are in constant flux. Traditional degrees also sometimes are criticized because it is difficult to compare them across institutions. A Bachelor’s degree from an Ivy League university means something quite different than one from a second-tier state university. Similarly, rampant grade inflation across postsecondary institutions has made it difficult for employers to assess the meaning of differences in grade point averages of job applicants. IBCs overcome these challenges as they are based on a third-party testing protocol that is standardized across certification candidates. Last, because most postsecondary institutions are regionally accredited, employers once again face difficulty in understanding their awards’ value. At the same time, these regional accreditations are considered more reliable than those of current national accrediting agencies. Still, students have difficulty transferring between institutions and maintaining credit for previous coursework. IBCs, by contrast, are typically nationally portable within an industry.
IBCs are a relatively recent development and there is little data on their value. However, online job advertisements frequently cite IBCs as a prerequisite for applying for many jobs. This suggests that certifications provide greater employment opportunities for workers.
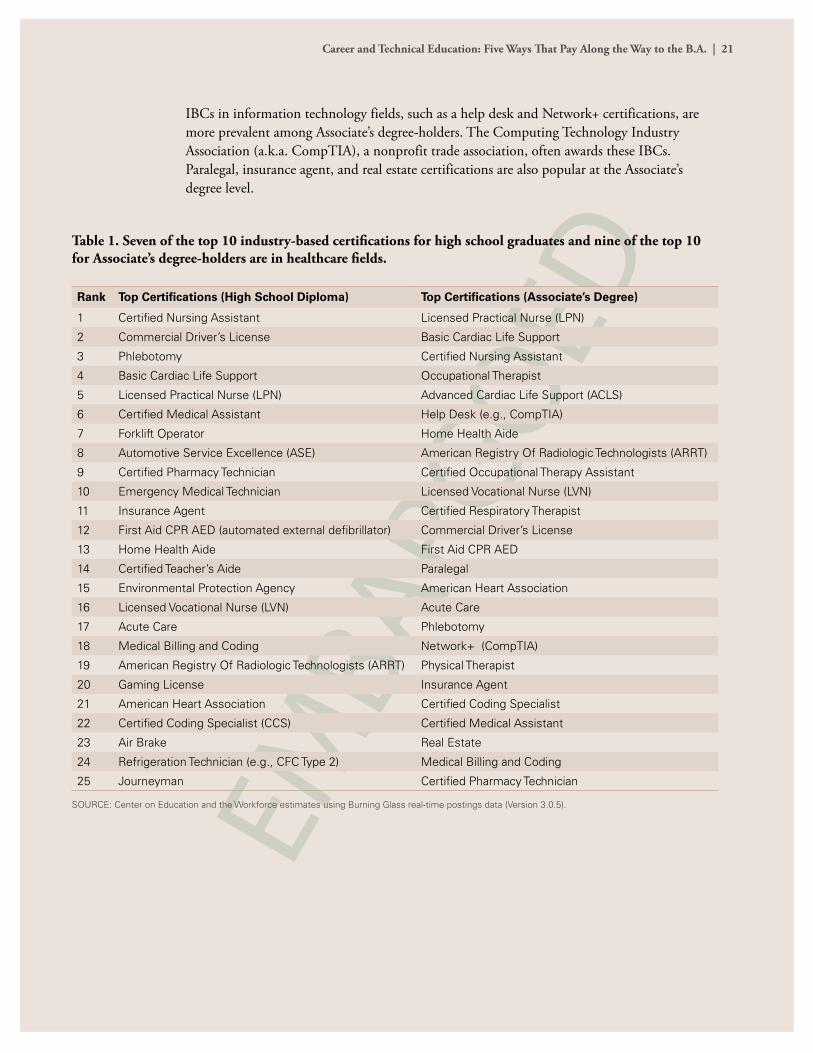
Table 1 lists the 25 most commonly cited industry-based certifications for online job openings. The most noticeable trend among these certifications is their concentration among healthcare occupations. Healthcare certifications comprise 14 of the top 25 IBCs for workers with a high school diploma and 18 of the top 25 IBCs for Associate’s degree-holders. IBCs’ popularity in healthcare fields likely results from the incentive to reduce risk involved in many healthcare procedures.
Popular IBCs for workers with high school diplomas include commercial driver’s licenses (CDLs), forklift operator, and Automotive Service Excellence (ASE) certifications. IBCs for certified nursing assistants (CNAs) are the most popular.
Career and Technical Education: Five Ways That Pay Along the Way to the B.A. | 21
EMBA
RGOED
IBCs in information technology fields, such as a help desk and Network+ certifications, are more prevalent among Associate’s degree-holders. The Computing Technology Industry Association (a.k.a. CompTIA), a nonprofit trade association, often awards these IBCs. Paralegal, insurance agent, and real estate certifications are also popular at the Associate’s degree level.
Table 1. Seven of the top 10 industry-based certifications for high school graduates and nine of the top 10 for Associate’s degree-holders are in healthcare fields.
Rank Top Certifications (High School Diploma) Top Certifications (Associate’s Degree)
1 Certified Nursing Assistant Licensed Practical Nurse (LPN)
2 Commercial Driver’s License Basic Cardiac Life Support
3 Phlebotomy Certified Nursing Assistant
4 Basic Cardiac Life Support Occupational Therapist
5 Licensed Practical Nurse (LPN) Advanced Cardiac Life Support (ACLS)
6 Certified Medical Assistant Help Desk (e.g., CompTIA)
7 Forklift Operator Home Health Aide
8 Automotive Service Excellence (ASE) American Registry Of Radiologic Technologists (ARRT)
9 Certified Pharmacy Technician Certified Occupational Therapy Assistant
10 Emergency Medical Technician Licensed Vocational Nurse (LVN)
11 Insurance Agent Certified Respiratory Therapist
12 First Aid CPR AED (automated external defibrillator) Commercial Driver’s License
13 Home Health Aide First Aid CPR AED
14 Certified Teacher’s Aide Paralegal
15 Environmental Protection Agency American Heart Association
16 Licensed Vocational Nurse (LVN) Acute Care
17 Acute Care Phlebotomy
18 Medical Billing and Coding Network+ (CompTIA)
19 American Registry Of Radiologic Technologists (ARRT) Physical Therapist
20 Gaming License Insurance Agent
21 American Heart Association Certified Coding Specialist
22 Certified Coding Specialist (CCS) Certified Medical Assistant
23 Air Brake Real Estate
24 Refrigeration Technician (e.g., CFC Type 2) Medical Billing and Coding
25 Journeyman Certified Pharmacy Technician
SOURCE: Center on Education and the Workforce estimates using Burning Glass real-time postings data (Version 3.0.5).
22 | Career and Technical Education: Five Ways That Pay Along the Way to the B.A.
EMBA
RGOED
Apprenticeships
Apprenticeships provide individuals with on-the-job training supplemented by academic instruction.
Apprenticeships are training programs that combine paid, supervised, on-the-job learning experience with related academic instruction. Apprenticeships are designed to provide individuals with a specific advanced set of skills that meets the particular needs of employers.17 Apprenticeship programs typically last between three and four years. Some coursework is typically completed as part of the program, generally equivalent to at least one year at a community college.18 The Registered Apprenticeship program is a joint initiative of State Apprenticeship Agencies and the Office of Apprenticeship, two separate entities that are under the Employment and Training Administration (ETA) within the U.S. Department of Labor. Registered Apprenticeship programs facilitate connections among employers, employer associations, and joint labor-management partnerships, together known as sponsors, and job seekers who are interested in learning new skills through the combination of paid on-the-job training and academic instruction.
Apprenticeships only account for a small and declining share of employment in the United States compared to central European countries where apprenticeships are well established.
More than 388,000 people are currently obtaining postsecondary education and career skills by participating in Registered Apprenticeship programs, with more than 128,000 new apprentices entering and around 54,000 apprentices graduating from the Registered Apprenticeship system in FY 2011.19 Apprentices constitute just 0.3 percent of the overall civilian employment in the United States,20 which translates into three apprentices per 1,000 employed individuals. Unregistered apprenticeships, which have not been measured precisely, represent up to a million more apprenticeships.21
The U.S. number is a significantly smaller share than the 40 apprentices per 1,000 employed individuals in Germany, the 43 apprentices per 1,000 employed individuals in Switzerland, or the 39 apprentices per 1,000 employed individuals in Australia.22 In Germany and Switzerland the apprenticeship is a major element of transition from school to work for 40 percent to 70 percent of high school students and recent high school graduates, and in Australia the role of apprenticeships has been expanded in recent years, reaching participation levels similar to those in central European countries.23
The extensive use of apprenticeships helps reduce disparities in employment and earnings between young college graduates and young people with less education. In Australia, less-
17. Office of Apprenticeship, (2012).18. Lerman, (2009).19. Office of Apprenticeship, (2012). 20. The overall civilian employment used in calculation of this ratio is 142,415,000 employed for 16 and over population from the Current Population Survey (CPS).21. Lerman, (2009).22. Steedman, (2010).23. Lerman, (2009).
Career and Technical Education: Five Ways That Pay Along the Way to the B.A. | 23
EMBA
RGOED
educated youth (those who have not completed upper secondary education) have about 3.5 times greater risk of unemployment compared with more-educated youth (those who graduated college). In Germany and Switzerland, where apprenticeship programs have been well established for years, less-educated youth only have about twice the risk of unemployment as more-educated youth. Comparatively in the United States less-educated youth have 4.5 times the risk of unemployment as more-educated youth.24
There has been little progress in expanding apprenticeship programs in the United States. The current ratio of apprentices to civilian employment (0.3 percent) is the same as it was in the late 1970s, indicating that little has changed over the past four decades.25 However, since 2008, the total number of apprentices has declined by almost 100,000.26 This is a reversal of the growth in apprentices experienced by Registered Apprenticeship programs between the late 1990s and early 2000s.27 This decline is most likely because of cuts in the training budgets undertaken by employers in response to the recent major recession that depressed demand for qualified workers.
The construction industry has the most apprenticeships, though opportunities are available in 1,000 different occupations.
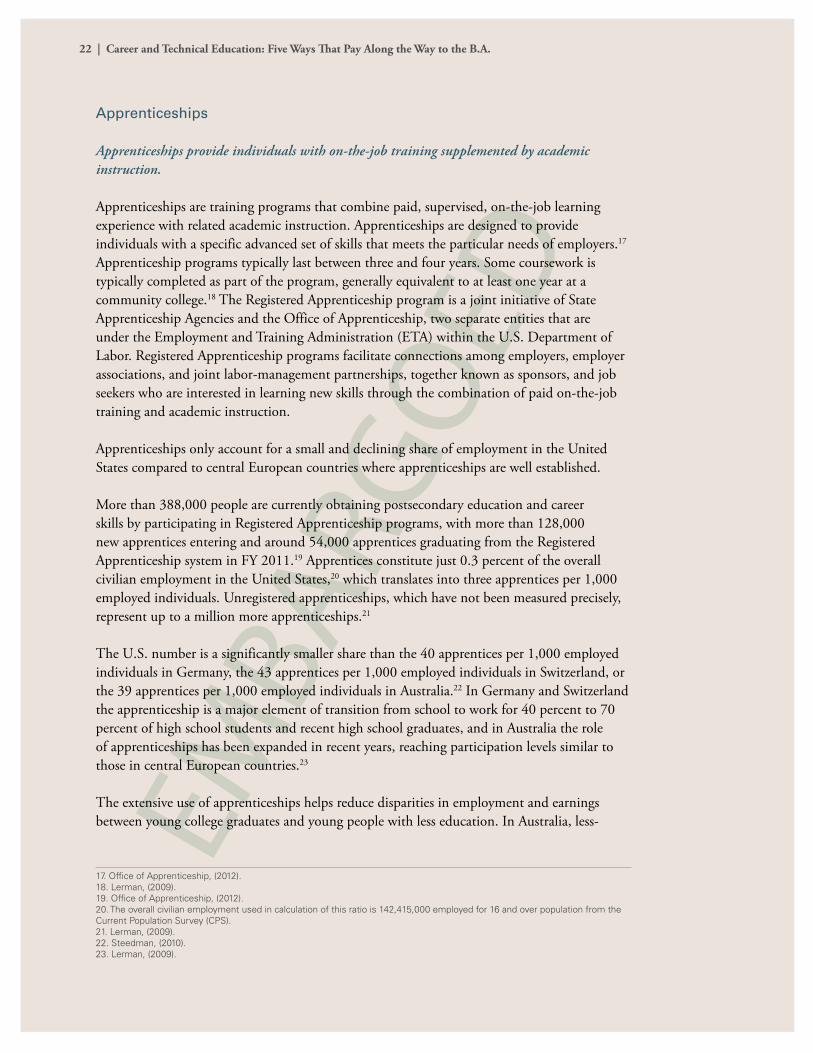
There are currently about 24,000 active apprenticeship programs across the country, including 1,400 that were established in FY 2011.28 Overall, the Registered Apprenticeship network includes more than 250,000 employers training apprentices in more than 1,000 different occupations.29 Traditionally, apprenticeships in the United States have been primarily in construction and manufacturing fields, including large programs in carpentry, ship building, welding, electrical work, pipe-fitting, machining, and maintenance.30 While construction still accounts for more than half of apprenticeships (56.4 per cent of apprentices),31 more recently the Registered Apprenticeships have been expanded into high-growth industries, including healthcare, biotechnology, information technology, and transportation (Figure 16).32 Construction, manufacturing, and high-growth industries are not the only fields in which apprenticeships have been established. Opportunities are available in occupations as diverse as accordion maker, youth development practitioner, subcontract administrator, rocket motor mechanic, radiation monitor, painter, accounting technician, and neon-sign servicer.33
The vast majority of apprentices are men, with women accounting for only 5.4 percent of apprentices, as of 2008 (Figure 17). This is mainly because traditional apprenticeship programs are concentrated in fields dominated by men, with over 56 percent of apprentices working and training in occupations related to the construction field.
24. Organisation of Economic Co-operation and Development, (2010).25. Bureau of Labor Statistics, (1981).26. Lerman, (2010).27. Lerman, (2009).28. Office of Apprenticeship, (2012).29. Office of Apprenticeship, (2012).30. Lerman, (2010).31. Lerman, (2010).32. Gunn and De Silva, (2008).33. Office of Apprenticeship, (2012).
24 | Career and Technical Education: Five Ways That Pay Along the Way to the B.A.
EMBA
RGOED
34. Lerman, (2009). Note: Data are from Table 1.
Figure 16: Over half of apprentices were working in construction in 2008.
SOURCE: Office of Apprenticeship, U.S. Department of Labor35
Figure 18. Minority groups accounted for roughly 30 percent of apprentices in 2008.
Source: Office of Apprenticeship, U.S. Department of Labor
Sh
are
of A
pp
ren
tice
s in
Sec
tor
(%)
0
10
20
30
40
50
60
Who
lesa
lean
d re
tail
trad
e
Publ
icA
dmin
istr
atio
n
Man
ufac
turin
g
Ser
vice
s
U.S
. Mili
tary
Tran
spor
tatio
n/C
omm
unic
atio
n
Con
stru
ctio
n56
13 116 5 5
1
5%
90%
5%
Men
Women
Unknown
70%
1%
11%6%
0
10
20
30
40
50
60
70
Afr
ican
Am
eric
an
Asi
an
Am
eric
anIn
dian
/Ala
skan
Whi
te
Shar
e of
App
rent
ices
(%)
7%
43%
22%
29%
Age
0
10
20
30
40
50
16-2
4
25-3
4
35+
Unk
own
Shar
e of
App
rent
ices
(%)
1% 4%11%
73%
15%Shar
e of
App
rent
ices
(%)
0
25
50
75
Unk
now
n
Hig
h sc
hool
gra
duat
e or
mor
e
GED
9th
to 1
2th
grad
e
8th
grad
er o
r les
s
Figure 17. Ninety percent of apprentices were men in 2008.
Source: Office of Apprenticeship, U.S. Department of Labor
Figure 19. Over 70 percent of apprentices were 25 or older
in 2008
Source: Office of Apprenticeship, U.S. Department of Labor
Figure 20. Almost 73 percent of apprentices had at least a high school diploma in 2008
Source: Office of Apprenticeship, U.S. Department of Labor
Career and Technical Education: Five Ways That Pay Along the Way to the B.A. | 25
EMBA
RGOED
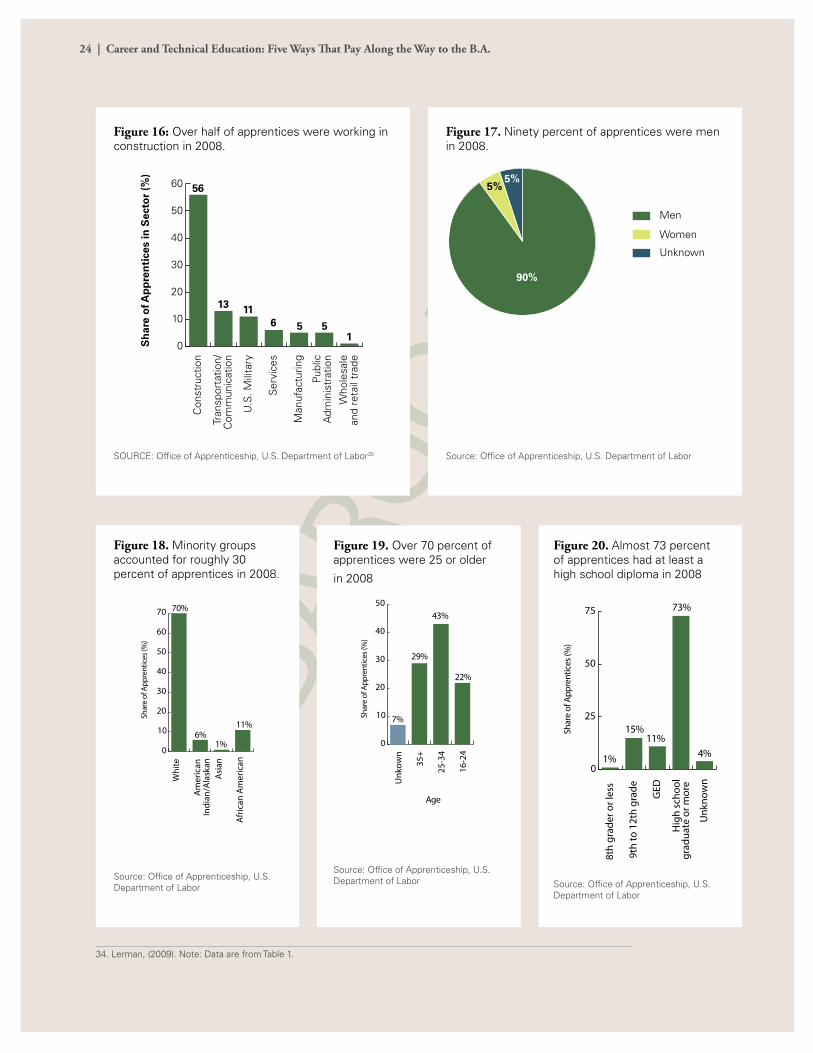
Minority racial groups make up about 30 percent of apprentices, with 10.5 percent of apprentices being African American, 1.4 percent Asian, and 6.3 percent American Indian or Alaska Native (Figure 18). Hispanics make up 18.8 percent of apprentices.35 Much progress has been made in incorporating minority groups. In 1979, minority groups made up only 13 percent of apprentices; by 2008, that share has grown to 30 percent.36
Over 70 percent of apprentices are 25 years of age or older, and nearly a third of apprentices (29 percent) are 35 years of age or older (Figure 19). This age distribution is in stark contrast to European countries, where apprenticeships are generally only open to young people 25 years of age or less.37
The majority of apprentices have graduated from high school or received an equivalent credential (Figure 20). Nearly 73 percent of apprentices have at least received their high school diploma and another 10.5 percent of participants have earned their GED (General Educational Development certificate). However, there is no requirement to have completed high school to participate in an apprenticeship program, and many apprenticeships accept people as young as 16 years of age. As a result, over 15 percent of apprentices have started high school, but not completed their diploma, and another 1 percent have not even started high school.
Apprenticeships are cost-effective for the federal government, provide high return on investment, and warrant further exploration as a pathway to middle jobs.
The U.S. government spends around $25 million annually on Registered Apprenticeship programs, a quite modest figure compared to federal spending on other workforce training programs, mainly because employers mostly administer their own apprenticeship programs and fund the bulk of the costs.38 In addition, the earnings gains and rates of return for apprenticeships are greater than alternative CTE education and workforce training programs.The current net value of lifetime earnings gains (less costs) of $269,000 per apprentice compared with $96,000 to $123,000 for each individual who attended community college, and around $40,000 for each person who participated in Workforce Investment Act training programs.39, 40
Apprenticeships offer a demand-driven, employer-sponsored, cost-effective method for providing individuals with basic postsecondary education and career skills.
Apprenticeships have strong support from both employers, who see them as a great way to train a qualified workforce, and apprentices, who see them as a great opportunity to develop a profession while earning good income.41 Yet apprenticeships have not seen extensive general support in the United States and have mostly been underutilized compared to other forms
35. Lerman, (2009).36. Lerman, (2009).37. Steedman, (2010).38. Annual federal spending was provided by Robert Lerman, update to around $21 million in Lerman, (2009).39. Hollenbeck, (2008).40. Lerman, (2010).41. Gunn and De Silva, (2008).
26 | Career and Technical Education: Five Ways That Pay Along the Way to the B.A.
EMBA
RGOED
of education and training. Nor has there been much focus on apprenticeships from policy makers or business leaders in recent years. As the country struggles to deal with high youth unemployment and simultaneous lack of qualified workers in many fields, apprenticeships represent a pathway worth investing in.
Postsecondary Certificates
Postsecondary certificates are a homegrown, American invention: They are America’s version of the apprenticeship or occupational track. What is unique about postsecondary certificates is their diversity and flexibility: There is no common brand. Postsecondary certificate programs vary in their program length, purpose, structure, effects, and location. They are expanding rapidly in response to both labor market and educational demands, growing from 300,000 awarded in 1994 to roughly 1 million in 2010. They have now overtaken both Associate’s and Master’s degrees as the second most-popular postsecondary award after Bachelor’s degrees.42
Because postsecondary certificates are focused on preparing individuals for narrow occupations and fields, their programs often take less time to complete than college degrees. The majority (54 percent) of postsecondary certificate programs take less than a year of instructional time to complete, while 41 percent take between one and two years. In an era when college costs are on everyone’s minds, postsecondary certificates represent a cost-effective alternative for high school graduates because of their short, focused training and earnings advantage. Postgraduate certificate programs’ net cost to the student (i.e., their cost after student grant aid has been applied) typically ranges from $6,000 to $20,000 per year.
On average, men with postsecondary certificates earn 27 percent more than men with high school diplomas, while women earn 16 percent more. When certificate holders work in the field they studied, they earn nearly 40 percent more than high school graduates. A certificate in one of the top-performing areas can bring wages higher than the average Associate’s and Bachelor’s degree-holder. The top 40 percent of male certificate-holders earn more than the average man with an Associate’s degree and the top 24 percent earn more than the average man with a Bachelor’s degree.43
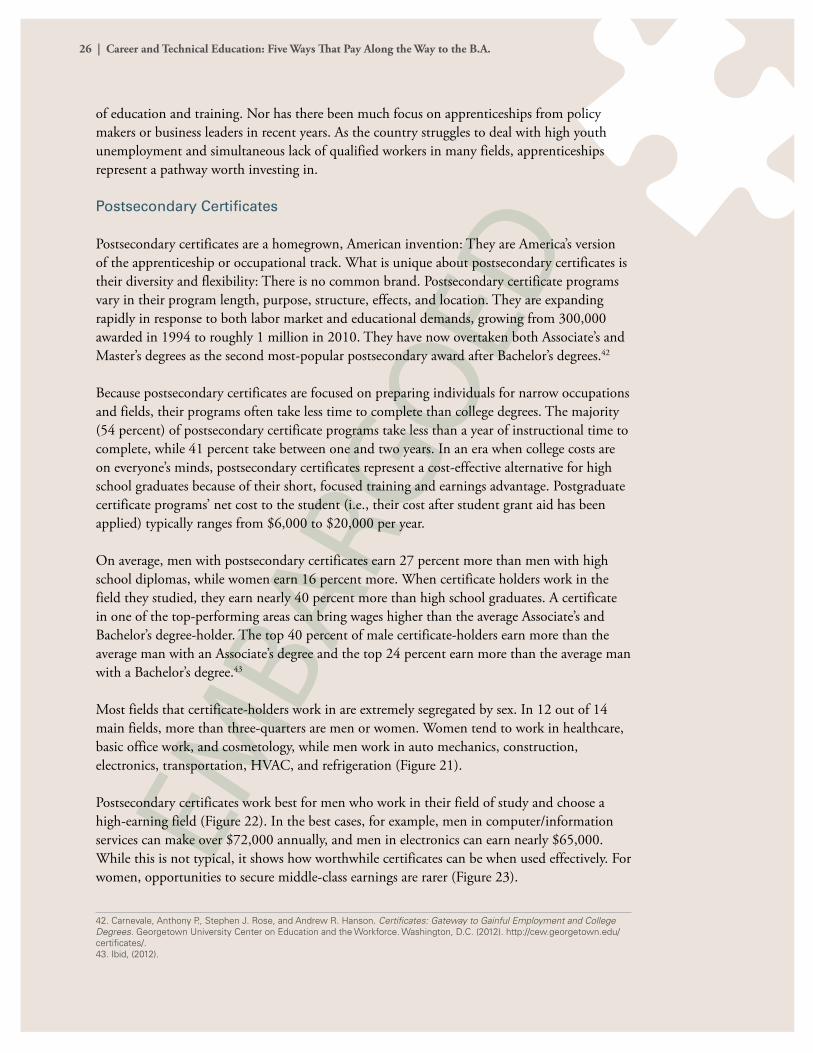
Most fields that certificate-holders work in are extremely segregated by sex. In 12 out of 14 main fields, more than three-quarters are men or women. Women tend to work in healthcare, basic office work, and cosmetology, while men work in auto mechanics, construction, electronics, transportation, HVAC, and refrigeration (Figure 21).
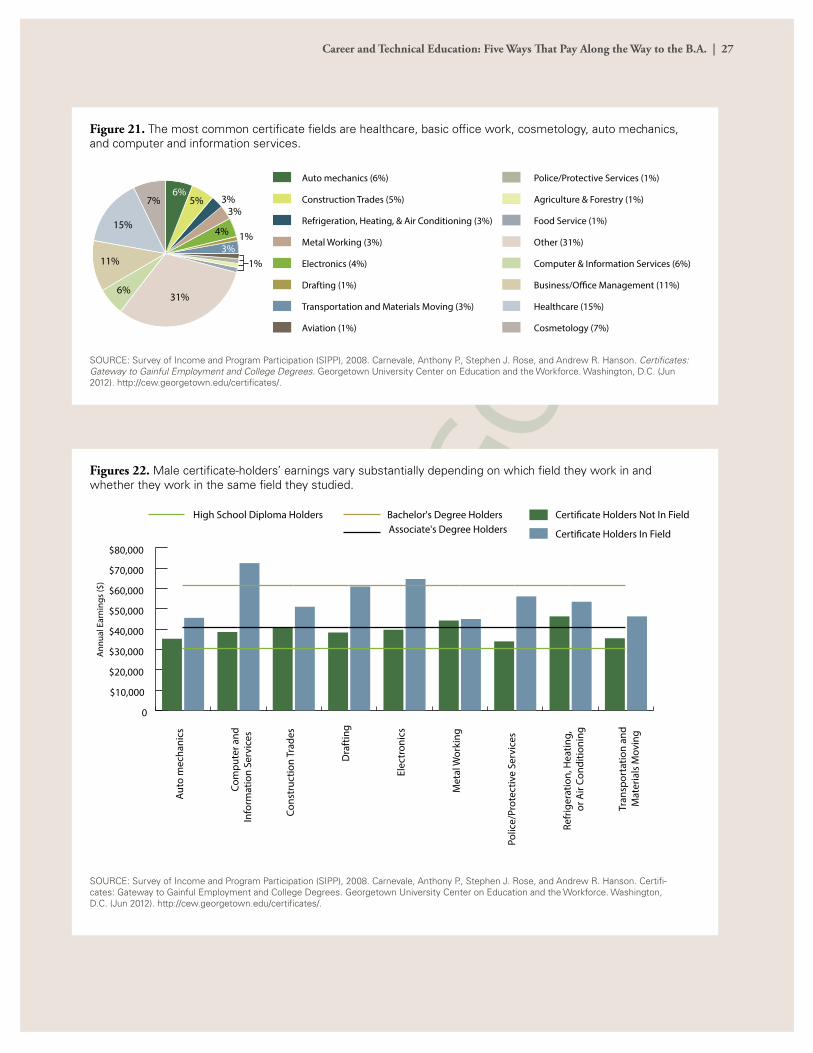
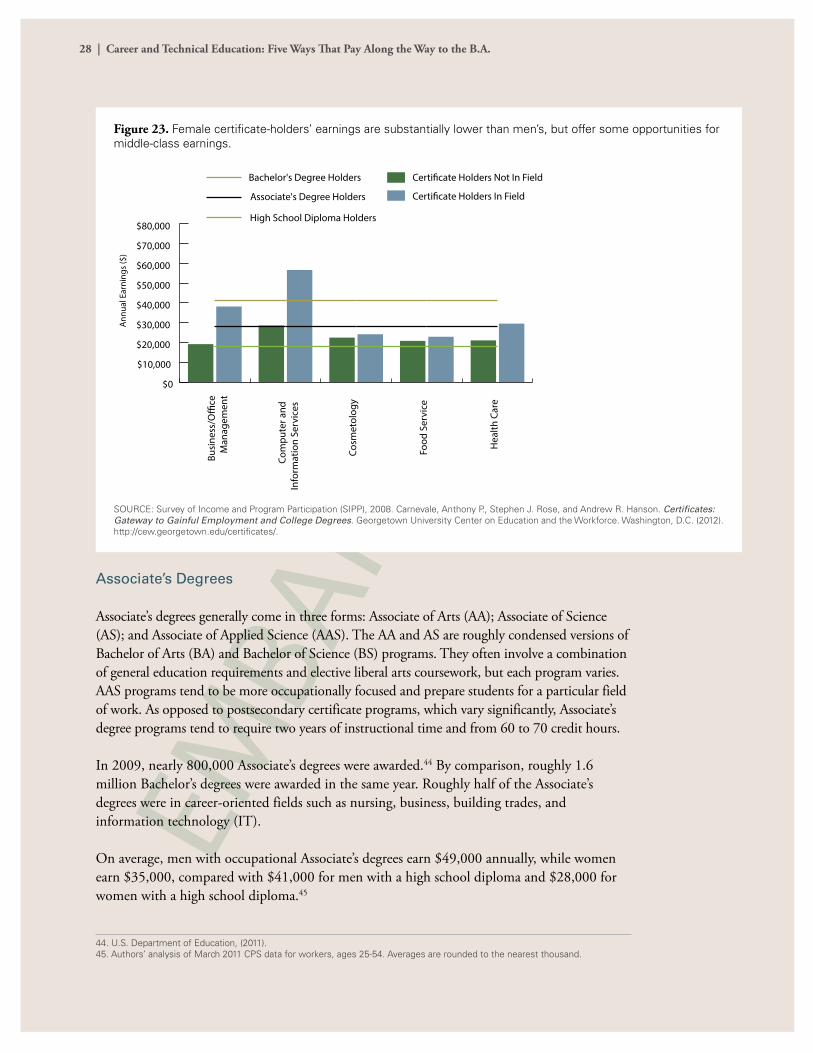
Postsecondary certificates work best for men who work in their field of study and choose a high-earning field (Figure 22). In the best cases, for example, men in computer/information services can make over $72,000 annually, and men in electronics can earn nearly $65,000. While this is not typical, it shows how worthwhile certificates can be when used effectively. For women, opportunities to secure middle-class earnings are rarer (Figure 23).
42. Carnevale, Anthony P., Stephen J. Rose, and Andrew R. Hanson. Certificates: Gateway to Gainful Employment and College Degrees. Georgetown University Center on Education and the Workforce. Washington, D.C. (2012). http://cew.georgetown.edu/certificates/.43. Ibid, (2012).
Career and Technical Education: Five Ways That Pay Along the Way to the B.A. | 27
EMBA
RGOEDCosmetology (7%)
Healthcare (15%)
Business/O�ce Management (11%)
Computer & Information Services (6%)
Other (31%)
Food Service (1%)
Agriculture & Forestry (1%)
Police/Protective Services (1%)
Aviation (1%)
Transportation and Materials Moving (3%)
Drafting (1%)
Electronics (4%)
Metal Working (3%)
Refrigeration, Heating, & Air Conditioning (3%)
Construction Trades (5%)
Auto mechanics (6%)6%
5% 3%3%
1%3%
1%
31%6%
11%
15%
7%
4%
Figure 21. The most common certificate fields are healthcare, basic office work, cosmetology, auto mechanics, and computer and information services.
SOURCE: Survey of Income and Program Participation (SIPP), 2008. Carnevale, Anthony P., Stephen J. Rose, and Andrew R. Hanson. Certificates: Gateway to Gainful Employment and College Degrees. Georgetown University Center on Education and the Workforce. Washington, D.C. (Jun 2012). http://cew.georgetown.edu/certificates/.
Certi�cate Holders Not In FieldHigh School Diploma Holders Bachelor's Degree HoldersAssociate's Degree Holders Certi�cate Holders In Field
0
$10,000
$20,000
$30,000
$40,000
$50,000
$60,000
$70,000
$80,000
Tran
spor
tatio
n an
d M
ater
ials
Mov
ing
Refr
iger
atio
n, H
eatin
g,or
Air
Cond
ition
ing
Polic
e/Pr
otec
tive
Serv
ices
Met
al W
orki
ng
Elec
tron
ics
Dra
ftin
g
Cons
truc
tion
Trad
es
Com
pute
r and
Info
rmat
ion
Serv
ices
Auto
mec
hani
cs
Ann
ual E
arni
ngs
($)
Figures 22. Male certificate-holders’ earnings vary substantially depending on which field they work in and whether they work in the same field they studied.
SOURCE: Survey of Income and Program Participation (SIPP), 2008. Carnevale, Anthony P., Stephen J. Rose, and Andrew R. Hanson. Certifi-cates: Gateway to Gainful Employment and College Degrees. Georgetown University Center on Education and the Workforce. Washington, D.C. (Jun 2012). http://cew.georgetown.edu/certificates/.
28 | Career and Technical Education: Five Ways That Pay Along the Way to the B.A.
EMBA
RGOED
Associate’s Degrees
Associate’s degrees generally come in three forms: Associate of Arts (AA); Associate of Science (AS); and Associate of Applied Science (AAS). The AA and AS are roughly condensed versions of Bachelor of Arts (BA) and Bachelor of Science (BS) programs. They often involve a combination of general education requirements and elective liberal arts coursework, but each program varies. AAS programs tend to be more occupationally focused and prepare students for a particular field of work. As opposed to postsecondary certificate programs, which vary significantly, Associate’s degree programs tend to require two years of instructional time and from 60 to 70 credit hours.
In 2009, nearly 800,000 Associate’s degrees were awarded.44 By comparison, roughly 1.6 million Bachelor’s degrees were awarded in the same year. Roughly half of the Associate’s degrees were in career-oriented fields such as nursing, business, building trades, and information technology (IT).
On average, men with occupational Associate’s degrees earn $49,000 annually, while women earn $35,000, compared with $41,000 for men with a high school diploma and $28,000 for women with a high school diploma.45
44. U.S. Department of Education, (2011).45. Authors’ analysis of March 2011 CPS data for workers, ages 25-54. Averages are rounded to the nearest thousand.
Certi�cate Holders Not In Field
High School Diploma Holders
Bachelor's Degree Holders
Associate's Degree Holders Certi�cate Holders In Field
$0
$10,000
$20,000
$30,000
$40,000
$50,000
$60,000
$70,000
$80,000
Hea
lth C
are
Food
Ser
vice
Cosm
etol
ogy
Com
pute
r and
In
form
atio
n Se
rvic
es
Busi
ness
/O�
ce M
anag
emen
t
Ann
ual E
arni
ngs
($)
Figure 23. Female certificate-holders’ earnings are substantially lower than men’s, but offer some opportunities for middle-class earnings.
SOURCE: Survey of Income and Program Participation (SIPP), 2008. Carnevale, Anthony P., Stephen J. Rose, and Andrew R. Hanson. Certificates: Gateway to Gainful Employment and College Degrees. Georgetown University Center on Education and the Workforce. Washington, D.C. (2012). http://cew.georgetown.edu/certificates/.
Career and Technical Education: Five Ways That Pay Along the Way to the B.A. | 29
EMBA
RGOED
Over the past 20 years, the number of Associate’s degrees has risen by less than 3 percent in the United States, according to the Organisation of Economic Co-operation and Development. By comparison, the number of Associate’s degrees has risen by roughly 9 percent in Canada, South Korea, and France. This suggests there is a great deal of room for growth of Associate’s degrees in the United States.
Associate’s degrees are a lifelong credential. Only half of Americans with Associate’s degrees earned them before age 25.46 Because Associate’s degrees require less instructional time than Bachelor’s degrees, older workers likely see them as a more feasible commitment. They are also offered by local community colleges and for-profit institutions, which tend either to be geographically closer or to offer online courses and more flexibility than their competitors.
Among Associate’s degree-holders, the most common fields of study for women are business and allied health. These two fields account for 64 percent of all Associate’s degrees earned by women. For men, the most popular fields are business, engineering, IT, vocational, humanities, allied health, and protective services.47
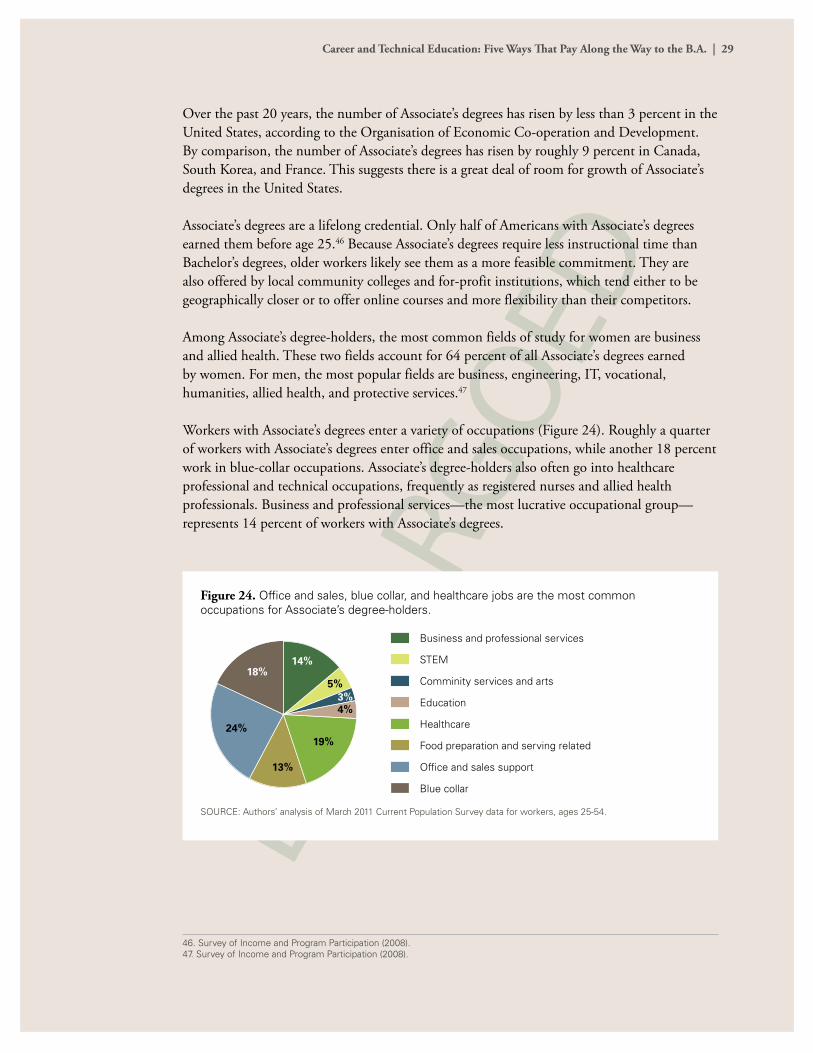
Workers with Associate’s degrees enter a variety of occupations (Figure 24). Roughly a quarter of workers with Associate’s degrees enter office and sales occupations, while another 18 percent work in blue-collar occupations. Associate’s degree-holders also often go into healthcare professional and technical occupations, frequently as registered nurses and allied health professionals. Business and professional services—the most lucrative occupational group—represents 14 percent of workers with Associate’s degrees.
Figure 24. Office and sales, blue collar, and healthcare jobs are the most common occupations for Associate’s degree-holders.
SOURCE: Authors’ analysis of March 2011 Current Population Survey data for workers, ages 25-54.
46. Survey of Income and Program Participation (2008).47. Survey of Income and Program Participation (2008).
Blue collar
Office and sales support
Food preparation and serving related
Healthcare
Education
Comminity services and arts
STEM
Business and professional services
14%18%
5%3%4%
19%24%
13%
30 | Career and Technical Education: Five Ways That Pay Along the Way to the B.A.
EMBA
RGOED
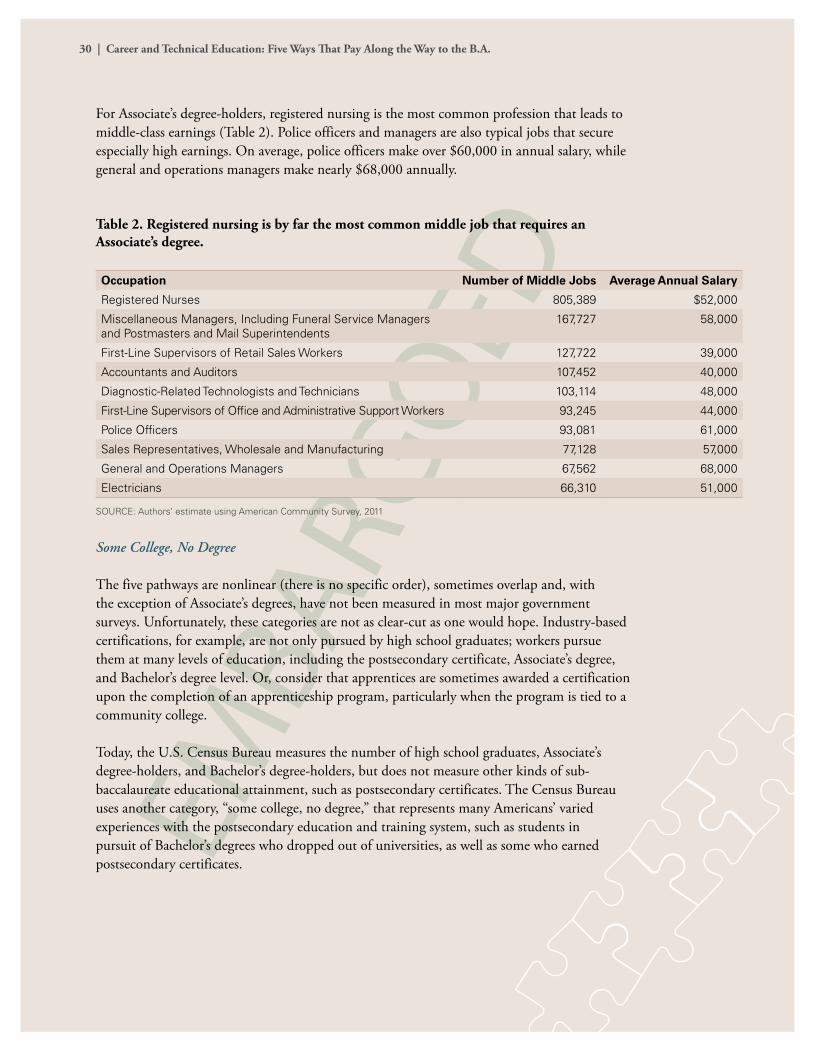
For Associate’s degree-holders, registered nursing is the most common profession that leads to middle-class earnings (Table 2). Police officers and managers are also typical jobs that secure especially high earnings. On average, police officers make over $60,000 in annual salary, while general and operations managers make nearly $68,000 annually.
Table 2. Registered nursing is by far the most common middle job that requires an Associate’s degree.
Occupation Number of Middle Jobs Average Annual Salary
Registered Nurses 805,389 $52,000
Miscellaneous Managers, Including Funeral Service Managers and Postmasters and Mail Superintendents
167,727 58,000
First-Line Supervisors of Retail Sales Workers 127,722 39,000
Accountants and Auditors 107,452 40,000
Diagnostic-Related Technologists and Technicians 103,114 48,000
First-Line Supervisors of Office and Administrative Support Workers 93,245 44,000
Police Officers 93,081 61,000
Sales Representatives, Wholesale and Manufacturing 77,128 57,000
General and Operations Managers 67,562 68,000
Electricians 66,310 51,000
SOURCE: Authors’ estimate using American Community Survey, 2011
Some College, No Degree
The five pathways are nonlinear (there is no specific order), sometimes overlap and, with the exception of Associate’s degrees, have not been measured in most major government surveys. Unfortunately, these categories are not as clear-cut as one would hope. Industry-based certifications, for example, are not only pursued by high school graduates; workers pursue them at many levels of education, including the postsecondary certificate, Associate’s degree, and Bachelor’s degree level. Or, consider that apprentices are sometimes awarded a certification upon the completion of an apprenticeship program, particularly when the program is tied to a community college.
Today, the U.S. Census Bureau measures the number of high school graduates, Associate’s degree-holders, and Bachelor’s degree-holders, but does not measure other kinds of sub-baccalaureate educational attainment, such as postsecondary certificates. The Census Bureau uses another category, “some college, no degree,” that represents many Americans’ varied experiences with the postsecondary education and training system, such as students in pursuit of Bachelor’s degrees who dropped out of universities, as well as some who earned postsecondary certificates.
Career and Technical Education: Five Ways That Pay Along the Way to the B.A. | 31
EMBA
RGOED
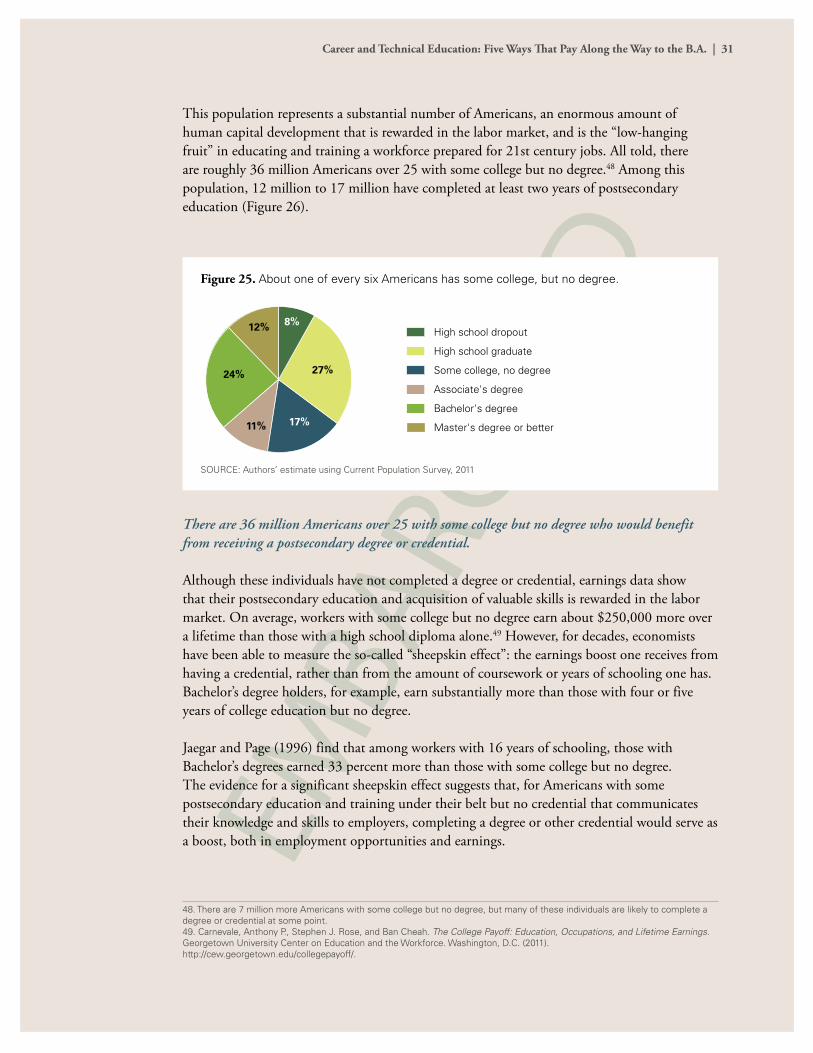
This population represents a substantial number of Americans, an enormous amount of human capital development that is rewarded in the labor market, and is the “low-hanging fruit” in educating and training a workforce prepared for 21st century jobs. All told, there are roughly 36 million Americans over 25 with some college but no degree.48 Among this population, 12 million to 17 million have completed at least two years of postsecondary education (Figure 26).
Figure 25. About one of every six Americans has some college, but no degree.
SOURCE: Authors’ estimate using Current Population Survey, 2011
There are 36 million Americans over 25 with some college but no degree who would benefit from receiving a postsecondary degree or credential.
Although these individuals have not completed a degree or credential, earnings data show that their postsecondary education and acquisition of valuable skills is rewarded in the labor market. On average, workers with some college but no degree earn about $250,000 more over a lifetime than those with a high school diploma alone.49 However, for decades, economists have been able to measure the so-called “sheepskin effect”: the earnings boost one receives from having a credential, rather than from the amount of coursework or years of schooling one has. Bachelor’s degree holders, for example, earn substantially more than those with four or five years of college education but no degree.
Jaegar and Page (1996) find that among workers with 16 years of schooling, those with Bachelor’s degrees earned 33 percent more than those with some college but no degree. The evidence for a significant sheepskin effect suggests that, for Americans with some postsecondary education and training under their belt but no credential that communicates their knowledge and skills to employers, completing a degree or other credential would serve as a boost, both in employment opportunities and earnings.
48. There are 7 million more Americans with some college but no degree, but many of these individuals are likely to complete a degree or credential at some point.49. Carnevale, Anthony P., Stephen J. Rose, and Ban Cheah. The College Payoff: Education, Occupations, and Lifetime Earnings. Georgetown University Center on Education and the Workforce. Washington, D.C. (2011).http://cew.georgetown.edu/collegepayoff/.
8%
17%
27%
12%
11%
24%
Master's degree or better
Bachelor's degree
Associate's degree
Some college, no degree
High school graduate
High school dropout
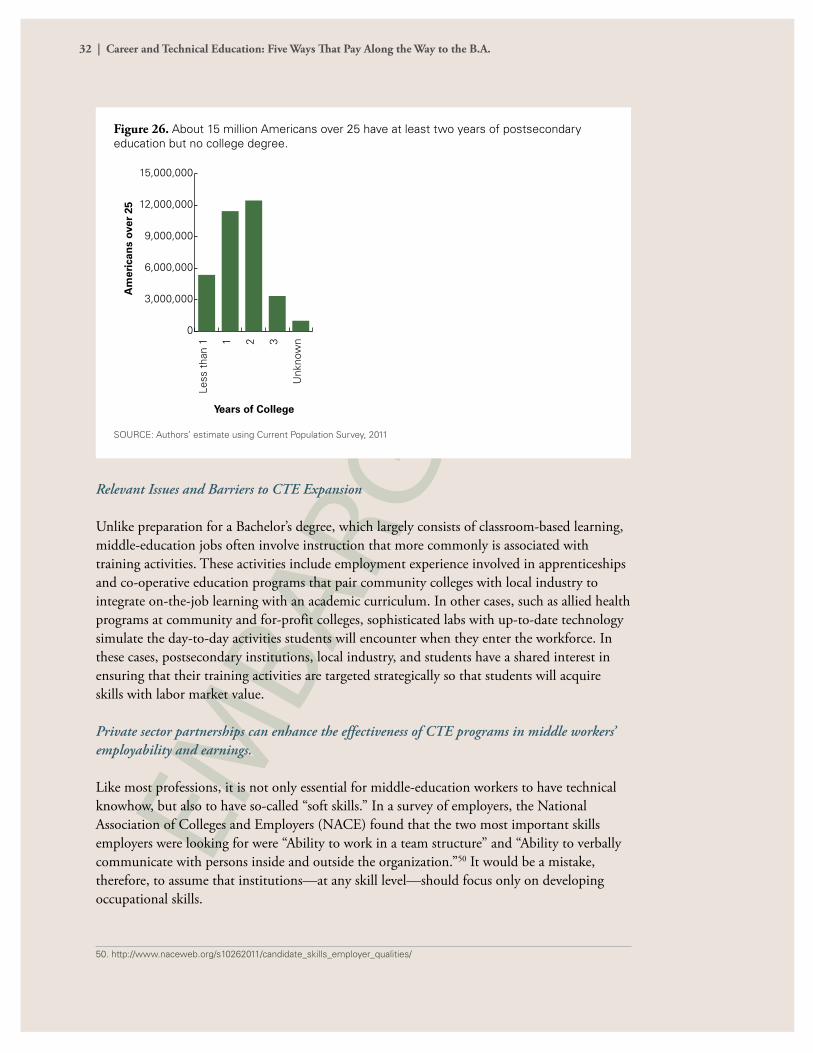
32 | Career and Technical Education: Five Ways That Pay Along the Way to the B.A.
EMBA
RGOED
Figure 26. About 15 million Americans over 25 have at least two years of postsecondary education but no college degree.
SOURCE: Authors’ estimate using Current Population Survey, 2011
Relevant Issues and Barriers to CTE Expansion
Unlike preparation for a Bachelor’s degree, which largely consists of classroom-based learning, middle-education jobs often involve instruction that more commonly is associated with training activities. These activities include employment experience involved in apprenticeships and co-operative education programs that pair community colleges with local industry to integrate on-the-job learning with an academic curriculum. In other cases, such as allied health programs at community and for-profit colleges, sophisticated labs with up-to-date technology simulate the day-to-day activities students will encounter when they enter the workforce. In these cases, postsecondary institutions, local industry, and students have a shared interest in ensuring that their training activities are targeted strategically so that students will acquire skills with labor market value.
Private sector partnerships can enhance the effectiveness of CTE programs in middle workers’ employability and earnings.
Like most professions, it is not only essential for middle-education workers to have technical knowhow, but also to have so-called “soft skills.” In a survey of employers, the National Association of Colleges and Employers (NACE) found that the two most important skills employers were looking for were “Ability to work in a team structure” and “Ability to verbally communicate with persons inside and outside the organization.”50 It would be a mistake, therefore, to assume that institutions—at any skill level—should focus only on developing occupational skills.
50. http://www.naceweb.org/s10262011/candidate_skills_employer_qualities/
Am
eric
ans
over
25
Years of College
0
3,000,000
6,000,000
9,000,000
12,000,000
15,000,000
Unk
now
n321
Less
tha
n 1
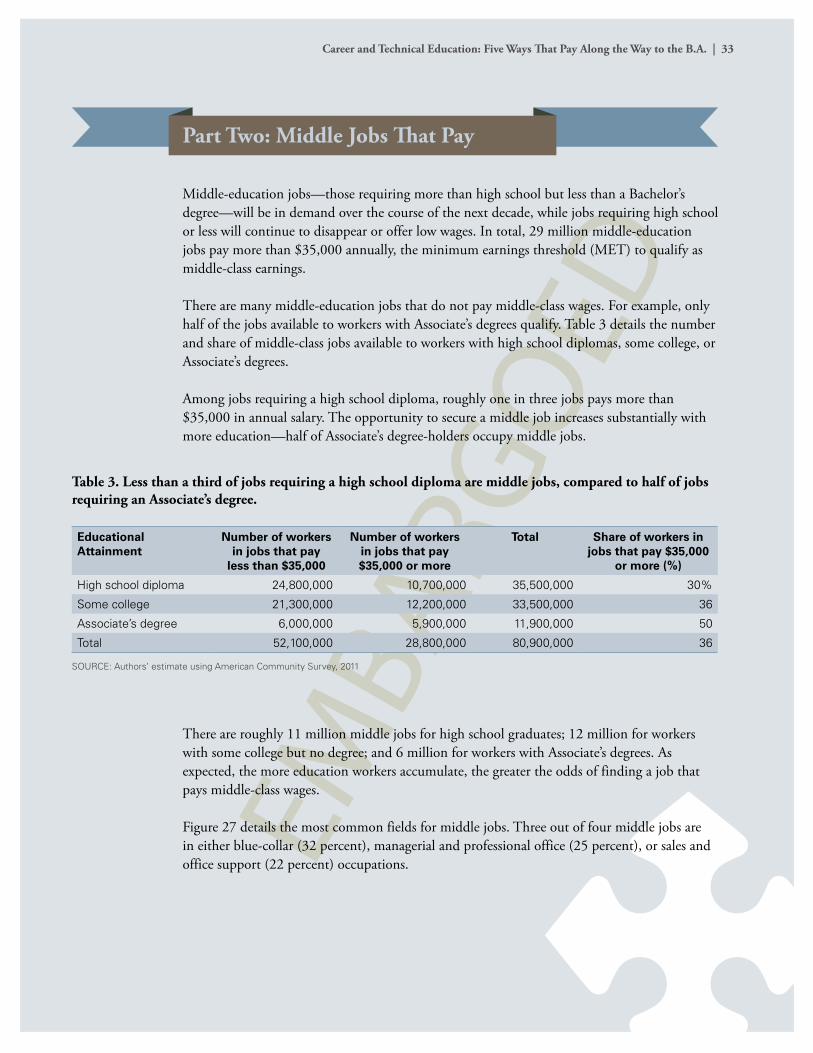
Career and Technical Education: Five Ways That Pay Along the Way to the B.A. | 33
EMBA
RGOED
Part Two: Middle Jobs That Pay
Middle-education jobs—those requiring more than high school but less than a Bachelor’s degree—will be in demand over the course of the next decade, while jobs requiring high school or less will continue to disappear or offer low wages. In total, 29 million middle-education jobs pay more than $35,000 annually, the minimum earnings threshold (MET) to qualify as middle-class earnings.
There are many middle-education jobs that do not pay middle-class wages. For example, only half of the jobs available to workers with Associate’s degrees qualify. Table 3 details the number and share of middle-class jobs available to workers with high school diplomas, some college, or Associate’s degrees.
Among jobs requiring a high school diploma, roughly one in three jobs pays more than $35,000 in annual salary. The opportunity to secure a middle job increases substantially with more education—half of Associate’s degree-holders occupy middle jobs.
There are roughly 11 million middle jobs for high school graduates; 12 million for workers with some college but no degree; and 6 million for workers with Associate’s degrees. As expected, the more education workers accumulate, the greater the odds of finding a job that pays middle-class wages.
Figure 27 details the most common fields for middle jobs. Three out of four middle jobs are in either blue-collar (32 percent), managerial and professional office (25 percent), or sales and office support (22 percent) occupations.
Table 3. Less than a third of jobs requiring a high school diploma are middle jobs, compared to half of jobs requiring an Associate’s degree.
Educational Attainment
Number of workers in jobs that pay
less than $35,000
Number of workers in jobs that pay $35,000 or more
Total Share of workers in jobs that pay $35,000
or more (%)
High school diploma 24,800,000 10,700,000 35,500,000 30%
Some college 21,300,000 12,200,000 33,500,000 36
Associate’s degree 6,000,000 5,900,000 11,900,000 50
Total 52,100,000 28,800,000 80,900,000 36
SOURCE: Authors’ estimate using American Community Survey, 2011
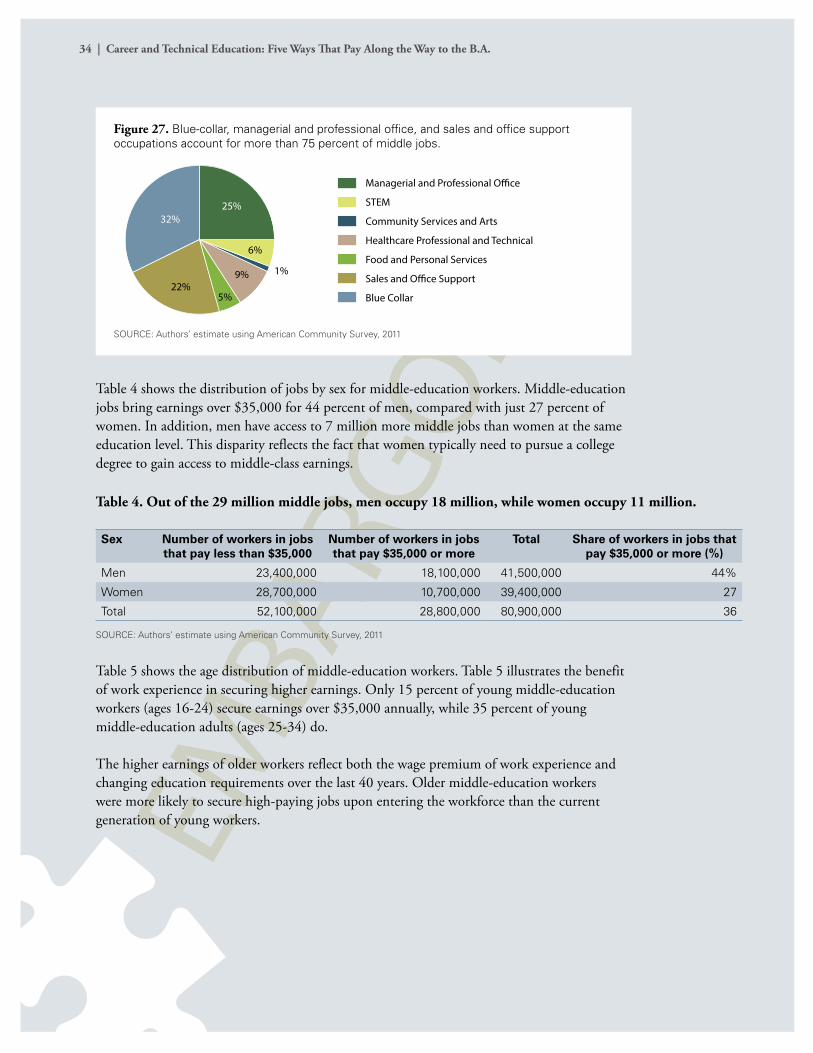
34 | Career and Technical Education: Five Ways That Pay Along the Way to the B.A.
EMBA
RGOED
Figure 27. Blue-collar, managerial and professional office, and sales and office support occupations account for more than 75 percent of middle jobs.
SOURCE: Authors’ estimate using American Community Survey, 2011
Table 4 shows the distribution of jobs by sex for middle-education workers. Middle-education jobs bring earnings over $35,000 for 44 percent of men, compared with just 27 percent of women. In addition, men have access to 7 million more middle jobs than women at the same education level. This disparity reflects the fact that women typically need to pursue a college degree to gain access to middle-class earnings.
Sex Number of workers in jobs that pay less than $35,000
Number of workers in jobs that pay $35,000 or more
Total Share of workers in jobs that pay $35,000 or more (%)
Men 23,400,000 18,100,000 41,500,000 44%
Women 28,700,000 10,700,000 39,400,000 27
Total 52,100,000 28,800,000 80,900,000 36
SOURCE: Authors’ estimate using American Community Survey, 2011
Table 5 shows the age distribution of middle-education workers. Table 5 illustrates the benefit of work experience in securing higher earnings. Only 15 percent of young middle-education workers (ages 16-24) secure earnings over $35,000 annually, while 35 percent of young middle-education adults (ages 25-34) do.
The higher earnings of older workers reflect both the wage premium of work experience and changing education requirements over the last 40 years. Older middle-education workers were more likely to secure high-paying jobs upon entering the workforce than the current generation of young workers.
25%32%
6%
1%9%
5%22%
Blue Collar
Sales and O�ce Support
Food and Personal Services
Healthcare Professional and Technical
Community Services and Arts
STEM
Managerial and Professional O�ce
Table 4. Out of the 29 million middle jobs, men occupy 18 million, while women occupy 11 million.
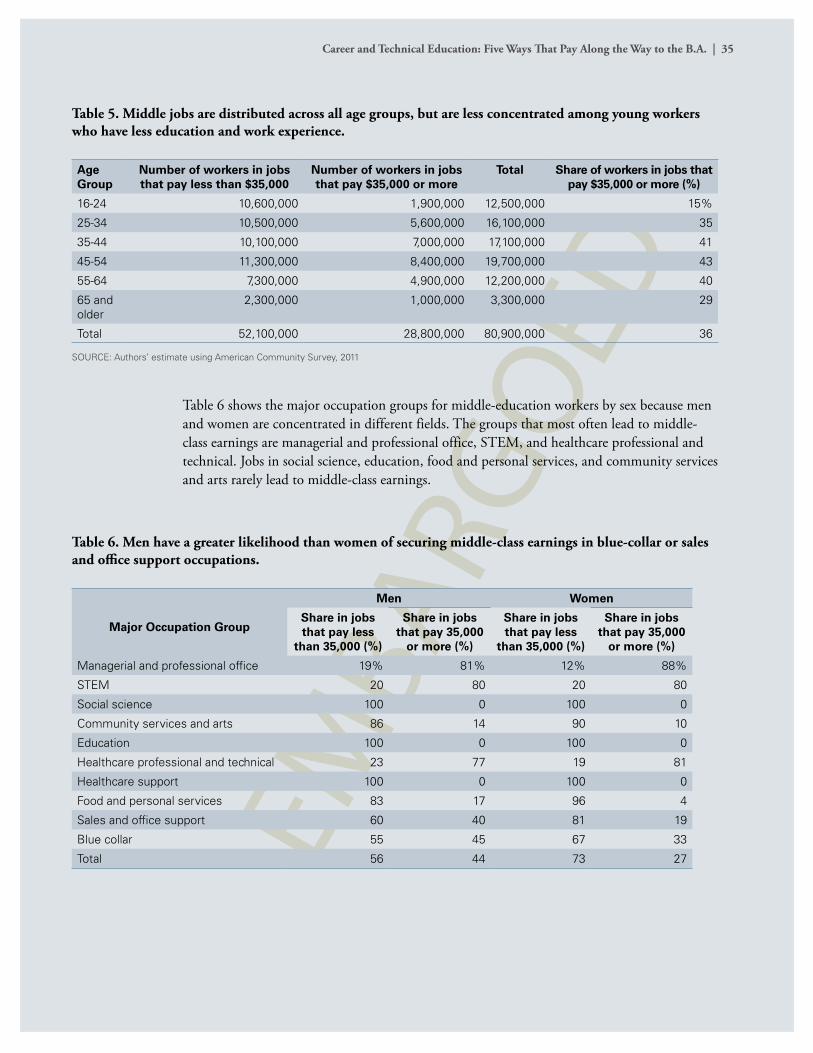
Career and Technical Education: Five Ways That Pay Along the Way to the B.A. | 35
EMBA
RGOED
Table 5. Middle jobs are distributed across all age groups, but are less concentrated among young workers who have less education and work experience.
Age Group
Number of workers in jobs that pay less than $35,000
Number of workers in jobs that pay $35,000 or more
Total Share of workers in jobs that pay $35,000 or more (%)
16-24 10,600,000 1,900,000 12,500,000 15%
25-34 10,500,000 5,600,000 16,100,000 35
35-44 10,100,000 7,000,000 17,100,000 41
45-54 11,300,000 8,400,000 19,700,000 43
55-64 7,300,000 4,900,000 12,200,000 40
65 and older
2,300,000 1,000,000 3,300,000 29
Total 52,100,000 28,800,000 80,900,000 36
SOURCE: Authors’ estimate using American Community Survey, 2011
Table 6. Men have a greater likelihood than women of securing middle-class earnings in blue-collar or sales and office support occupations.
Major Occupation Group
Men Women
Share in jobs that pay less
than 35,000 (%)
Share in jobs that pay 35,000
or more (%)
Share in jobs that pay less
than 35,000 (%)
Share in jobs that pay 35,000
or more (%)
Managerial and professional office 19% 81% 12% 88%
STEM 20 80 20 80
Social science 100 0 100 0
Community services and arts 86 14 90 10
Education 100 0 100 0
Healthcare professional and technical 23 77 19 81
Healthcare support 100 0 100 0
Food and personal services 83 17 96 4
Sales and office support 60 40 81 19
Blue collar 55 45 67 33
Total 56 44 73 27
Table 6 shows the major occupation groups for middle-education workers by sex because men and women are concentrated in different fields. The groups that most often lead to middle-class earnings are managerial and professional office, STEM, and healthcare professional and technical. Jobs in social science, education, food and personal services, and community services and arts rarely lead to middle-class earnings.
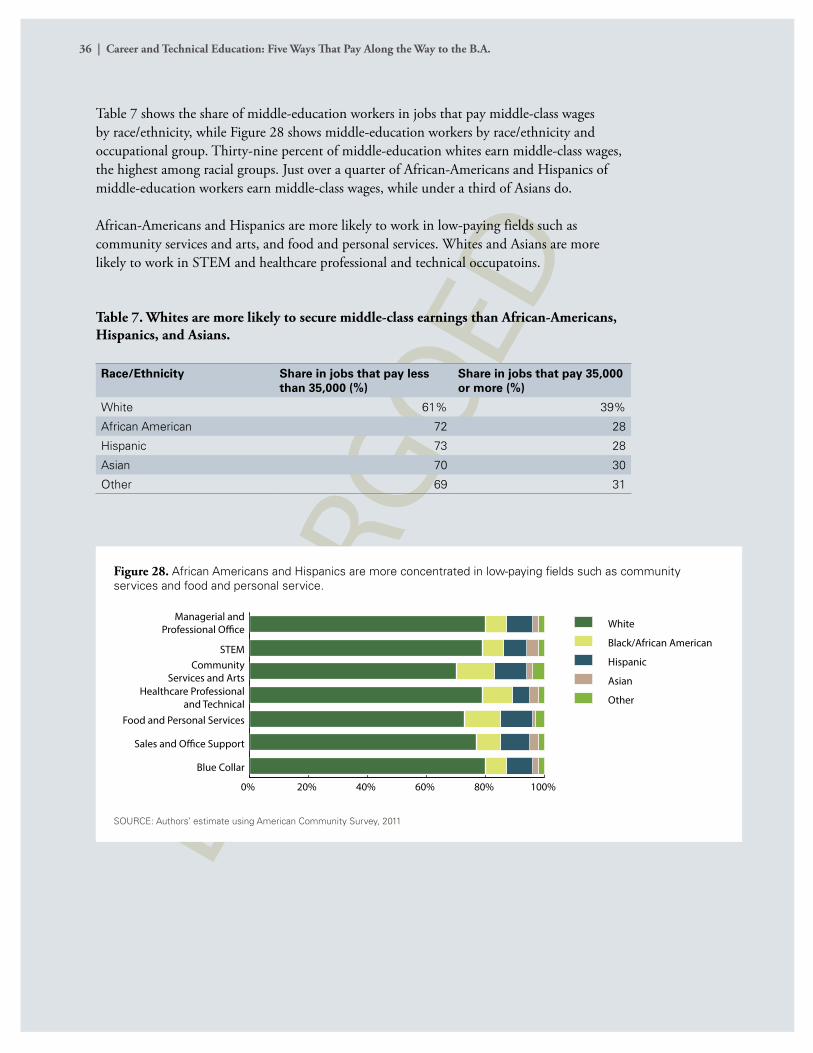
36 | Career and Technical Education: Five Ways That Pay Along the Way to the B.A.
EMBA
RGOED
Table 7 shows the share of middle-education workers in jobs that pay middle-class wages by race/ethnicity, while Figure 28 shows middle-education workers by race/ethnicity and occupational group. Thirty-nine percent of middle-education whites earn middle-class wages, the highest among racial groups. Just over a quarter of African-Americans and Hispanics of middle-education workers earn middle-class wages, while under a third of Asians do.
African-Americans and Hispanics are more likely to work in low-paying fields such as community services and arts, and food and personal services. Whites and Asians are more likely to work in STEM and healthcare professional and technical occupatoins.
Table 7. Whites are more likely to secure middle-class earnings than African-Americans, Hispanics, and Asians.
Race/Ethnicity Share in jobs that pay less than 35,000 (%)
Share in jobs that pay 35,000 or more (%)
White 61% 39%
African American 72 28
Hispanic 73 28
Asian 70 30
Other 69 31
Figure 28. African Americans and Hispanics are more concentrated in low-paying fields such as community services and food and personal service.
SOURCE: Authors’ estimate using American Community Survey, 2011
0% 20% 40% 60% 80% 100%
Blue Collar
Sales and O�ce Support
Food and Personal Services
Healthcare Professionaland Technical
CommunityServices and Arts
STEM
Managerial andProfessional O�ce
Other
Asian
Hispanic
Black/African American
White

Career and Technical Education: Five Ways That Pay Along the Way to the B.A. | 37
EMBA
RGOED
Employer-based training accounts for three out of
every five dollars spent on postsecondary education
and training.

38 | Career and Technical Education: Five Ways That Pay Along the Way to the B.A.
EMBA
RGOED
Career and Technical Education: Five Ways That Pay Along the Way to the B.A. | 39
EMBA
RGOED
Career and Technical Education: Five Ways that Pay Along the Way to the B.A. | 39
Conclusion: Using Transcript Data and Wage Records to Track Career Pathways
The American postsecondary CTE system is unique, flexible, and underutilized. It is the new threshold one must meet for access to a middle-class life. Unlike other countries, the American CTE system provides inroads to further education and college degrees; promotes career mobility as an avenue for lifelong learning; and provides retraining for workers who have seen their jobs shipped overseas or outmoded by technological advancements.
Employers play a crucial role in this system that is often underappreciated and underemphasized. Employer-based training accounts for three out of every five dollars spent on postsecondary education and training. The success of postsecondary CTE relies on the connections and partnerships between public and private institutions that promote workforce preparation: Both are necessary, but neither is sufficient.
The United States faces an enormous task in preparing tomorrow’s workforce that will have dramatic implications for the nation’s future prosperity and ability to compete internationally in the world economy. For 29 million Americans, these jobs represent a ticket to a middle-class life and family-sustaining earnings.
In an environment where budgets are tight, we believe that expanding CTE will mean reallocating resources toward programs that have proven effective and enhancing the productivity and efficiency of the system.
There are two critical policy elements. First, the federal government should invest dollars allocated toward CTE in programs of study that align secondary and postsecondary curriculums, reduce duplication and remediation, allow for dual-enrollment, and create opportunities for students to learn and earn. Second, it should create a Learning & Earning Exchange—an information system that links high school and postsecondary transcript information about courses taken and grades with employer wage records. Such a system would allow all to see how successful various programs are at producing job-ready graduates. As a result, students would make more informed choices about what to study; educators would serve their students better; and employers would have greater success in finding the skilled workers necessary to satisfy their needs. Overall, the postsecondary education system, government, and the American economy would benefit from a more efficient and productive workforce preparation and human capital development system.
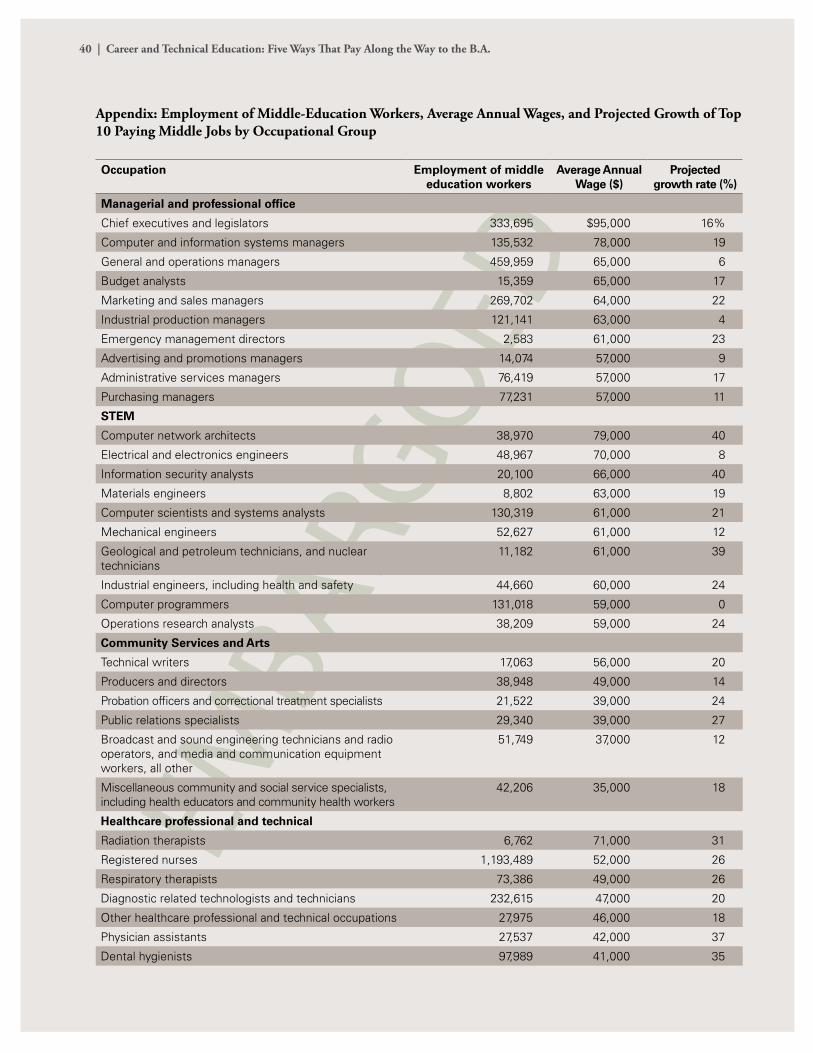
40 | Career and Technical Education: Five Ways That Pay Along the Way to the B.A.
EMBA
RGOED
Appendix: Employment of Middle-Education Workers, Average Annual Wages, and Projected Growth of Top 10 Paying Middle Jobs by Occupational Group
Occupation Employment of middle education workers
Average Annual Wage ($)
Projected growth rate (%)
Managerial and professional office
Chief executives and legislators 333,695 $95,000 16%
Computer and information systems managers 135,532 78,000 19
General and operations managers 459,959 65,000 6
Budget analysts 15,359 65,000 17
Marketing and sales managers 269,702 64,000 22
Industrial production managers 121,141 63,000 4
Emergency management directors 2,583 61,000 23
Advertising and promotions managers 14,074 57,000 9
Administrative services managers 76,419 57,000 17
Purchasing managers 77,231 57,000 11
STEM
Computer network architects 38,970 79,000 40
Electrical and electronics engineers 48,967 70,000 8
Information security analysts 20,100 66,000 40
Materials engineers 8,802 63,000 19
Computer scientists and systems analysts 130,319 61,000 21
Mechanical engineers 52,627 61,000 12
Geological and petroleum technicians, and nuclear technicians
11,182 61,000 39
Industrial engineers, including health and safety 44,660 60,000 24
Computer programmers 131,018 59,000 0
Operations research analysts 38,209 59,000 24
Community Services and Arts
Technical writers 17,063 56,000 20
Producers and directors 38,948 49,000 14
Probation officers and correctional treatment specialists 21,522 39,000 24
Public relations specialists 29,340 39,000 27
Broadcast and sound engineering technicians and radio operators, and media and communication equipment workers, all other
51,749 37,000 12
Miscellaneous community and social service specialists, including health educators and community health workers
42,206 35,000 18
Healthcare professional and technical
Radiation therapists 6,762 71,000 31
Registered nurses 1,193,489 52,000 26
Respiratory therapists 73,386 49,000 26
Diagnostic related technologists and technicians 232,615 47,000 20
Other healthcare professional and technical occupations 27,975 46,000 18
Physician assistants 27,537 42,000 37
Dental hygienists 97,989 41,000 35
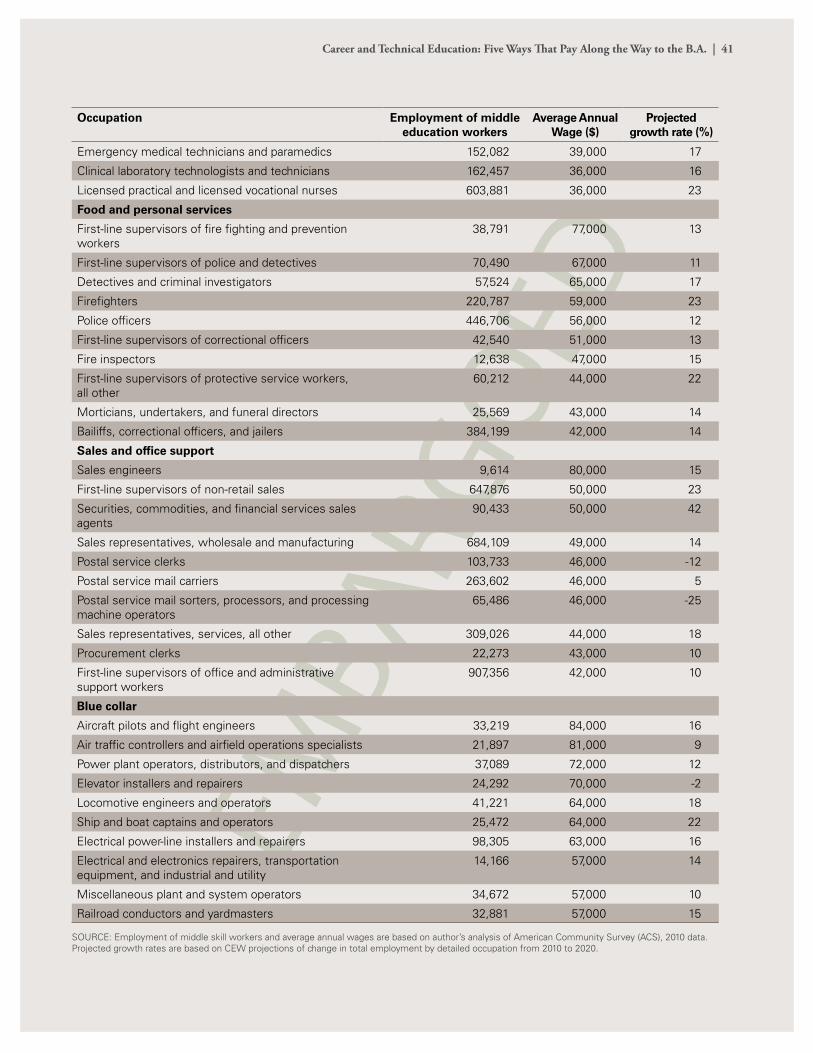
Career and Technical Education: Five Ways That Pay Along the Way to the B.A. | 41
EMBA
RGOED
Occupation Employment of middle education workers
Average Annual Wage ($)
Projected growth rate (%)
Emergency medical technicians and paramedics 152,082 39,000 17
Clinical laboratory technologists and technicians 162,457 36,000 16
Licensed practical and licensed vocational nurses 603,881 36,000 23
Food and personal services
First-line supervisors of fire fighting and prevention workers
38,791 77,000 13
First-line supervisors of police and detectives 70,490 67,000 11
Detectives and criminal investigators 57,524 65,000 17
Firefighters 220,787 59,000 23
Police officers 446,706 56,000 12
First-line supervisors of correctional officers 42,540 51,000 13
Fire inspectors 12,638 47,000 15
First-line supervisors of protective service workers, all other
60,212 44,000 22
Morticians, undertakers, and funeral directors 25,569 43,000 14
Bailiffs, correctional officers, and jailers 384,199 42,000 14
Sales and office support
Sales engineers 9,614 80,000 15
First-line supervisors of non-retail sales 647,876 50,000 23
Securities, commodities, and financial services sales agents
90,433 50,000 42
Sales representatives, wholesale and manufacturing 684,109 49,000 14
Postal service clerks 103,733 46,000 -12
Postal service mail carriers 263,602 46,000 5
Postal service mail sorters, processors, and processing machine operators
65,486 46,000 -25
Sales representatives, services, all other 309,026 44,000 18
Procurement clerks 22,273 43,000 10
First-line supervisors of office and administrative support workers
907,356 42,000 10
Blue collar
Aircraft pilots and flight engineers 33,219 84,000 16
Air traffic controllers and airfield operations specialists 21,897 81,000 9
Power plant operators, distributors, and dispatchers 37,089 72,000 12
Elevator installers and repairers 24,292 70,000 -2
Locomotive engineers and operators 41,221 64,000 18
Ship and boat captains and operators 25,472 64,000 22
Electrical power-line installers and repairers 98,305 63,000 16
Electrical and electronics repairers, transportation equipment, and industrial and utility
14,166 57,000 14
Miscellaneous plant and system operators 34,672 57,000 10
Railroad conductors and yardmasters 32,881 57,000 15
SOURCE: Employment of middle skill workers and average annual wages are based on author’s analysis of American Community Survey (ACS), 2010 data. Projected growth rates are based on CEW projections of change in total employment by detailed occupation from 2010 to 2020.
42 | Career and Technical Education: Five Ways That Pay Along the Way to the B.A.
EMBA
RGOED
References
Altonji, Joseph G. and James R. Spletzer. “Worker Characteristics, Job Characteristics, and the Receipt of On-the-Job Training.” Industrial and Labor Relations Review 45.1 (1991): 58-79.
Bishop, John H. “Is the Market for College Graduates Headed for a Bust? Demand and Supply Responses to Rising College Wage Premiums.” New Bureau of Labor Statistics (BLS), U.S. Department of Labor. Youth Unemployment: An International Perspective 2098 (1981).
Calcagno, Juan Carlos, Peter Crosta, Thomas Bailey, and David Jenkins. Stepping Stones to a Degree: The Impact of Enrollment Pathways and Milestones on Community College Student Outcomes. Community College Research Center. CCRC Working Paper No. 4 (2006).
Carnevale, Anthony P. et al. Career Clusters: Forecasting Demand For High School Through College Jobs. Georgetown University Center on Education and the Workforce. Washington, D.C. (2011). http://cew.georgetown.edu/clusters/.
Carnevale, Anthony P., Stephen J. Rose, and Andrew R. Hanson. Certificates: Gateway to Gainful Employment and College Degrees. Georgetown University Center on Education and the Workforce. Washington, D.C. (2012). http://cew.georgetown.edu/certificates/.
Carnevale, Anthony P., Tamara Jayasundera, and Ban Cheah. The College Advantage: Weathering the Economic Storm. Georgetown University Center on Education and the Workforce. Washington, D.C. (2012). http://cew.georgetown.edu/collegeadvantage/.
Carnevale, Anthony P., Stephen J. Rose, and Ban Cheah. The College Payoff: Education, Occupations, and Lifetime Earnings. Georgetown University Center on Education and the Workforce. Washington, D.C. (2011). http://cew.georgetown.edu/collegepayoff/.
Carnevale, Anthony P. and Jeff Strohl. “How Increasing College Access is Increasing Inequality and What to Do About It.” Rewarding Strivers: Helping Low-Income Students Succeed in College. Century Foundation Press (2010).
Chen, Xianglei and C. Dennis Carroll. “Part Time Undergraduates in Postsecondary Education: 2003-2004.” Postsecondary Education Descriptive Analysis Report. National Center for Education Statistics, U.S. Department of Education (2007). http://nces.ed.gov/pubs2007/2007165.pdf.
Geel, Regula and Uschi Beckes-Gellner. “Earning While Learning: When and How Student Employment is Beneficial.” Labour 26.3 (2012): 313-340.
Goldin, Claudia and Lawrence F. Katz. The Race Between Education and Technology. United States: President and Fellows of Harvard College, 2008.
Gunn, Pahl and Lalith De Silva. Registered Apprenticeship: Findings from Site Visits to Five
Career and Technical Education: Five Ways That Pay Along the Way to the B.A. | 43
EMBA
RGOED
States. Planmatics, Inc. Employment and Training Administration, U.S. Department of Labor (2008). http://www.nawdp.org/Content/NavigationMenu/ResearchReports/2009-2-RegisteredApprenticeship_FindingsfromSiteVisits.pdf.
Hollenbeck, Kevin. State Use of Workforce System Net Impact Estimates and Rates of Return. Presented at the Association for Public Policy Analysis and Management (APPAM) Conference, Los Angeles, Calif. (2008). http://research.upjohn.org/confpapers/1.
Lerman, Robert I. Expanding Apprenticeship: A Way to Enhance Skills and Careers. Urban Institute (2010). http://www.urban.org/publications/901384.html.
Lerman, Robert I. Training Tomorrow’s Workforce: Community College and Apprenticeship as Collaborative Routes to Rewarding Careers. Center for American Progress. (2009). http://www.urban.org/uploadedpdf/1001360_training_tomorrow.pdf.
Lerman, Robert, Lauren Eyster, and Kate Chambers. The Benefits and Challenges of Registered Apprenticeship: The Sponsors’ Perspective. Urban Institute. (2009). http://www.urban.org/publications/411907.html
Loewenstein, Mark A., and James R. Spletzer. “Dividing the Costs and Returns to General Training.” Journal of Labor Economics 16.1 (1998): 142–71.
Manacapilli, Thomas. Finding the Balance Between Schoolhouse and On-The-Job Training. Rand Corporation. (2007).
Mincer, Jacob. “Job Training, Wage Growth, and Labor Turnover.” NBER Working Paper 2690. Cambridge, Mass.: National Bureau of Economic Research, 1988.
OECD. “Better Education and Training to Improve the Transition to Work.” In Off to a Good Start? Jobs for Youth. (2010). http://www.oecd-ilibrary.org/employment/off-to-a-good-start-jobs-for-youth_9789264096127-en.
Office of Apprenticeship. Available Occupations. Employment and Training Administration (ETA), U.S. Department of Labor. (updated July 24, 2012). http://www.doleta.gov/OA/occupations.cfm.
Office of Apprenticeship. Data and Statistics. Employment and Training Administration (ETA), U.S. Department of Labor. (updated July 11, 2012). http://www.doleta.gov/OA/data_statistics.cfm.
Office of Apprenticeship. Employers. Employment and Training Administration (ETA), U.S. Department of Labor. (updated July 24, 2012). http://www.doleta.gov/OA/employer.cfm.
Office of Apprenticeship. What is Registered Apprenticeship? Employment and Training

44 | Career and Technical Education: Five Ways That Pay Along the Way to the B.A.
EMBA
RGOED
Administration (ETA), U.S. Department of Labor. (updated July 18, 2012). http://www.doleta.gov/OA/apprenticeship.cfm.
Steedman, Hilary. The State of Apprenticeship in 2010: International Comparisons – Australia, Austria, England, France, Germany, Ireland, Sweden, Switzerland. London School of Economics and Political Science. (2010). http://cep.lse.ac.uk/pubs/download/special/cepsp22.pdf .
Steigleder, Stephen and Louis Soares. Let’s Get Serious About Our Nation’s Human Capital: A Plan to Reform the U.S. Workforce Training System. Center for American Progress. 2012.
U.S. Bureau of Labor Statistics and U.S. Census Bureau. Current Population Survey (CPS). 1970-2012.
U.S. Department of Education, Institute of Education Sciences, National Center for Education Statistics. Digest of Education Statistics: 2011 (2011). http://nces.ed.gov/pubsearch/pubsinfo.asp?pubid-2006084
Wilcox, Dave. “The Role of Industry-Based Certifications in Career and Technical Education.” Techniques: Connecting Education and Careers 81.1 (2006): 21-23.

Career and Technical Education: Five Ways That Pay Along the Way to the B.A. | 45
EMBA
RGOED

46 | Career and Technical Education: Five Ways That Pay Along the Way to the B.A.
EMBA
RGOED

Career and Technical Education: Five Ways That Pay Along the Way to the B.A. | 47
EMBA
RGOED

EMBA
RGOED

Career and Technical Education: Five Ways That Pay Along the Way to the B.A. comprises a full report and an executive summary.
Both can be accessed online at cew.georgetown.edu/ctefiveways.
3300 Whitehaven Street NW, Suite 5000
Washington, DC 20007cew.georgetown.edu