cardiac mri based numerical modeling of left …. su et al_j biomechanics.pdf · cardiac mri based...
TRANSCRIPT
Journal of Biomechanics ∎ (∎∎∎∎) ∎∎∎–∎∎∎
Contents lists available at ScienceDirect
journal homepage: www.elsevier.com/locate/jbiomech
Journal of Biomechanics
http://d0021-92
n Corr169609,
E-m
Pleasincor
www.JBiomech.com
Cardiac MRI based numerical modeling of left ventricular fluiddynamics with mitral valve incorporated
Boyang Su a, Ru San Tan a,b, Ju Le Tan a, Kenneth Wei Qiang Guo a, Jun Mei Zhang a,b,Shuang Leng a, Xiaodan Zhao a, John Carson Allen b, Liang Zhong a,b,n
a National Heart Centre Singapore, 5 Hospital Drive, 169609, Singaporeb Duke-NUS Graduate Medical School Singapore, Singapore
a r t i c l e i n f o
Article history:
Accepted 3 March 2016Recent numerical studies were focused on the modeling of flow in patient-specific left ventricle (LV);however, the mitral valve (MV) was usually excluded. In this study, both patient-specific LV and MV were
Keywords:Computational fluid dynamicsBileaflet mitral valveVortex formationPatient-specific
x.doi.org/10.1016/j.jbiomech.2016.03.00890/& 2016 Published by Elsevier Ltd.
esponding author at: National Heart CentreSingapore. Tel.: þ65 67042237; fax: þ65 622ail address: [email protected] (L. Zhon
e cite this article as: Su, B., et al., Cporated. Journal of Biomechanics (2
a b s t r a c t
modeled to achieve a more realistic intraventricular flow. Cardiac MRI images were acquired from apulmonary arterial hypertension (PAH) patient and a healthy volunteer, and manual segmentation wasconducted to reconstruct three-dimensional (3D) LV and MV geometries at each frame. Based on these3D geometries, vortex formation time (VFT) was derived, and the values were 4.0 and 6.5 for the normalsubject and the PAH patient, respectively. Based on studies in the literature, VTF in the healthy subject fellwithin the normal range, while that in the PAH patient exceeded the threshold for normality. The vortexstructures in the LV clearly showed that the vortex ring was initiated from the tips of the MV instead ofthe mitral annulus. The excessive VFT during the rapid filling phase in the PAH patient resulted in atrailing flow structure behind the primary vortex ring, which was not observed in the normal subject. Itcan be deduced from this study that incorporating the MV into a patient-specific model is necessary toproduce more reasonable VFT and intraventricular flow.
& 2016 Published by Elsevier Ltd.
1. Introduction
Despite numerous studies of blood flow in the left ventricle(LV) (Pedrizzetti and Domenichini, 2014), the association betweenthe LV flow structure and the cardiac remodeling is still not wellunderstood. Various approaches have been applied to visualize theflow structure in the LV such as echocardiography and cardiacmagnetic resonance (CMR) (Charonko et al., 2013; Garcia et al.,2010; Rodriguez Muñoz et al., 2013). Besides in-vivo studies,extensive in-vitro studies have been conducted to measure theintraventricular flow using a heart simulator (Falahatpisheh andKheradvar, 2012; Kheradvar and Gharib, 2007). Owing to the dif-ficulties in mimicking a native heart ventricle, the primary pur-pose of in-vitro studies is to understand the fluid dynamics in anidealized heart ventricle. Computational fluid dynamics (CFD) inconjunction with CMR is emerging as an alternative tool to furtherfacilitate the visualization of patient-specific LV flow, as it is cap-able of providing a more detailed flow structure with much higher
Singapore, 5 Hospital Drive,30972.g).
ardiac MRI based numerica016), http://dx.doi.org/10.10
resolutions (Chnafa et al., 2014; Mangual et al., 2013; Saber et al.,2003; Schenkel et al., 2009; Su et al., 2014a).
As an asymmetric bileaflet mitral valve (MV) is located at theinflow tract of the LV, it has been shown that incorporation of theMV into the numerical model will give more realistic flow fieldpredictions (Domenichini and Pedrizzetti, 2014; Seo et al., 2014;Votta et al., 2013). However, the MV was only modeled in verylimited numerical simulations, due to the difficulties in recon-structing and modeling the dynamic MV. In the studies focusingon the mitral leaflets, the MV was scanned using real-time 3Dtransesophageal echocardiography (TEE) (Chandran and Kim,2014). To obtain better accuracy such as papillary muscles andchordae, CMR was also adopted to scan a number of evenly rotatedlong-axis planes (Dimasi et al., 2012; Stevanella et al., 2011). It isworth noting that this method was not routinely used in clinicalCMR imaging. A few studies used high spatial resolution of Com-puted Tomography (CT) images to reconstruct the MV and LV tostudy the intraventricular flow (Chnafa et al., 2014, 2012). Its usageis limited by the complications of ionizing radiation and relativelylow temporal resolution. Routine clinical CMR scanning (i.e. two-chamber, three-chamber, four-chamber and short-axis planes) isable to provide adequate information to reconstruct a patient-specific LV. Nevertheless, it is difficult to segment mitral leaflet in
l modeling of left ventricular fluid dynamics with mitral valve16/j.jbiomech.2016.03.008i
B. Su et al. / Journal of Biomechanics ∎ (∎∎∎∎) ∎∎∎–∎∎∎2
all views, and a generic one defined by mathematical equations isa feasible approach (Domenichini and Pedrizzetti, 2014).
In the literature, most LV numerical simulations focused onunderstanding the LV fluid dynamics in normal subjects, whilelimited studies modeled the patient-specific LVs with heart failure,dilated cardiomyopathy, and hypertrophic cardiomyopathy (Kha-lafvand et al., 2014; Mangual et al., 2013; Su et al., 2014a). Thesestudies have demonstrated that the structure of vortices is differ-ent in normal cases compared to patient cases. To the best of ourknowledge, no numerical study of LV flow has been conducted inpulmonary arterial hypertension (PAH) patients. In addition, thesepatient-specific studies ignored the influence of MV, whichimpaired the reliability of the numerical results to a certain extent.In this study, CMR images acquired from a normal subject and aPAH patient were selected for MV and LV reconstructions and thefollowing numerical simulations. Geometrical parameters (e.g.ventricular volume and vortex formation time (VFT)) and thedetailed fluid structures in these two models were analyzed toobserve the impact of PAH. In addition, the study outlined a fra-mework for more realistic LV flow based CMR images.
2. Methods
2.1. Data acquisition
One healthy volunteer and one PAH patient were recruited in thisstudy, and CMR scans were carried out on a Philips 3.0 T system
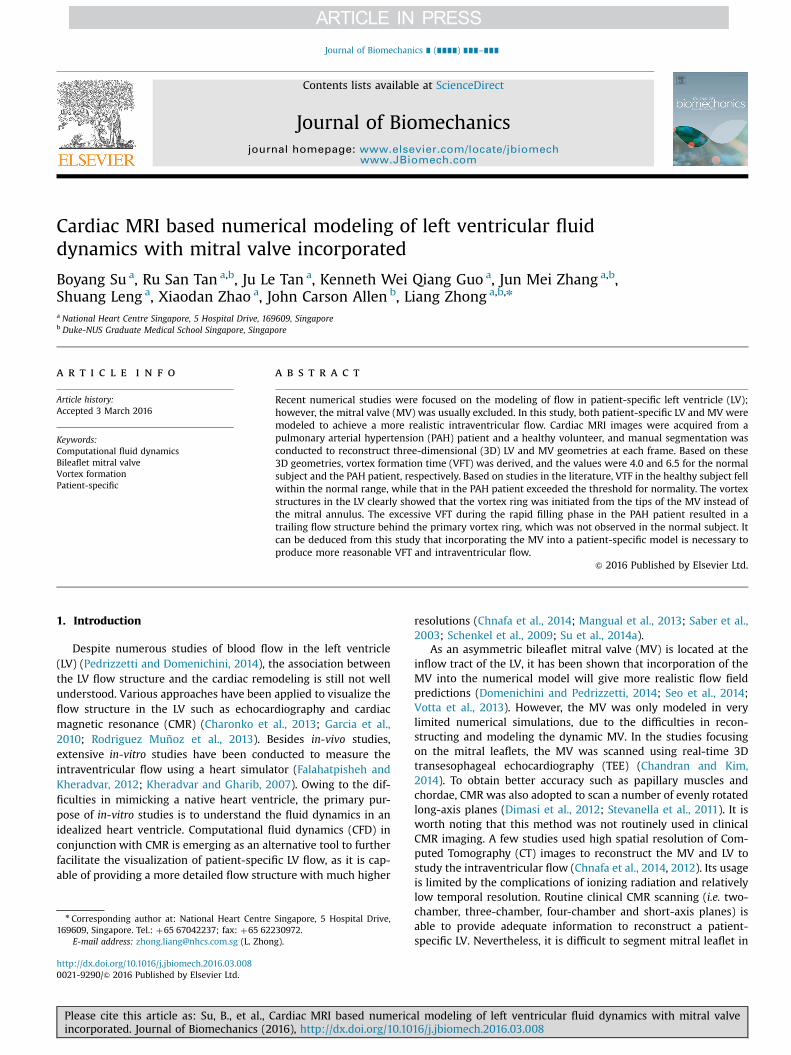
Fig. 1. CMR images: (A) two-chamber view, (B) three-chamb
Please cite this article as: Su, B., et al., Cardiac MRI based numericincorporated. Journal of Biomechanics (2016), http://dx.doi.org/10.10
(Ingenia, Philips Healthcare, Netherlands) with a dStream Torso coil(maximum number of channels 32). BTFE end-expiratory breath holdcine images were acquired in multi-planar views (namely two-chamber, three-chamber, four-chamber, short-axis views as indicatedin Fig. 1). Electrocardiographically (ECG) gated consecutive cineshort-axis images were acquired from apex to mid-atrium (8 mmslice thickness with 2 mm interslice gap). The acquisition included12–14 short-axis slices covering the entire LV and partial aorta andatrium. Note that the acquisition rates of long-axis and short-axisimages were 40 and 30 frames per cardiac cycle, respectively.
2.2. Geometry reconstruction
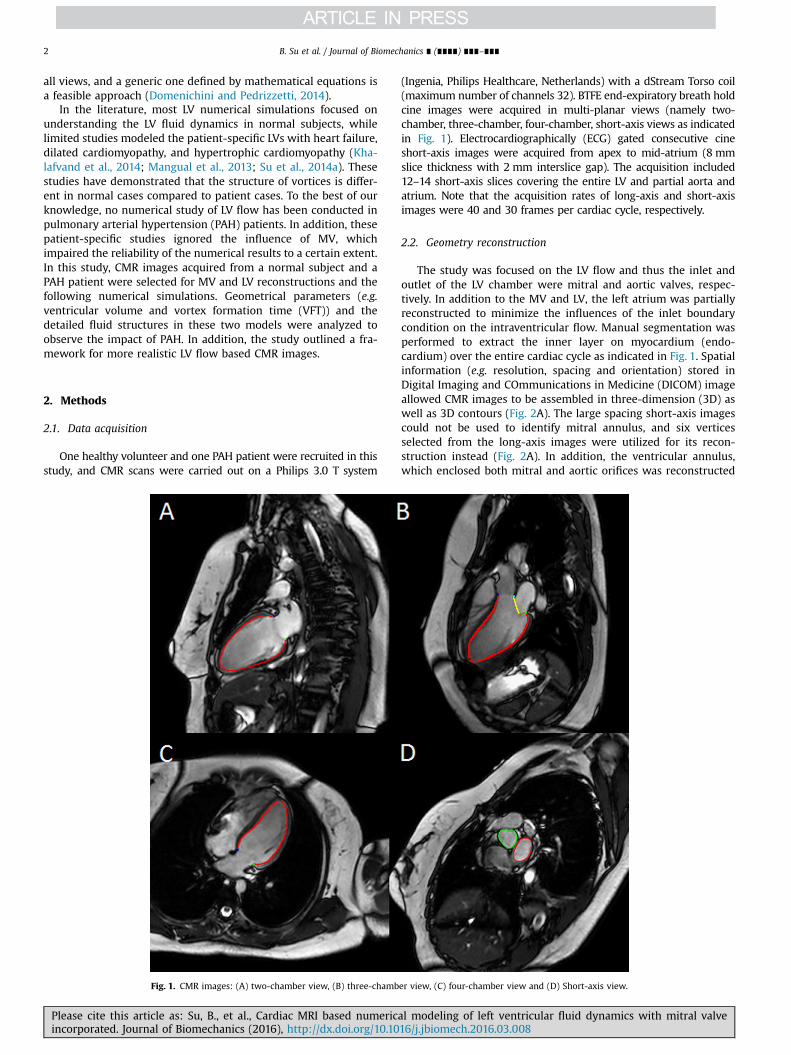
The study was focused on the LV flow and thus the inlet andoutlet of the LV chamber were mitral and aortic valves, respec-tively. In addition to the MV and LV, the left atrium was partiallyreconstructed to minimize the influences of the inlet boundarycondition on the intraventricular flow. Manual segmentation wasperformed to extract the inner layer on myocardium (endo-cardium) over the entire cardiac cycle as indicated in Fig. 1. Spatialinformation (e.g. resolution, spacing and orientation) stored inDigital Imaging and COmmunications in Medicine (DICOM) imageallowed CMR images to be assembled in three-dimension (3D) aswell as 3D contours (Fig. 2A). The large spacing short-axis imagescould not be used to identify mitral annulus, and six verticesselected from the long-axis images were utilized for its recon-struction instead (Fig. 2A). In addition, the ventricular annulus,which enclosed both mitral and aortic orifices was reconstructed
er view, (C) four-chamber view and (D) Short-axis view.
al modeling of left ventricular fluid dynamics with mitral valve16/j.jbiomech.2016.03.008i
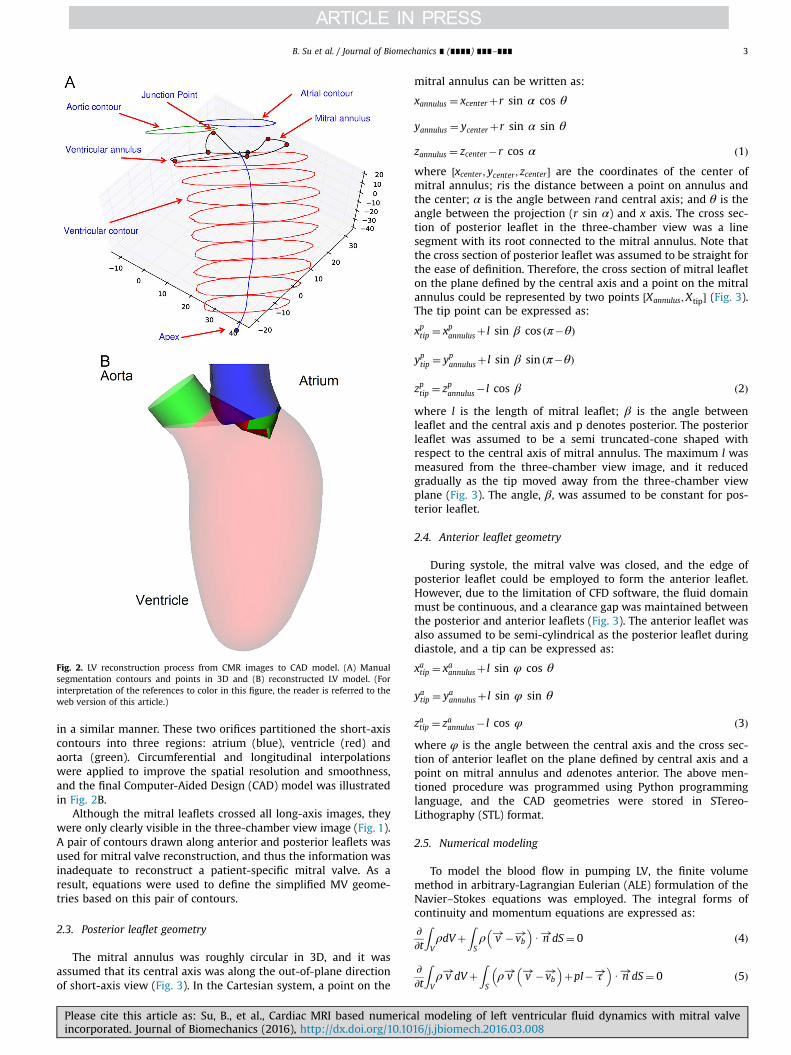
Fig. 2. LV reconstruction process from CMR images to CAD model. (A) Manualsegmentation contours and points in 3D and (B) reconstructed LV model. (Forinterpretation of the references to color in this figure, the reader is referred to theweb version of this article.)
B. Su et al. / Journal of Biomechanics ∎ (∎∎∎∎) ∎∎∎–∎∎∎ 3
in a similar manner. These two orifices partitioned the short-axiscontours into three regions: atrium (blue), ventricle (red) andaorta (green). Circumferential and longitudinal interpolationswere applied to improve the spatial resolution and smoothness,and the final Computer-Aided Design (CAD) model was illustratedin Fig. 2B.
Although the mitral leaflets crossed all long-axis images, theywere only clearly visible in the three-chamber view image (Fig. 1).A pair of contours drawn along anterior and posterior leaflets wasused for mitral valve reconstruction, and thus the information wasinadequate to reconstruct a patient-specific mitral valve. As aresult, equations were used to define the simplified MV geome-tries based on this pair of contours.
2.3. Posterior leaflet geometry
The mitral annulus was roughly circular in 3D, and it wasassumed that its central axis was along the out-of-plane directionof short-axis view (Fig. 3). In the Cartesian system, a point on the
Please cite this article as: Su, B., et al., Cardiac MRI based numericaincorporated. Journal of Biomechanics (2016), http://dx.doi.org/10.10
mitral annulus can be written as:
xannulus ¼ xcenterþr sin α cos θ
yannulus ¼ ycenterþr sin α sin θ
zannulus ¼ zcenter�r cos α ð1Þwhere ½xcenter ; ycenter ; zcenter � are the coordinates of the center ofmitral annulus; ris the distance between a point on annulus andthe center; α is the angle between rand central axis; and θ is theangle between the projection (r sin α) and x axis. The cross sec-tion of posterior leaflet in the three-chamber view was a linesegment with its root connected to the mitral annulus. Note thatthe cross section of posterior leaflet was assumed to be straight forthe ease of definition. Therefore, the cross section of mitral leafleton the plane defined by the central axis and a point on the mitralannulus could be represented by two points ½Xannulus;Xtip� (Fig. 3).The tip point can be expressed as:
xptip ¼ xpannulusþ l sin β cos ðπ�θÞ
yptip ¼ ypannulusþ l sin β sin ðπ�θÞ
zptip ¼ zpannulus� l cos β ð2Þ
where l is the length of mitral leaflet; β is the angle betweenleaflet and the central axis and p denotes posterior. The posteriorleaflet was assumed to be a semi truncated-cone shaped withrespect to the central axis of mitral annulus. The maximum l wasmeasured from the three-chamber view image, and it reducedgradually as the tip moved away from the three-chamber viewplane (Fig. 3). The angle, β, was assumed to be constant for pos-terior leaflet.
2.4. Anterior leaflet geometry
During systole, the mitral valve was closed, and the edge ofposterior leaflet could be employed to form the anterior leaflet.However, due to the limitation of CFD software, the fluid domainmust be continuous, and a clearance gap was maintained betweenthe posterior and anterior leaflets (Fig. 3). The anterior leaflet wasalso assumed to be semi-cylindrical as the posterior leaflet duringdiastole, and a tip can be expressed as:
xatip ¼ xaannulusþ l sin φ cos θ
yatip ¼ yaannulusþ l sin φ sin θ
zatip ¼ zaannulus� l cos φ ð3Þ
where φ is the angle between the central axis and the cross sec-tion of anterior leaflet on the plane defined by central axis and apoint on mitral annulus and adenotes anterior. The above men-tioned procedure was programmed using Python programminglanguage, and the CAD geometries were stored in STereo-Lithography (STL) format.
2.5. Numerical modeling
To model the blood flow in pumping LV, the finite volumemethod in arbitrary-Lagrangian Eulerian (ALE) formulation of theNavier–Stokes equations was employed. The integral forms ofcontinuity and momentum equations are expressed as:
∂∂t
ZVρdVþ
ZSρ v!�vb
!� �U n!dS¼ 0 ð4Þ
∂∂t
ZVρ v!dVþ
ZSρ v! v!�vb
!� �þpI� τ!
� �U n!dS¼ 0 ð5Þ
l modeling of left ventricular fluid dynamics with mitral valve16/j.jbiomech.2016.03.008i
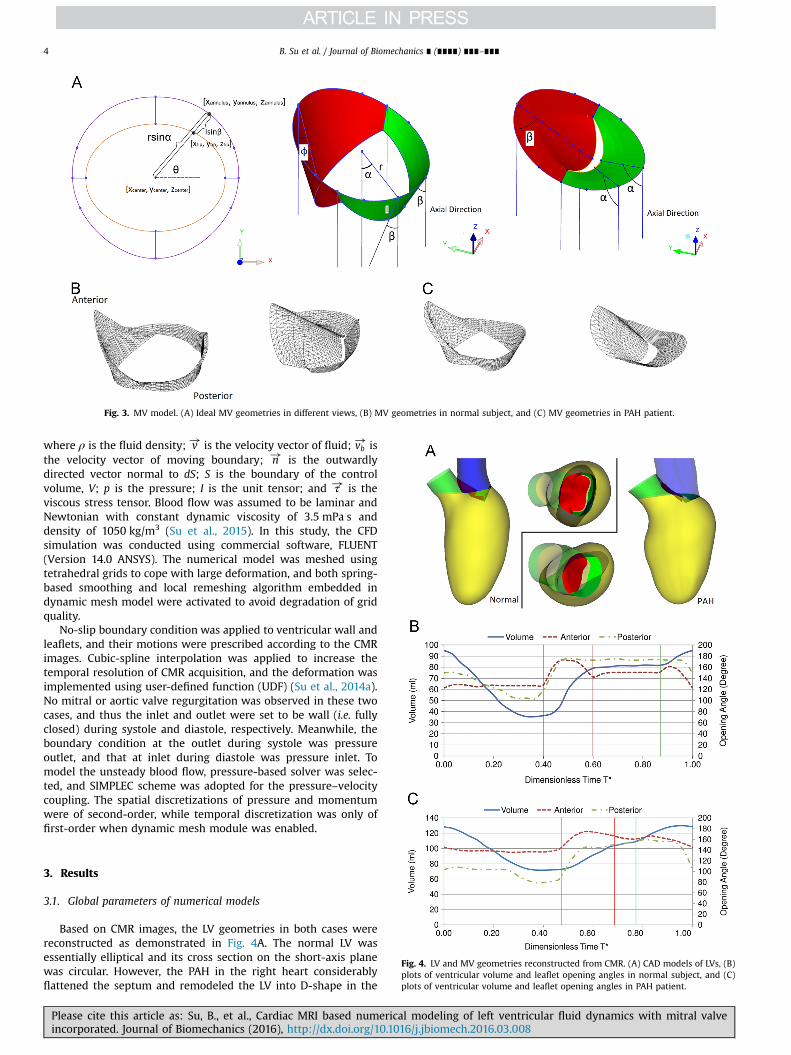
Fig. 3. MV model. (A) Ideal MV geometries in different views, (B) MV geometries in normal subject, and (C) MV geometries in PAH patient.
B. Su et al. / Journal of Biomechanics ∎ (∎∎∎∎) ∎∎∎–∎∎∎4
where ρ is the fluid density; v! is the velocity vector of fluid; vb! is
the velocity vector of moving boundary; n! is the outwardlydirected vector normal to dS; S is the boundary of the controlvolume, V; p is the pressure; I is the unit tensor; and τ! is theviscous stress tensor. Blood flow was assumed to be laminar andNewtonian with constant dynamic viscosity of 3.5 mPa s anddensity of 1050 kg/m3 (Su et al., 2015). In this study, the CFDsimulation was conducted using commercial software, FLUENT(Version 14.0 ANSYS). The numerical model was meshed usingtetrahedral grids to cope with large deformation, and both spring-based smoothing and local remeshing algorithm embedded indynamic mesh model were activated to avoid degradation of gridquality.
No-slip boundary condition was applied to ventricular wall andleaflets, and their motions were prescribed according to the CMRimages. Cubic-spline interpolation was applied to increase thetemporal resolution of CMR acquisition, and the deformation wasimplemented using user-defined function (UDF) (Su et al., 2014a).No mitral or aortic valve regurgitation was observed in these twocases, and thus the inlet and outlet were set to be wall (i.e. fullyclosed) during systole and diastole, respectively. Meanwhile, theboundary condition at the outlet during systole was pressureoutlet, and that at inlet during diastole was pressure inlet. Tomodel the unsteady blood flow, pressure-based solver was selec-ted, and SIMPLEC scheme was adopted for the pressure–velocitycoupling. The spatial discretizations of pressure and momentumwere of second-order, while temporal discretization was only offirst-order when dynamic mesh module was enabled.
Fig. 4. LV and MV geometries reconstructed from CMR. (A) CAD models of LVs, (B)plots of ventricular volume and leaflet opening angles in normal subject, and (C)plots of ventricular volume and leaflet opening angles in PAH patient.
3. Results
3.1. Global parameters of numerical models
Based on CMR images, the LV geometries in both cases werereconstructed as demonstrated in Fig. 4A. The normal LV wasessentially elliptical and its cross section on the short-axis planewas circular. However, the PAH in the right heart considerablyflattened the septum and remodeled the LV into D-shape in the
Please cite this article as: Su, B., et al., Cardiac MRI based numerical modeling of left ventricular fluid dynamics with mitral valveincorporated. Journal of Biomechanics (2016), http://dx.doi.org/10.1016/j.jbiomech.2016.03.008i
B. Su et al. / Journal of Biomechanics ∎ (∎∎∎∎) ∎∎∎–∎∎∎ 5
short-axis view. The saddle-shaped mitral annulus tilted towardsthe septum, and the presence of asymmetric bileaflet mitral valverectified the opening direction toward the apex regardless of theLV geometry. Based on the end-diastolic volume (EDV) and theend-systolic volume (ESV), the ejection fraction (EF¼1�ESV/EDV)of the normal subject was 61.6%, and the systolic duration was 40%of the cardiac cycle. The PAH patient had a lower EF of 43.6% and alonger systolic duration of 46.6%. The diastasis duration in thenormal subject was 26.7%, whereas that in the PAH patient wasonly 10%. In addition, the atrial contraction contributed to 23.2% ofthe stroke volume in the normal subject, while it was 35.2% in thePAH patient. Based on the definition of vortex formation time(VFT) (Gharib et al., 1998), which is a dimensionless parameter toquantify the duration of mitral jet into the LV, the values in normalsubject and PAH patient were 4.0 and 6.5, respectively. Note thatthe normal VFT varies from 3.5 to 5.5 (Kheradvar et al., 2012). Theparameters are listed in Table 1 for the ease of comparison.
Fig. 4B and C shows the LV volumetric variation and bothanterior and posterior leaflet angles extracted. Although the car-diac cycle can be divided into a number of phases, it was simplyclassified into two phases: diastole and systole, according to thestatus of mitral valve. As shown in Fig. 4, these two phases areseparated by a vertical line, where both leaflets start openingrapidly. As only the vortex structure developed during diastole wasconcerned in this study, the diastole was further divided into threesub-phases: rapid filling, diastasis and atrial contraction, based onthe characteristics of volumetric variation curve. Although thesethree sub-phases could only be clearly identified in the normalsubject (Fig. 4B), they were also applied to the PAH patient for theease of comparison (Fig. 4C). Because no valvular diseases werepresent in both cases, the mitral valve opened rapidly at the onsetof diastole. Based on the variation of opening angle of anteriorleaflet, the partial closure phenomenon was present in the dia-stole. Near the end of diastole, the leaflets closed sharply. Althoughthe mitral valve was fully closed without regurgitation duringsystolic phase, the opening angles were still varying, owing to thechange of pressure difference between LV and atrium and themotion of mitral annulus.
Table 1Parameters obtained from LV and MV geometries. EDV: End of Diastolic Volume;ESV: End of Systolic Volume; SV: Stroke Volume; EF: Ejection Fraction; ACV: AtrialContraction Volume; DD: Duration of Diastasis; VFT: Vortex Formation Time.
Subject EDV ESV SV EF ACV DD VFTml ml ml % % %
Normal 95.1 36.5 58.6 61.6 23.2 26.7 4.0PAH 128.4 72.4 56.0 43.6 35.2 10.0 6.5
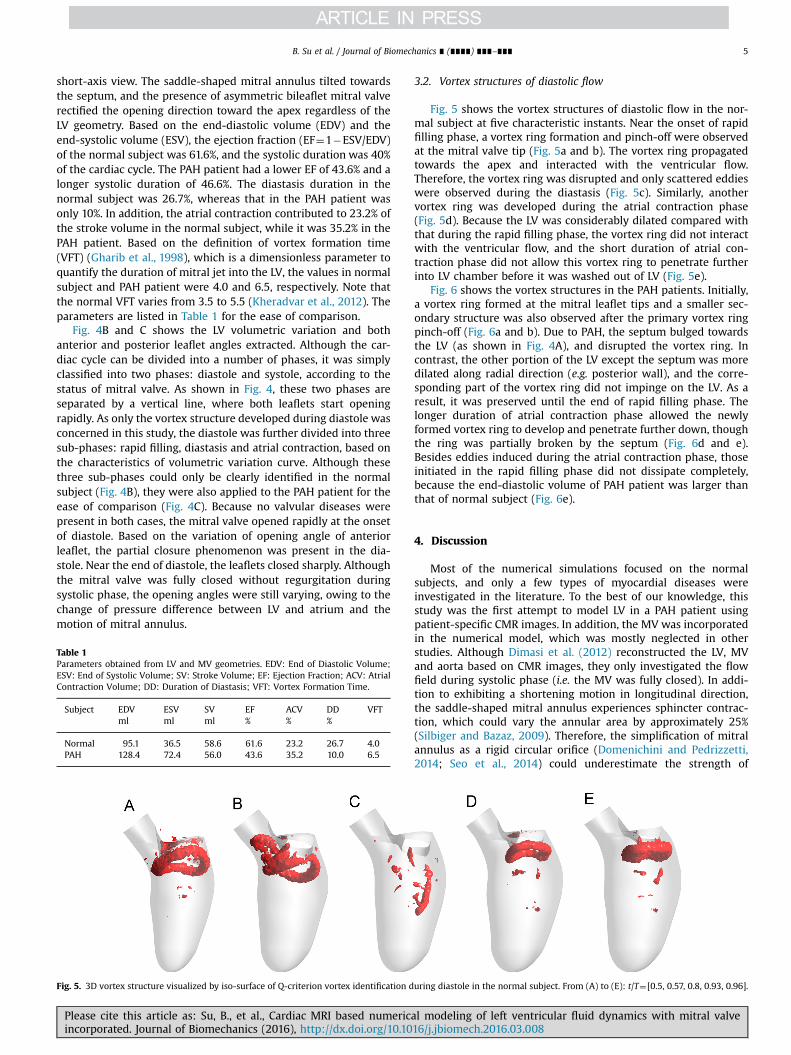
Fig. 5. 3D vortex structure visualized by iso-surface of Q-criterion vortex identification d
Please cite this article as: Su, B., et al., Cardiac MRI based numericaincorporated. Journal of Biomechanics (2016), http://dx.doi.org/10.10
3.2. Vortex structures of diastolic flow
Fig. 5 shows the vortex structures of diastolic flow in the nor-mal subject at five characteristic instants. Near the onset of rapidfilling phase, a vortex ring formation and pinch-off were observedat the mitral valve tip (Fig. 5a and b). The vortex ring propagatedtowards the apex and interacted with the ventricular flow.Therefore, the vortex ring was disrupted and only scattered eddieswere observed during the diastasis (Fig. 5c). Similarly, anothervortex ring was developed during the atrial contraction phase(Fig. 5d). Because the LV was considerably dilated compared withthat during the rapid filling phase, the vortex ring did not interactwith the ventricular flow, and the short duration of atrial con-traction phase did not allow this vortex ring to penetrate furtherinto LV chamber before it was washed out of LV (Fig. 5e).
Fig. 6 shows the vortex structures in the PAH patients. Initially,a vortex ring formed at the mitral leaflet tips and a smaller sec-ondary structure was also observed after the primary vortex ringpinch-off (Fig. 6a and b). Due to PAH, the septum bulged towardsthe LV (as shown in Fig. 4A), and disrupted the vortex ring. Incontrast, the other portion of the LV except the septum was moredilated along radial direction (e.g. posterior wall), and the corre-sponding part of the vortex ring did not impinge on the LV. As aresult, it was preserved until the end of rapid filling phase. Thelonger duration of atrial contraction phase allowed the newlyformed vortex ring to develop and penetrate further down, thoughthe ring was partially broken by the septum (Fig. 6d and e).Besides eddies induced during the atrial contraction phase, thoseinitiated in the rapid filling phase did not dissipate completely,because the end-diastolic volume of PAH patient was larger thanthat of normal subject (Fig. 6e).
4. Discussion
Most of the numerical simulations focused on the normalsubjects, and only a few types of myocardial diseases wereinvestigated in the literature. To the best of our knowledge, thisstudy was the first attempt to model LV in a PAH patient usingpatient-specific CMR images. In addition, the MV was incorporatedin the numerical model, which was mostly neglected in otherstudies. Although Dimasi et al. (2012) reconstructed the LV, MVand aorta based on CMR images, they only investigated the flowfield during systolic phase (i.e. the MV was fully closed). In addi-tion to exhibiting a shortening motion in longitudinal direction,the saddle-shaped mitral annulus experiences sphincter contrac-tion, which could vary the annular area by approximately 25%(Silbiger and Bazaz, 2009). Therefore, the simplification of mitralannulus as a rigid circular orifice (Domenichini and Pedrizzetti,2014; Seo et al., 2014) could underestimate the strength of
uring diastole in the normal subject. From (A) to (E): t/T¼[0.5, 0.57, 0.8, 0.93, 0.96].
l modeling of left ventricular fluid dynamics with mitral valve16/j.jbiomech.2016.03.008i
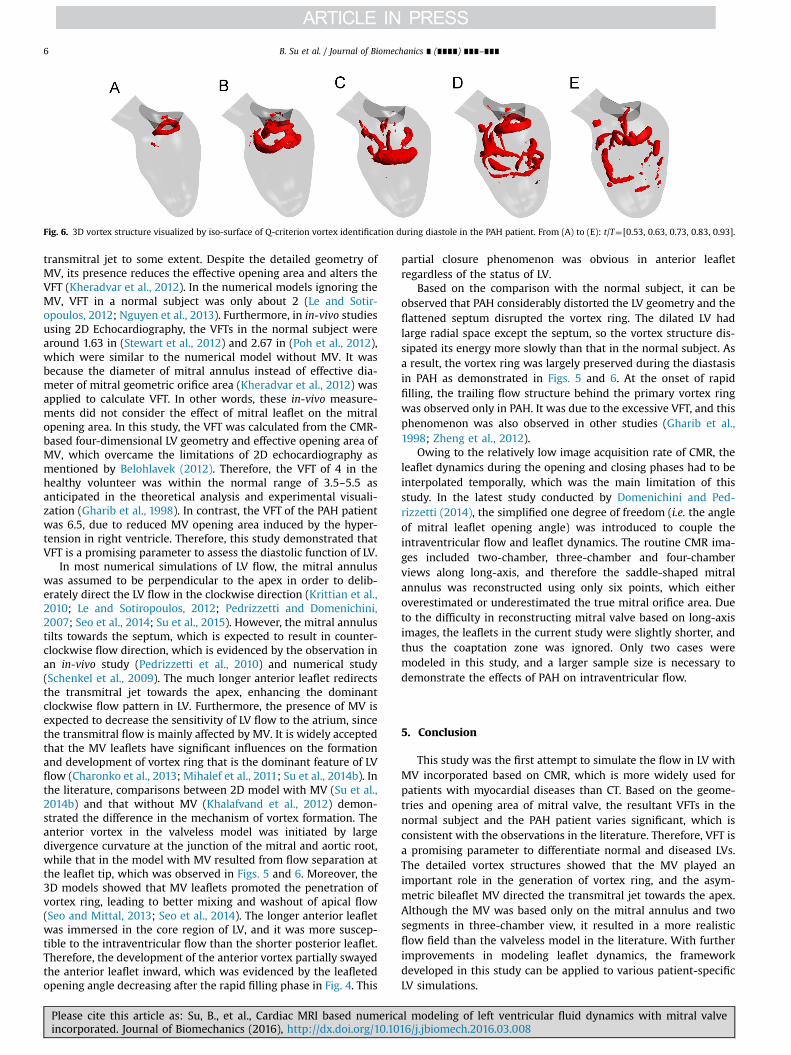
Fig. 6. 3D vortex structure visualized by iso-surface of Q-criterion vortex identification during diastole in the PAH patient. From (A) to (E): t/T¼[0.53, 0.63, 0.73, 0.83, 0.93].
B. Su et al. / Journal of Biomechanics ∎ (∎∎∎∎) ∎∎∎–∎∎∎6
transmitral jet to some extent. Despite the detailed geometry ofMV, its presence reduces the effective opening area and alters theVFT (Kheradvar et al., 2012). In the numerical models ignoring theMV, VFT in a normal subject was only about 2 (Le and Sotir-opoulos, 2012; Nguyen et al., 2013). Furthermore, in in-vivo studiesusing 2D Echocardiography, the VFTs in the normal subject werearound 1.63 in (Stewart et al., 2012) and 2.67 in (Poh et al., 2012),which were similar to the numerical model without MV. It wasbecause the diameter of mitral annulus instead of effective dia-meter of mitral geometric orifice area (Kheradvar et al., 2012) wasapplied to calculate VFT. In other words, these in-vivo measure-ments did not consider the effect of mitral leaflet on the mitralopening area. In this study, the VFT was calculated from the CMR-based four-dimensional LV geometry and effective opening area ofMV, which overcame the limitations of 2D echocardiography asmentioned by Belohlavek (2012). Therefore, the VFT of 4 in thehealthy volunteer was within the normal range of 3.5–5.5 asanticipated in the theoretical analysis and experimental visuali-zation (Gharib et al., 1998). In contrast, the VFT of the PAH patientwas 6.5, due to reduced MV opening area induced by the hyper-tension in right ventricle. Therefore, this study demonstrated thatVFT is a promising parameter to assess the diastolic function of LV.
In most numerical simulations of LV flow, the mitral annuluswas assumed to be perpendicular to the apex in order to delib-erately direct the LV flow in the clockwise direction (Krittian et al.,2010; Le and Sotiropoulos, 2012; Pedrizzetti and Domenichini,2007; Seo et al., 2014; Su et al., 2015). However, the mitral annulustilts towards the septum, which is expected to result in counter-clockwise flow direction, which is evidenced by the observation inan in-vivo study (Pedrizzetti et al., 2010) and numerical study(Schenkel et al., 2009). The much longer anterior leaflet redirectsthe transmitral jet towards the apex, enhancing the dominantclockwise flow pattern in LV. Furthermore, the presence of MV isexpected to decrease the sensitivity of LV flow to the atrium, sincethe transmitral flow is mainly affected by MV. It is widely acceptedthat the MV leaflets have significant influences on the formationand development of vortex ring that is the dominant feature of LVflow (Charonko et al., 2013; Mihalef et al., 2011; Su et al., 2014b). Inthe literature, comparisons between 2D model with MV (Su et al.,2014b) and that without MV (Khalafvand et al., 2012) demon-strated the difference in the mechanism of vortex formation. Theanterior vortex in the valveless model was initiated by largedivergence curvature at the junction of the mitral and aortic root,while that in the model with MV resulted from flow separation atthe leaflet tip, which was observed in Figs. 5 and 6. Moreover, the3D models showed that MV leaflets promoted the penetration ofvortex ring, leading to better mixing and washout of apical flow(Seo and Mittal, 2013; Seo et al., 2014). The longer anterior leafletwas immersed in the core region of LV, and it was more suscep-tible to the intraventricular flow than the shorter posterior leaflet.Therefore, the development of the anterior vortex partially swayedthe anterior leaflet inward, which was evidenced by the leafletedopening angle decreasing after the rapid filling phase in Fig. 4. This
Please cite this article as: Su, B., et al., Cardiac MRI based numericincorporated. Journal of Biomechanics (2016), http://dx.doi.org/10.10
partial closure phenomenon was obvious in anterior leafletregardless of the status of LV.
Based on the comparison with the normal subject, it can beobserved that PAH considerably distorted the LV geometry and theflattened septum disrupted the vortex ring. The dilated LV hadlarge radial space except the septum, so the vortex structure dis-sipated its energy more slowly than that in the normal subject. Asa result, the vortex ring was largely preserved during the diastasisin PAH as demonstrated in Figs. 5 and 6. At the onset of rapidfilling, the trailing flow structure behind the primary vortex ringwas observed only in PAH. It was due to the excessive VFT, and thisphenomenon was also observed in other studies (Gharib et al.,1998; Zheng et al., 2012).
Owing to the relatively low image acquisition rate of CMR, theleaflet dynamics during the opening and closing phases had to beinterpolated temporally, which was the main limitation of thisstudy. In the latest study conducted by Domenichini and Ped-rizzetti (2014), the simplified one degree of freedom (i.e. the angleof mitral leaflet opening angle) was introduced to couple theintraventricular flow and leaflet dynamics. The routine CMR ima-ges included two-chamber, three-chamber and four-chamberviews along long-axis, and therefore the saddle-shaped mitralannulus was reconstructed using only six points, which eitheroverestimated or underestimated the true mitral orifice area. Dueto the difficulty in reconstructing mitral valve based on long-axisimages, the leaflets in the current study were slightly shorter, andthus the coaptation zone was ignored. Only two cases weremodeled in this study, and a larger sample size is necessary todemonstrate the effects of PAH on intraventricular flow.
5. Conclusion
This study was the first attempt to simulate the flow in LV withMV incorporated based on CMR, which is more widely used forpatients with myocardial diseases than CT. Based on the geome-tries and opening area of mitral valve, the resultant VFTs in thenormal subject and the PAH patient varies significant, which isconsistent with the observations in the literature. Therefore, VFT isa promising parameter to differentiate normal and diseased LVs.The detailed vortex structures showed that the MV played animportant role in the generation of vortex ring, and the asym-metric bileaflet MV directed the transmitral jet towards the apex.Although the MV was based only on the mitral annulus and twosegments in three-chamber view, it resulted in a more realisticflow field than the valveless model in the literature. With furtherimprovements in modeling leaflet dynamics, the frameworkdeveloped in this study can be applied to various patient-specificLV simulations.
al modeling of left ventricular fluid dynamics with mitral valve16/j.jbiomech.2016.03.008i
B. Su et al. / Journal of Biomechanics ∎ (∎∎∎∎) ∎∎∎–∎∎∎ 7
Conflict of interest statement
The authors declare that they have no conflict of interest inregards to this study.
Acknowledgment
The authors would like to acknowledge Goh CardiovascularResearch Award (Duke-NUSGCR/2013/0009) for funding thisresearch.
References
Belohlavek, M., 2012. Vortex formation time: an emerging echocardiographic indexof left ventricular filling efficiency? Eur. Heart J. Cardiovasc. Imaging 13,367–369.
Chandran, K.B., Kim, H., 2014. Computational mitral valve evaluation and potentialclinical applications. Ann. Biomed. Eng.
Charonko, J.J., Kumar, R., Stewart, K., Little, W.C., Vlachos, P.P., 2013. Vortices formedon the mitral valve tips aid normal left ventricular filling. Ann. Biomed. Eng. 41,1049–1061.
Chnafa, C., Mendez, S., Nicoud, F., 2012. Image-based patient-specific simulation: acomputational modelling of the human left heart haemodynamics. Comput.Methods Biomech. Biomed. Eng. 15, 1–3.
Chnafa, C., Mendez, S., Nicoud, F., 2014. Image-based large-eddy simulation in arealistic left heart. Comput. Fluids 94, 173–187.
Dimasi, A., Cattarinuzzi, E., Stevanella, M., Conti, C.A., Votta, E., Maffessanti, F.,Ingels, N.B., Redaelli, A., 2012. Influence of mitral valve anterior leaflet in vivoshape on left ventricular ejection. Cardiovasc. Eng. Technol. 3, 388–401.
Domenichini, F., Pedrizzetti, G., 2014. Asymptotic model of fluid–tissue interactionfor mitral valve dynamics. Cardiovasc. Eng. Technol. 6, 95–104.
Falahatpisheh, A., Kheradvar, A., 2012. High-speed particle image velocimetry toassess cardiac fluid dynamics in vitro: from performance to validation. Eur. J.Mech. - B/Fluids 35, 2–8.
Garcia, D., Del Alamo, J.C., Tanne, D., Yotti, R., Cortina, C., Bertrand, E., Antoranz, J.C.,Perez-David, E., Rieu, R., Fernandez-Aviles, F., Bermejo, J., 2010. Two-dimensional intraventricular flow mapping by digital processing conventionalcolor-doppler echocardiography images. IEEE Trans. Med. Imaging 29,1701–1713.
Gharib, M., Rambod, E., Shariff, K., 1998. A universal time scale for vortex ringformation. J. Fluid Mech. 360, 121–140.
Khalafvand, S.S., Ng, E.Y.K., Zhong, L., Hung, T.K., 2012. Fluid-dynamics modelling ofthe human left ventricle with dynamic mesh for normal and myocardialinfarction: preliminary study. Comput. Biol. Med. 42, 863–870.
Khalafvand, S.S., Zhong, L., Ng, E.Y.K., 2014. Three-dimensional CFD/MRI modelingreveals that ventricular surgical restoration improves ventricular function bymodifying intraventricular blood flow. Int. J. Numer. Methods Biomed. Eng. 30,1044–1056.
Kheradvar, A., Assadi, R., Falahatpisheh, A., Sengupta, P.P., 2012. Assessment oftransmitral vortex formation in patients with diastolic dysfunction. J. Am. Soc.Echocardiogr. 25, 220–227.
Kheradvar, A., Gharib, M., 2007. Influence of ventricular pressure drop on mitralannulus dynamics through the process of vortex ring formation. Ann. Biomed.Eng. 35, 2050–2064.
Krittian, S., Schenkel, T., Janoske, U., Oertel, H., 2010. Partitioned fluid-solid couplingfor cardiovascular blood flow: validation study of pressure-driven fluid-domaindeformation. Ann. Biomed. Eng. 38, 2676–2689.
Le, T.B., Sotiropoulos, F., 2012. On the three-dimensional vortical structure of earlydiastolic flow in a patient-specific left ventricle. Eur. J. Mech. B. Fluids 35,20–24.
Please cite this article as: Su, B., et al., Cardiac MRI based numericaincorporated. Journal of Biomechanics (2016), http://dx.doi.org/10.10View publication statsView publication stats
Mangual, J.O., Kraigher-Krainer, E., De Luca, A., Toncelli, L., Shah, A., Solomon, S.,Galanti, G., Domenichini, F., Pedrizzetti, G., 2013. Comparative numerical studyon left ventricular fluid dynamics after dilated cardiomyopathy. J. Biomech. 46,1611–1617.
Mihalef, V., Ionasec, R.I., Sharma, P., Georgescu, B., Voigt, I., Suehling, M., Comaniciu,D., 2011. Patient-specific modelling of whole heart anatomy, dynamics andhaemodynamics from four-dimensional cardiac CT images. Interface Focus 1,286–296.
Nguyen, V.-T., Loon, C.J., Nguyen, H.H., Liang, Z., Leo, H.L., 2013. A semi-automatedmethod for patient-specific computational flow modelling of left ventricles.Comput. Methods Biomech. Biomed. Eng., 37–41.
Pedrizzetti, G., Domenichini, F., 2007. Asymmetric opening of a simple bileafletvalve. Phys. Rev. Lett. 98, 214503.
Pedrizzetti, G., Domenichini, F., 2014. Left ventricular fluid mechanics: the long wayfrom theoretical models to clinical applications. Ann. Biomed. Eng. 43, 26–40.
Pedrizzetti, G., Domenichini, F., Tonti, G., 2010. On the left ventricular vortexreversal after mitral valve replacement. Ann. Biomed. Eng. 38, 769–773.
Poh, K.K., Lee, L.C., Shen, L., Chong, E., Tan, Y.L., Chai, P., Yeo, T.C., Wood, M.J., 2012.Left ventricular fluid dynamics in heart failure: echocardiographic measure-ment and utilities of vortex formation time. Eur. Heart J. Cardiovasc. Imaging 13,385–393.
Rodriguez Muñoz, D., Markl, M., Moya Mur, J.L., Barker, A., Fernández-Golfín, C.,Lancellotti, P., Zamorano Gómez, J.L., 2013. Intracardiac flow visualization:current status and future directions. Eur. Heart J. Cardiovasc. Imaging 14,1029–1038.
Saber, N.R., Wood, N.B., Gosman, a D., Merrifield, R.D., Yang, G.-Z., Charrier, C.L.,Gatehouse, P.D., Firmin, D.N., 2003. Progress towards patient-specific compu-tational flow modeling of the left heart via combination of magnetic resonanceimaging with computational fluid dynamics. Ann. Biomed. Eng. 31, 42–52.
Schenkel, T., Malve, M., Reik, M., Markl, M., Jung, B., Oertel, H., 2009. MRI-based CFDanalysis of flow in a human left ventricle: methodology and application to ahealthy heart. Ann. Biomed. Eng. 37, 503–515.
Seo, J.H., Mittal, R., 2013. Effect of diastolic flow patterns on the function of the leftventricle. Phys. Fluids 25, 110801.
Seo, J.H., Vedula, V., Abraham, T., Lardo, A.C., Dawoud, F., Luo, H., Mittal, R., 2014.Effect of the mitral valve on diastolic flow patterns. Phys. Fluids 26, 121901.
Silbiger, J.J., Bazaz, R., 2009. Contemporary insights into the functional anatomy ofthe mitral valve. Am. Heart J. 158, 887–895.
Stevanella, M., Maffessanti, F., Conti, C. a, Votta, E., Arnoldi, A., Lombardi, M., Parodi,O., Caiani, E.G., Redaelli, A., 2011. Mitral valve patient-specific finite elementmodeling from cardiac MRI: application to an annuloplasty procedure. Cardi-ovasc. Eng. Technol. 2, 66–76.
Stewart, K.C., Charonko, J.C., Niebel, C.L., Little, W.C., Vlachos, P.P., 2012. Left ven-tricle filling vortex formation is unaffected by diastolic impairment. Am. J.Physiol.: Heart Circ. Physiol., 1255–1262.
Su, B., Kabinejadian, F., Phang, H.Q., Kumar, G.P., Cui, F., Kim, S., Tan, R.S., Hon, J.K.F.,Allen, J.C., Leo, H.L., Zhong, L., 2015. Numerical modeling of intraventricularflow during diastole after implantation of BMHV. PLoS One 10, e0126315.
Su, B., Zhang, J.-M., Tang, H.C., Wan, M., Lim, C.C.W., Su, Y., Zhao, X., Tan, R.S., Zhong,L., 2014a. Patient-specific blood flows and vortex formations in patients withhypertrophic cardiomyopathy using computational fluid dynamics. In: Pro-ceedings of IEEE Conference on Biomedical Engineering and Sciences (IECBES)2014.
Su, B., Zhong, L., Wang, X.-K., Zhang, J.-M., Tan, R.S., Allen, J.C., Tan, S.K., Kim, S., Leo,H.L., 2014b. Numerical simulation of patient-specific left ventricular modelwith both mitral and aortic valves by FSI approach. Comput. Methods ProgramsBiomed. 113, 474–482.
Votta, E., Le, T.B., Stevanella, M., Fusini, L., Caiani, E.G., Redaelli, A., Sotiropoulos, F.,2013. Toward patient-specific simulations of cardiac valves: state-of-the-artand future directions. J. Biomech. 46, 217–228.
Zheng, X., Seo, J.H., Vedula, V., Abraham, T., Mittal, R., 2012. Computational mod-eling and analysis of intracardiac flows in simple models of the left ventricle.Eur. J. Mech. - B/Fluids 35, 31–39.
l modeling of left ventricular fluid dynamics with mitral valve16/j.jbiomech.2016.03.008i