carbon sequestration and ponds: thrivikramji .k.p.& jobin thomas
DESCRIPTION
A piece of research reported here is of interest to all those in reducing Indian carbon foot print and mitigating climate change consequences. The OC data on Ponds of Palakkad is used to base the arguments of the importance of passive and harmless water structures that is designated by a "four letter word", i.e., pond.TRANSCRIPT

CARBON SEQUESTRATION BY POND
BOUND ORGANIC CARBON PALAKKAD DIST, KERALA.
By1Thrivikramji, K.P. & 2Jobin Thomas
1CED, Trivandrm, [email protected] for Geomatics, UoK, Kariavattom
Campus, 695581

PONDS AND SMALL LAKES PART OF AGRARIAN CULTURE, RELIGIOUS BELIEVES & NOW PART OF OUR
HERITAGE. NATURAL LOWS OR LOWS WALLED IN BY SOIL + ROCK
EMBANKMENTS EFFICIENTLY STORED RAIN/SNOW MELT- WATER FOR LATER USE DURING WATER EMERGENICIES.

POST WWII & DAWN OF MODERN STORAGE DAMS,
SPREAD OF CANAL IRRIGATION, MACHINERY FOR
PLOWING, SOWING, HARVESTING, CHEM. FERTS & PESTICIDES.
THE CONVENTIONAL PONDS & SMALL LAKES GRADUALLY
SELF-OBSCURED

PONDS, KERALA STATE (SOURCE: “PAN FISH”)
TOTAL NUMBER=41784 AREA = 23814 HA OR 238.0 KM2
PASSIVE STRUCTURES OF CARBONCC&S.

RISING CO2 LEVEL IN TROPOSPHERE
• post industrial revolution
• Rising use of FF like coal, oil and gas
• the chief source or drivers of GCC
• Atmospheric CO2 levels monitored at
Mauna Loa, island in Hawaiian chain.
• Initiated by (Late) Prof.
Keeling, USC, continued by Prof. Ralph
Keeling now,
NOAA Runs 200 observatories.
400 ppm, Nov, 13-13
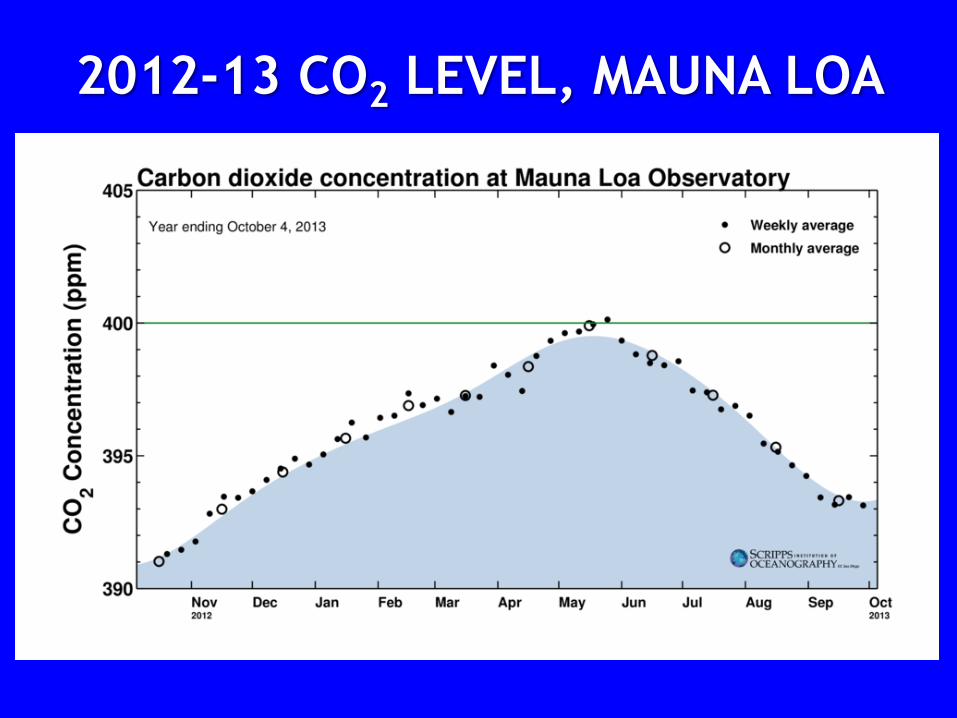
2012-13 CO2 LEVEL, MAUNA LOA


CO2 CH4

CONSEQUENCES OF CO2 BUILD UP?
• CO2 a green house gas
• CO2 build up leads to:
lower tropospheric warming,
shirking of glaciers,
wasting of polar ice,
rise in sea level,
shift in climatic zones,
changes rainfall patterns,
vegetation shifts etc

POSSIBLE SOLUTIONS?
• Reduce consumption of fossil fuels?
• Go for new fuels or fuel mixes?
• Sequester (capture & store CO2?)
• Where?
– In geological formations
– In abandoned oil and gas fields
– Mineralize CO2
– In seas & oceans or such other????

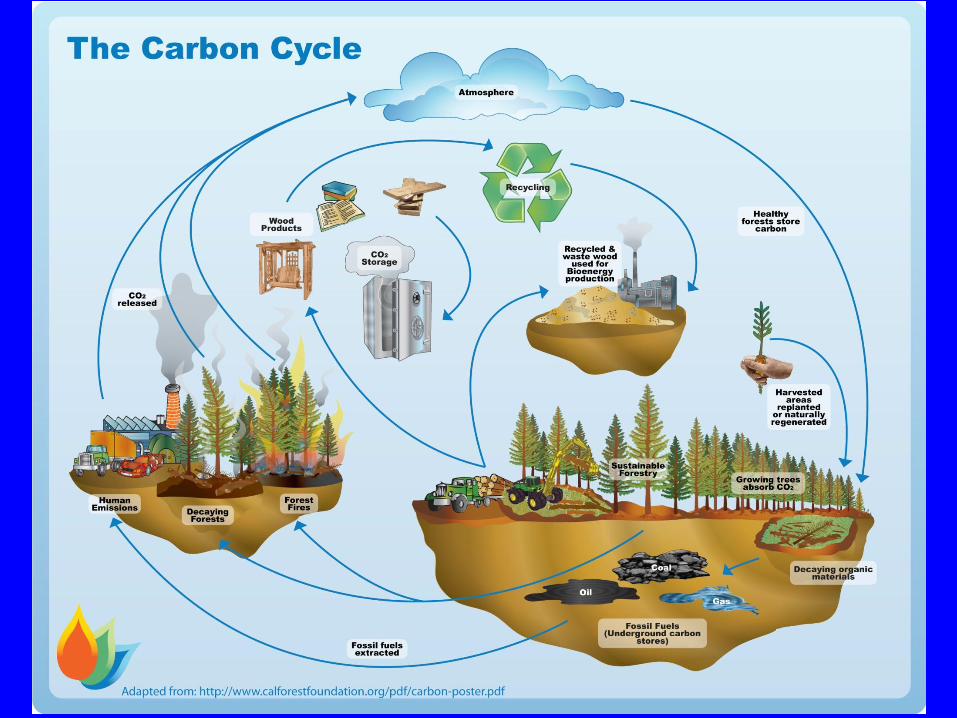
Global Carbon Cycle: Inventories
World oceans = ~39,000 GtC
Fossil fuel deposits = ~6,000 GtC
Soils & vegetation = ~2500 GtC,
Atmosphere= ~ 760 GtC2

In Post IR, Land use changes added~136 GtC to
Lr. Troposphere, Fossil fuel use added~270 GtCAtmosphere trapped~180 GtC,
New biomass consumed ~110 GtCBalance entered the oceans.

CO2 Flux, 1990-99. RELEASES=
fossil fuel: ~6.3 GtC/yr, biomass burning (leaves &timber):
~1.6 GtC/yr ABSORPTIONS=
oceans & new/growing vegetation:~2.3 GtC/yr,
Balance =3.3 GtC/ yr in atmosphere.

.
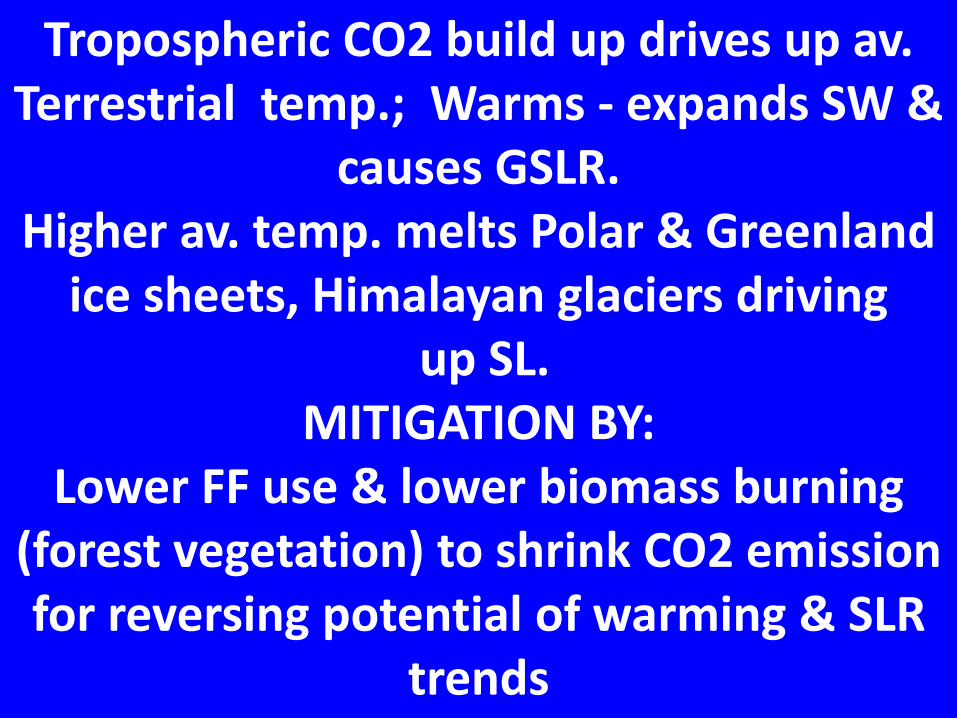
Tropospheric CO2 build up drives up av. Terrestrial temp.; Warms - expands SW &
causes GSLR. Higher av. temp. melts Polar & Greenland
ice sheets, Himalayan glaciers driving up SL.
MITIGATION BY: Lower FF use & lower biomass burning
(forest vegetation) to shrink CO2 emission for reversing potential of warming & SLR
trends

Mitigation Suggestions (Pascala & Solocow (2004):
Raise fuel economy of 2 billion cars from 30 to 60 mpg Reduce use of 2 billion 30-mpg cars, from 10,000 to
5,000 mi/yr.Raise building energy efficiency by 25% vs. levels
projected in 50 years.Double the 32% capacity of efficient baseload (60%
energy efficient) coal-fired power

Mitigation Suggestions (Pascala & Solocow (2004):
Replace 1,400 gw of 50%-energy-efficient coal-fired power plants with natural gas-fired power plants —
quadrupling current gas-fired capacity.Introduce carbon capture & storage (CCS) at 800 Gw
of coal base-load power capacity or 1,600 Gw of natural gas base-load power capacity.
Introduce CCS at plants producing 250 mt/y of hydrogen from coal or 500 mt/y from natural gas.
Carobon capture &
SEQUESTRATION
to set off or apart; separate; segregate;

Carbon capture & sequestration, CCS
One approach for mitigating potential GCC due to anthropogenic emissions of
CO2 & other GHGs, is to capture CO2 at fossil fuel using sources, & store it
terrestrially or oceanically.
Oak Ridge National Lab Focuses on sequestering C in geological
formations, biologically active ponds &
on improving degraded lands to enhance C storage.

Worldwide Potential of CO2 Storage @Gt C
Ocean, 1000–10,000Deep saline formations, 100–10,000
Depleted oil and gas fields, 100–1000Coal seams, 10–1000
Terrestrial, 10–100Utilization Currently, 0.1 Gt C/yr

TOC = OC + CC2 Types- organic and inorganic carbon
TERRESTRIAL SEQUESTRATION: Soil carbon
During photosynthesis, plants convert CO2 into organic carbon – in roots and as plant residue, A
horizon
Inorganic carbon –minor- is in carbonates resulting form non-biological interactions but considered more
permanent.

CHEMICAL SEPARATION – Scrubbing CO2
Amine absorbents: Flue gas is bubbled through a solution of water & (lean) amines. Portion of
CO2 remains in solution & “ rich amines” are pumped to another vessel & heated to
decompose back into regular (lean) amines & pure CO2 gas.
Pure CO2 gas is collected from this vessel, & regular amines are recycled to flue contactor gas
vessel.

GEOLOGICAL SEQUESTRATION
Depleted oil & gas reservoirs: Ideal sites for Pumping down CO2 for long-term
storage. Former oil pools with the cap rock secure reservoirs for storage.
Currently this technology is in vogue for Tertiary recovery of oil & gas.

GEOLOGICAL SEQUESTRATION
Unmineable coal seams: Deep coal seam is not minable. Methane (CBM) trapped in the open pores of coal seams are recovered by drilling deep wells for depressurization &
dewatering. Nitrogen is also pumped down to CBM recovery. Instead, pumping CO2
down will recover the CBM & securely store the CO2.

Serpentinite reactionsReaction 1
Mg-Olivine + Carbon dioxide → Magnesite + Silica
Mg2SiO4 + 2CO2 → 2MgCO3 + SiO2 + H2O

Reaction 2Serpentine + carbon dioxide →
Magnesite + silica + water
Mg3[Si2O5(OH)4] + 3CO2 → 3MgCO3 + 2SiO2 + 2H2O
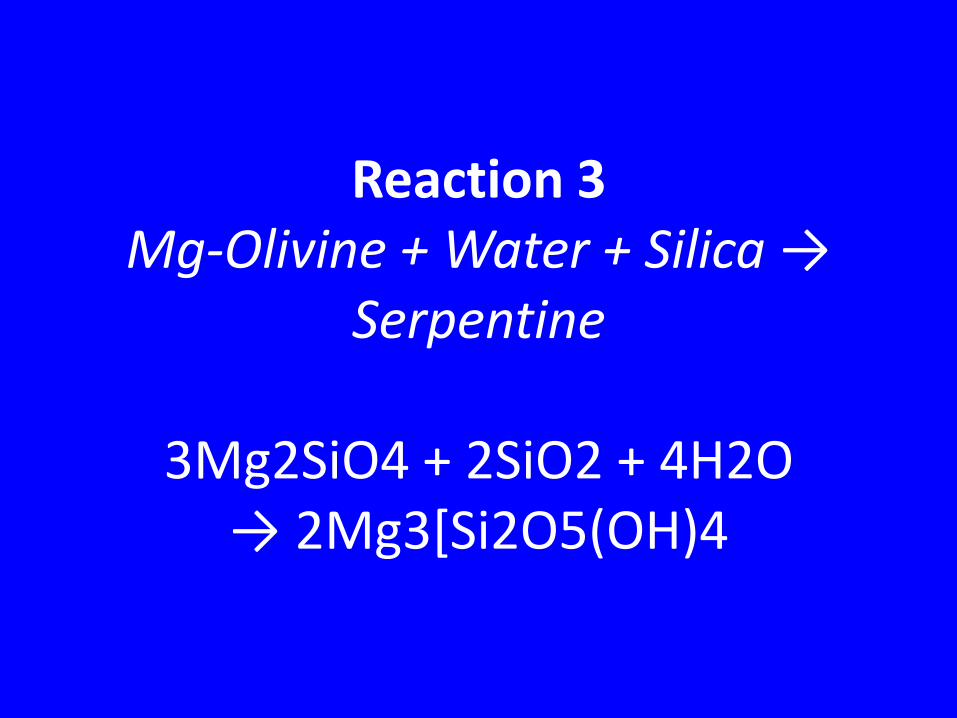
Reaction 3Mg-Olivine + Water + Silica →
Serpentine
3Mg2SiO4 + 2SiO2 + 4H2O→ 2Mg3*Si2O5(OH)4

Reaction 4Mg-Olivine + Water + Silica →
Serpentine
3Mg2SiO4 + 2SiO2 + 4H2O→ 2Mg3*Si2O5(OH)4

TERRESTRIAL SEQUESTRATION
• Phytoplanktons & Photosynthesizing
terrestrial & aquatic plant life trap C of
atmospheric CO2.
• So organic matter in bottom sediments of
ponds, small & large lakes ideal loci
• River waters trap dissolved OC
• Soil & humus

SKY MINING
CAPTURING CO2 OF FLUE GAS TO make food-grade Na-bicarbonate (baking soda) &
hydrochloric acid, both of which generate revenue. offsets carbon build up.
Also used for the production of CH4

Life on Earth carbon based. Sun’s energy fixes CO2 in biomass.
Fossil fuels – a legacy of algal photosynthesis in geologic past.
CO2 “Mining”
by Algae-marine & freshwater, micro & macro
plants with higher photosynthetic efficiencies compared to terrestrial
plants & thus efficient carbon capturers/traps /removers

HOME OF ALGAL BIOMASS:
TERRESTRIAL WATER BODIES LIKE PONDS, SMALL AND LARGE LAKES AS WELL AS COASTAL OCEANS IN THE LR.
LATITUDES.

Lakes- Globally accumulate OC @ ~ 42 Tg yr−1.
Reservoir sediments trap 160 Tg yr-1, Peatlands trap 96 Tg yr-.
But only cover < 2% of the Earth's surface. A carbon sink of ~300 Tg yr−1.
Oceans cover 71% of Earth's surface, but trap OC @ of ~100 Tg yr−1

Small Continental Waters –LAKES & PONDS completely ignored in all
global processes & cycles. Ecologists ignored such systems & processes, as such
ecosystems of limited areal extent. So no major role in global processes.
“Little things mean a lot”

But recent inventories based on modern geographical & mathematical
approaches show that continental waters occupy nearly twice as much
area as was previously believed

Halbfass (1914) and Thienemann(1925), pioneered cataloguing of
world’s Lakes

Farm ponds linked to extent of agricultural land area &
precipitation. 304 million natural
lakes in the world covering about 4.2 million km2. Roughly twice that of
earlier estimates.
Small lakes, ponds, puddles, marshes & streams, are of disproportionately
greater importance in world cycles & processes.

Globally, small lakes in size0.0001-0.001 km2 (100-1000 m2),
the dominate on continents. Number in the range of 3.2 × 10⁹
natural ponds & cover some 0.8 billion km2

Oligotrophic lakes/ponds with sedimentation rate of <1 mm/y, Life span might be 1000-10,000 y
In highly erodible,nutrient-riched environments, small
lakes/ponds disappearin a few decades by sedimentation &
succession.

Carbon-processing intense small lakes/ponds
more heterotrophicthan large ones,
process substantialamounts of terrestrial or external
carbon
Globally, small agricultural pondscover ~77,000 km2.
OC burialranges from 17 kg C/m2/y to
148 g C/m2/y greater in
small impoundments than large ones
Areal C burial rates in lakes10x - of wetlands
100x of tropical forests, 1000x in tropical & boreal forests, and
10,000x for the world’s oceans.Moderately sized ponds/lakes may
bury 4x as much C as the world’s oceans.

World’s farm ponds likely sequestermore OC/yr than oceans and
33% as much as the world’s rivers deliver to the sea. Rate of C burial in
eutrophic lakes are ~an orderof magnitude higher than those in
oligotrophiclakes of similar size

Ocean & land-based sites have an enormous capacity for storing CO2.
World’s oceans are thelargest traps for carbon storage. Worldwide total anthropogenic
carbon emissions are 7GtC per year (1 GtC=1 billion
metric tons of carbon equivalent).

In Iowa (Downing et al., 2008)
small, agriculturally-eutrophic impoundments
bury carbon @ av. of 2122 g m-2 yr-1
5X higher than in large river impoundments, 30X
more than in small, natural lakes & over 400X
greater than in inland seas & large natural
lakes (Mulholland and Elwood, 1982; Dean and
Gorham, 1998).

PONDS: SPATIAL TYPES
1. Head-valley Ponds
2. Mid-valley Ponds
3. Toe-valley Ponds

PONDS: GENERIC TYPES,
NATIONAL SCENE
1. Temple Ponds
2. Public Ponds
3. Private Ponds
4. Quarry & Mine Ponds
5. ???

PONDS – INTERNATIONAL SCENE
•Most OM of Lakes / ponds
autochthonous, OC/N ratio = <10.0
• Plant pigments in surface sediments
of lakes in the English Lake
District, much like Minnesota lakes,
•Organic matter in more productive lakes
autochthonous (Gorham et al., 1974).

• Average OC content= 20%
• OC/N =11 in sediments of 23
Wisconsin lakes (Brunskill et al., 1971).

• If OC in lakes of glaciated areas of
•N.Hemisphere, like Minnesota
lakes, Experimental Lakes
Area, English lakes, & Great Lakes, is out
of photosynthesis, the carbon pool buried
over the past 10,000 yr must be
enormous.

• Similarly the OC trapped in
Holocene, by the coastal wetlands
(Kayal) of Kerala must be equally
huge in content (e.g., especially in the
humus-rich bottom sediments of
Kuttanad, Vembanad and Kole) and in
the several thousand smaller ponds of
much younger age.

• MAR (MASS ACCUMULATION RATE) OC
IN THE TOP 10.0 CM OF EUTROPHIC
LAKE GREIFEN, SWITZERLAND
•= 50–60 G M–2 YR–1
•BUT STOOD AT ~10 G M–2 YR–1 IN PRE-
1880’S (HOLLANDER ET AL., 1992).

• OC ACCUMULATION IN MINNESOTA
LAKES AVERAGES AT 72 G M–2 YR–1,
•SUM OF OC ACCUMULATION STANDS AT
~1012 G YR–1 OR 1.0 TG YR–1.

• The total OC MAR yr-1 in lakes = 42.0 Tg,• Reservoirs = 160.0 Tg,• Boreal peat-lands = 96.0 Tg• Or sums up to 298.0 Tg.• Total area of three carbon sinks only
about 2% of the world ocean’s surfacearea.
• But they bury 3X more carbon than theoceans do.

• To calculate accumulation rates of
carbon we need measurements of
dry bulk density (DBD), a good
chronology, and measurements of
OC.

SEDIMENT PHYSICAL PROPERTIES
Pond-ID SKPM TTLA PLKD KLD CHTR
Organic Carbon,
OC, (%)4.1335 0.973 3.3357 1.752 5.741
Inorganic carbon
(%)2.3988 0.5644 1.9473 1.0162 3.3299
Dry bulk density
(g/ cm3)1.18 1.14 1.16 1.46 0.94
Textural class fszC zC fzC fszC fszC

YEARLY OC BURIAL
Pond-ID SKPM TTLA PLKD KLD CHTR
Area, m2 311.0 5793 11446 2034 200
t C/yr 15.18 64.26 442.89 52.03 10.75
Total burial, t
C/yr585.11

PALAKKAD DIST., Yrly OC BURIAL
Type / Title Area Quantum
Private ponds 948.27 ha 355,612.0 t C/y
Panchayath ponds 176.84 ha 66,287.0 t C/y
Quarry ponds 136 55.16 t C/y
All ponds 1180.27 442,414 t C/y

POND FREQUENCY, KERALA
0
2000
4000
6000
8000
10000

POND FREQUENCY DENSITY, KERALA
0
20
40
60
80
100

POND FREQUENCY, PKD
0
125
250
375
500

POND FREQUENCY DENSITY, PKD
0.0
1.0
2.0
3.0
4.0


CHARACHIRA, TRIVANDRUM
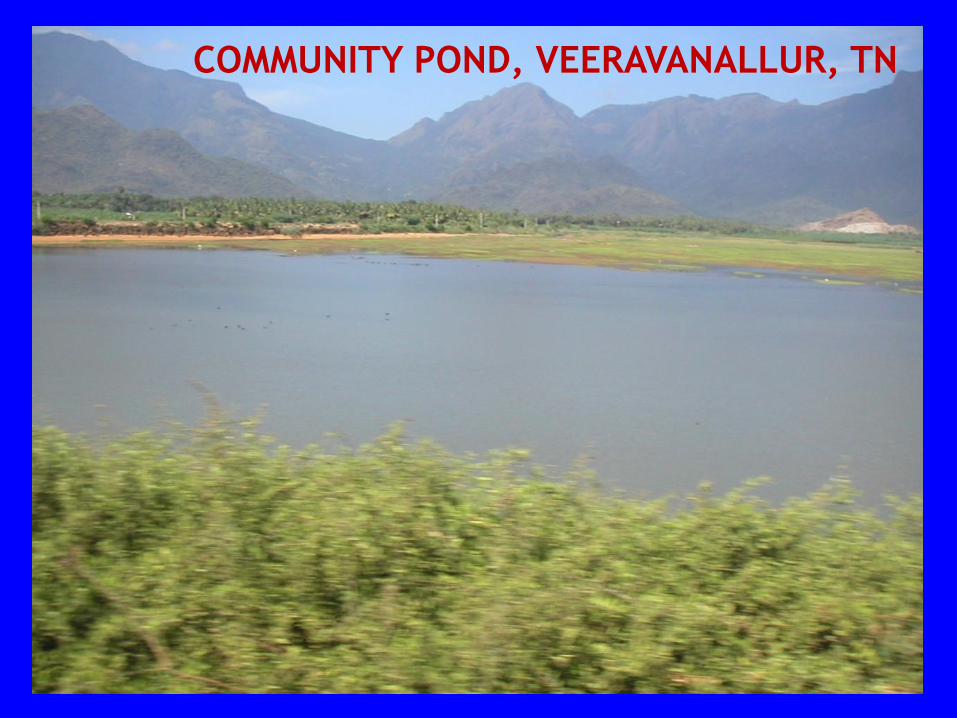
COMMUNITY POND, VEERAVANALLUR, TN

“STORAGE POND”, NANJINADU, NAGERKOVIL

POND TURNING MARSH

SUBURBAN POND, TRIVANDRUM
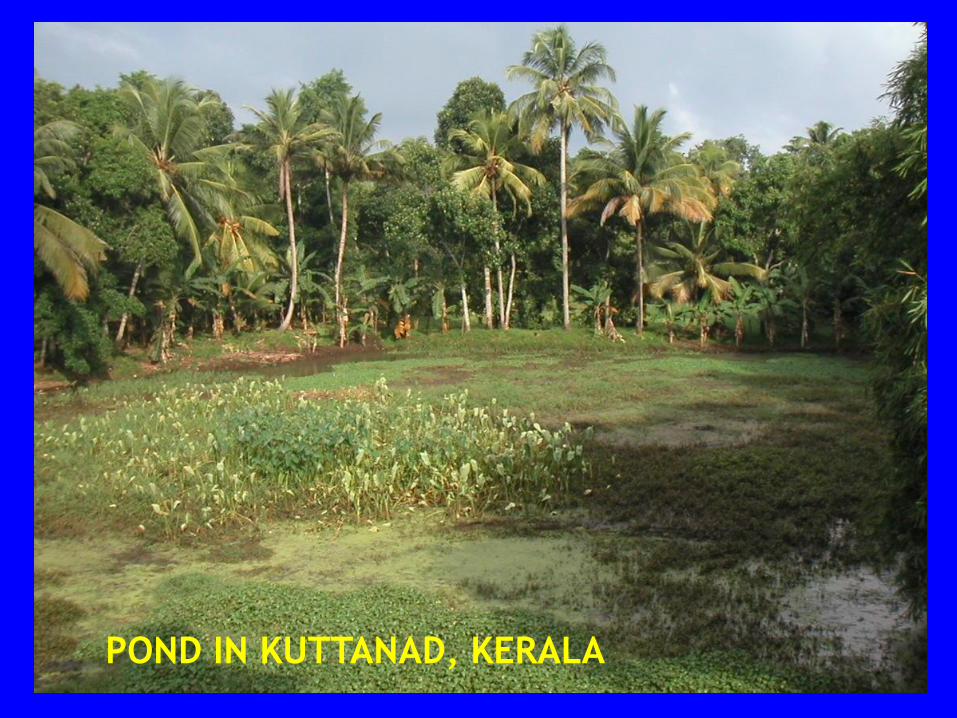
POND IN KUTTANAD, KERALA

TEMPLE POND, MYLAPORE, CHENNAI
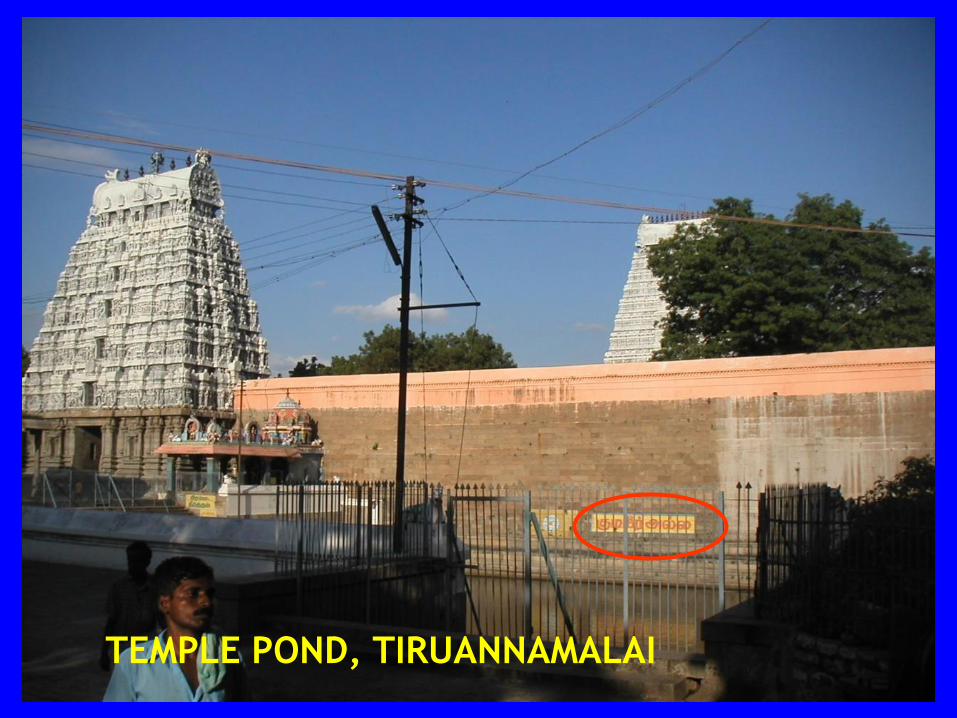
TEMPLE POND, TIRUANNAMALAI


OFFICE COMPLEX IN FILLED POND, TRIVANDRUM

RECLAIMED POND, TRIVANDRUM

ROWING POOL IN OLD TIME POND, TRIVANDRUM

HAVE A GOOD DAY