caracterizaÇÃo da variabilidade genÉtica e … · pelas fêmeas e ausência de recombinação, o...
TRANSCRIPT
PONTIFÍCIA UNIVERSIDADE CATÓLICA DO RIO GRANDE DO SUL
FACULDADE DE BIOCIÊNCIAS
PROGRAMA DE PÓS-GRADUAÇÃO EM BIOCIÊNCIAS - ZOOLOGIA
CARACTERIZAÇÃO DA VARIABILIDADE GENÉTICA E
AVALIAÇÃO DAS PROVÁVEIS ÁREAS DE ALIMENTAÇÃO
BASEADA NO DNA MITOCONDRIAL DA POPULAÇÃO DE
BALEIAS JUBARTE, Megaptera novaeangliae, NO BANCO DOS
ABROLHOS, BAHIA, BRASIL
Biól. Márcia Helena Engel Coitinho
Orientador: Prof. Dr. Sandro Luis Bonatto
Co-orientador: Dr. Howard C. Rosenbaum
DISSERTAÇÃO DE MESTRADO
PORTO ALEGRE – RS - BRASIL
2003
II
SUMÁRIO
1. DEDICATÓRIA ........................................................................................................................... III 2. AGRADECIMENTOS .................................................................................................................. IV
3. RESUMO ...................................................................................................................................... V
4. ABSTRACT ................................................................................................................................. VI
5. APRESENTAÇÃO ...................................................................................................................... 1
6. CORPO DO ARTIGO CIENTÍFICO ......................................................................................... 3

III
Para o Luca, pela paciência e companhia nesta e em outras etapas da minha vida.

IV
2. AGRADECIMENTOS
A realização deste trabalho somente foi possível graças ao apoio de vários amigos,
colaboradores e instituições. O suporte financeiro foi proporcionado pela PETROBRAS e
as análises de laboratório foram desenvolvidas pelo Centro de Biologia Genômica e
Molecular da PUCRS com o financiamento da FAPERGS. Foram importantes parceiros na
execução destes estudos o American Museum of Natural History/USA e o Projeto Baleias
do Programa Antártico Brasileiro (PROANTAR) da Marinha do Brasil.
Agradeço especialmente a toda a equipe do Instituto Baleia Jubarte, que
compreendeu minhas constantes ausências do escritório em Caravelas para a realização
deste sonho. Agradeço aos colegas do Centro Genoma que me incentivaram e ajudaram
durante as etapas mais difíceis da dissertação, criando ainda uma atmosfera de alegria e
descontração permanentes no laboratório. Outro agradecimento especial ao Sandro, pela
imensa ajuda em todas as etapas deste trabalho e por seu apoio na administração dos três
mil quilômetros de distância que frequentemente me separaram das aulas e das atividades
do laboratório.
V
3. RESUMO No Oceano Atlântico Sul Ocidental as baleias jubarte migram a cada inverno para o banco dos Abrolhos (16o40’ to 19o30’S; 37o25’ to 38o57’W) para acasalamento e cria de filhotes. Entretanto, esta população permanece geneticamente não caracterizada e suas áreas de alimentação são ainda desconhecidas, uma vez que não há pareamento fotográfico de indivíduos entre Abrolhos e os sítios de alimentação na Antártida. A fim de examinar estas questões, sequenciamos um segmento de 450 pares de bases do DNA mitocondrial da região controladora de baleias jubarte de Abrolhos (n=176) e das proximidades da Península Antártica (n=77). Um total de de 61, 17 e 13 haplótipos foram determinados respectivamente no Brasil e nas Áreas I e II da Antártida. A variabilidade genética da área de reprodução brasileira foi alta, similar à de outros sítios reprodutivos do Hemisfério Sul. A proporção de haplótipos compartilhados e a distância genética demonstraram uma maior semelhança entre as duas regiões antárticas que entre o Brasil e qualquer uma destas áreas. Estes resultados indicam que as populações de baleias jubarte das àreas I e II da Antártida parecem não possuir uma clara diferenciação e que os limites entre as àreas I e II correntemente definidos pela Comissão Internacional da Baleia devem ser deslocados para leste. Sugerimos que a área de alimentação da população de baleias jubarte brasileiras não estaria na Península Antártica ou próximo a ela, mas pode estar localizada na porção leste da Área II, no mar de Weddell ou próximo às ilhas Geórgias do Sul.
VI
4. ABSTRACT Characterization of the genetic variability and evaluation of the likely feeding grounds based on the mitochondrial DNA of the humpback whale, Megaptera novaeangliae population in the Abrolhos bank, Bahia, Brazil In the Southwestern Atlantic Ocean humpback whales migrate every winter to Abrolhos bank (16o40’ to 19o30’S; 37o25’ to 38o57’W) for mating and calving. However, this population remains genetically uncharacterized and their feeding areas unknown, as there are no photographic matches between individuals from Abrolhos and Antarctic feeding grounds. In order to examine these questions, we sequenced a 450 bp segment of the mitochondrial DNA control region from Abrolhos humpback whales (n=176) and from Antarctic Peninsula surroundings (n=77). A total of 61, 17 and 13 haplotypes were determined in the Brazilian, Antarctic Area I and II respectively. The genetic variability of the Brazilian breeding area was high, similar to that from other Southern Hemisphere breeding grounds. The phylogenetic tree using also sequences from the GenBank found a new clade (named BR) constituted by Brazilian sequences and a sequence from Eastern Australia (EA11). The proportion of sharing haplotypes and the genetic distance showed a greater similarity between the two Antarctic grounds than between Brazil and any of these areas. These results indicate that humpback whale populations from the Antarctic Area I and II seem to have no clear differentiation and that the boundaries between Areas I and II as currently defined by the International Whaling Commission may be shifted to the east. We suggest that the feeding area of the Brazilian humpback whale population is not in the Antarctic Peninsula or near it but may be located in the eastern part of Area II, in the Weddell Sea or near South Georgia Island.
1
5. APRESENTAÇÃO O presente trabalho teve por objetivo estimar a variabilidade genética, a proporção
sexual e determinar o sítio de alimentação do “ stock” (subpopulação) de baleias jubarte,
Megaptera novaeangliae, que utiliza o banco dos Abrolhos para reprodução e cria de
filhotes. O conhecimento das áreas de alimentação e reprodução e da rota migratória das
jubartes entre estas áreas agregam além disso subsídios para a defesa de proposta brasileira
que será reapresentada em 2003 à Comissão Internacional da Baleia (IWC), órgão máximo
que regulamenta a caça e conservação de grandes cetáceos no mundo, de criação do
“Santuário do Atlântico Sul”, local onde as baleias estarão protegidas da caça comercial em
uma das fases mais vulneráveis de sua vida.
As ações de pesquisa e conservação destes animais na região de Abrolhos são
desenvolvidas desde 1988 pelo Projeto Baleia Jubarte, com o apoio do Parque Nacional
Marinho dos Abrolhos/IBAMA, mais antiga unidade de conservação federal do país.
Estudos de fotoidentificação, estimativa populacional, observações de comportamento,
monitoramento do turismo e outros têm sido desenvolvidas e os estudos de genética
iniciados em 1997 vêm agregar informações importantes para a ecologia e manejo da
espécie.
As jubartes de ambos os hemisférios formam sazonalmente diferentes concentrações
reprodutivas em latitudes tropicais. Cada subpopulação, apesar da ausência de barreiras
geográficas evidentes, possui grande fidelidade a seu local de acasalamento, realizando
migrações verticais para uma também específica área de alimentação em águas árticas ou
antárticas. No hemisfério sul, a espécie possui seis sítios reprodutivos distintos, entre os
quais o banco dos Abrolhos, no sul da Bahia, considerado a principal área de reprodução da
espécie em todo o Oceano Atlântico Sul Ocidental. A Comissão Internacional da Baleia
divide as áreas de alimentação das baleias na Antártida em também seis regiões principais,
numeradas de I a VI. Considerando-se o padrão migratório vertical da espécie, as áreas
definidas como I e II, situadas respectivamente entre os meridianos 60ºW e 120ºW e 0ºW e
60ºW constituiriam o provável local de alimentação das jubartes brasileiras.
2
As análises da região controladora do DNA mitocondrial constituem uma ferramenta
importante para o manejo e conservação das espécies. O DNA mitocondrial constitui uma
das mais estudadas regiões do genoma de mamíferos para a construção das relações
filogenéticas e análise dos padrões de distribuição e variabilidade genética de populações,
subpopulações ou espécies. Devido a suas elevadas taxas de mutação, transmissão somente
pelas fêmeas e ausência de recombinação, o DNA mitocondrial oferece vantagens sobre
outras regiões do genoma como a nuclear nos estudos de variabilidade genética, padrões de
distribuição e fluxo gênico entre populações.
A determinação do sexo dos indivíduos e da proporção sexual em populações de cetáceos
também proporcionam parâmetros essenciais para seu manejo, fornecendo informações
acerca de seu comportamento e estrutura social. A determinação do sexo em cetáceos na
natureza, entretanto, costuma ser complicada, já que em muitas espécies o dimorfismo
sexual está limitado ao tamanho e peso do corpo e localização das regiões genital e anal.
Nas jubartes as fêmeas também exibem outra característica sexual secundária, que consiste
na presença de um lobo hemisférico na porção posterior da região genital, mas que só pode
ser observada em animais encalhados, através de imagens submarinas ou quando o animal
expõe a nadadeira caudal acima da superfície da água. A análise de regiões sexo-específicas
no DNA constitui então uma alternativa eficiente para a obtenção destas informações.
A dissertação, escrita em formato de artigo científico, está sendo submetida à
“Conservation Genetics” e pretende trazer contribuição importante para o conhecimento e
conservação de uma espécie presente em todas as listas oficiais de fauna brasileira
ameaçada de extinção, protegida da caça e captura através de moratória internacional e que
constitui um dos maiores ícones da conservação mundial.
3
Mitochondrial DNA variability and evaluation of the likely feeding
grounds of the humpback whale (Megaptera novaeangliae) population of
the Abrolhos bank, Bahia, Brazil
Márcia H Engel *1,2, Nelson JR Fagundes2, Howard C Rosenbaum 3,4, Paulo H Ott 5,
Renata Schmitt 2 & Sandro L Bonatto 2
1Projeto Baleia Jubarte/Instituto Baleia Jubarte – Rua 7 de Setembro 178 – 45900-000
Caravelas, Bahia, Brazil 2 Centro de Biologia Genômica e Molecular, Pontifícia Universidade Católica do Rio
Grande do Sul, Av. Ipiranga 6681, 90619-900 Porto Alegre, RS, Brazil 3 The Wildlife Conservation Society, International Conservation, 185th Street and Southern
Blvd., Bronx, NY 10460 4Museum of Natural History, Molecular Systematics Laboratory, New York 10024 5 Departamento de Genética/Universidade Federal do Rio Grande do Sul. Porto Alegre, RS,
Brazil
Running title: mtDNA diversity of the humpback whales from Brazil
Address for correspondence: Márcia H Engel, Projeto Baleia Jubarte/Instituto Baleia
Jubarte – Rua 7 de Setembro 178 – 45900-000 Caravelas, Bahia, Brazil, FAX, Phone,
Key words: humpback whale, mitochondrial DNA, Abrolhos bank, genetic variability, migration
4
Abstract In the Southwestern Atlantic Ocean humpback whales migrate every winter to Abrolhos
bank (16o40’ to 19o30’S; 37o25’ to 38o57’W) for breeding. However, this population
remains genetically uncharacterized and their feeding areas unknown. In order to examine
these questions, we sequenced a 450 bp segment of the mitochondrial DNA control region
from Abrolhos humpback whales (n=176) and from Antarctic Peninsula surroundings
(n=77). A total of 61, 17 and 13 haplotypes were determined in the Brazilian, Antarctic
Area I and II respectively. The genetic variability of the Brazilian breeding area was high,
similar to that from other Southern Hemisphere breeding grounds. The phylogenetic tree
using also sequences from the GenBank found a new clade (named BR) constituted by
Brazilian sequences and a sequence from Eastern Australia (EA11). The proportion of
sharing haplotypes and the genetic distance showed a greater similarity between the
Antarctic grounds than between Brazil and any of these areas. These results indicate that
humpback whale populations from the Antarctic Area I and II seem to have no clear
differentiation and that the boundaries between Areas I and II as currently defined by the
International Whaling Commission may be shifted to the east. We suggest that the feeding
area of the Brazilian humpback whale population is not in the Antarctic Peninsula or near it
but may be located in the eastern part of Area II, in the Weddell Sea or near South Georgia
Island. However, further analyses are needed and will be conducted before specific
recommendations for boundaries are made.
5
Introduction In the Southern Hemisphere, it is generally accepted that humpback whales
(Megaptera novaeangliae) have seven distinct breeding areas, distributed along continents
or islands or in shallow banks in tropical latitudes.
At the beginning of the austral summer, each of these ‘stocks’ migrate to specific
feeding grounds in high-latitude Antarctic waters (Dawbin 1966; Whitehead & Moore,
1982; Baker et al. 1995; Clapham & Mead 1999). The longitudinal boundaries of such
areas – as well as the knowledge about the distribution of blue whales (Balaenoptera
musculus) - have led the International Whaling Commission to establish political units for
commercial whaling in the region (Tonnessen & Johnsen 1982). Since 1957 the limits of
six feeding grounds in Antarctic waters, known as Areas I to VI, were accepted by the
International Whaling Comission and in 1974/75 season they were included in the
“official” schedule of the Commission. The defined Antarctic Areas I and II were located
respectively between the 120º to 60º W and 60º to 0º W (Donovan 1991).
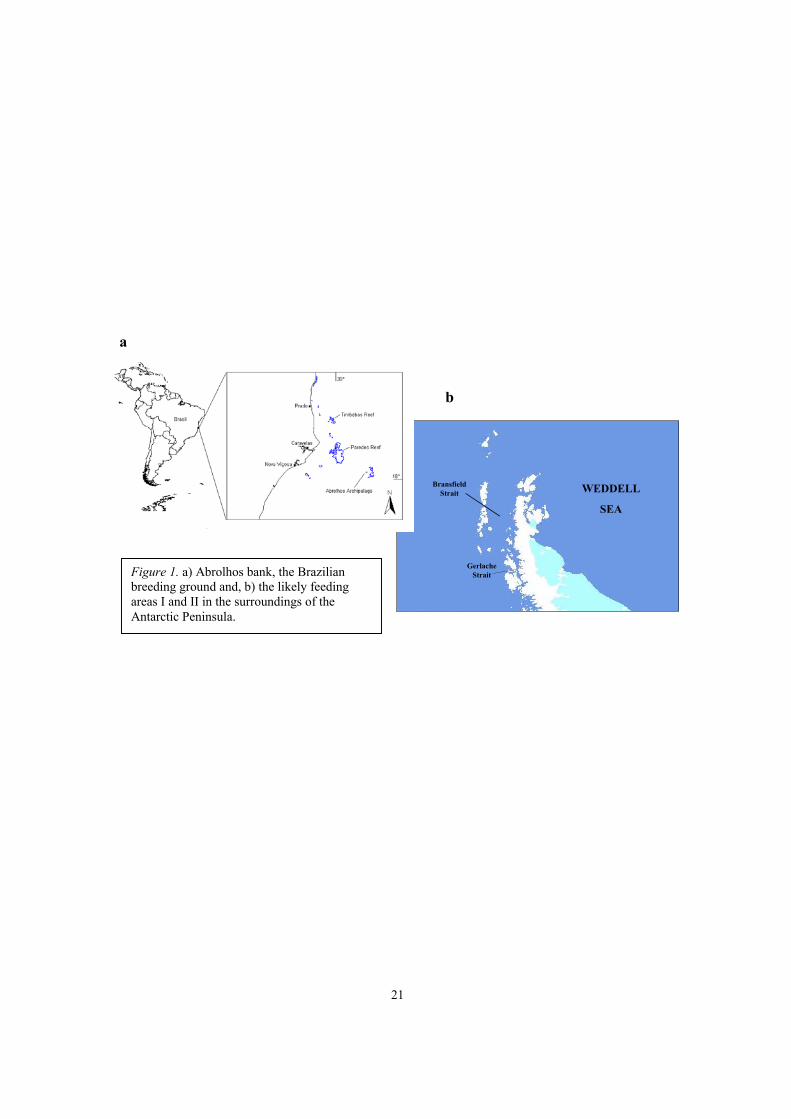
In the Southwestern Atlantic Ocean, humpback whales are found in the Abrolhos
Bank (16º40´- 19º30´S and 37º25´- 39º45´W) their main mating and calving grounds
(IBAMA/FUNATURA 1991; Engel 1996; Martins et al. 2001). Their corresponding
feeding ground in the Antarctic region, however, remains unknown, since comparisons
based in the photo-ID catalogs from the College of the Atlantic Program and Projeto Baleia
Jubarte/Humpback Whale Project – Brazil, did not result in any match between Abrolhos
and Antarctic Area I (Muñoz, pers. comm.; Projeto Baleia Jubarte, unpubl. data). The bad
conditions for navigation in the Weddell Sea have not allowed researchers to develop
comparisons with photoidentified individuals from Antarctic Area II, their most likely
feeding ground, as it is generally located due south below the Southwestern Atlantic Ocean.
At the same time, photoidentification studies (Stone et al. 1990; Capella & Flórez-González
1993; Muñoz et al. 1998) and mtDNA analyses (Caballero et al 2000; Olavarría et al, 2000)
demonstrated an evident link between the subpopulation of humpbacks that breed along the
Colombian coast and Area I in the Western part of the Antarctic Peninsula.
Commercial hunting has brought this species to the border of the extinction: the major
harvests were relatively recent and short-lived, between 1920 and 1986, a period in which,
according to Allen (1980) and Evans (1987), more than a million humpbacks, blues, fins
6
and sei whales were killed. The worldwide protection of humpback whales from hunting
was established in 1966 (Rice 1978) so the species experienced around 46 years of
intensive killing. As example of what happened in many of these concentration areas, is
actually known that the humpback whale “stock” of the Brazilian coast was extensively
hunted until the international moratorium in 1966, despite the existence of many gaps in
these records (Paiva & Grangeiro 1965; 1970).
Mitochondrial DNA has become one of the most studied regions of the mammalian
genome for the reconstruction of phylogenetic relationships and analyses of distribution
patterns within populations or species genetic variation. The advantages of the mtDNA
against other portions of the genome are due its high substitution rate, maternal inheritance
and absence of recombination (Wilson et al. 1985; Avise 1986; Lyrholm et al. 1996). The
effective population size of mtDNA genomes is one fourth that of autosomal nuclear genes,
allowing a higher rate of regional variability through random drift. (Wilson et al. 1985;
Avise 1986; Thomas et al. 1996). The analyses of the mtDNA control region provide a high
resolution view of intraspecific genetic structure in a variety of taxa, including whales
(Baker et al. 1993a), despite the hypothesis that the mtDNA rate of evolution may be lower
for some cetaceans (Baker et al., 1993b). Transition between these 2 paragraphs needed
The visual determination of gender in wild cetaceans is usually difficult, because in
most species sexual dimorphism is limited almost exclusively to body weight and lengths,
and to the location of their genital and anal regions. However, sex determination of
individuals in a population of cetaceans and the resulting knowledge of the sexual rate
constitute essential parameters to their management (Clapham 1995), as they provide
important information regarding their behavior and social structure. Glockner (1983)
described that humpback whale females exhibit a secondary sexual characteristic consisting
in a hemispheric lobe in the posterior portion of their genital region. This lobe is absent in
males. Consequently, the determination of gender of the individual humpbacks can be done
through the observation of their genital region and recorded through submarine
photography or when such animals expose this part of the body out of the water. As an
alternative to this methodology, which is very difficult to apply to animals in the wild, it
was found that the gender of cetaceans can be determined by the analysis of tissue samples,
through its karyotyping (Winn et al. 1973; Pallsboll et al. 1992) or through the cell culture
7
of such biopsies (Lambertsen et al. 1987; Pallsboll et al. 1992). In recent years, new
techniques based in sex-specific DNA sequences have been used to determine gender in
cetaceans (Baker et al. 1991; Pallsboll et al. 1992).
In this report we investigated the genetic diversity and putative migratory
connection of the Brazilian humpback whales, through molecular methods based on
mitochondrial DNA. It was also determined the sex-biased rate of the Brazilian stock and
the gender of each individual as a complement of the Projeto Baleia Jubarte/Humpback
Whale Project – Brazil catalogue, which includes 183 whales photoidentified and sexed by
molecular techniques until 2001.
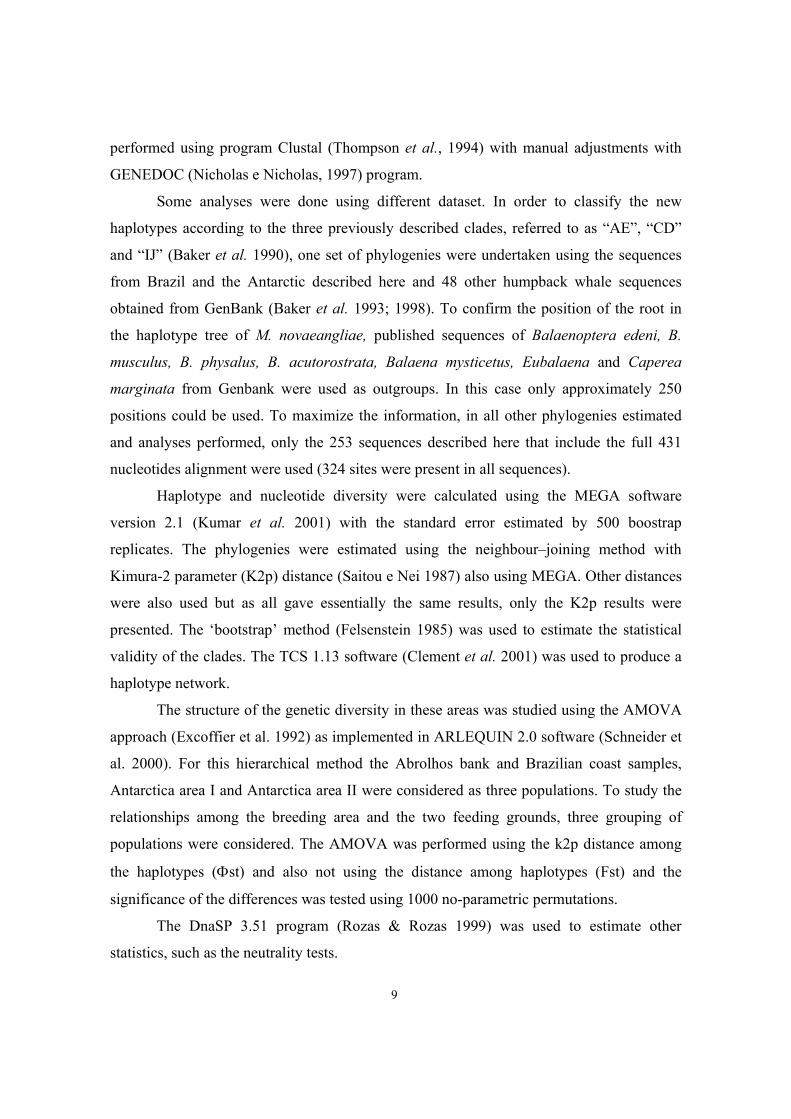
Materials and methods Sampling and mtDNA sequencing
201 skin samples of humpback whales from different social groups were collected
during the breeding seasons of 1997 through to 2001, most of it from the Abrolhos Bank
and a few as a result of strandings in Bahia and Espírito Santo States, or other locations in
the Brazilian coast (Figure 1). For each whale sampled, date, location (by Global
Positioning System), group composition, number of animals, and presence of calf were also
recorded. For sampling of live animals a Barnett Wildcat XL crossbow was used with
stainless steel biopsy darts with a 8mm diameter and a 15 mm length sampling tip. Samples
were kept in 70% ethanol or DMSO, according to the protocol established by Baker et al.
(1998).
Additional 79 skin samples were obtained in the Gerlache and Bransfield Straits and
in the Weddell Sea near the Antarctic Peninsula using the same methods described above.
These samples were obtained during the expedition organized by the Antarctic Brazilian
Program (PROANTAR) in the austral summers of the years 1999 to 2000. Following a
recent proposal of Caballero et al. (2000) of changing the limits between Antarctic areas I
and II from 60ºW to 58ºW, in this study were considered as belonging to Antarctic area II a
total of 25 samples collected very near the 58ºW boundary.
The DNA extraction of the tissue samples followed protocols modified from Baker
et al. (1993a) and Palsboll et al. (1995), with lisys of cells in 1.0 % SDS, 0.15 M of
8
sodium chloride, 10 mM Tris-HCl (pH 8.0), 1.0 mM de EDTA and digested with proteinase
K (100 µg /ml-1) at 650 C for a minimum of three hours, followed by the extraction with
phenol/chloroform and precipitation with ethanol.
A region of approximately 450 nucleotides from the most variable portion of the
control region in mtDNA was amplified, using primers Dlp-1.5 and Dlp-5 (as described in
Baker et al., 1993). Approximately 100 ng of total DNA were submitted to 35 cycles/25 µl
of reaction volume with 0.5 units of the Taq DNA polymerase enzyme, 0.2 µM of each
primer, 1.5 mM of magnesium chloride, 0.2 mM of DNTPs and 1X buffer (20 mM Tris-
HCl ph 8.4; 50 mM KCl). The amplified material was purified with shrimp alkaline
phosphatase and exonuclease I (Amersham Biociences) and sequenced with the chain
terminators method (Amershan Biosciences ET terminator kit) in a thermocycler, purified
afterwards (precipitation with ethanol) and taken to the automatic sequencer MegaBACE
1000.
Molecular determination of sex
The molecular determination of sex of 183 individuals from Abrolhos Bank and the
Brazilian coast was obtained following the protocol of Pallsboll et al. (1992) modified by
Berube and Palsboll (1996). The oligonucleotide primers ZFY0097 and ZFY1204 were
used to amplify by PCR an 1100 base pair sex-specific homologue region of the X and Y
chromosomes. One µl of total cellular DNA was amplified in a 30 µl reaction volume by 40
cycles of standard PCR. Sixteen µl of the amplified DNA was digested with TAQ I
restriction enzyme in a total solution of 20 µl. The restricted DNA was separated by
agarose gel (2%) eletrophoresis and observed by UV light after exposure to ethidium
bromide (0,5 µg/ml). The total and the social groups sexual rates were estimated and
compared with that obtained in other breeding and calving areas, and the Pearson chi-
square test with Yate´s correction was used to calculate the statistical significance of these
rates. The calves were not biopsied in this study.
Statistical methods
Each sequence was manually checked and validated using the software Chromas
(available at http://www.technelysium.com.au/index.html) and the automatic alignment was
9
performed using program Clustal (Thompson et al., 1994) with manual adjustments with
GENEDOC (Nicholas e Nicholas, 1997) program.
Some analyses were done using different dataset. In order to classify the new
haplotypes according to the three previously described clades, referred to as “AE”, “CD”
and “IJ” (Baker et al. 1990), one set of phylogenies were undertaken using the sequences
from Brazil and the Antarctic described here and 48 other humpback whale sequences
obtained from GenBank (Baker et al. 1993; 1998). To confirm the position of the root in
the haplotype tree of M. novaeangliae, published sequences of Balaenoptera edeni, B.
musculus, B. physalus, B. acutorostrata, Balaena mysticetus, Eubalaena and Caperea
marginata from Genbank were used as outgroups. In this case only approximately 250
positions could be used. To maximize the information, in all other phylogenies estimated
and analyses performed, only the 253 sequences described here that include the full 431
nucleotides alignment were used (324 sites were present in all sequences).
Haplotype and nucleotide diversity were calculated using the MEGA software
version 2.1 (Kumar et al. 2001) with the standard error estimated by 500 boostrap
replicates. The phylogenies were estimated using the neighbour–joining method with
Kimura-2 parameter (K2p) distance (Saitou e Nei 1987) also using MEGA. Other distances
were also used but as all gave essentially the same results, only the K2p results were
presented. The ‘bootstrap’ method (Felsenstein 1985) was used to estimate the statistical
validity of the clades. The TCS 1.13 software (Clement et al. 2001) was used to produce a
haplotype network.
The structure of the genetic diversity in these areas was studied using the AMOVA
approach (Excoffier et al. 1992) as implemented in ARLEQUIN 2.0 software (Schneider et
al. 2000). For this hierarchical method the Abrolhos bank and Brazilian coast samples,
Antarctica area I and Antarctica area II were considered as three populations. To study the
relationships among the breeding area and the two feeding grounds, three grouping of
populations were considered. The AMOVA was performed using the k2p distance among
the haplotypes (Φst) and also not using the distance among haplotypes (Fst) and the
significance of the differences was tested using 1000 no-parametric permutations.
The DnaSP 3.51 program (Rozas & Rozas 1999) was used to estimate other
statistics, such as the neutrality tests.
10
Results Variability of mtDNA control region sequences
A consensus segment of 431 bp of the mtDNA control region was assembled from
176 sequences from Brazil, 46 from Antarctic Area I and 31 from Antarctic Area II. A total
of 59 polymorphic sites were identified defining 62 haplotypes in the Brazilian sample. For
the Antarctic samples, 33 and 27 segregation sites were detected defining 20 haplotypes for
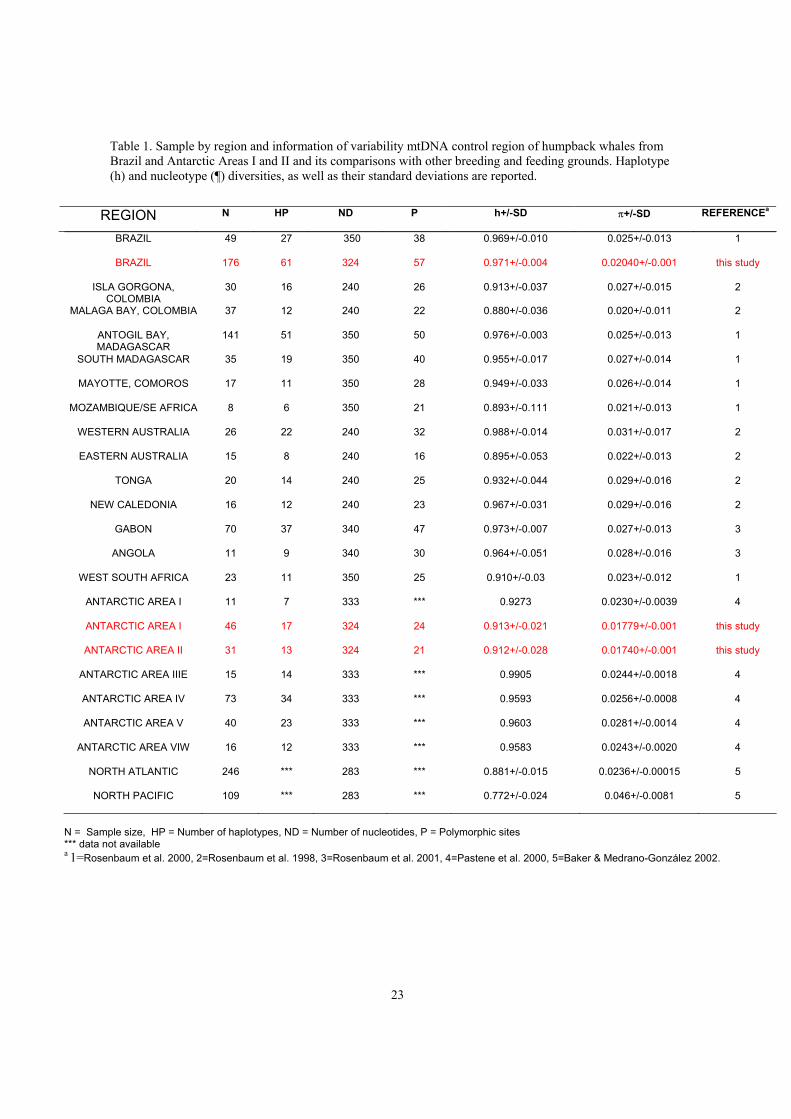
Area I and 14 for Area II, respectively. The table 1 presents these data and the nucleotide
and haplotype diversities of each one of these three sampled areas, in comparison with that
reported for other breeding and feeding grounds within the three ocean basins (North
Atlantic, North Pacific and Southern Hemisphere). The Brazilian haplotype diversity
(h=0.971) was high and similar to that found in the majority of the breeding grounds such
as the African Gabon and Antogil Bay, Madagascar (Rosenbaum et al., in prep). The
nucleotide diversity (�� � in Brazil was low, only comparable to Colombia and the overall
North Pacific sample. The Antarctic Areas I and II presented haplotype diversity values
(h=0.913 and 0.912, respectively) lower than all other feeding grounds studied, but higher
than North Atlantic and North Pacific and some Southern Ocean breeding areas. Regarding
the nucleotide diversities, we found in both Antarctic Areas a value (� = 0.017) lower then
all other area studied.
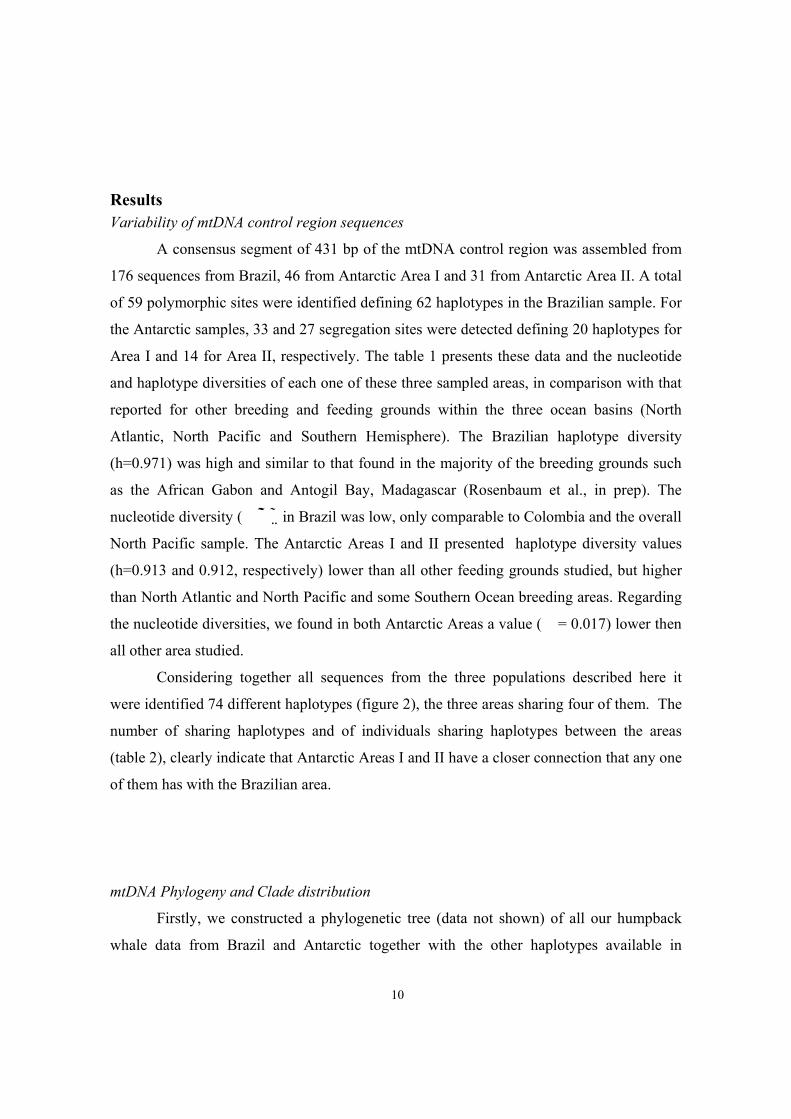
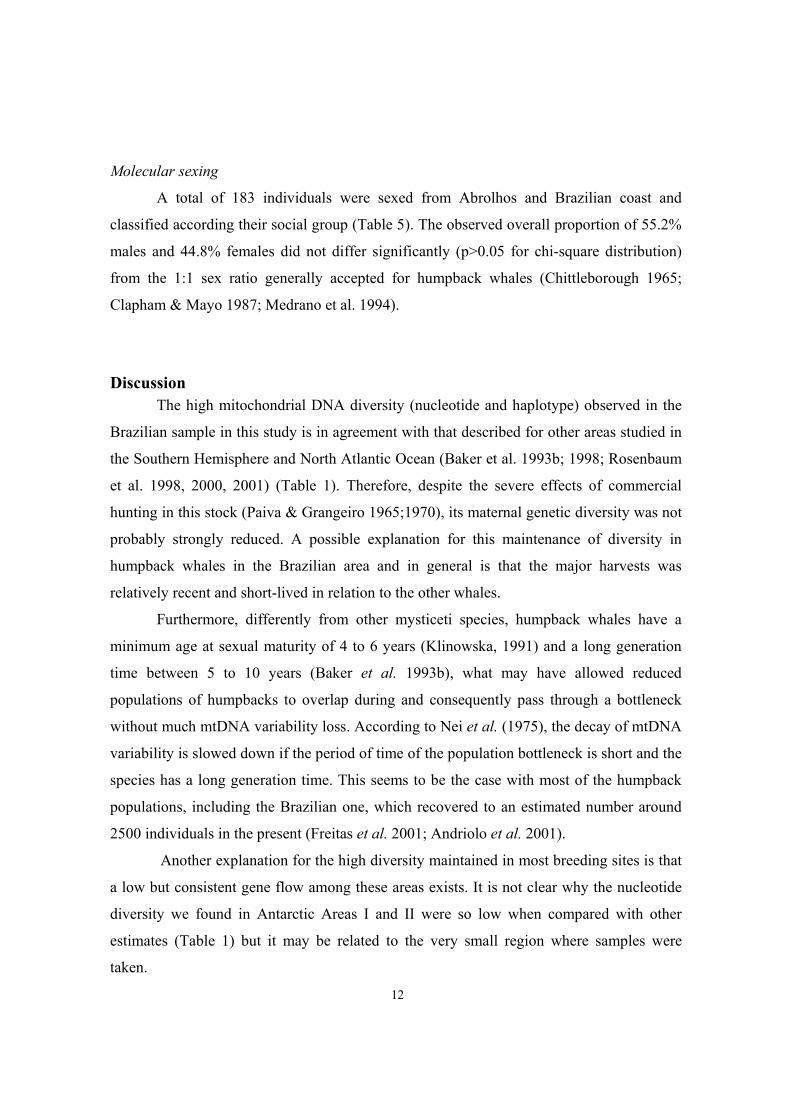
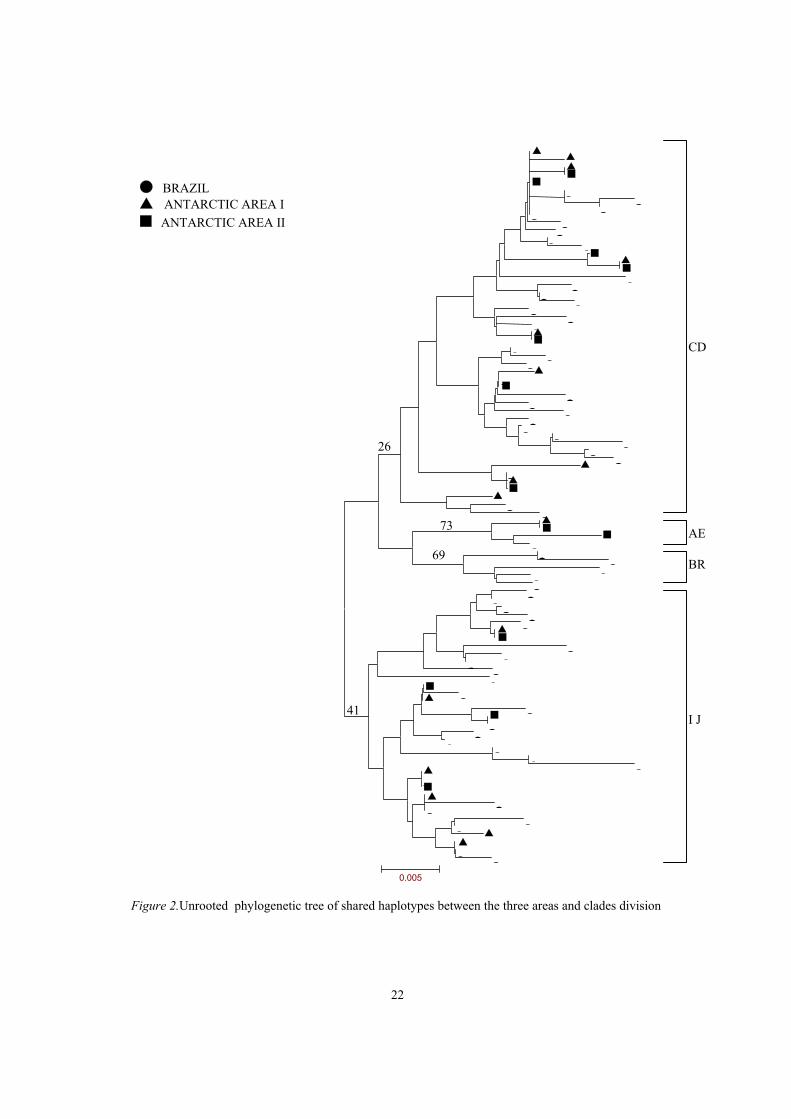
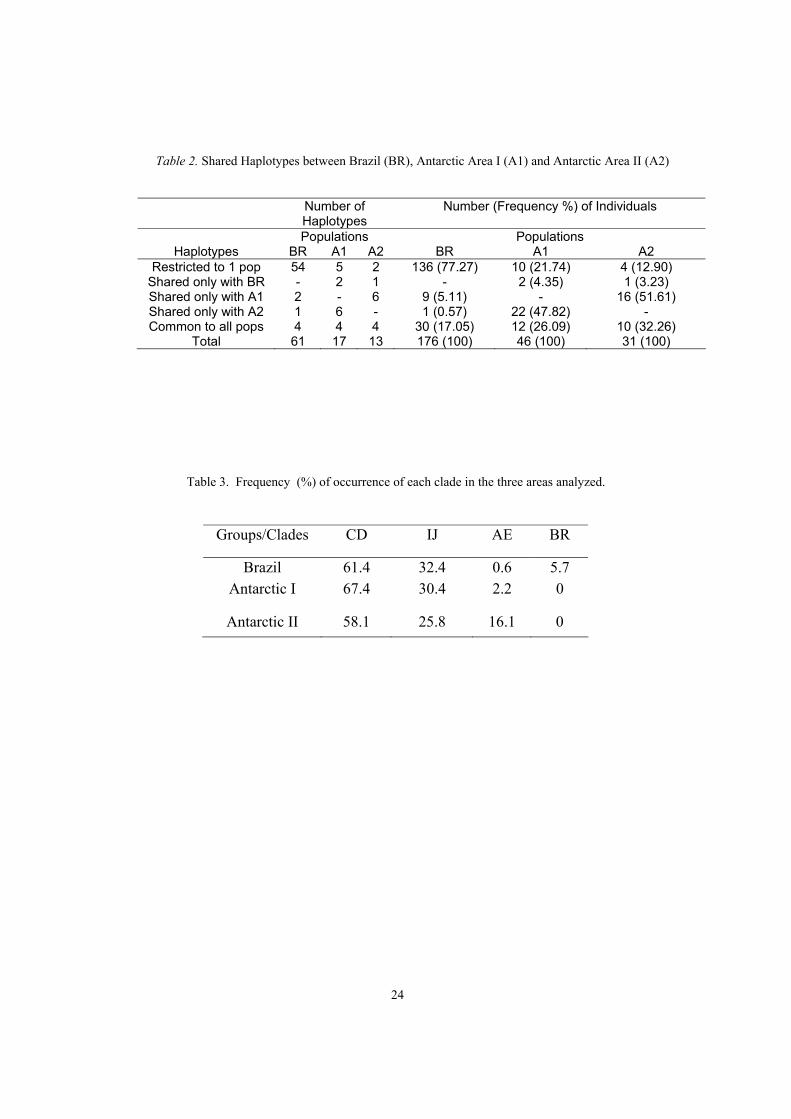
Considering together all sequences from the three populations described here it
were identified 74 different haplotypes (figure 2), the three areas sharing four of them. The
number of sharing haplotypes and of individuals sharing haplotypes between the areas
(table 2), clearly indicate that Antarctic Areas I and II have a closer connection that any one
of them has with the Brazilian area.
mtDNA Phylogeny and Clade distribution
Firstly, we constructed a phylogenetic tree (data not shown) of all our humpback
whale data from Brazil and Antarctic together with the other haplotypes available in
11
GenBank (Baker et al.1993; Baker et al. 1998) and with the outgroups. Although the
number of common sites reduced to only about 250 in this analysis, this phylogeny helped
to place our data in the context of the previously described clades. In this global tree, the
monophyletic M. novaeangliae haplotypes clustered in a few different clades (although
with low bootstrap confidence) that could be associated to the previously described AE, IJ
and CD clades (Baker et al. 1990; 1993; 1998). We found a new clade, holding a few
Brazilian sequences and EA11 (a sequence from Eastern Australia not included in any of
the other three clades in the previous studies). This clade was found in a basal position near
the outgroups and the AE clade. We named this new clade as “BR.
The phylogenetic tree built using only the Brazilian and Antarctic haplotypes
described here and one representative of each set of identical sequences presented a very
similar result (Figure 2). The same four clades were found but the bootstrap values for the
AE and BR clades were relatively high.
Similarly to what was found in other studies (what other studies), the haplotype
clades were dispersed among the populations. However, the frequency distribution for the
clades among the three populations (table 3) was significantly different (X2=21.934;
p=0.001). There is a predominance of the CD clade in all three areas while the IJ clade
presents an intermediate frequency. The AE clade had a much higher frequency in
Antarctic II in contrast to its lower occurrence in Antarctic I and in Brazil, while the BR
clade contained DNA sequences that were only found in Brazil.
Within-Population Variation
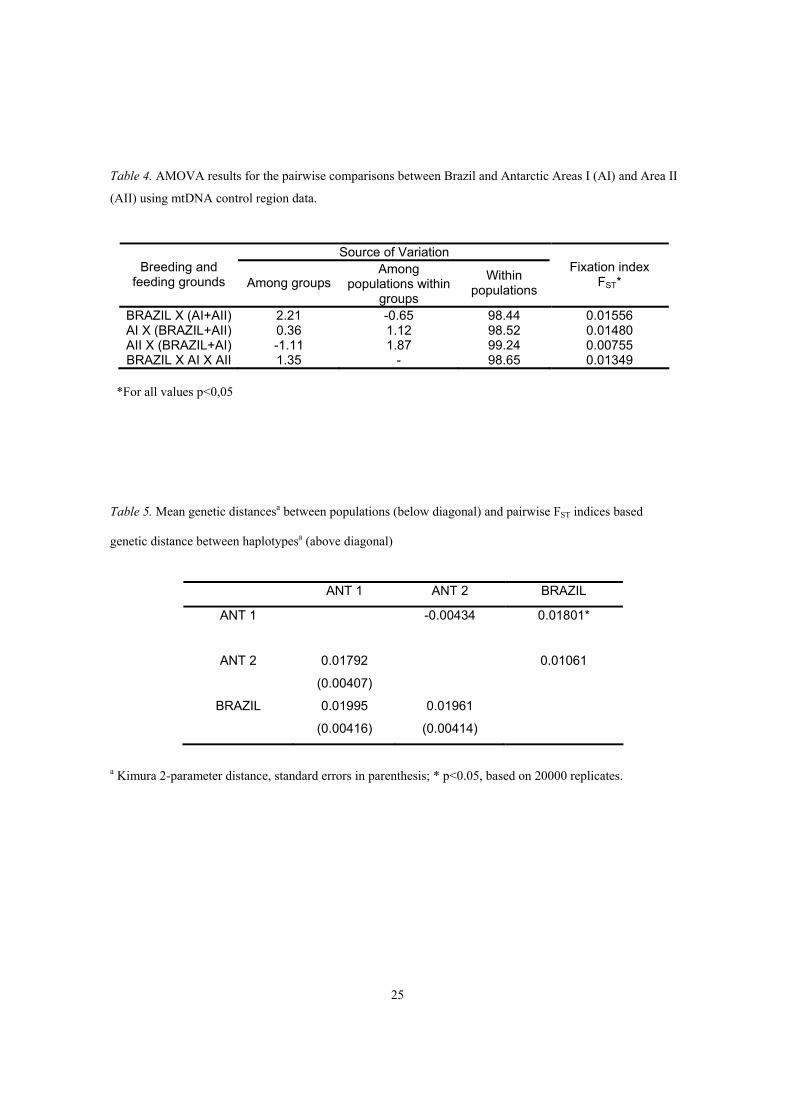
An initial AMOVA analysis without structuring the areas in groups resulted that
98% to 99% of the mtDNA variability was found within the populations (table 4).
Considering the three different grouping of these populations, the higher among groups
variation, 2.2%, was obtained when we compare Brazil against the two Antarctic feeding
areas. However, in all the simulations, the FST fixation indices were statistically significant
(table 4). Corroborating these results, the analysis of the Kimura 2-parameter genetic
distance between the two Antarctic areas (0.018) was lower than between Brazil and any
one of the two Antarctic feeding Areas (0.02) (table 5).
12
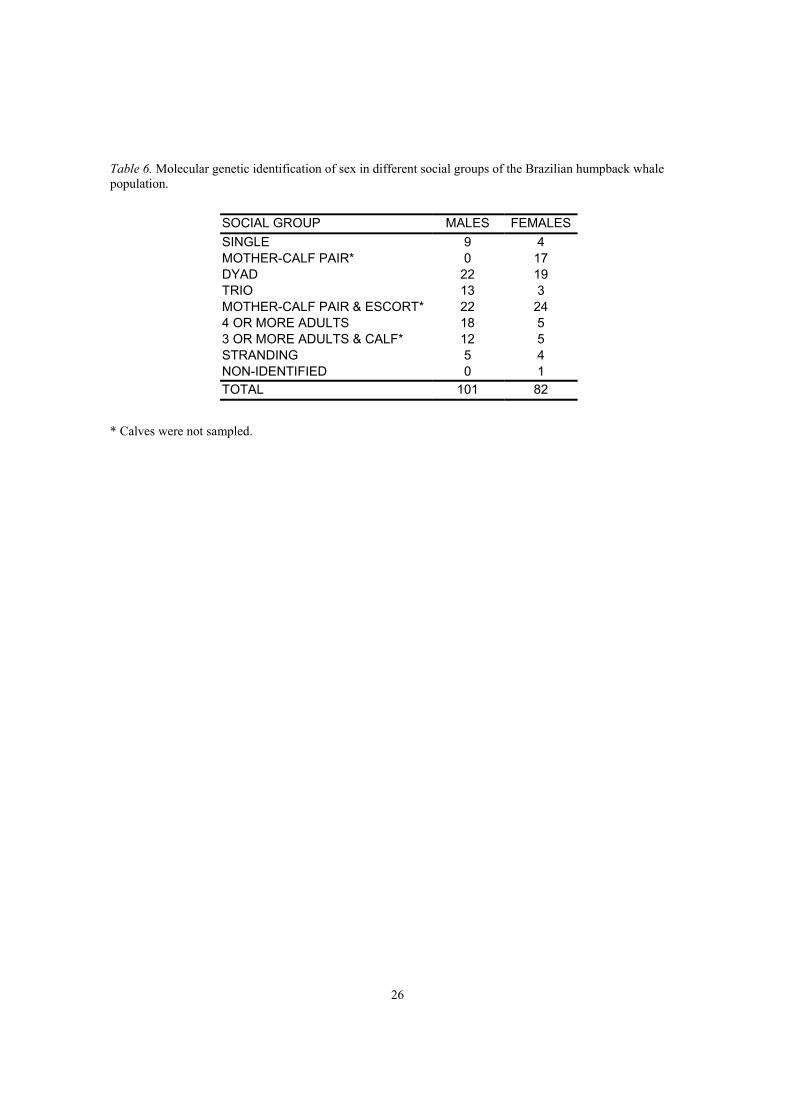
Molecular sexing
A total of 183 individuals were sexed from Abrolhos and Brazilian coast and
classified according their social group (Table 5). The observed overall proportion of 55.2%
males and 44.8% females did not differ significantly (p>0.05 for chi-square distribution)
from the 1:1 sex ratio generally accepted for humpback whales (Chittleborough 1965;
Clapham & Mayo 1987; Medrano et al. 1994).
Discussion The high mitochondrial DNA diversity (nucleotide and haplotype) observed in the
Brazilian sample in this study is in agreement with that described for other areas studied in
the Southern Hemisphere and North Atlantic Ocean (Baker et al. 1993b; 1998; Rosenbaum
et al. 1998, 2000, 2001) (Table 1). Therefore, despite the severe effects of commercial
hunting in this stock (Paiva & Grangeiro 1965;1970), its maternal genetic diversity was not
probably strongly reduced. A possible explanation for this maintenance of diversity in
humpback whales in the Brazilian area and in general is that the major harvests was
relatively recent and short-lived in relation to the other whales.
Furthermore, differently from other mysticeti species, humpback whales have a
minimum age at sexual maturity of 4 to 6 years (Klinowska, 1991) and a long generation
time between 5 to 10 years (Baker et al. 1993b), what may have allowed reduced
populations of humpbacks to overlap during and consequently pass through a bottleneck
without much mtDNA variability loss. According to Nei et al. (1975), the decay of mtDNA
variability is slowed down if the period of time of the population bottleneck is short and the
species has a long generation time. This seems to be the case with most of the humpback
populations, including the Brazilian one, which recovered to an estimated number around
2500 individuals in the present (Freitas et al. 2001; Andriolo et al. 2001).
Another explanation for the high diversity maintained in most breeding sites is that
a low but consistent gene flow among these areas exists. It is not clear why the nucleotide
diversity we found in Antarctic Areas I and II were so low when compared with other
estimates (Table 1) but it may be related to the very small region where samples were
taken.
13
The frequency of CD clade haplotypes in the Brazilian area was high (61.4%),
similar to that found in Eastern Australia and Tonga, and Western Australia region (Baker
et al. 1993a). The clade IJ in the Southern Hemisphere was most frequently observed in
Western Australia but was found in 32.4% of the Brazilian samples. Colombia and the
Antarctic Peninsula were the only regions of the Southern Hemisphere where the clade AE
has been found so far (Caballero et al. 2000). Our results corroborate its occurrence in the
Antarctic and include also the Brazilian breeding region in its distribution, although in a
very low frequency (0.05%). We suggest the existence of a new mitochondrial clade
labeled BR, comprising five haplotypes from 10 individuals found in the Brazilian coast
plus the Eastern Australia haplotype EA11. This suggests that this clade may occur in other
southern hemisphere populations, but this conclusion should wait until more sequences
from this region render publicly available for comparisons.
The AMOVA analyses indicate a lower differentiation between Antarctic Areas I
and II when both compared with the Brazilian population. The results of population
pairwise FSTs also corroborate the AMOVA results, obtaining a lower genetic distance
between Antarctic Areas I and II than between Brazil and any of these feeding grounds.
Moreover, the proportion of shared haplotypes between Brazil and both the Antarctic areas
(n=4) and between Brazil and each Antarctic areas separately (table 2) may be considered
very low if we take the example of the Colombia breeding area and Antarctic Area I (17
over 37), whose migratory connection is well know. Such results imply that Antarctic
Areas I and Area II as sampled here, near the Antarctic Peninsula (Figure 1) do not
constitute the feeding ground of the Brazilian humpback whales.
However, the cause of the greater similarity found between the Antarctic
populations and its dissimilarity with the Brazilian animals may be related to the collecting
places and the limits between Area I and II. In the present study and all other we know
about, the sampling of biopsies were in the west of the Antarctic Peninsula (Area I) and in
Area II, almost always very near the peninsula (in most of cases between the 60ºW and
56ºW), as the bad conditions of navigation in most of that region difficult the development
of research cruises to collect biopsies and photoidentification data. It is possible that the
Brazilian population of humpback whales feed somewhere in the middle of the Weddell
Sea or near to South Georgia Island, in the east part of the Antarctic Area II, far from the
14
place where the majority of the collects of samples were done. Therefore, our data suggests
that, at least for the humpback whale, the 60ºW or even the 58ºW limit (as suggested by
Olavarria et al. 2000) between Areas I and II stocks may be inappropriate and that this limit
should be pushed somewhere farther to the east(too early to state this based on the analysis
and level of sampling). The tagging of whales with satellite transmissors during the
breeding season close to Abrolhos bank constitute another way to help to test this
hypothesis.
Although the observed proportion of males and females in the Brazilian sample did
not differ significantly, an overall higher number of males was found (table 5), as usually
observed in humpback whale breeding areas due to the different pattern of migration in
males versus females (Palumbi & Baker 1994; Craig & Herman 1997). According to the
first authors, females apparently visit the winter grounds less frequently than do males,
resulting in a surplus of males. This strategy aim to increase the female's probability of
reproductive success by maximizing the time spent on the feeding grounds, as the energy
costs of migration and lactation for long periods, plus the absence of food sources, is
formidable.
The sex composition of the various social groups studied here were in agreement
with the expected values. For example, the high predominance of males in surface-active
groups and trios corroborates the observations described in Clapham (1996) such as that
mature females usually are distributed separately each other aiming to increase the
possibility of interaction with many males and that the males are usually forming short-
period groups where they are engaged in the competition to copulate with the female. The
four single females registered probably were immature or already pregnant animals;
otherwise escorts or calves likely would accompany them. An almost equal proportion of
male and females composed the dyads, which were often observed in mating and courtship
behaviors. Of the nine stranded animals, one was rescued alive but the other eight were
dead whales and many were in an advanced state of decomposition, preventing visual sex
identification.
Acknowledgements
15
This study was made possible through the sponsor of Petróleo Brasileiro S.A. -
PETROBRAS, Pantanal Airlines and grants from FAPERGS and CNPq. It was done in
partnership with Instituto Brasileiro do Meio Ambiente e dos Recursos Naturais
Renováveis – IBAMA, American Museum of Natural History/USA Lerner-Gray fund and
Projeto Baleias - PROANTAR. We thank to all the staff of Instituto Baleia Jubarte and
colleagues of the Centro de Biologia Genômica e Molecular/PUCRS for their help in the
field and lab activities. Thanks also to Cristina Pomilla for her important contributions in
the lab work.
References Andriolo A, Martins CCA, Engel MH, Pizzorno JL, Más-Rosa S, Freitas A, Morete ME,
Petta CB, Kinas PG (2001) Aerial survey of humpback whale (Megaptera novaeangliae) to
estimate abundance in the breeding ground, Brazil: preliminary results. Paper SC/54/H5
presented to the IWC Scientific Committee, 2001 (unpublished), 10 pp.
Arnason U, Gullberg A, Gretarsdottir S, Ursing B, Janke A (2000) The mitochondrial
genome of the sperm whale and a new molecular reference for estimating eutherian
divergence rates. Journal of Molecular Evolution, 50, 569-578.
Allen KR (1980) Conservation and Management of Whales. University of Washington
Press, Seattle.
Baker CS, Palumbi SR, Lambertsen RH, Weinrich MT, Calambokidis J, O´Brien SJ (1990)
Influence of seasonal migration on geographic distribution of mitochondrial DNA
haplotypes in humpback whales. Nature, 344, 238-240.
Baker, C.S, R.H. Lambertsen, M.T. Weinrich, J. Calambokidis, G. Early and S.J. O´Brien
(1991) Molecular genetic identification of the sex of humpback whales (Megaptera
novaeangliae). Rep. Int. Whal. Comm., Special Issue 13, 105-111.
Baker CS, Perry A, Bannister JL, Weinrich MT, Abernethy RB, Calambokidis J, Lien J,
Lambertsen RH, Urban-Ramirez J, Vasquez O, Clapham PJ, Alling A, O´Brien SJ,
Palumbi SR (1993a) Abundant mitochondrial DNA variation and worlwide population
structure in humpback whales. Proc. Natl. Acad. Sci. USA, 90, 8239-8243.
16
Baker CS, Gilbert DA, Weinrich MT, Lambertsen R, Calambokidis J, Mc Ardle B,
Chambers GK, O´Brien SJ (1993b) Population characteristics of DNA fingerprints in
humpback whales (Megaptera novaeangliae). The Journal of Heredity, 84(4): 281-290.
Baker CS, Flórez-González L, Rosenbaum HC, Bannister J (1995) Molecular genetic
identification of sex and stock structure among humpback whales of the southern
hemisphere. Paper SC/46/SH14 presented to the International Whaling Committee, 1995
(unpublished), 11 pp.
Baker CS, Flórez-González L, Abernethy B, Rosenbaum HC, Slade RW, Capella J,
Bannister JL (1998) Mithocondrial DNA variation and maternal gene flow among
humpback whales of the Southern Hemisphere. Marine Mammal Science, 14(4): 721-737.
Baker CS & Medrano-González L (2002) Worldwide distribution and diversity of
humpback whale mitochondrial DNA lineages. In: Molecular and Cell Biology of Marine
Mammals (eds. C.J. Pfeiffer & P.E. Nachtigall), pp. 81-106. Krieger Publishing Company,
Melbourne FL.
Berube M & Palsboll P (1996) Identification of sex in cetaceans by multiplexing using
ZFX and ZFY specific primers. Mol. Ecol., 5, 283-287.
Caballero S, Hamilton H, Flórez-González L, Capella J, Olavarría C, Rosenbaum HC,
Baker CS (2000) Stock identity and diversity of humpback whale mitochondrial DNA
lineages on the Colombian winter breeding grounds. Paper SC/52/IA14 presented to the
IWC Scientific Committee, 2000 (unpublished), 08 pp.
Capella J & Flórez-González L (1993) Tras el rastro de la ballena jorobada. Boletín
Antártico Chileno, pp 2-4.
Chittleborough RG (1965) Dynamics of two populations of the humpback whale,
Megaptera novaeangliae (Borowski). Aust. J. Mar. Freshwater Res., 16, 33-128.
Clapham PJ & Mayo CA (1987) Reproduction and recruitment of individually identified
humpback whales, Megaptera novaeangliae, observed in Massachussets Bay, 1979-
1985.Can. J. Zool., 65, 2853-2863.
Clapham PJ (1995) Sex ratio of the Gulf of Maine humpback whale population. Marine
Mammal Science, 11 (2), 227-231.
Clapham PJ (1996) The social and reproductive biology of humpback whales:na ecological
perspective. Mammal Review, 26(1), 27-49.
17
Clapham PJ & Mead JG (1999) Megaptera novaeangliae. Mammalian Species 604, 1-9.
Clement M, Posada D, Crandall KA (2000) TCS: a computer program to estimate gene
genealogies. Molecular Ecology 9 (10), 1657-1660.
Dawbin W (1966) The seasonal migratory cycle of the humpback whale. In: Whales,
Dolphins and Porpoises. (ed. Norris KS), pp 145-170.University of California Press,
Berkeley.
Donovan GP (1991) A Review of IWC Stock Boundaries. Report of the International
Whaling Comission, Special Issue 13, 39-68.
Engel MH (1996) Comportamento reprodutivo da baleia jubarte (Megaptera novaeangliae)
em Abrolhos. Anais de Etologia, 14, 275-284.
Evans PGH (1987) The Natural History of Whales and Dolphins. Facts on File Publ., New
York.
Excoffier L, Smouse PE, Quattro J (1992) Analysis of molecular variance inferred from
metric distances among DNA haplotypes: application to human mitochondrial DNA data.
Genetics,131, 479-491.
Felsenstein J (1985) Confidence limits on phylogenies: an approach using the bootstrap.
Evolution, 39, 783-791.
Filatov DA (2001) Processor of Sequences Manual. University of Birmingham, England.
(available at http://www.biosciences.bham.ac.uk/labs/filatov/proseq.html)
Freitas A C, Kinas PG, Martins CCA, Engel MH (2001) Population estimate for humpback
whales from Abrolhos bank, Brazil wintering ground in the Southwestern Atlantic ocean.
Paper SC/54/H11 presented to the IWC Scientific Committee, 2001 (unpublished). 11pp.
Glockner DA (1983) Determining the sex of humpback whales (Megaptera novaeangliae)
in their natural envinronment. AAAS Sel. Symp., 76, 447-464.
IBAMA/FUNATURA (1991) Plano de Manejo: Parque Nacional Marinho dos Abrolhos.
IBAMA, Brasília.
Klinowska, M. (Comp.) 1991. Dolphins, Porpoises and Whales of the World. Gland: IUCN
Red Data Book. Gland, SW.
Kumar S, Tamura K, Jakobsen IB, Masatoshi N (2001) MEGA2: Molecular Evolutionary
Genetics Analysis Software. Arizona State University, Tempe, Arizona, USA.
18
Lambertsen RH (1987) A biopsy system for large whales and its use for cytogenetics. J.
Mamm., 68, 443-445.
Lyrholm T, Leimar O, Gyllensten U (1996) Low diversity and biased substitution patterns
in the mitochondrial DNA control region of sperm whales: implications for estimates of
time since common ancestry. Mol. Biol. Evol. ,13 (10), 1318-1326.
Martins CCA, Morete ME, Engel MH, Freitas A, Secchi ER, Kinas PG (2001) Aspects of
habitat use patterns of humpback whales in the Abrolhos bank, Brazil, breeding ground.
Memoirs of the Queensland Museum, 47(2), 563-570.
Medrano L, Salinas M, Salas I, Ladrón de Guevara P, Aguayo A (1994) Sex identification
of humpback whales, Megaptera novaeangliae, on the wintering grounds of the Mexican
Pacific Ocean. Can. J. Zool., 72, 1771-1774.
Muñoz E, Félix F, Flórez-González L, Hasse B, Katona S, Lodi L, Mc Oscker M,
Robertson K, Stevick P, Siciliano S (1998) Migration of individually identified humpback
whales Megaptera novaeangliae between the Antarctic peninsula and South America. Paper
presented at the World Marine Mammal Science Conference, Monaco, 20-24 January.
Nicholas KB & HB Nicholas (1997) GeneDoc: A Tool for Editing and Annotating Multiple
Sequence Alignments. (available at www.psc.edu/biomed/genedoc).
Olavarría C, Baker CS, Medrano L, Aguayo A, Caballero S, Flórez-González L, Capella J,
Rosenbaum HC, Garrigue C, Greaves J, Bannister JL, Jenner M, Jenner C (2000) Stock
identity of Antarctic peninsula humpback whales inferred from mtDNA variation. Paper
SC/52/IA15 presented to the IWC Scientific Committee, 2000 (unpublished). 11 pp.
Paiva MP & Grangeiro BF (1965) Biological investigations on the whaling seasons 1960-
1963, off northeastern coast of Brazil. Arquivos da Estação de Biologia Marinha da
Universidade do Ceará, 5(1), 24-64.
Paiva MP & Grangeiro BF (1970) Investigations on the whaling seasons 1964-1967 off
northeastern coast of Brazil. Arquivos de Ciências do Mar, 10(2), 111-126.
Pallsboll PJ, Vader A, Bakke I, El-Gewely MR (1992) Determination of gender in
cetaceans by polymerase chain reaction. Canadian Journal of Zoology, 70, 2166-2170.
Palsboll PJ, Clapham PJ, Mattila DK, Larsen F, Sears R, Siegismund HR, Sigurjónsson J,
Vásquez O, Artander P (1995) Distribution of mtDNA haplotypes in North Atlantic
19
humpback whales: the influence of behaviour on population structure. Marine Ecology
Progress Series, 116, 1-10.
Palumbi S, Martin A, Romano S, McMillan WO, Stice L, Grabowski G (1991) The Simple
Fool´s Guide to PCR, v. 2.0. Dept. of Zoology, University of Hawaii, Honolulu.
Rice DW (1978) The humpback whale in the North Pacific: distribution, exploitation, and
numbers. In: Report on a Workshop on Problems Related to Humpback Whales (Megaptera
novaeangliae) in Hawaii, (eds. K.S.Norris & R. Reeves), pp.29-44. U.S. Marine Mammal
Commission, Washington, DC.
Rosenbaum HC, Razafindrakoto Y, Flórez-González L, Capella J, Garrigue C, Greaves J,
Jenner C, Jenner M-N, Robles-Saavedra MR, De Salle R, Baker CS (1998) Variation and
geographic structure of humpback whale mitochondrial DNA from the wintering grounds
of Areas III, IV, V and VI in the Southern Hemisphere. Paper SC/50/CAWS35 presented to
the IWC Scientific Committee, 1998 (unpublished). 9 pp.
Rosembaum HC, Best PB, Findlay KP, Engel MH, Pomilla C, Razafindrakoto Y, Morete
ME, Vely M, Freitas AC, Baker CS, Jenner C, Jenner M-N, Bannister J (2000)
Mitochondrial DNA variation among humpback whales from the wintering grounds in the
South Atlantic and Southwestern Indian Oceans. Paper SC/52/IA11 presented to the IWC
Scientific Committee, 2000 (unpublished). 13 pp.
Rosenbaum HC, Best PB, Pomilla C (2001) A preliminary analysis of mtDNA variation
among humpback whales of the southeastern Atlantic Ocean from the wintering grounds
along the coast of west Africa. Paper SC/53/IA32 presented to the IWC Scientific
Committee, 2001 (unpublished). 8 pp.
Rozas J & Rozas R (1999) DnaSP version 3: an integrated program for molecular
population genetics and molecular evolution analysis. Bioinformatics, 15, 174-175.
Saitou N & Nei M (1987) The neighbor-joining method: a new method for reconstructing
phylogenetic trees. Mol. Biol. Evol., 4, 406-425.
Schneider S, Roessli D, Excoffier L (2000) Arlequin v. 2.000: A Software for Population
Genetics Data Analysis. Genetics and Biometry Laboratory, University of Geneva,
Switzerland.
Stone GS, Flórez-González L, Katona S (1990) Whale migration record. Nature, 346, 705.
20
Tamura K & Nei M (1993) Estimation of the number of nucleotide substitutions in the
control region of mitochondrial DNA in humans and chipanzees. Mol. Biol. Evol., 10, 512-
526.
Thompson JD, Higgins DG, Gibson TJ (1994) Clustal W: improving the sensitivity of
progressive multiple sequence alignment through sequence weighting, positions-specific
gap penalties and weight matriz choice. Nucl. Acids Res., 22, 4673-4680.
Tonnessen JN & Johnsen AO (1982) The History of modern whaling. University of
California Press, Berkeley.
Whitehead H & Moore MJ (1982) Distribution and movements of West Indian humpback
whales in winter. Canadian Journal of Zoology, 60, 2203-2211.
Wilson AC, Cann RL, Carr SM et al. (11 co-authors). Mitochondrial DNA and two
perspectives on evolutionary genetics. Biol. J. Linn. Soc. 26, 375-400.
Winn HE, Bischoff WL, Taruski AG (1973) Cytological sexing of Cetacea. Mar. Biol. 23,
343-346.
21
WEDDELL
SEA
BransfieldStrait
GerlacheStraitFigure 1. a) Abrolhos bank, the Brazilian
breeding ground and, b) the likely feeding areas I and II in the surroundings of the Antarctic Peninsula.
a
b
22
Figure 2.Unrooted phylogenetic tree of shared haplotypes between the three areas and clades division
CD
▲ ▲ ▲ ■
■ ●
● ●
● ●
● ●
● ■ ▲ ■
●
● ●
● ●
● ● ▲ ■
●
● ● ▲
● ■
● ●
● ●
● ●
● ●
● ▲ ● ▲ ■
▲ ●
● ▲ ■
■ ●
● ●
● ● ●
● ●
● ●
● ▲■
●
● ●
● ● ■
● ▲
● ■
●
● ●
● ●
● ▲ ● ■ ▲
● ●
● ● ▲ ▲ ●
●0.005
AE
BR
I J
26
41
69
73
● BRAZIL ▲ ANTARCTIC AREA I ■ ANTARCTIC AREA II
23
Table 1. Sample by region and information of variability mtDNA control region of humpback whales from Brazil and Antarctic Areas I and II and its comparisons with other breeding and feeding grounds. Haplotype (h) and nucleotype (¶) diversities, as well as their standard deviations are reported.
N = Sample size, HP = Number of haplotypes, ND = Number of nucleotides, P = Polymorphic sites *** data not available a 1=Rosenbaum et al. 2000, 2=Rosenbaum et al. 1998, 3=Rosenbaum et al. 2001, 4=Pastene et al. 2000, 5=Baker & Medrano-González 2002.
BRAZIL 49 27 350 38 0.969+/-0.010 0.025+/-0.013 1
BRAZIL 176 61 324 57 0.971+/-0.004 0.02040+/-0.001 this study
ISLA GORGONA, COLOMBIA
30 16 240 26 0.913+/-0.037 0.027+/-0.015 2
MALAGA BAY, COLOMBIA 37 12 240 22 0.880+/-0.036 0.020+/-0.011 2
ANTOGIL BAY, MADAGASCAR
141 51 350 50 0.976+/-0.003 0.025+/-0.013 1
SOUTH MADAGASCAR 35 19 350 40 0.955+/-0.017 0.027+/-0.014 1
MAYOTTE, COMOROS 17 11 350 28 0.949+/-0.033 0.026+/-0.014 1
MOZAMBIQUE/SE AFRICA 8 6 350 21 0.893+/-0.111 0.021+/-0.013 1
WESTERN AUSTRALIA 26 22 240 32 0.988+/-0.014 0.031+/-0.017 2
EASTERN AUSTRALIA 15 8 240 16 0.895+/-0.053 0.022+/-0.013 2
TONGA 20 14 240 25 0.932+/-0.044 0.029+/-0.016 2
NEW CALEDONIA 16 12 240 23 0.967+/-0.031 0.029+/-0.016 2
GABON 70 37 340 47 0.973+/-0.007 0.027+/-0.013 3
ANGOLA 11 9 340 30 0.964+/-0.051 0.028+/-0.016 3
WEST SOUTH AFRICA 23 11 350 25 0.910+/-0.03 0.023+/-0.012 1
ANTARCTIC AREA I 11 7 333 *** 0.9273 0.0230+/-0.0039 4
ANTARCTIC AREA I 46 17 324 24 0.913+/-0.021 0.01779+/-0.001 this study
ANTARCTIC AREA II 31 13 324 21 0.912+/-0.028 0.01740+/-0.001 this study
ANTARCTIC AREA IIIE 15 14 333 *** 0.9905 0.0244+/-0.0018 4
ANTARCTIC AREA IV 73 34 333 *** 0.9593 0.0256+/-0.0008 4
ANTARCTIC AREA V 40 23 333 *** 0.9603 0.0281+/-0.0014 4
ANTARCTIC AREA VIW 16 12 333 *** 0.9583 0.0243+/-0.0020 4
NORTH ATLANTIC 246 *** 283 *** 0.881+/-0.015 0.0236+/-0.00015 5
NORTH PACIFIC 109 *** 283 *** 0.772+/-0.024 0.046+/-0.0081 5
REGION N HP ND P h+/-SD π+/-SD REFERENCEa
24
Table 2. Shared Haplotypes between Brazil (BR), Antarctic Area I (A1) and Antarctic Area II (A2)
Number of Haplotypes
Number (Frequency %) of Individuals
Populations Populations Haplotypes BR A1 A2 BR A1 A2
Restricted to 1 pop 54 5 2 136 (77.27) 10 (21.74) 4 (12.90) Shared only with BR - 2 1 - 2 (4.35) 1 (3.23) Shared only with A1 2 - 6 9 (5.11) - 16 (51.61) Shared only with A2 1 6 - 1 (0.57) 22 (47.82) - Common to all pops 4 4 4 30 (17.05) 12 (26.09) 10 (32.26)
Total 61 17 13 176 (100) 46 (100) 31 (100)
Table 3. Frequency (%) of occurrence of each clade in the three areas analyzed.
Groups/Clades CD IJ AE BR
Brazil 61.4 32.4 0.6 5.7 Antarctic I 67.4 30.4 2.2 0
Antarctic II 58.1 25.8 16.1 0
25
Table 4. AMOVA results for the pairwise comparisons between Brazil and Antarctic Areas I (AI) and Area II
(AII) using mtDNA control region data.
Source of Variation Breeding and
feeding grounds Among groups Among
populations within groups
Within populations
Fixation index FST*
BRAZIL X (AI+AII) 2.21 -0.65 98.44 0.01556 AI X (BRAZIL+AII) 0.36 1.12 98.52 0.01480 AII X (BRAZIL+AI) -1.11 1.87 99.24 0.00755 BRAZIL X AI X AII 1.35 - 98.65 0.01349
*For all values p<0,05
Table 5. Mean genetic distancesa between populations (below diagonal) and pairwise FST indices based
genetic distance between haplotypesa (above diagonal)
ANT 1 ANT 2 BRAZIL
ANT 1
-0.00434 0.01801*
ANT 2 0.01792
(0.00407)
0.01061
BRAZIL 0.01995
(0.00416)
0.01961
(0.00414)
a Kimura 2-parameter distance, standard errors in parenthesis; * p<0.05, based on 20000 replicates.
26
Table 6. Molecular genetic identification of sex in different social groups of the Brazilian humpback whale population.
SOCIAL GROUP MALES FEMALES SINGLE 9 4 MOTHER-CALF PAIR* 0 17 DYAD 22 19 TRIO 13 3 MOTHER-CALF PAIR & ESCORT* 22 24 4 OR MORE ADULTS 18 5 3 OR MORE ADULTS & CALF* 12 5 STRANDING 5 4 NON-IDENTIFIED 0 1 TOTAL 101 82
* Calves were not sampled.

27