capital one securities conference th annual energy … · $5,000 $10,000 $15,000 $20,000 $25,000...
TRANSCRIPT

Investor PresentationNovember 2016– December 5, 2017 –
Nasdaq Ticker: PVAC
Capital One Securities Conference 12th Annual Energy Conference
1
Certain statements contained herein that are not descriptions of historical facts are "forward-looking" statements within the meaning of Section 27A of the Securities Act of 1933, as amended, and Section 21E of theSecurities Exchange Act of 1934, as amended. Words such as “expects,” “guidance,” “will,” “plan,”, “anticipate”, “intend”, “opportunistic” and variations of such words or similar expressions are used to identify forward-looking statements. Because such statements include risks, uncertainties and contingencies, actual results may differ materially from those expressed or implied by such forward-looking statements. These risks,uncertainties and contingencies include, but are not limited to, the following: risks related to the recently completed acquisition and our ability to realize expected benefits of the acquisition; potential adverse effects of thecompleted bankruptcy proceedings on our liquidity, anticipation of resource potential, results of operations, business prospects, ability to retain financing and other risks and uncertainties related to our emergence frombankruptcy; our ability to satisfy our short-term and long-term liquidity needs, including our ability to generate sufficient cash flows from operations or to obtain adequate financing to fund our capital expenditures and meetworking capital needs; negative events or publicity adversely affecting our ability to maintain our relationships with our suppliers, service providers, customers, employees, and other third parties; the occurrence of unusualweather or operating conditions, including force majeure events and hurricanes; new capital structure and the adoption of fresh start accounting, including the risk that assumptions and factors used in estimating enterprisevalue may vary significantly from the current estimates in connection with the application of fresh start accounting; plans, objectives, expectations and intentions contained in this presentation that are not historical; our abilityto execute our business plan in the current commodity price environment; any decline in and volatility of commodity prices for oil, NGLs, and natural gas; our anticipated production and development results; our ability todevelop, explore for, acquire and replace oil and natural gas reserves and sustain production; our ability to generate profits or achieve targeted reserves in our development and exploratory drilling and well operations; anyimpairments, write-downs or write-offs of our reserves or assets; the projected demand for and supply of oil, NGLs and natural gas; our ability to contract for drilling rigs, frac crews, supplies and services at reasonablecosts; our ability to obtain adequate pipeline transportation capacity for our oil and gas production at reasonable cost and to sell the production at, or at reasonable discounts to, market prices; the uncertainties inherent inprojecting future rates of production for our wells and the extent to which actual production differs from that estimated in our proved oil and natural gas reserves; drilling and operating risks; concentration of assets; our abilityto compete effectively against other oil and gas companies; leasehold terms expiring before production can be established and our ability to replace expired leases; costs or results of any strategic initiatives; environmentalobligations, results of new drilling activities, locations and methods, costs and liabilities that are not covered by an effective indemnity or insurance; the timing of receipt of necessary regulatory permits; the effect ofcommodity and financial derivative arrangements and counterparty risk related to the ability of parties to meet their future obligations; our ability to retain or attract senior management and key employees; compliance withand changes in governmental regulations or enforcement practices, especially with respect to environmental, health and safety matters; physical, electronic and cybersecurity breaches; litigation that impacts us, our assetsor our midstream service providers; uncertainties relating to general domestic and international economic and political conditions; and other risks set forth in our most recent annual report on Form 10-K, quarterly reports onForm 10-Q and other filings with the SEC.
Additional information concerning these and other factors can be found in our press releases and public filings with the SEC, including our most recent annual report on Form 10-K and quarterly reports on Form 10-Q. Manyof the factors that will determine our future results are beyond the ability of management to control or predict. Readers should not place undue reliance on forward-looking statements, which reflect management's views onlyas of the date hereof. The statements in this presentation speak only as of the date of this presentation. We undertake no obligation to revise or update any forward-looking statements, or to make any other forward-lookingstatements, whether as a result of new information, future events or otherwise, except as may be required by applicable law.
Oil and Gas ReservesStatements of reserves are only estimates and may not correspond to the ultimate quantities of oil and gas recovered. Investors are urged to consider closely the disclosure in Penn Virginia’s Annual Report on Form 10-Kfor the fiscal year ended December 31, 2016 and subsequent Quarterly Reports on Form 10-Q, which are available on its website at www.pennvirginia.com under Investors – SEC Filings. You can also obtain these reportsfrom the SEC’s website at www.sec.gov.
DefinitionsProved reserves are those quantities of oil and gas which, by analysis of geosciences and engineering data, can be estimated with reasonable certainty to be economically producible from a given date forward, from knownreservoirs, and under existing economic conditions, operating methods and government regulation before the time at which contracts providing the right to operate expire, unless evidence indicates that renewal isreasonably certain, regardless of whether the estimate is a deterministic estimate or probabilistic estimate. Probable reserves are those additional reserves that are less certain to be recovered than proved reserves, butwhich are as likely than not to be recoverable (there should be at least a 50% probability that the quantities actually recovered will equal or exceed the proved plus probable reserve estimates). Possible reserves are thoseadditional reserves that are less certain to be recoverable than probable reserves (there should be at least a 10% probability that the total quantities actually recovered will equal or exceed the proved plus probable pluspossible reserve estimates). Estimated ultimate recovery (EUR) is the sum of reserves remaining as of a given date and cumulative production as of that date. EUR is a measure that by its nature is more speculative thanestimates of reserves prepared in accordance with SEC definitions and guidelines and accordingly is less certain.
Forward Looking and Cautionary Statements
2
Penn Virginia Corporation - Company Overview
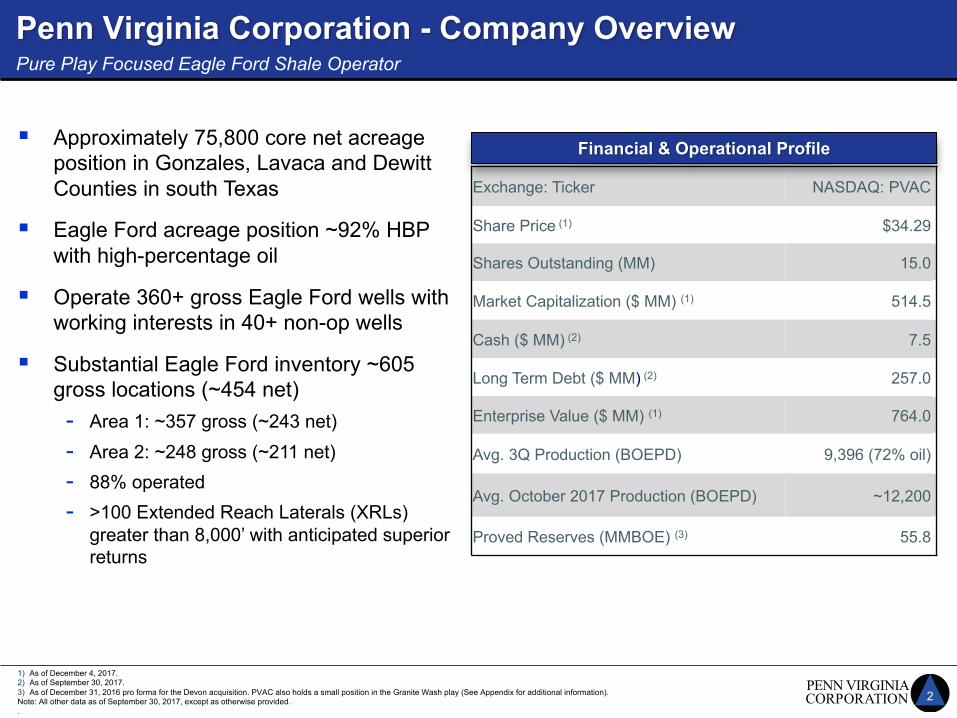
Exchange: Ticker NASDAQ: PVAC
Share Price (1) $34.29
Shares Outstanding (MM) 15.0
Market Capitalization ($ MM) (1) 514.5
Cash ($ MM) (2) 7.5
Long Term Debt ($ MM) (2) 257.0
Enterprise Value ($ MM) (1) 764.0
Avg. 3Q Production (BOEPD) 9,396 (72% oil)
Avg. October 2017 Production (BOEPD) ~12,200
Proved Reserves (MMBOE) (3) 55.8
§ Approximately 75,800 core net acreage position in Gonzales, Lavaca and Dewitt Counties in south Texas
§ Eagle Ford acreage position ~92% HBP with high-percentage oil
§ Operate 360+ gross Eagle Ford wells with working interests in 40+ non-op wells
§ Substantial Eagle Ford inventory ~605 gross locations (~454 net) - Area 1: ~357 gross (~243 net)- Area 2: ~248 gross (~211 net) - 88% operated- >100 Extended Reach Laterals (XRLs)
greater than 8,000’ with anticipated superior returns
Pure Play Focused Eagle Ford Shale Operator
Financial & Operational Profile
1) As of December 4, 2017.2) As of September 30, 2017.3) As of December 31, 2016 pro forma for the Devon acquisition. PVAC also holds a small position in the Granite Wash play (See Appendix for additional information).Note: All other data as of September 30, 2017, except as otherwise provided..

3
Why Penn Virginia?
•“Pure play” Eagle Ford company•Contiguous acreage position of ~75,800 net acres•Focused on returns: Permian-type returns in Eagle Ford
Pure Play
•Situated in “volatile” oil window•Heavily weighted oil portfolio; 87% liquids (73% crude oil)•Strong realized pricing yields robust EBITDAX margins•Operational excellence
QualityAssets
•Strong balance sheet•Low leverage and ample liquidity•Expect to spend within cash flow by ~4Q 2018•Approximately 50% of oil hedged in 2018
FinancialDiscipline
•Estimated 2018 production growth: ~100% (Y-O-Y)•Multi-year drilling inventory with superior economics•Inventory upside from Upper Eagle Ford and Austin Chalk•Capitalize on acquisitions in fragmented basin
Growth Potential
4
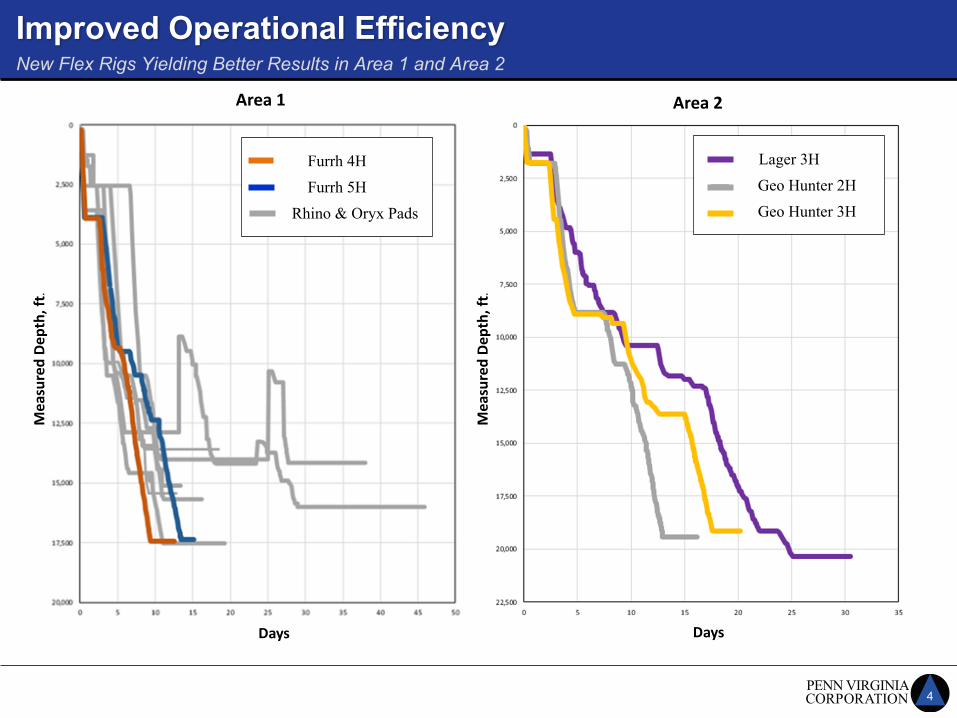
New Flex Rigs Yielding Better Results in Area 1 and Area 2
Improved Operational Efficiency
Lager 3HGeo Hunter 2HGeo Hunter 3H
MeasuredDe
pth,ft
.
MeasuredDe
pth,ft
.
Area1 Area2
DaysDays
Furrh 4HFurrh 5H
Rhino & Oryx Pads
5
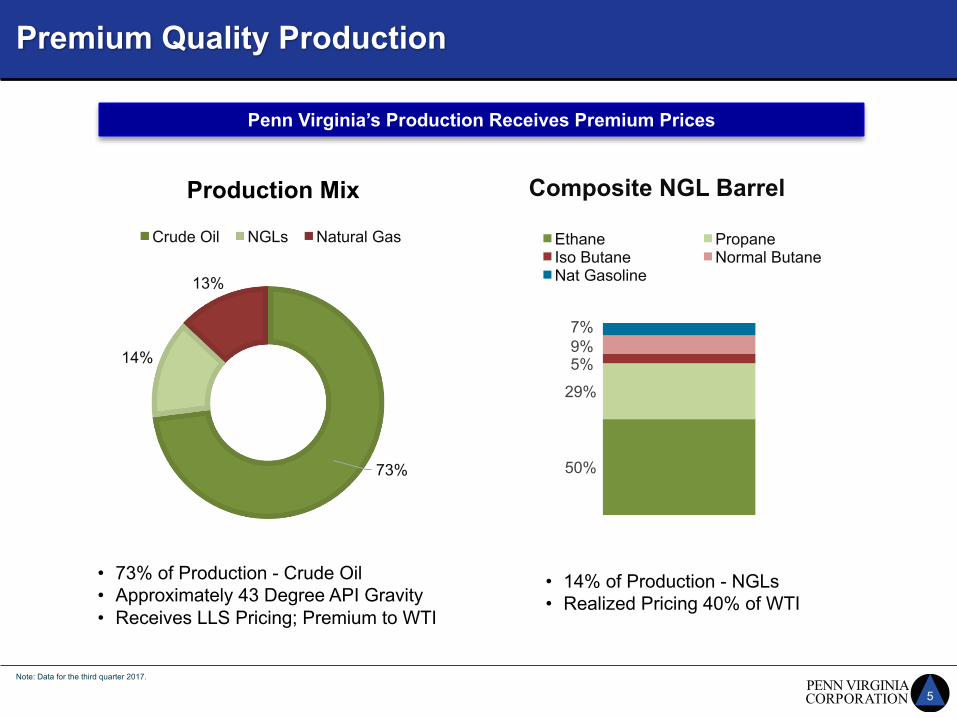
Premium Quality Production
73%
14%
13%
Crude Oil NGLs Natural Gas
Note: Data for the third quarter 2017.
50%
29%
5%9%7%
Composite NGL Barrel
Ethane PropaneIso Butane Normal ButaneNat Gasoline
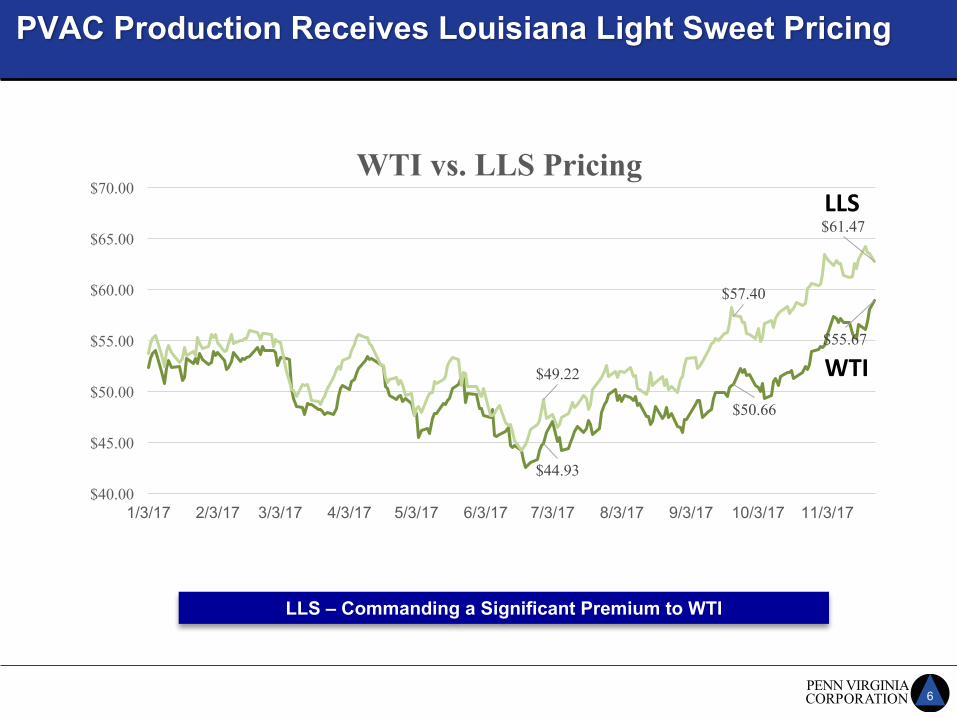
• 73% of Production - Crude Oil• Approximately 43 Degree API Gravity• Receives LLS Pricing; Premium to WTI
• 14% of Production - NGLs• Realized Pricing 40% of WTI
Penn Virginia’s Production Receives Premium Prices
Production Mix
6
PVAC Production Receives Louisiana Light Sweet Pricing
$44.93
$50.66
$55.67
$49.22
$57.40
$61.47
$40.00
$45.00
$50.00
$55.00
$60.00
$65.00
$70.00
1/3/17 2/3/17 3/3/17 4/3/17 5/3/17 6/3/17 7/3/17 8/3/17 9/3/17 10/3/17 11/3/17
WTI vs. LLS Pricing
WTI
LLS
LLS – Commanding a Significant Premium to WTI
7
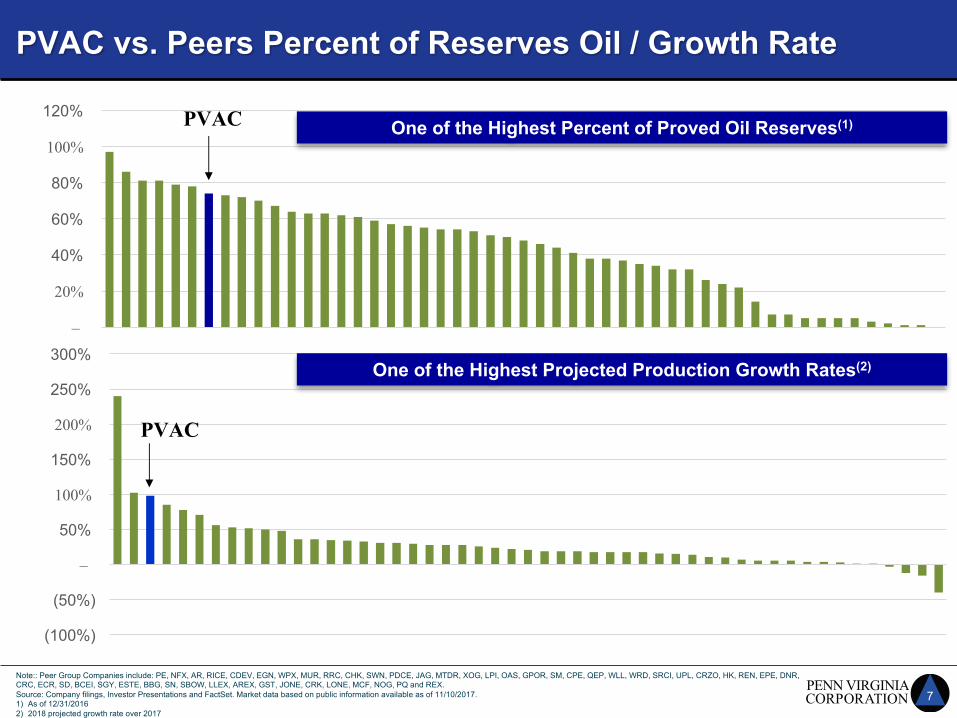
PVAC vs. Peers Percent of Reserves Oil / Growth Rate
–
20%
40%
60%
80%
100%
120% PVAC
Note:: Peer Group Companies include: PE, NFX, AR, RICE, CDEV, EGN, WPX, MUR, RRC, CHK, SWN, PDCE, JAG, MTDR, XOG, LPI, OAS, GPOR, SM, CPE, QEP, WLL, WRD, SRCI, UPL, CRZO, HK, REN, EPE, DNR, CRC, ECR, SD, BCEI, SGY, ESTE, BBG, SN, SBOW, LLEX, AREX, GST, JONE, CRK, LONE, MCF, NOG, PQ and REX.Source: Company filings, Investor Presentations and FactSet. Market data based on public information available as of 11/10/2017.1) As of 12/31/20162) 2018 projected growth rate over 2017
One of the Highest Percent of Proved Oil Reserves(1)
(100%)
(50%)
–
50%
100%
150%
200%
250%
300% One of the Highest Projected Production Growth Rates(2)
PVAC
8
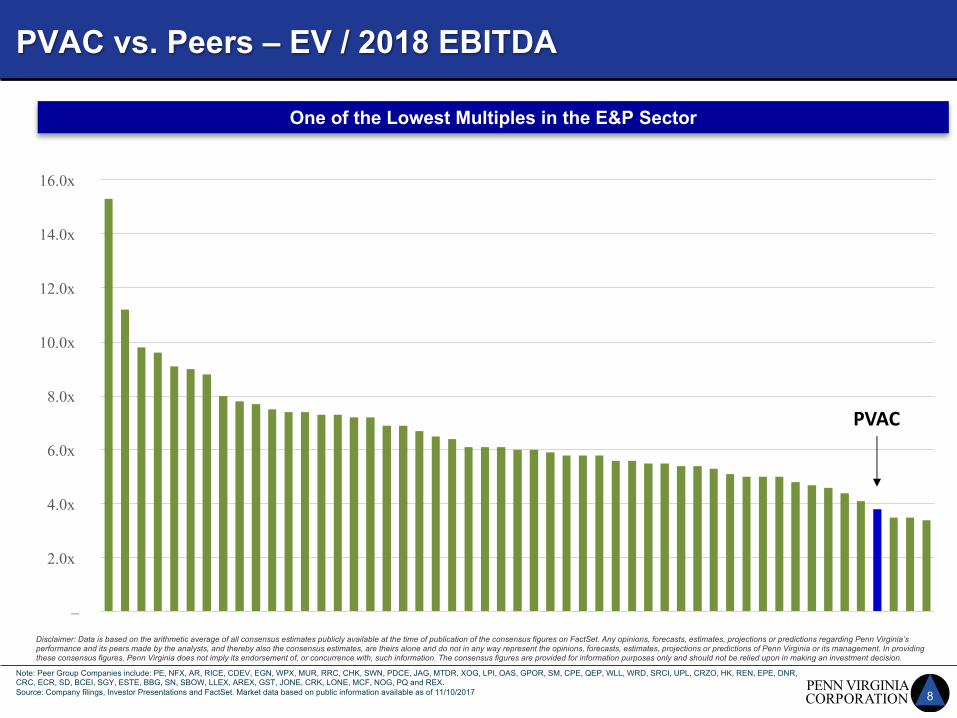
PVAC vs. Peers – EV / 2018 EBITDA
–
2.0x
4.0x
6.0x
8.0x
10.0x
12.0x
14.0x
16.0x
18.0x One of the Lowest Multiples in the E&P Sector
Disclaimer: Data is based on the arithmetic average of all consensus estimates publicly available at the time of publication of the consensus figures on FactSet. Any opinions, forecasts, estimates, projections or predictions regarding Penn Virginia’s performance and its peers made by the analysts, and thereby also the consensus estimates, are theirs alone and do not in any way represent the opinions, forecasts, estimates, projections or predictions of Penn Virginia or its management. In providing these consensus figures, Penn Virginia does not imply its endorsement of, or concurrence with, such information. The consensus figures are provided for information purposes only and should not be relied upon in making an investment decision.
Note: Peer Group Companies include: PE, NFX, AR, RICE, CDEV, EGN, WPX, MUR, RRC, CHK, SWN, PDCE, JAG, MTDR, XOG, LPI, OAS, GPOR, SM, CPE, QEP, WLL, WRD, SRCI, UPL, CRZO, HK, REN, EPE, DNR, CRC, ECR, SD, BCEI, SGY, ESTE, BBG, SN, SBOW, LLEX, AREX, GST, JONE, CRK, LONE, MCF, NOG, PQ and REX.Source: Company filings, Investor Presentations and FactSet. Market data based on public information available as of 11/10/2017
PVAC
9
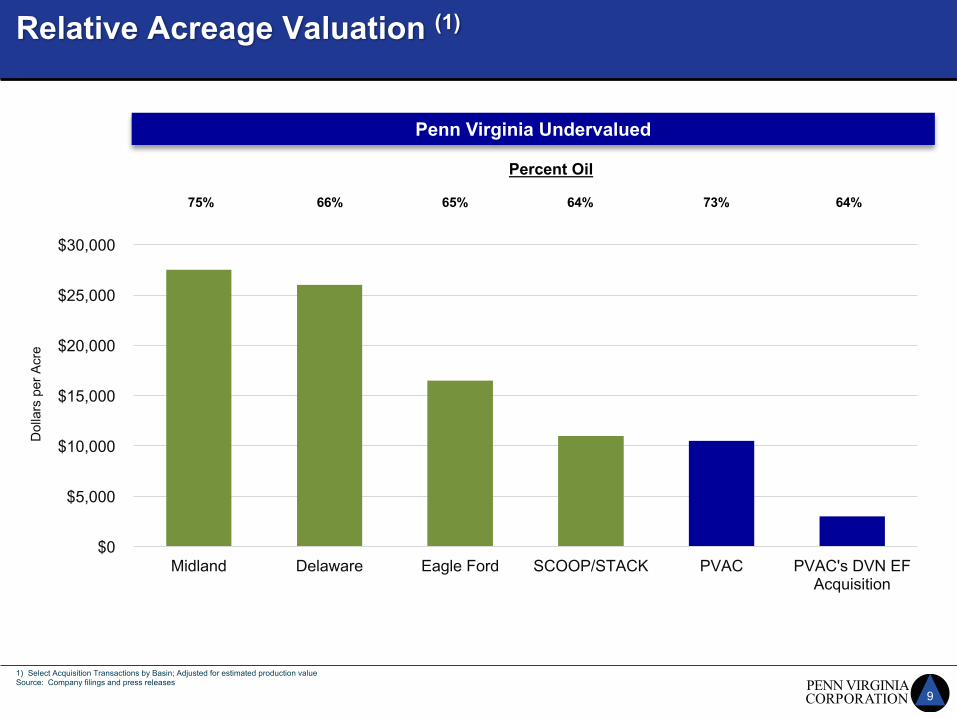
1) Select Acquisition Transactions by Basin; Adjusted for estimated production valueSource: Company filings and press releases
$0
$5,000
$10,000
$15,000
$20,000
$25,000
$30,000
Midland Delaware Eagle Ford SCOOP/STACK PVAC PVAC's DVN EF Acquisition
Relative Acreage Valuation (1)
Penn Virginia Undervalued
Percent Oil
75% 66% 65% 64% 73% 64%
Dol
lars
per
Acr
e
10
FayetteCounty
GonzalesCounty
LavacaCounty
DewittCounty
TX
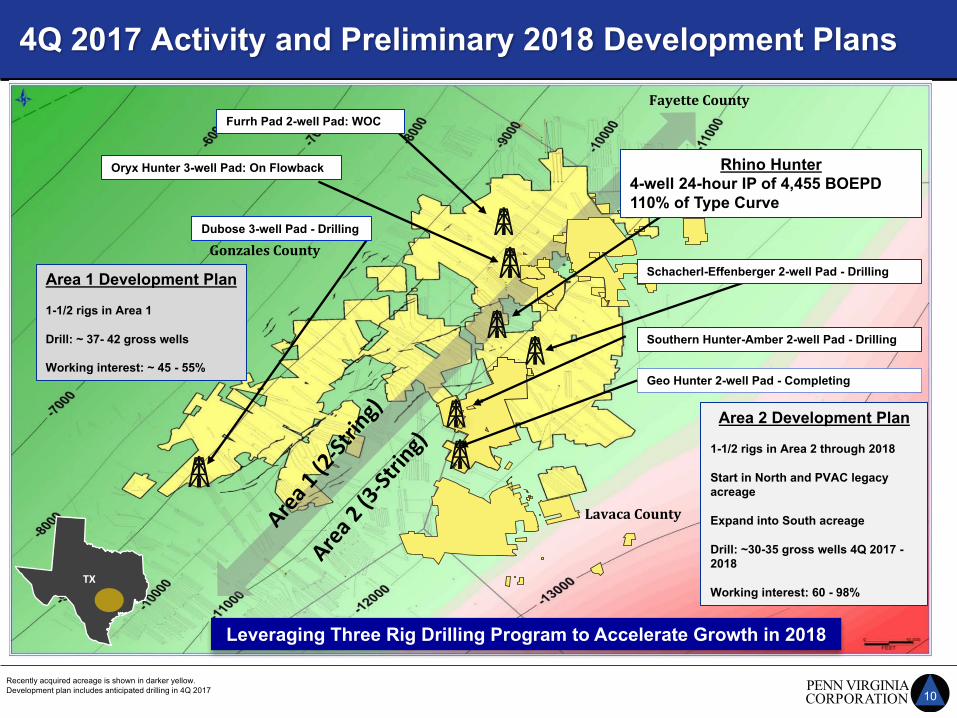
Southern Hunter-Amber 2-well Pad - Drilling
Schacherl-Effenberger 2-well Pad - Drilling
Oryx Hunter 3-well Pad: On Flowback
Furrh Pad 2-well Pad: WOC
4Q 2017 Activity and Preliminary 2018 Development Plans
Leveraging Three Rig Drilling Program to Accelerate Growth in 2018
Recently acquired acreage is shown in darker yellow. Development plan includes anticipated drilling in 4Q 2017
Geo Hunter 2-well Pad - Completing
Rhino Hunter4-well 24-hour IP of 4,455 BOEPD110% of Type Curve
Area 1 Development Plan
1-1/2 rigs in Area 1
Drill: ~ 37- 42 gross wells
Working interest: ~ 45 - 55%
Area 2 Development Plan
1-1/2 rigs in Area 2 through 2018
Start in North and PVAC legacy acreage
Expand into South acreage
Drill: ~30-35 gross wells 4Q 2017 -2018
Working interest: 60 - 98%
Dubose 3-well Pad - Drilling
11
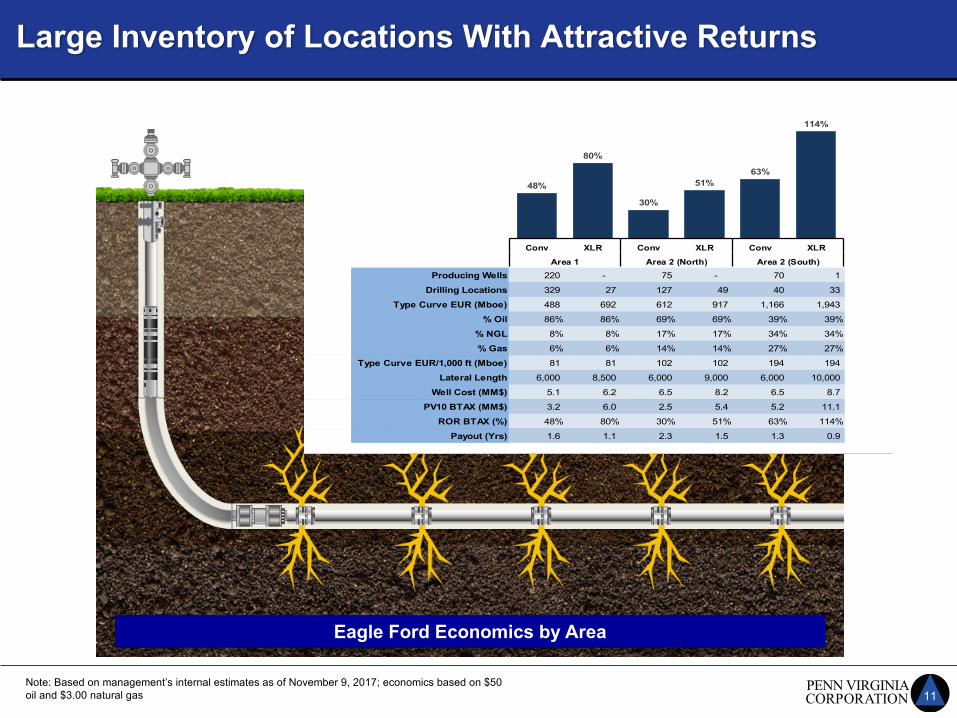
Large Inventory of Locations With Attractive Returns
Note: Based on management’s internal estimates as of November 9, 2017; economics based on $50 oil and $3.00 natural gas
Producing Wells 220 - 75 - 70 1
Drilling Locations 329 27 127 49 40 33
Type Curve EUR (Mboe) 488 692 612 917 1,166 1,943
% Oil 86% 86% 69% 69% 39% 39%
% NGL 8% 8% 17% 17% 34% 34%
% Gas 6% 6% 14% 14% 27% 27%
Type Curve EUR/1,000 ft (Mboe) 81 81 102 102 194 194
Lateral Length 6,000 8,500 6,000 9,000 6,000 10,000
Well Cost (MM$) 5.1 6.2 6.5 8.2 6.5 8.7
PV10 BTAX (MM$) 3.2 6.0 2.5 5.4 5.2 11.1
ROR BTAX (%) 48% 80% 30% 51% 63% 114%
Payout (Yrs) 1.6 1.1 2.3 1.5 1.3 0.9
48%
80%
30%
51%63%
114%
Conv XLR Conv XLR Conv XLR
Area 1 Area 2 (North) Area 2 (South)
Eagle Ford Economics by Area
12
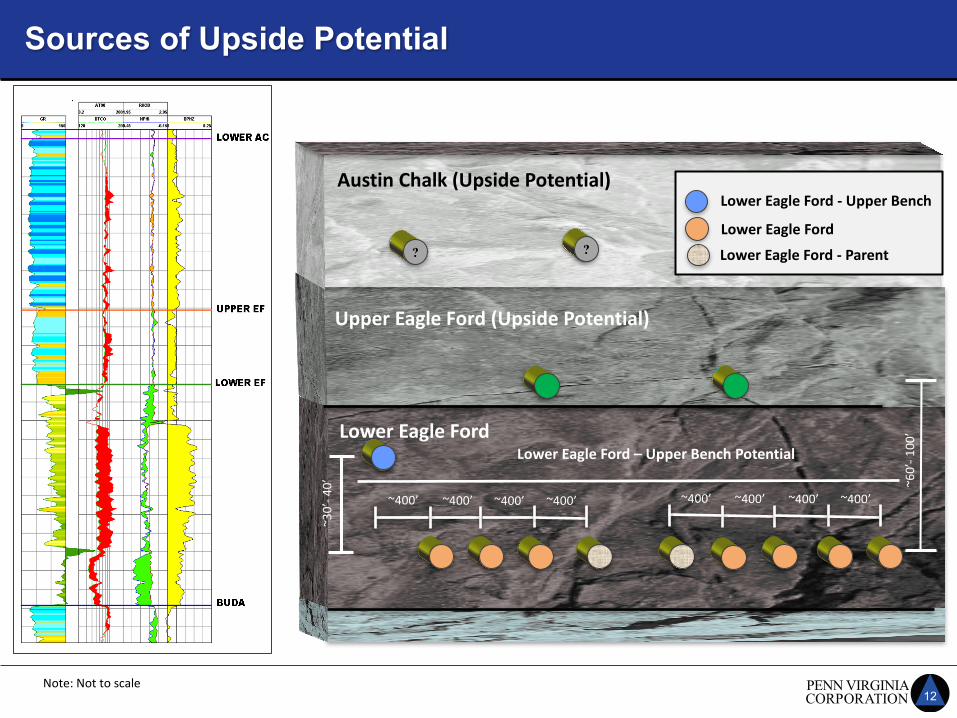
Sources of Upside Potential
Note:Nottoscale
UpperEagleFord(UpsidePotential)
AustinChalk(UpsidePotential)
~400’ ~400’ ~400’~400’
LowerEagleFord
~400’ ~400’ ~400’~400’
LowerEagleFord
LowerEagleFord- UpperBench
~60’-1
00’
LowerEagleFord- Parent
~30’-4
0’
LowerEagleFord– UpperBenchPotential
? ?
13
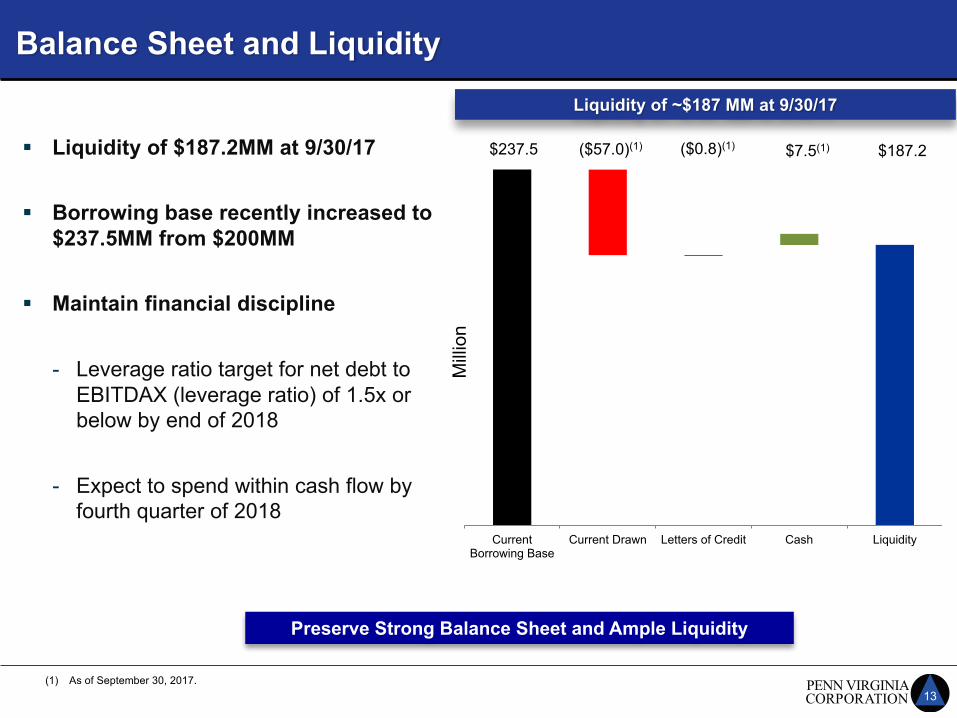
Balance Sheet and LiquidityLiquidity of ~$187 MM at 9/30/17
Milli
on
Current Borrowing Base
Current Drawn Letters of Credit Cash Liquidity
(1) As of September 30, 2017.
$237.5 $187.2$7.5(1)($57.0)(1) ($0.8)(1)§ Liquidity of $187.2MM at 9/30/17
§ Borrowing base recently increased to $237.5MM from $200MM
§ Maintain financial discipline
- Leverage ratio target for net debt to EBITDAX (leverage ratio) of 1.5x or below by end of 2018
- Expect to spend within cash flow by fourth quarter of 2018
Preserve Strong Balance Sheet and Ample Liquidity
14
0
1,000
2,000
3,000
4,000
5,000
6,000
7,000
8,000
$56.18$51.97
$51.30
$50.35
2020
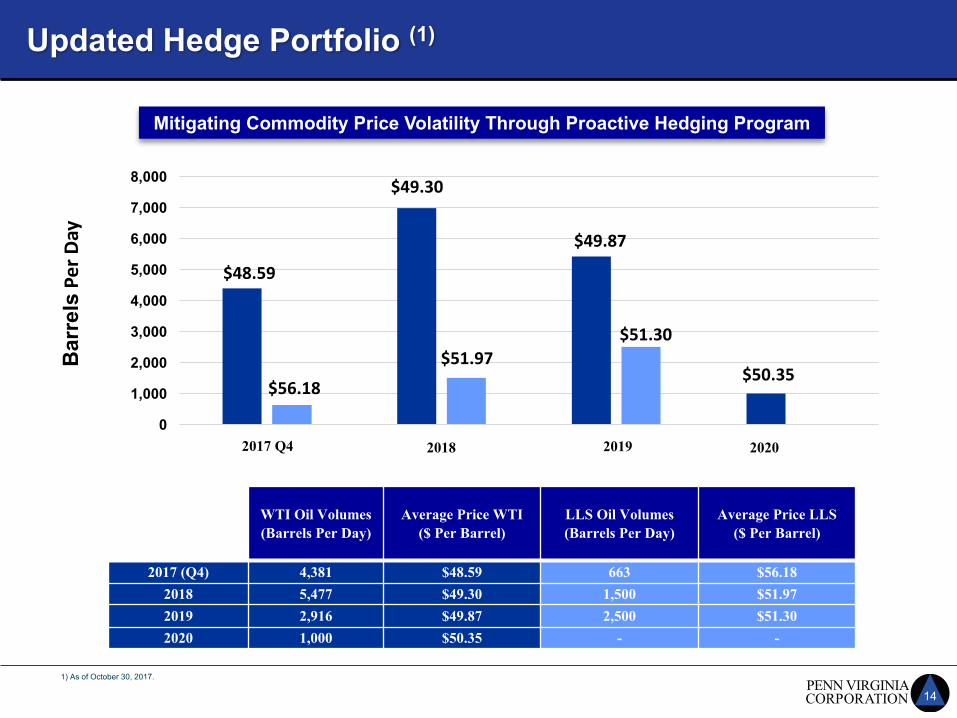
Updated Hedge Portfolio (1)B
arre
lsPe
rDay
$48.59
$49.30
$49.87
WTI Oil Volumes (Barrels Per Day)
Average Price WTI($ Per Barrel)
LLS Oil Volumes (Barrels Per Day)
Average Price LLS($ Per Barrel)
2017 (Q4) 4,381 $48.59 663 $56.182018 5,477 $49.30 1,500 $51.972019 2,916 $49.87 2,500 $51.302020 1,000 $50.35 - -
1) As of October 30, 2017.
201920182017 Q4
Mitigating Commodity Price Volatility Through Proactive Hedging Program
15
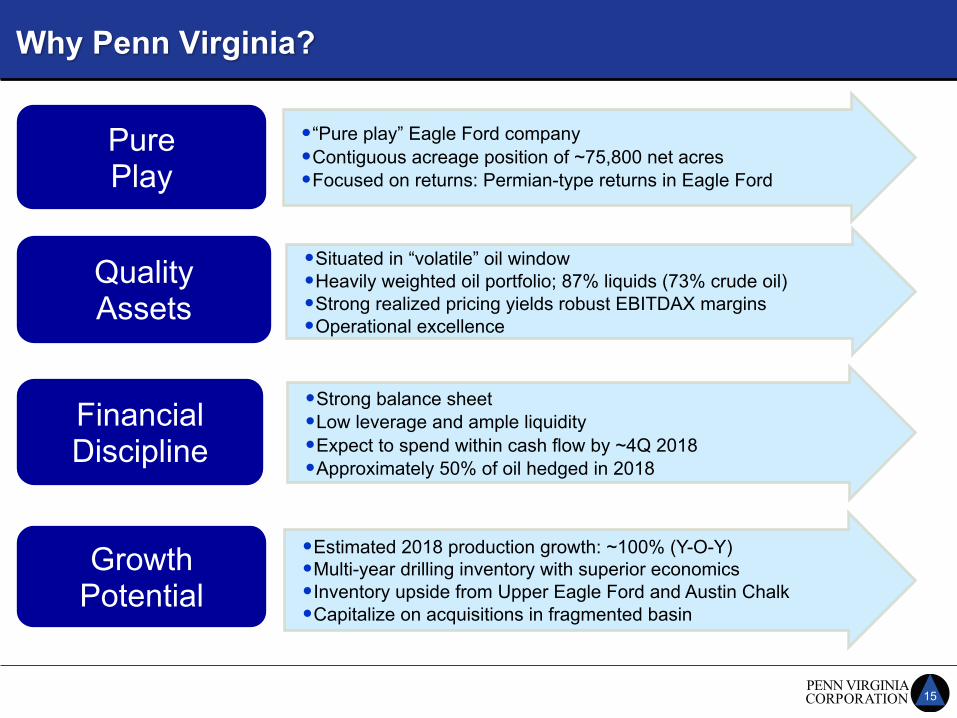
Why Penn Virginia?
•“Pure play” Eagle Ford company•Contiguous acreage position of ~75,800 net acres•Focused on returns: Permian-type returns in Eagle Ford
Pure Play
•Situated in “volatile” oil window•Heavily weighted oil portfolio; 87% liquids (73% crude oil)•Strong realized pricing yields robust EBITDAX margins•Operational excellence
QualityAssets
•Strong balance sheet•Low leverage and ample liquidity•Expect to spend within cash flow by ~4Q 2018•Approximately 50% of oil hedged in 2018
FinancialDiscipline
•Estimated 2018 production growth: ~100% (Y-O-Y)•Multi-year drilling inventory with superior economics•Inventory upside from Upper Eagle Ford and Austin Chalk•Capitalize on acquisitions in fragmented basin
Growth Potential
Questions & Answers
Appendix
18
Guidance
Note: Guidance as of November 8, 2017. Penn Virginia is not reaffirming guidance.
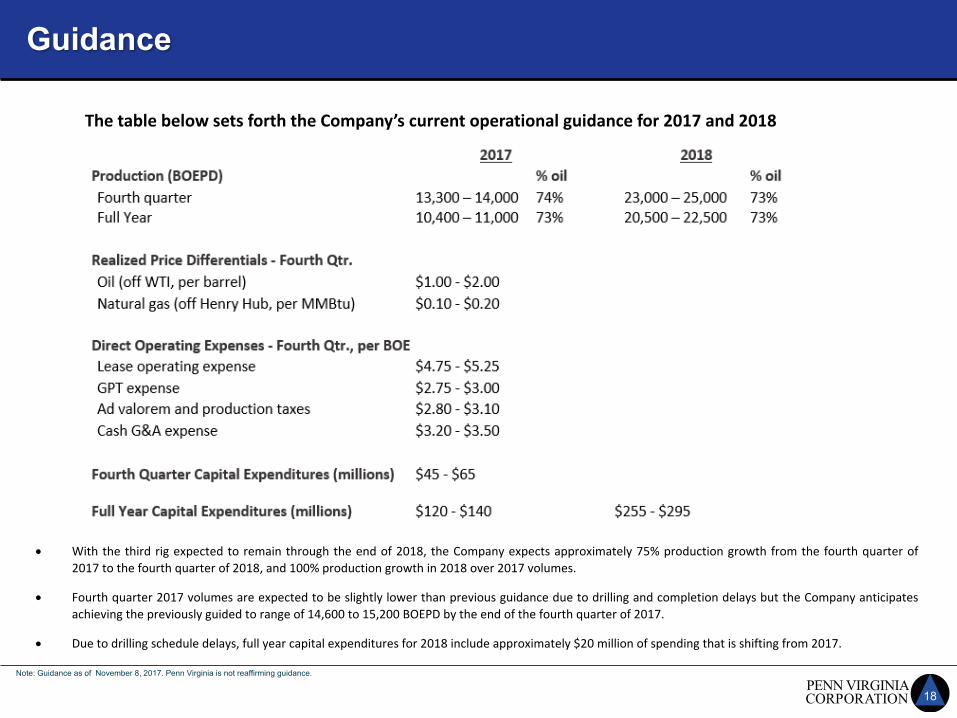
ThetablebelowsetsforththeCompany’scurrentoperationalguidancefor2017and2018
• With the third rig expected to remain through the end of 2018, the Company expects approximately 75% production growth from the fourth quarter of2017 to the fourth quarter of 2018, and 100% production growth in 2018 over 2017 volumes.
• Fourth quarter 2017 volumes are expected to be slightly lower than previous guidance due to drilling and completion delays but the Company anticipatesachieving the previously guided to range of 14,600 to 15,200 BOEPD by the end of the fourth quarter of 2017.
• Due to drilling schedule delays, full year capital expenditures for 2018 include approximately $20 million of spending that is shifting from 2017.
19
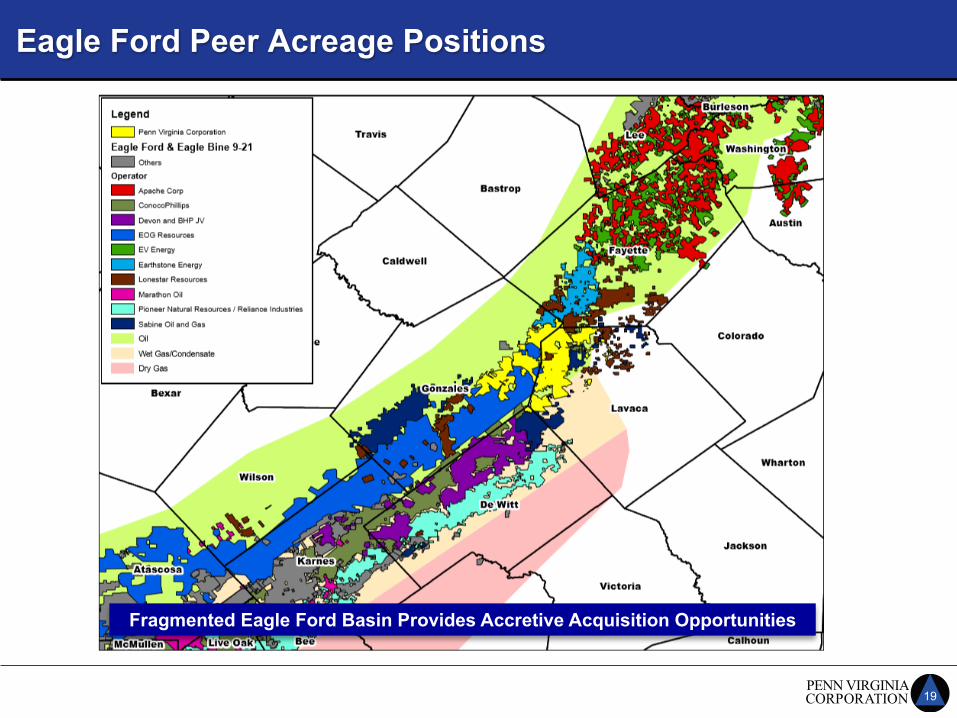
Eagle Ford Peer Acreage Positions
Fragmented Eagle Ford Basin Provides Accretive Acquisition Opportunities
20
Houston (HQ)
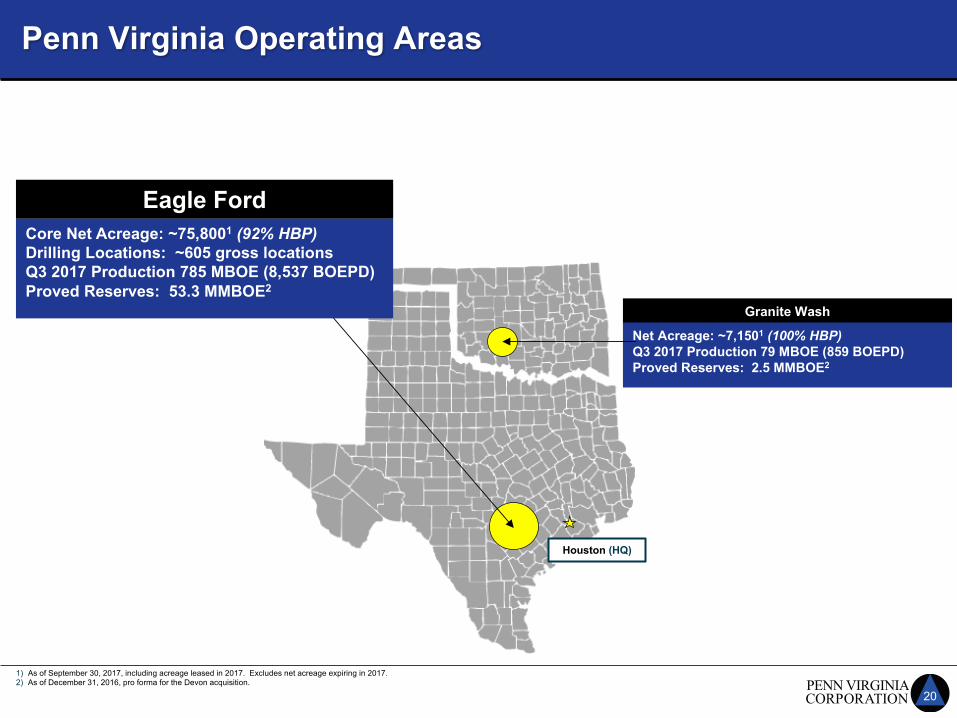
Penn Virginia Operating Areas
Granite Wash
Net Acreage: ~7,1501 (100% HBP)Q3 2017 Production 79 MBOE (859 BOEPD)Proved Reserves: 2.5 MMBOE2
Eagle FordCore Net Acreage: ~75,8001 (92% HBP)Drilling Locations: ~605 gross locationsQ3 2017 Production 785 MBOE (8,537 BOEPD)Proved Reserves: 53.3 MMBOE2
1) As of September 30, 2017, including acreage leased in 2017. Excludes net acreage expiring in 2017. 2) As of December 31, 2016, pro forma for the Devon acquisition.