capital constraints, counterparty risk and deviations from ... · pdf filewe thank mark lueck...
TRANSCRIPT
Capital Constraints, Counterparty Risk and
Deviations from Covered Interest Rate Parity
Niall Coffey Warren Hrung
Hoai-Luu Nguyen Asani Sarkar
ABSTRACT
We provide robust evidence of a deviation in the Covered Interest Parity (CIP) relation since the onset of the crisis in August 2007. The CIP deviation exists with respect to several different dollar interest rates and exchange rate pairs of the dollar vis-à-vis other currencies. The results show that our proxy for margin conditions and cost of capital are significant determinants of the basis, especially during the crisis period. The supply of dollars by the Federal Reserve to foreign central banks via reciprocal currency arrangements (swap lines) reduced CIP deviations at this time. Following the bankruptcy of Lehman Brothers, counterparty risk became a significant determinant of CIP deviations and the swap lines program no longer affected the CIP deviations. These results indicate a breakdown of arbitrage transactions in the international capital markets partly due to lack of capital and partly due to heightened counterparty credit risk. Central bank interventions helped to reduce the funding liquidity risk of global institutions.
July 2009
All authors are from the Federal Reserve Bank of New York. We thank Viral Acharya, Markus Brunnermeier, Martin Oehmke, Lasse Pedersen, and Dimitri Vayanos for valuable comments. We thank Mark Lueck for data help and seminar participants at the NBER Summer Institute 2009 and the Systems Finance conference of the Federal Reserve for helpful comments. The views stated here are those of the authors and do not necessarily reflect the views of the Federal Reserve Bank of New York, or the Federal Reserve System.
1
The covered interest rate parity (CIP) relation is a bedrock of international economics. CIP
states that the differential between domestic and foreign interest rates must equal the forward
discount rate in the foreign exchange (FX) markets, given arbitrage between domestic and
foreign money markets and currency markets. Empirical evidence is generally supportive of the
CIP, especially for recent sample periods and for the developed countries. Consequently,
economists generally expect CIP to be valid except perhaps for countries with government
restrictions on international capital flows (e.g. capital taxes and controls) that impede free flow
of capital.
In this paper, we document a substantial and persistent breakdown in the CIP relation
since the onset of the crisis in August 2007. Specifically, we measure the deviation from CIP by
the US dollar (USD) basis, defined as the difference between the dollar rate implied by the CIP
relation (henceforth, the “implied rate”) and the actual dollar interest rate. We show that, while
in normal periods, the basis is miniscule it has been consistently large and positive since the start
of the crisis and increased dramatically after mid-September 2008 following the bankruptcy of
Lehman Brothers (Figure 1). For example, the basis estimated using USD LIBOR as the interest
rate and the euro-USD currency rate increased from essentially zero in the pre-crisis period to
around 25 basis points during the initial periods of the crisis, before shooting up to over 200
basis points by the end of September 2008.
We show that this result is robust to the use of various alternative USD interest rates and
the use of different pairs of USD vis-à-vis other currencies in deriving the basis. The LIBOR
fixing rate has been controversial during the crisis due to allegations that banks contributing to
LIBOR were strategically under-reporting their true dollar borrowing rates. If true, such
behavior might spuriously imply a deviation in CIP. We continue to find substantial deviations
2
from CIP when we use the New York Funding Rate (NYFR) and Treasury bill rates.1 Further,
we estimate the USD basis with respect to five currency pairs: USD-Australian dollar, USD-
euro, USD-JPY (Japanese Yen), USD-GBP (British pound), USD-CHF (Swiss franc), and USD-
NZD (New Zealand dollar). For all five currency pairs, we find that the basis has shown a
similar pattern of sharp increases in the crisis period, especially since September 15, 2008.
What may have caused this remarkable deviation in the CIP? One possibility is that
arbitrageurs were financially constrained as funding sources dried up during the crisis (Shleifer
and Vishny (1997), Gromb and Vayanos (2002), Geanakoplos (2003), Basak and Croitoru
(2006), and Brunnermeier and Pedersen (2009)). In the context of the uncovered interest rate
parity, Brunnermeier, Nagel and Pedersen (2008) document that the sudden unwinding carry
trades are attributable to funding illiquidity when speculators near funding constraints. Garleanu
and Pedersen (2009) develop an asset pricing model where risk-tolerant investors are margin
constrained but risk-averse investors are not. They show that, if risk-averse investors are also
constrained in their derivatives positions, then the basis between a derivative and its asset is non-
zero in equilibrium and depends on their relative margins and the leveraged investors’ shadow
cost of capital.
An alternative explanation is that previously riskless cash flows became risky during the
crisis and prevented the arbitrage transactions necessary for CIP to hold. For example, Taylor
(1989) finds that deviations from CIP tend to increase during periods of crisis (e.g. the inception
1 NYFR was introduced in June 2008 and designed so as to ameliorate the perceived flaws in LIBOR. It is published by ICAP. Several aspects of its design are intended to directly address perceived flaws in LIBOR. Similar to LIBOR, NYFR is a trimmed mean of quotes collected from a panel of contributing banks. Unlike LIBOR, however, the full set of NYFR contributing banks are drawn from US financial institutions, avoiding the question of accurate representation of the US market. Moreover, to remove the incentive to under-report, the individual quotes as well as the actual composition of the panel are not disclosed. And, while the British Bankers Association (BBA) asks banks to provide an estimate of their own borrowing costs, ICAP asks only for an estimate of the rate at which a representative A1/P1 bank would be likely to obtain funding.

3
of the European Monetary System in 1979) and they persist for some time. The effect of
increased risk was visible in heightened counterparty risk and illiquidity in the FX swap markets
where international institutions obtain dollar funding, typically from US institutions that have a
dollar deposit base.2 Indeed, Baba and Packer (2008) show that the basis increases in the
difference in CDS prices between European and US firms.
Our results show that capital constraints of arbitrageurs appear to be a key driver of CIP
deviations. Our proxy for margin conditions and the cost of capital are significant determinants
of the basis, especially during the crisis period. These results are consistent with Garleanu and
Pedersen (2009) and indicate a deviation of the Law of One Price during the crisis as arbitrage
transactions became difficult in the international money markets due to funding constraints. In
addition, we find evidence that counterparty risk became a significant determinant of the basis
following the bankruptcy of Lehman Brothers, so that previously riskless cash flows became
risky. These results indicate a breakdown of arbitrage transactions in the international capital
markets partly due to lack of capital and partly due to heightened counterparty credit risk.
To ease short-term dollar funding constraints in the international money markets, the
Federal Reserve agreed to supply dollars to foreign central banks via reciprocal currency
arrangements (swap lines) with several developed and emerging market countries. We find that
announcements of the swap lines program were successful in bringing down the basis by an
average of 5 basis points. The actual auctions of dollars were also effective in bringing down the
basis. However, in the post-Lehman period, the swap lines programs did not have a significant
effect on the basis possibly because they were not designed to bring down high levels of
2 CIP deviations are manifested in the FX swap markets since both legs of the currency arbitrage occur as a single transaction. Indeed, dealers in the FX swap markets quote the forward differential (Baba and Packer (2008)).
4
counterparty risk. The swap lines might also reduce the basis via exchange rates, a mechanism
we do not study.3
We conduct several robustness checks. We repeat our regressions using changes in the
basis (since the basis displays strong autocorrelation). Our qualitative results remain the same.
We also repeat our analysis using high frequency (hourly) exchange rate data (this data is only
available for part of our sample). Again, our main results are robust to using high frequency or
lower frequency data.
Of related papers, Garleanu and Pedersen (2009) also document CIP deviations using
USD LIBOR and the USD-euro, USD-JPY and USD-GBP currency pairs. They comment on the
correlation of the TED spread with CIP deviations but they do not report numbers or conduct any
formal econometric analysis. Baba and Packer (2008) evaluate the effect of the central bank
currency swap arrangements on the USD basis implied by the euro-USD basis swap rates. They
find a decline in volatility of the basis but no change in its level due to the swaps. They consider
CDS prices as determinants of CIP deviations but do not consider arbitrageur’s capital
constraints, counterparty risk or liquidity risk as other determinants of CIP deviations.4 Unlike
our paper, these papers do not examine non-LIBOR interest rates.
We contribute to the literature by providing robust evidence of a deviation in the CIP
since the onset of crisis in August 2007 even in the absence of explicit restrictions on the
international flow of capital. We also contribute to the literature on financially-constrained
arbitrageurs by postulating high frequency measures of margin constraints and showing
3 Aizenmann and Pasricha (2009) find an affect of the swap lines on emerging market countries (however, they did not examine exchange rates of developed countries). 4 Baba and Packer (2008) use the LIBOR-OIS spread as a proxy for liquidity risk. This proxy has two potential problems. It includes a substantial component of credit risk, as shown by Taylor and Williams (2008) and McAndrews et al (2008). Second, since their basis is based on LIBOR, LIBOR is effectively on both sides of the regressions.
5
empirically that CIP deviations are in part related to this measure. Thus, our results indicate a
breakdown of arbitrage relations in international capital markets as non-US financial institutions
became unable to borrow uncollaterized funds and US firms become reluctant to lend dollars.
Third, we develop a measure of counterparty risk and show that CIP deviations are related to this
measure in the post-Lehman crisis period. The literature on risky arbitrage (e.g. Shleifer and
Summers (1990)) argues that small deviations from fundamentals may not be corrected when
cash flows are risky. Our results suggest that risky arbitrage may fail even in the face of large
deviations if arbitrageurs are also capital constrained. Finally, we contribute to the literature on
the public provision of liquidity by showing that the Central Bank bilateral currency swap lines
were effective in bringing down CIP deviations by easing funding constraints. While previous
evidence of the efficacy of public liquidity supply has been in the domestic context, we extend
this evidence to the international markets.
The paper is organized as follows. In Section I, we describe the FX swap market. In
Section II, we describe our data and methodology. In Section III, we present estimates of the
deviation from CIP. In section IV, we examine the role of credit risk and liquidity risk in
explaining the deviations from CIP. In Section V, we assess the impact of the Federal Reserve’s
bilateral currency swap lines on the CIP deviations. We conclude in Section VI.
I. Estimating Deviations from Covered Interest Parity
INSERT FIGURE 1 HERE
The CIP relation is derived from the idea that exchange and international interest rates
adjust to equalize the borrowing cost globally. To make the idea concrete, consider the FX
swap markets. In an FX swap, two parties engage in a spot currency transaction while
simultaneously agreeing to reverse the transaction at the current forward rate at a specified time
6
in the future. In essence, FX swaps allow counterparties to exchange funding at predetermined
times in the future, in one currency for another currency, without FX risk. However, Duffie and
Huang (1996) show that there exists counterparty credit risk due to the cost of replacing the
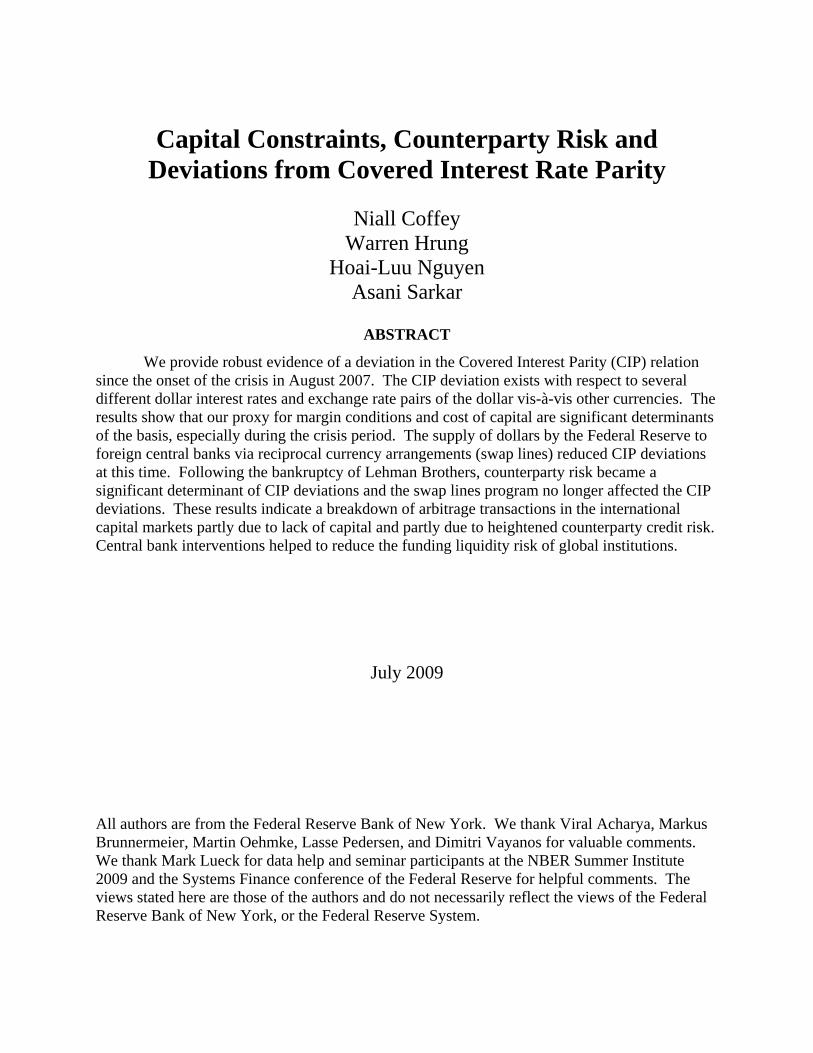
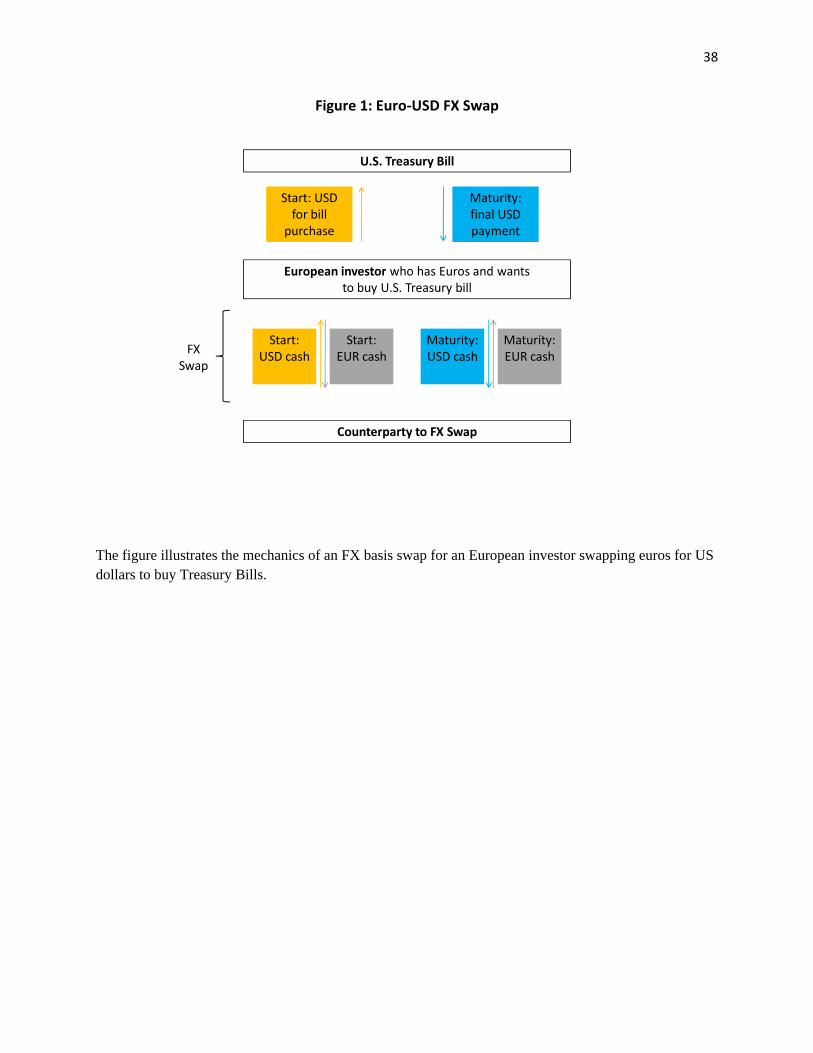
contract should counterparty default. Figure 1 illustrates a hypothetical FX swap between a
European investor who swaps euros for USD for 3 months with a US investor in order to buy
U.S. Treasury bills.
A currency arbitrage involving FX swaps works as follows. Let s be the spot rate, f the
forward rate, iD the domestic interest rate and iF the foreign interest rate at time t. A domestic
investor faces a choice between borrowing in the domestic uncollateralized cash market at an
interest rate (1+iD) or, alternatively, converting the domestic currency into foreign currency
through an FX swap and borrowing in the foreign uncollateralized cash market at an interest rate
(1+iF). The FX swap dealer quotes the forward differential (f/s). Therefore, if these two ways of
borrowing are to be equally costly then the following condition must hold:
( )Ft
t
tDt i
sf
i +=+ 11 (1)
Equation (1) is the CIP relation. Given data on the forward rate, the spot rate and the
foreign interest rate iF, the implied rate is the value of iD that solves (1). The USD basis BasisD
is the difference between the implied USD rate and a benchmark USD interest rate.
( ) ( rateinterest 11 USDisfBasis F
tt
tDt +−+= ) (2)
For most of our analysis, we use the euro-USD exchange rate, the euro LIBOR and USD
LIBOR fixing rates to estimate the basis:
( ) )$1(1rate $
rate $tt
t
tDt LIBOReuroLIBOR
spoteuroforwardeuroBasis +−+= (3)
7
Arbitrage in international capital markets should ensure that the implied dollar rate is equal to the
USD LIBOR rate, so that the basis is zero and CIP holds. If, for example, the basis is negative
(say, because LIBOR is higher than the implied rate), institutions should increase dollar funding
from the FX swap market until the implied rate rises to the same level as LIBOR, thus returning
the basis to zero. Non-zero levels of the basis in normal times are likely due to temporary
mispricings that are not arbitraged away.
II. Deviations from the Covered Interest Parity Relation
In this section we present estimates of deviations from CIP during the crisis period. To
show robustness of the estimates, we present several measures based on alternative dollar interest
rates (USD LIBOR, NYFR and Treasury Bills) and alternative currency pairs (US dollar vis-à-
vis euro, British pound, Australian dollar, New Zealand dollar, Japanese yen and Swiss franc).
In all cases, we estimate the USD basis for a 3-month term loan. The sample period spans
January 2007 to March 2009 for a total of 564 daily observations.
We obtain tradable quote data on spot and forward exchange rates from Tulletts. The 3-
month LIBOR rates are pulled from Reuters. An issue with calculating the implied rate and the
basis is that exchange rate data are only available with close of business day values while LIBOR
rates are announced at approximately 7am US Eastern Standard Time (EST). Consequently, we
calculate the day t implied rate by matching spot and forward exchange rate quote data as of
close of business on day t with LIBOR rates announced on day t+1 (where all times are US
EST). Starting from May 23 2008, we have available hourly data on the euro-USD exchange
rate from Tulletts which allows time-matching with LIBOR within the hour. We present results
for both sets of data; in general, our results are qualitatively similar whether using the daily and
the hourly data.
8
Section A shows estimates of the basis based on USD LIBOR, NYFR and Treasury bill
rates for the daily and hourly euro-USD exchange rates. Section B shows estimates of the basis
based on different currency pairs.
A. Estimates of CIP deviation based on alternative dollar interest rates
INSERT FIGURE 2 HERE
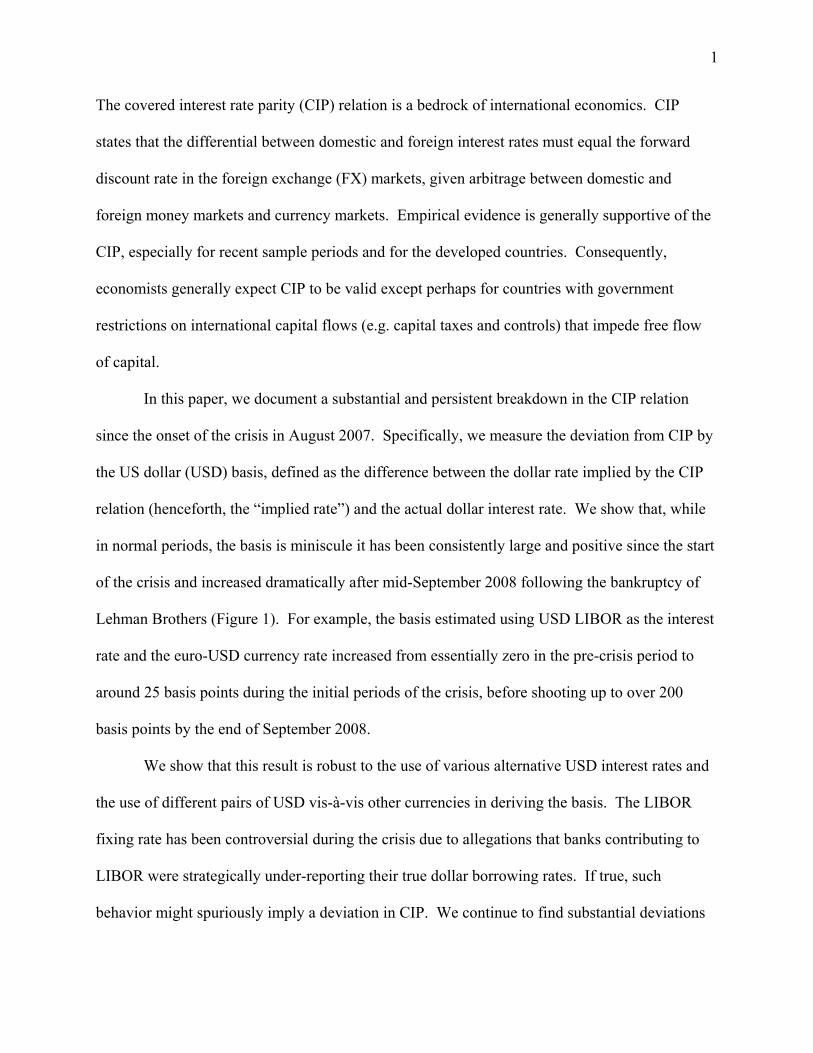
Figure 2 shows estimates of the USD basis using equation (3) for daily (dashed line) and
hourly (solid line) euro-USD exchange rate data. We observe that, prior to August 2007 (the
start of the crisis), the basis hovered close to zero with deviations from zero likely due to
temporary mispricings that were not arbitraged away. However, since the crisis started, the euro-
USD basis has been consistently large and positive (implying a market-based dollar funding rate
substantially higher than the USD LIBOR fixing rate). The deviations have been particularly
large since the Lehman bankruptcy of September 15 2008. For the period where both hourly and
daily exchange rate data is available, we observe that the two estimates track each other closely.
Indeed, the correlation between the two basis measures is 0.94. Therefore, our estimates of CIP
deviations appear robust to the reporting frequency of the exchange rate data.
INSERT TABLE 1 HERE
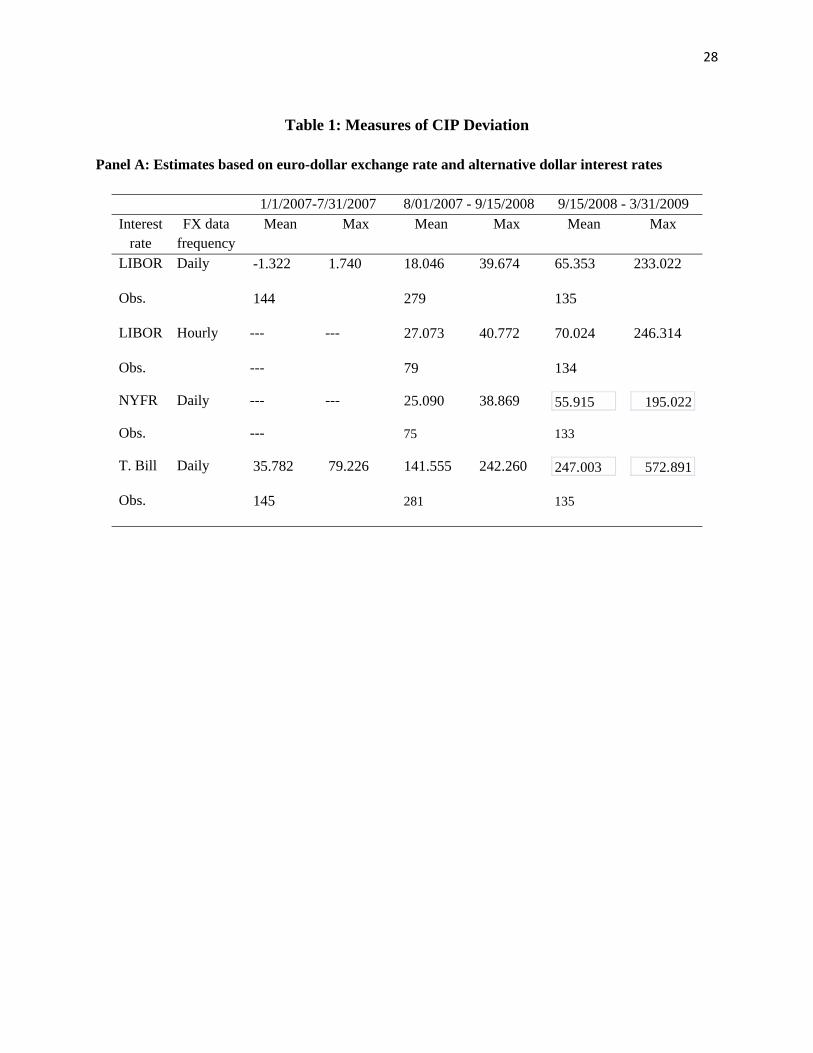
Panel A of Table 1 shows the mean and maximum values of the CIP deviations in basis
points for different benchmark USD interest rates. The first two rows of Panel A show estimates
using the daily and hourly euro-USD exchange rates when USD LIBOR is the reference rate. In
the pre-crisis period, the mean and maximum deviations were less than 2 basis points in absolute
value. In the crisis period, two regimes may be observable. Prior to September 2008, the basis
was large relative to the pre-crisis period, rising to an average of 18 basis points for the daily
data, with a maximum of 40 basis points. After September 2008, the basis jumped to an average
9
of 65 basis points using daily data and 70 basis points using hourly data. The corresponding
maxima were 233 and 246 basis points.
INSERT FIGURE 3 HERE
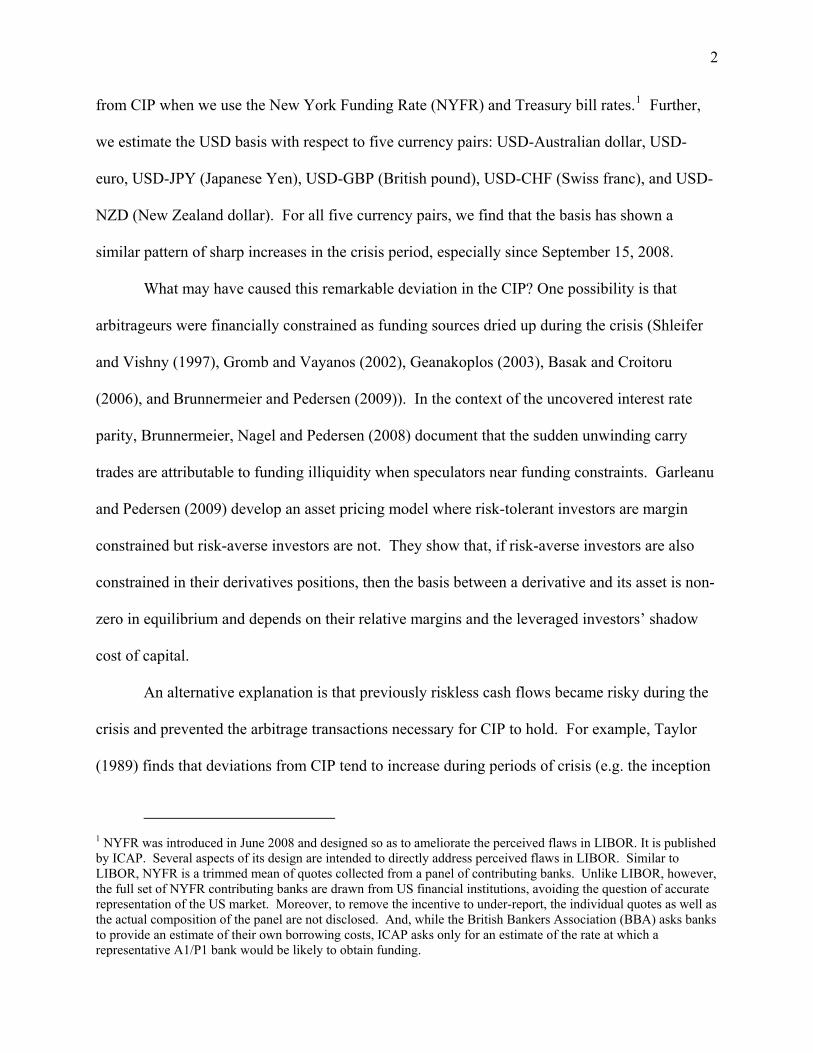
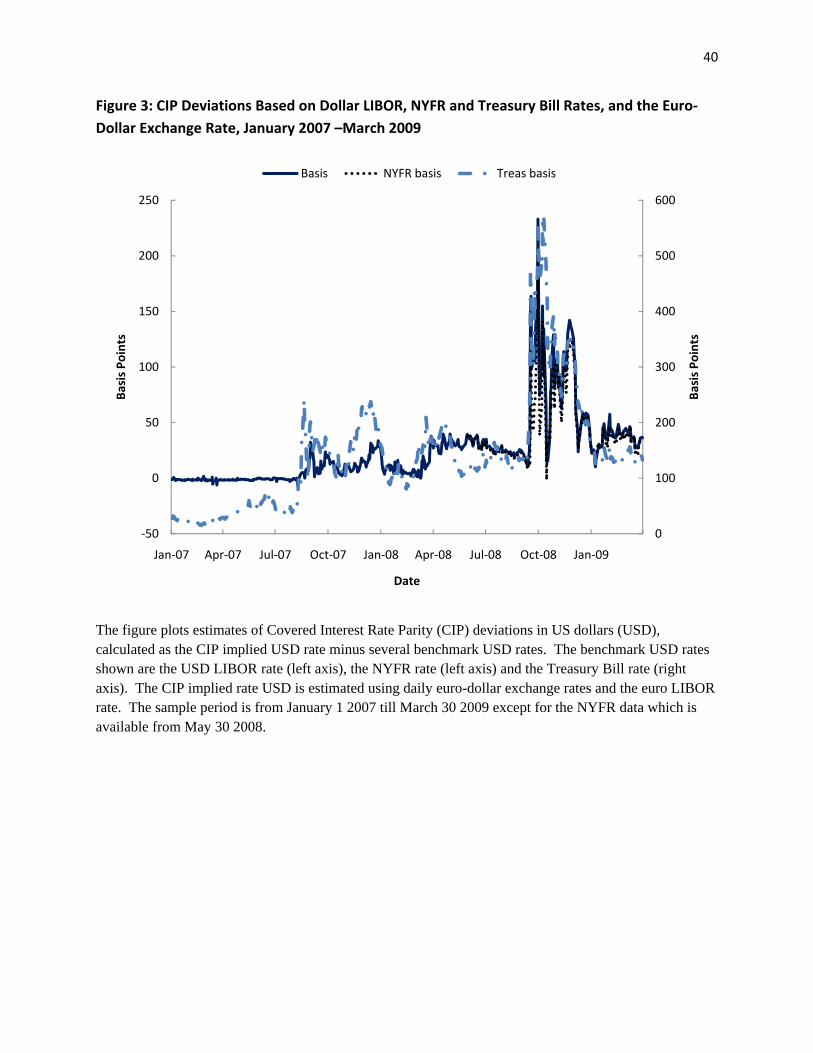
Figure 3 displays estimates of the basis when the USD LIBOR rate is replaced by the
NYFR rate or the Treasury bill rate in equation (3). As noted in the introduction, the NYFR is a
purely domestic US rate unlike LIBOR, which has only 3 US banks among 16 LIBOR panel
banks. In addition, the NYFR was designed to minimize the incentives of banks to misreport
their borrowing rates. This NYFR data is available from May 30 2008. Figure 3 shows that the
behaviour of the NYFR basis is similar to that based on LIBOR: we observe a high and positive
rate prior to September 2008 with a further sharp increase in September 2008. Panel A of Table
1 shows that the mean and maximum values of CIP deviations are similar whether based on
LIBOR or NYFR. The CIP deviations based on the Treasury bill rate display qualitatively
similar dynamics as those based on LIBOR. However, the bill basis is more than 3 times that of
the LIBOR basis (see Panel A of Table 1). This is because the Treasury bill rate closely tracks
the policy rate and the Federal Reserve has aggressively reduced the latter over the crisis period.
In general, however, these results indicate the robustness of the evidence of CIP deviations with
respect to alternative reference dollar interest rates.
B. Estimates of CIP deviation based on alternative currency pairs
If increases in the USD basis rate are due to an excess demand for dollars globally from
non-US institutions, we would expect to see a widening not just in the USD basis with respect to
the euro, but also the USD basis with respect to other currencies. Accordingly, we estimate the
basis for the US dollar vis-à-vis Australian dollar, the Swiss franc, the British pound, the
Japanese yen and the New Zealand dollar. To calculate the USD basis with respect to a currency
10
different from euro, we continue to use equation (3) but substitute interest and exchange rates
denominated in the appropriate currency instead of the euro. For example, for the USD-GBP
currency pair, we back out an implied dollar rate using the GBP LIBOR rate, and the spot and
forward USD-GBP exchange rates.
INSERT FIGURE 4 HERE
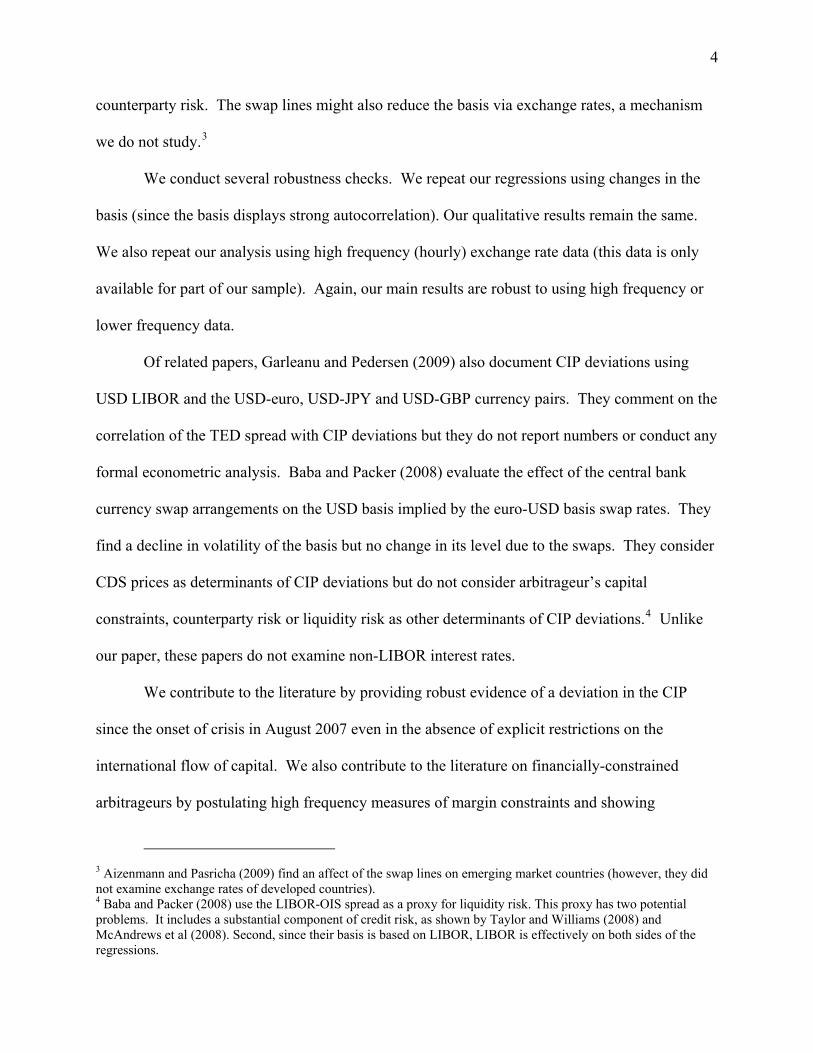
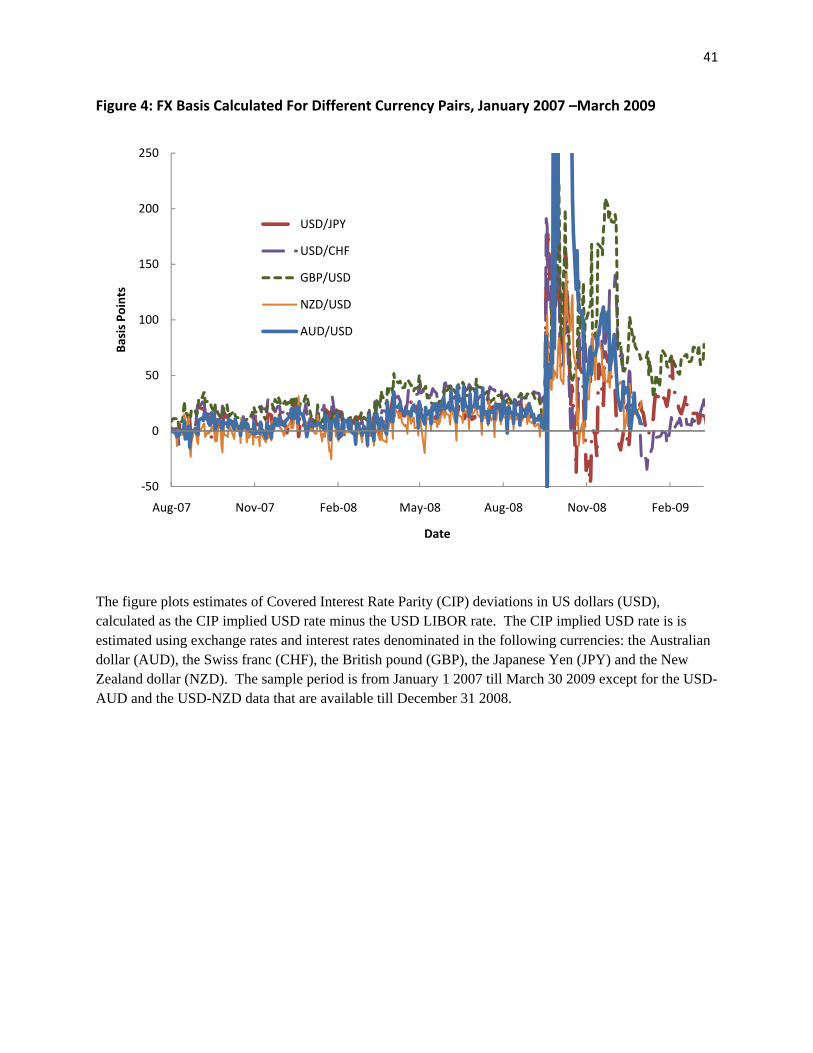
From Figure 4, we observe that for five other currency pairs (USD-AUD, USD-CHF,
USD-GBP, USD-JPY, and USD-NZD), the basis has also widened dramatically since September
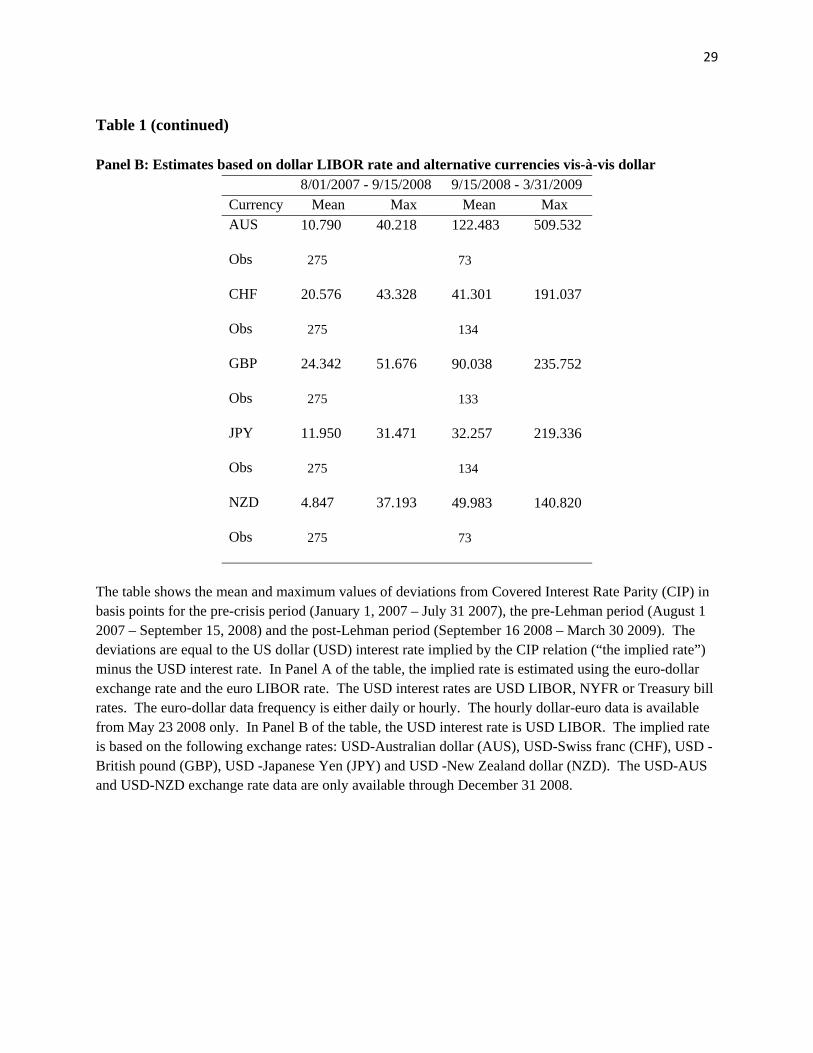
15, 2008 and generally followed a path similar to that of the euro-USD basis. Panel B of Table 1
shows the mean and maximum values of the basis estimates for the different currency pairs. We
observe that the mean and maximum values are similar for different currency pairs, and
moreover they are comparable to those for the USD-euro pair in Panel A of Table 1. One
exception is the USD-AUD pair in the period since September 16 2008 when its basis value
appears to be high compared to the other currency pairs. Overall, the evidence supports the
hypothesis of a structural increase in the demand for dollars worldwide, possibly increasing the
implied dollar rate and widening the basis.
In this section we find robust evidence that deviations from CIP have been large and
persistent since August 2007. Estimates of the CIP deviation based on a variety of dollar interest
rates and a variety of currency pairs all depict similar patterns: large and positive deviations in
CIP after August 2007 followed by an even sharper increase following the Lehman bankruptcy
in September 2008. In the remainder of the paper, we explain why the arbitrage condition
implicit in the CIP relation breaks down during the crisis and we assess the Federal Reserve’s
success in reducing CIP deviations through the supply of US dollars.
11
III. Determinants of CIP Deviations: Discussion and Empirical Methodology
Suppose the USD LIBOR is lower than the rate implied by CIP. In theory, arbitrageurs
can earn riskless profits by borrowing USD for 3 months at the LIBOR rate, swapping into euros,
investing at the euro LIBOR rate, and finally closing the swap in 3 months by converting back
into dollars at the forward rate prevailing at the time of the swap. However, if funding is not
available to arbitrageurs, then the trade does not occur and the CIP deviation persists. Shleifer
and Vishny (1997) show how negative shocks are amplified if investors withdraw money from
funds. Gromb and Vayanos (2002) show that when margin-constrained arbitrageurs face capital
scarcity, a negative shock induces them to liquidate their own positions and widens price
discrepancy.5 Brunnermeier and Pedersen (2009) study the feedback effects between margins
and market conditions.
Basak and Croitoru (2006) and Garleanu and Pedersen (2009) show that, in equilibrium,
the basis between an asset S and a derivative D (i.e. the expected return on S minus the expected
return on D) is not zero if there are leverage constraints on S and position limits on D. The basis
represents differences in risk premia required by heterogeneous groups of investors. For
example, Garleanu and Pedersen (2009) show that if risk-averse investors can short only a
limited amount of D, then in equilibrium the risk tolerant investor is long S and also long D, and
the basis is:
( )Dt
Stt
DSt mmBasis −≈− ψ (5)
where ψ is the margin constrained investor’s shadow cost of capital and mi is the margin on
security i. A positive basis arises if the margin on D is lower than that on S, which induces the
risk tolerant investor to accept a lower risk premium on D.
5 Geanakoplos (2003) derive margin constraints endogenously and shows the optimality of margin debt contracts.
12
Alternatively, if the risk-averse investor holds a long position in D then, in equilibrium,
the risk-tolerant investor goes long in S and short in D. Since the latter has to pay margins on
both legs of the basis trade, the basis is a function of the sum of the two margins:
( )Dt
Stt
DSt mmBasis +≈− ψ (6)
In the context of CIP deviations, the basis is the implied rate minus USD LIBOR which
may be viewed as the return from the FX swap position minus the LIBOR rate. In normal times,
the deviation is on average negative (Table 1) which means that BasisS-D>0. This implies higher
margins on the FX swap position, as one might expect given that the swap is collaterized while
the LIBOR position is not. During the crisis, however, the deviation is generally positive which
means that BasisS-D<0. In the context of equation (5), this happens if the margin on the FX swap
position exceeds that on the LIBOR position, possibly due to the heightened illiquidity of the FX
swap market during the crisis.
INSERT TABLE 2 HERE
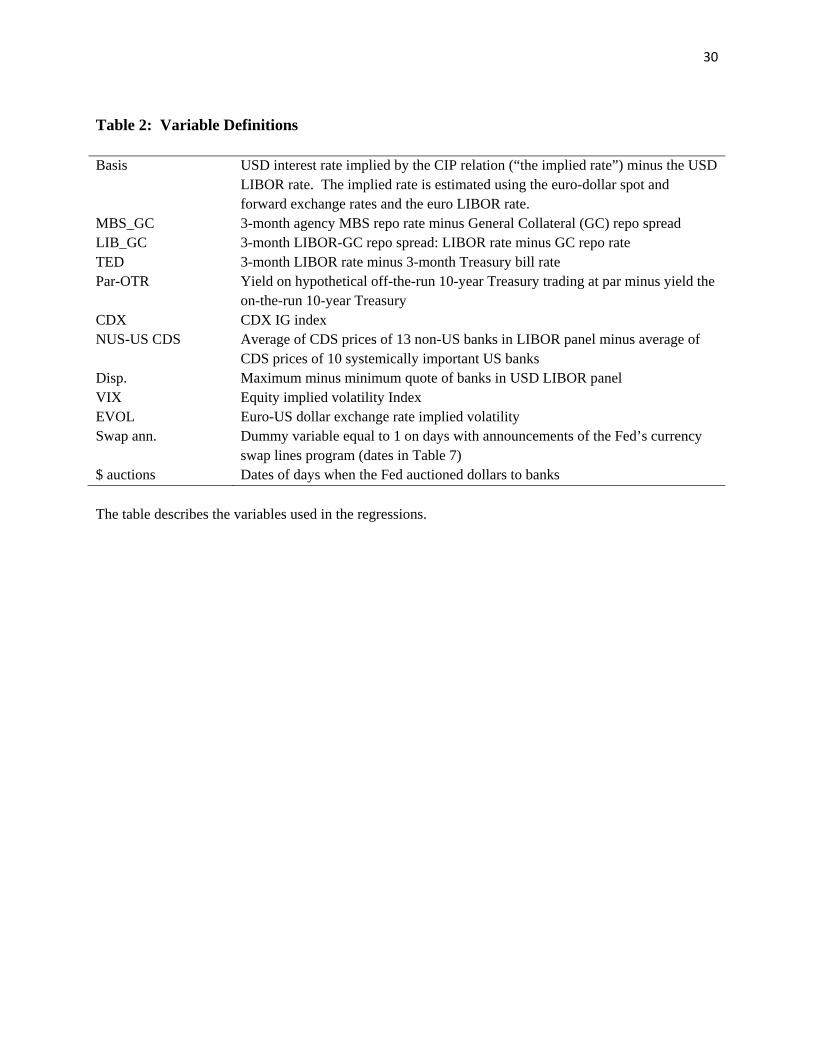
We now discuss the empirical proxies for margin constraints and the shadow cost of
capital. Since arbitrage transactions are not riskless in reality, we also discuss a number of risk
measures that we propose as determinants of the basis. A summary of all variable definitions is
in Table 2.
A. Empirical proxy for margin constraint and shadow cost of capital
Our empirical proxy for the tightness of margin conditions is the 3-month agency MBS-GC
repo spread which is the repo rate using agency mortgage-backed securities (MBS) as collateral
minus the General Collateral (GC) repo rate using Treasury securities as collateral. Banks rely
on the repo market for short term collaterized financing, and so the repo rates should reflect
13
financing stress during the crisis.6 Since both MBS and GC repo loans are collaterized, the
spread between them mainly reflects the liquidity difference between the two assets. In
particular, agency MBS securities became highly illiquid during the crisis, leading to an increase
in the agency MBS-GC repo spread. Since margins are expected to increase with illiquidity,
increases in the MBS-GC repo spread is as a proxy for increasingly tight margin conditions.7
The data is from Bloomberg.
INSERT FIGURE 5 HERE
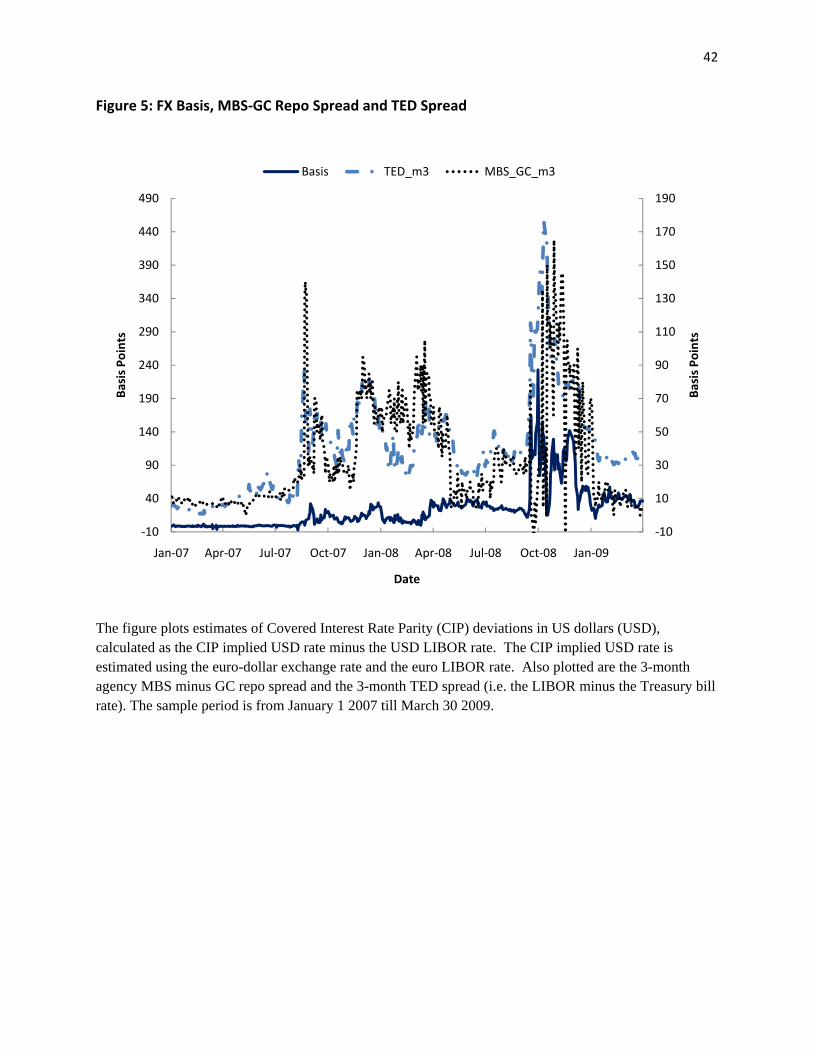
Figure 5 plots the agency-MBS repo spread and the basis based on the euro-dollar FX rate
and the USD LIBOR rate. Except for brief periods after the Lehman bankruptcy, the repo spread
is positive, consistent with the greater illiquidity of MBS relative to Treasuries. The expected
association between the CIP deviation and the repo spread is positive. While this is true for
some periods during the crisis, for other periods (especially in 2008), the repo spread and the
basis appears to diverge. We will examine the co-movement and the basis in greater detail in the
next section.
Garleanu and Pedersen (2009) show that the arbitrageur’s shadow cost of capital is the
interest rate spread between an uncollaterized and collaterized loan. We use the 3-month TED
spread (i.e. the LIBOR minus the Treasury bill rate) and the 3-month LIBOR-GC repo spread as
proxies for the shadow cost of capital. Figure 5, which plots the TED spread over the sample
period, shows that the basis and the TED spread move together, as also shown by Garleanu and
Pedersen (2009). The expected association between the CIP deviation and the TED or the
6 Brunnermeier (2008) uses this spread to illustrate liquidity risk during the crisis. 7 Garleanu and Pedersen (2009) use the tightness of credit condition variable in the senior officer bank loan survey as a proxy for increasing tightness. This data, however, is only available at the quarterly frequency.
14
LIBOR-GC repo spread is positive and Figure 5 shows that the basis and the TED spread
generally co-move together.
B. Empirical proxy for credit and liquidity risk
If arbitrage was not riskless during the crisis, then CIP deviations need not constitute
violations of the Law of One Price. As our discussion of the repo spread indicated, there was
market liquidity risk as the MBS market became illiquid before the Fed’s TSLF program
improved liquidity in the market. In addition, counterparty risk increased substantially during
the crisis, which increased the likelihood that the FX swap contract would have to be replaced on
unfavorable terms.
The market liquidity risk measure is the yield of a hypothetical 10-year off-the-run par
bond minus the on-the-run 10-year Treasury yield, called the par-OTR spread. The data for the
on-the-run 10-year Treasury yield is from Haver while the par bond yields are from the public
website of the Federal Reserve Board of Governors. The hypothetical 10-year Treasury trading at
par is derived from a Nelson-Siegel-Svensson zero-coupon curve estimated from off-the-run
Treasury coupon securities. The par-OTR spread is a measure of the market liquidity premium
of the on-the-run 10-year Treasury, and is likely related to liquidity premia in the Treasury
market in general. Since Treasury securities are the most liquid U.S. securities and usually richen
when demand for liquid and safe securities rises, the par-OTR spread is taken to be a proxy of
systematic market liquidity risk in the economy.8
The expected sign of the correlation between illiquidity measures and the basis is
ambiguous. Increases in the par-OTR spread have two effects. Increased illiquidity in the US
8 Although it represents a liquidity premium, the PAR-OTR spread cannot be taken to represent margin constraints, unlike the MBS-GC spread. First, the PAR-OTR is a spread between yields and not repo rates. Indeed, repo rates for on-the-run Treasuries diverge from GC repo rates (Keane (1995)). Second, changes in the PAR-OTR spread also depend on the specialness of Treasury securities (Duffie (1996)).
15
markets makes it less likely that US institutions would be willing to supply dollars in the FX
swap market which should increase the basis. However, increased illiquidity also reduces
funding in the US market and thereby increases the LIBOR rate, which tends to decrease the
basis.
The credit risk measures are:
• CDX: The CDX IG index of CDS prices
• Dispersion: The quote dispersion of LIBOR panel banks
CDX represents the average default risk in the economy. Data on the 5-year CDX
investment grade (IG) index is from Markit. The index covers 125 names in North America and
represents the average credit risk of major global firms. Counterparty risk is represented by the
quote dispersion among LIBOR panel banks. To measure quote dispersion, we obtain from
Bloomberg the daily 3-month USD LIBOR quotes of the 16 banks in the LIBOR panel of the
British Bankers’ Association and then calculate the maximum minus the minimum of the quotes
each day. The quote dispersion shows the extent to which some LIBOR panel banks report
greater borrowing costs, and therefore more default risk, compared to the typical LIBOR panel
bank. In turn, increased quote dispersion of LIBOR banks may reflect a situation where banks in
general charge higher interest rates to higher risk counterparties. The expected sign of the
correlation of credit risk with the basis depends on whether the credit risk is greater for US or for
non-US institutions. If the credit risk increases more for non-US firms then iF increases more
than USD LIBOR and so the basis increases; in the reverse case, the basis decreases.
Finally, we control for foreign exchange risk and general market risk using:
• EVOL: Options-implied volatility in the euro-USD foreign exchange market.
• VIX: Options-implied volatility in the equity market
16
The implied volatility for the euro-USD exchange rate is calculated by JP Morgan, and this data
is obtained from Bloomberg. Investors are affected by FX volatility if they need to replace the
FX swaps contract due to the failure of their counterparty. The equity implied volatility is given
by the VIX measure, data for which is pulled from Bloomberg. We use the VIX to measure the
risk aversion of investors in the broad financial markets. To the extent that equity investors
respond to the same set of risk factors as investors in the money markets, movements in VIX
may be informative of variations in funding costs.
IV. Explaining CIP Deviations: Results
In this section, we explain deviations in CIP as a breakdown in the Law of One Price due
to capital constraints of arbitrageurs in the international money and FX markets (section A).
Specifically, changes in margin constraints and arbitrageurs’ cost of capital are expected to
determine CIP deviations. In section B, we also explore the hypothesis that CIP deviations
reflected the increased risk of arbitrage transactions and therefore did not necessarily constitute a
breakdown in the Law of One Price. In section C, we examine whether ddeviations from CIP
may be expected to increase in the credit risk of non-US institutions relative to US firms.
A. CIP deviations, margin constraint and shadow cost of capital
INSERT TABLE 3 HERE
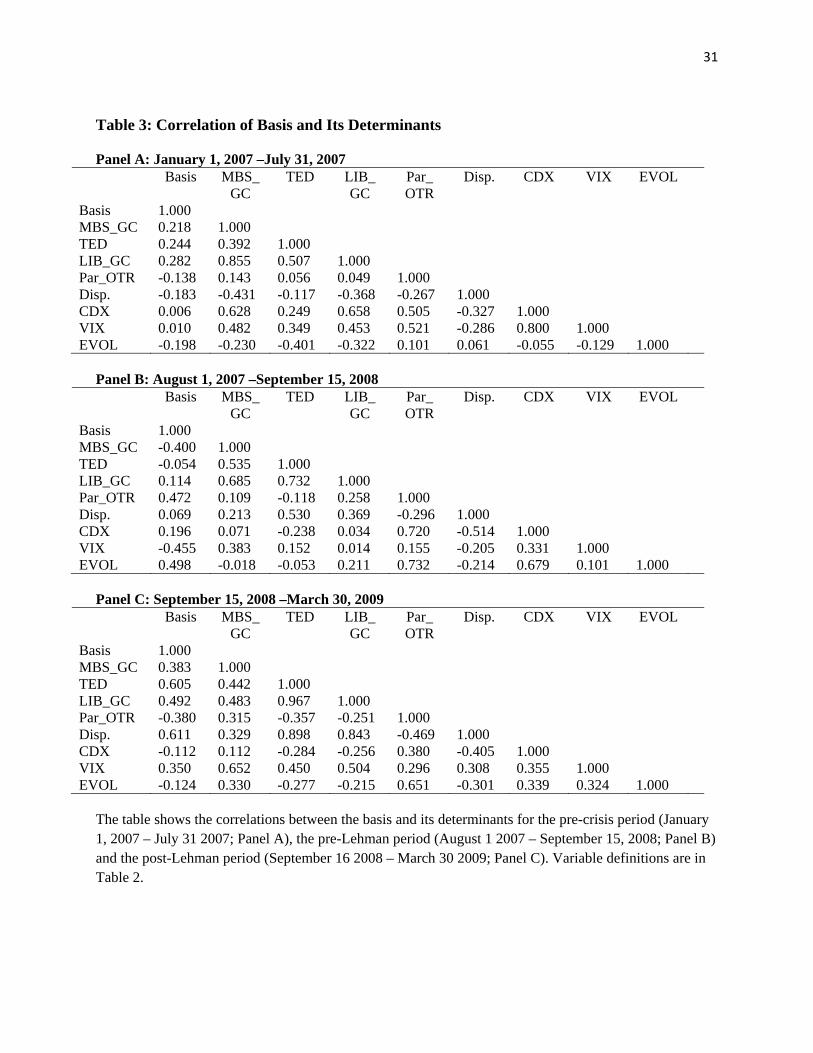
Table 3 shows the correlation of the basis with the MBS-GC repo spread. Prior to the
crisis, the basis and the repo spread moved together, with a correlation of 0.15, consistent with
theory. From August 2007 till September 15 2008, the basis and the repo spread tend to diverge,
and the correlation becomes negative (-0.40). The negative co-movement generally occurs in
2008 when the Federal Reserve intervened to exchange illiquid MBS collateral for liquid
17
Treasury collateral via the TSLF program (Fleming, Hrung and Keane, 2009). This had the
effect of bringing down the illiquidity premium in the repo spread at a time when the basis was
still increasing. After September 15 2008, the correlation becomes positive again (0.38). In
contrast to the repo spread, the correlation of the basis, TED and the LIBOR-GC spread are
positive for all sample periods, as expected.
INSERT TABLE 4 HERE
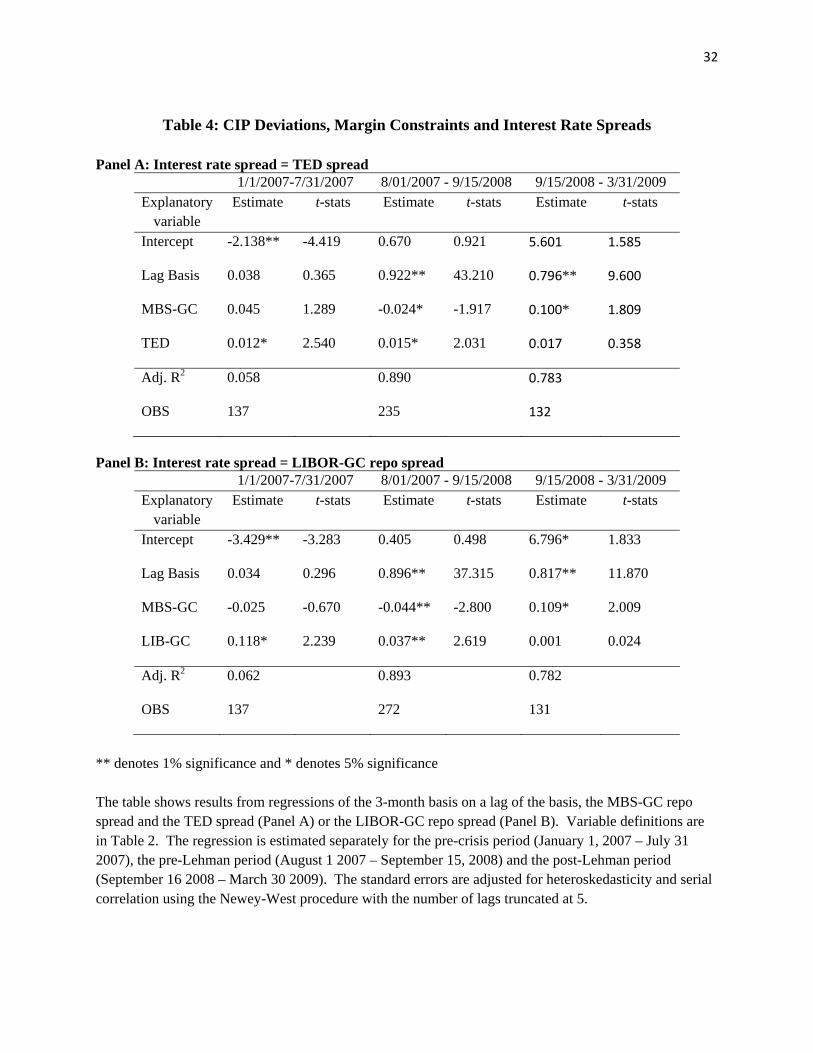
Table 4 shows results from a regression of the USD basis on its own lag, the repo spread
and the shadow cost of capital for the pre-crisis period, the pre-Lehman and post-Lehman crisis
periods. Panel A shows results when the shadow cost of capital is represented by the TED
spread. For the pre-crisis period, the margin constraint and the TED spread are both estimated
positively, but only the TED spread coefficient is significant. The intercept is negative and
significant, implying a higher margin on the uncollaterized LIBOR position, as expected. The
adjusted R-squared is only about 6%, indicating that, in the pre-crisis period, changes in the basis
are mostly random. For the period August 2007 to September 15 2008, the basis becomes highly
autocorrelated and the intercept is no longer significant. Both the repo spread and the TED
spread are significant determinants of the basis, with a negative and positive sign, respectively.
In the final crisis period, the repo spread and the TED spread are positively associated with the
basis, but only the former result is significant. Panel B of Table 4 repeats the regressions using
the LIBOR-GC repo spread as the interest rate spread. The results are qualitatively similar to
those using the TED spread. Overall, the signs of the coefficients are consistent with the
unconditional correlations. The results indicate that the cost of capital is a positive, and
generally significant, determinant of the basis, consistent with Garleanu and Pedersen (2009). In
addition, the margin constraint is binding during the crisis period, with tighter margins increasing
18
the basis except for the early period of the crisis when the Fed intervened to relax collateral
constraints, as discussed earlier.
B. CIP deviations, credit risk and liquidity risk
Table 3 shows that the correlation between the basis and the par-OTR spread has changed
over the course of the crisis. It is positive prior to the crisis, negative in the pre-Lehman period
and positive again after the Lehman bankruptcy. The correlation of the basis with the CDX
index is positive before the Lehman bankruptcy and negative afterwards. The changing signs of
the correlations suggest that the relative credit and liquidity risk of US institutions vis-à-vis non-
US firms were changing over the course of the crisis. The correlation of the basis with
dispersion is always positive in the crisis period and is more than 60% after the Lehman
bankruptcy. Dispersion has relatively low correlation with CDS prices, indicating that they measure
different dimensions of credit risk. EVOL and VIX have a correlation of close to 50% with the
basis in the pre-Lehman period and more moderate correlation afterwards.
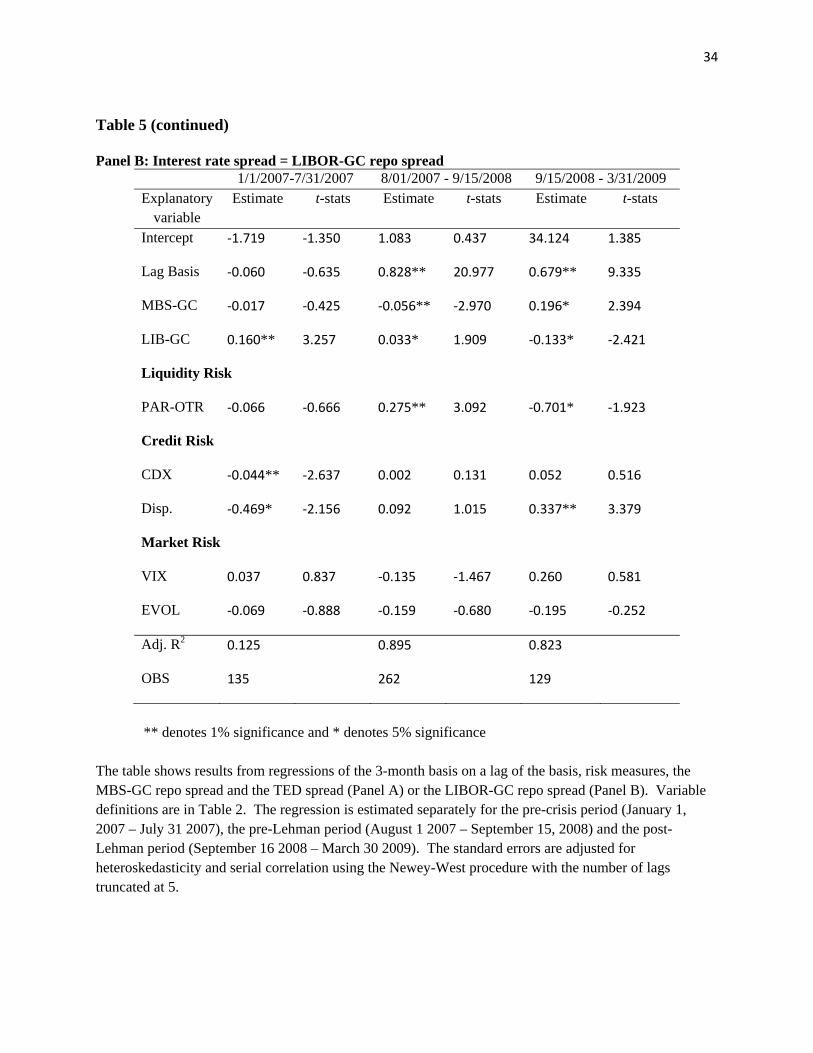
INSERT TABLE 5 HERE
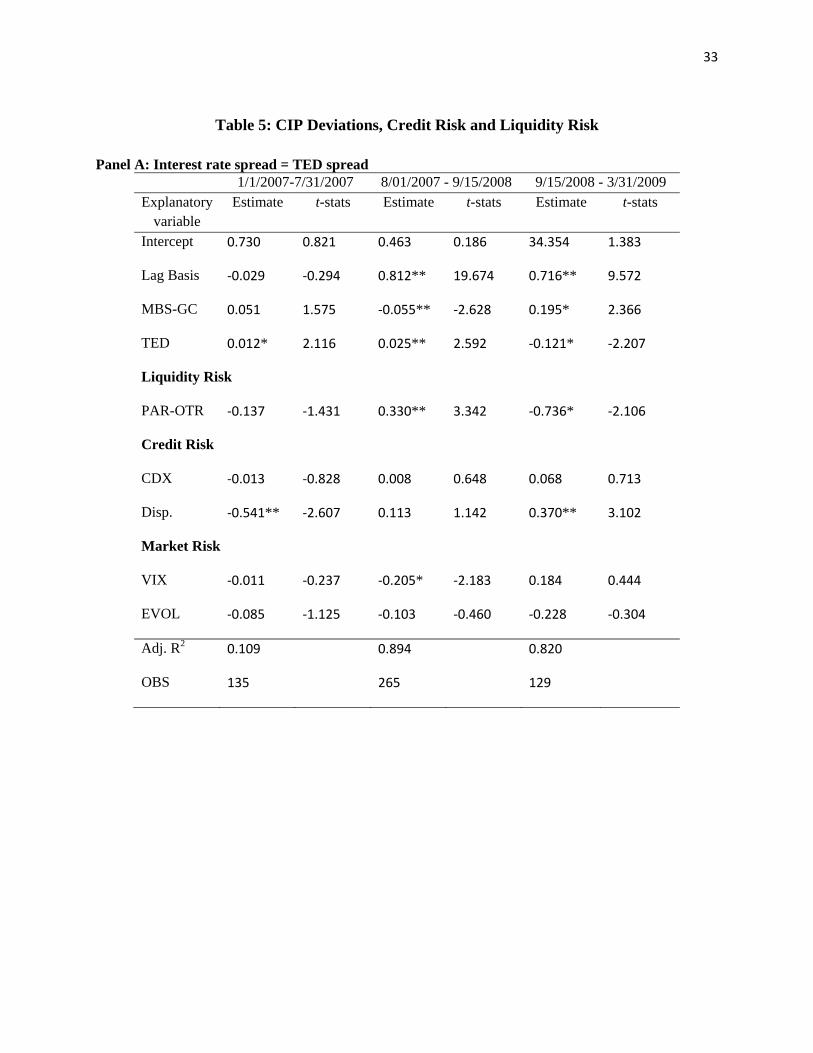
Table 5 shows results from a regression of the USD basis on its own lag, the repo spread,
the interest rate spread and the various risk measures. Panel A shows results when we use the
TED spread. The sign and significance of the repo spread and the TED spread are the same as
when we did not include the risk measures, with one exception. In the post-Lehman period, the
TED spread has a negative and significant association with the basis, in contrast with a positive
sign earlier. During this period, the correlation between the TED spread and Dispersion is 0.90
from Table 3, indicating that the TED spread is mainly driven by counterparty risk. Dispersion
is positively and significantly with the basis at this time, and it is probably difficult to estimate
the separately the effects of the TED spread and counterparty risk. Of the remaining risk
19
measures, PAR-OTR is a significant determinant of the basis during the crisis period. It has a
negative association with the basis in the pre-Lehman period and a positive association
afterwards. This suggests that US banks may have been hoarding liquidity in the pre-Lehman
phase of the crisis, reducing the supply of dollars to the FX swap market, and thereby increasing
the basis. The CDX index and EVOL are not significant determinants of the basis, while the
VIX is only significant in the pre-Lehman crisis period. Panel B reports results when the
LIBOR-GC repo spread is used; the results are similar to those in Panel A.
To what extent are the CIP deviations driven by increases in risk measures during the
crisis? Comparing Tables 4 and 5, addition of the risk measures doubles the adjusted R-squared
during the pre-crisis period. In the pre-Lehman crisis period, there is no change in the adjusted
R-squared; in the post-Lehman period, it increases from about 0.78 to about 0.82. Of the risk
measures, the PAR-OTR measure is a significant determinant of the basis during the crisis period
but it is not significant during the pre-crisis period. Dispersion is a significant determinant of the
basis during the pre-crisis period and the post-Lehman period. This evidence points to a
moderate effect of the risk measures during the post-Lehman phase of the crisis.
C. Relative credit risk of US versus non-US firms
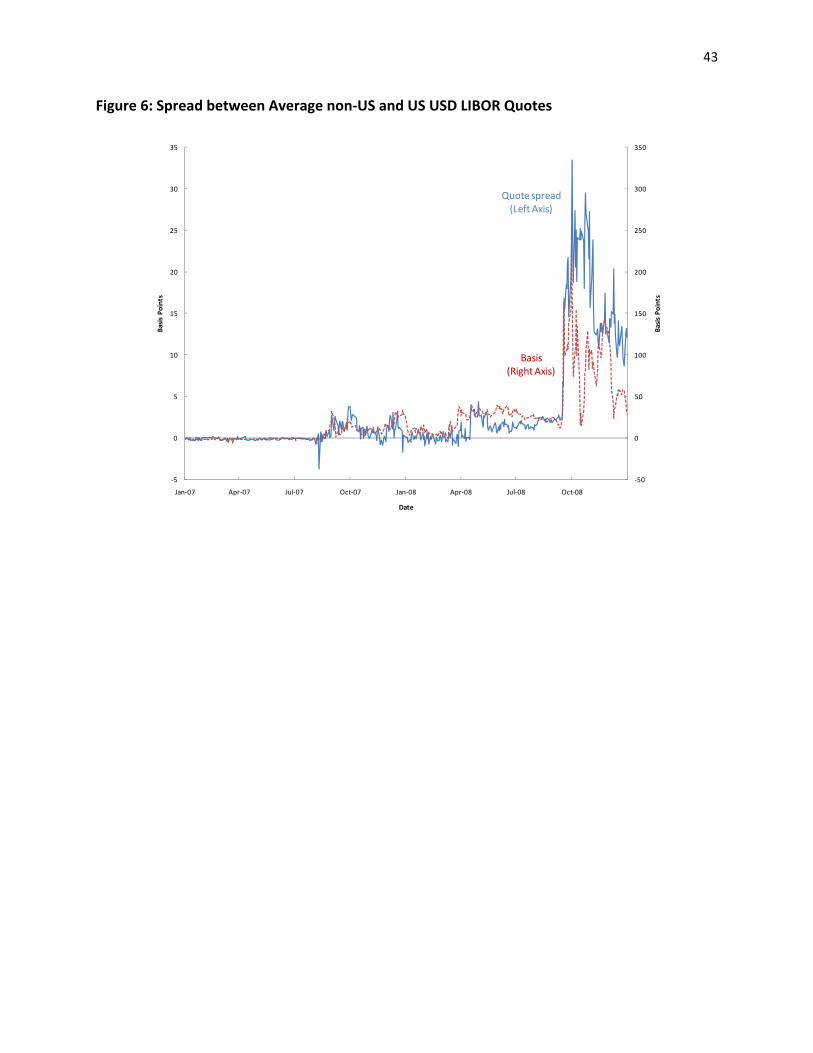
INSERT FIGURE 6 HERE
The expected sign of the correlation of credit risk with the basis depends on whether the
credit risk increases more for US firms (which increases USD LIBOR) or more for non-US
institutions (which increases the foreign interest rate iF). Figure 6 shows quotes submitted by
firms to the LIBOR panel indicate the dollar funding costs of US and non-US institutions.
Throughout the crisis, the average quote submitted by a non-US bank on the USD LIBOR panel
has tracked slightly higher than the average quote submitted by a US bank and this difference has
20
become more pronounced since September 2008. This suggests meaningful differences in dollar
funding costs between US and non-US institutions over this period.
Given the ambiguity of the effects of the aggregate default risk measure, we also define a
measure of relative default risk:
• Relative default risk: The average CDS prices of 13 non-US banks in the LIBOR panel
minus the average CDS prices of 10 systematically important US banks.9
We expect the relative credit risk measure to be positively correlated with the basis.
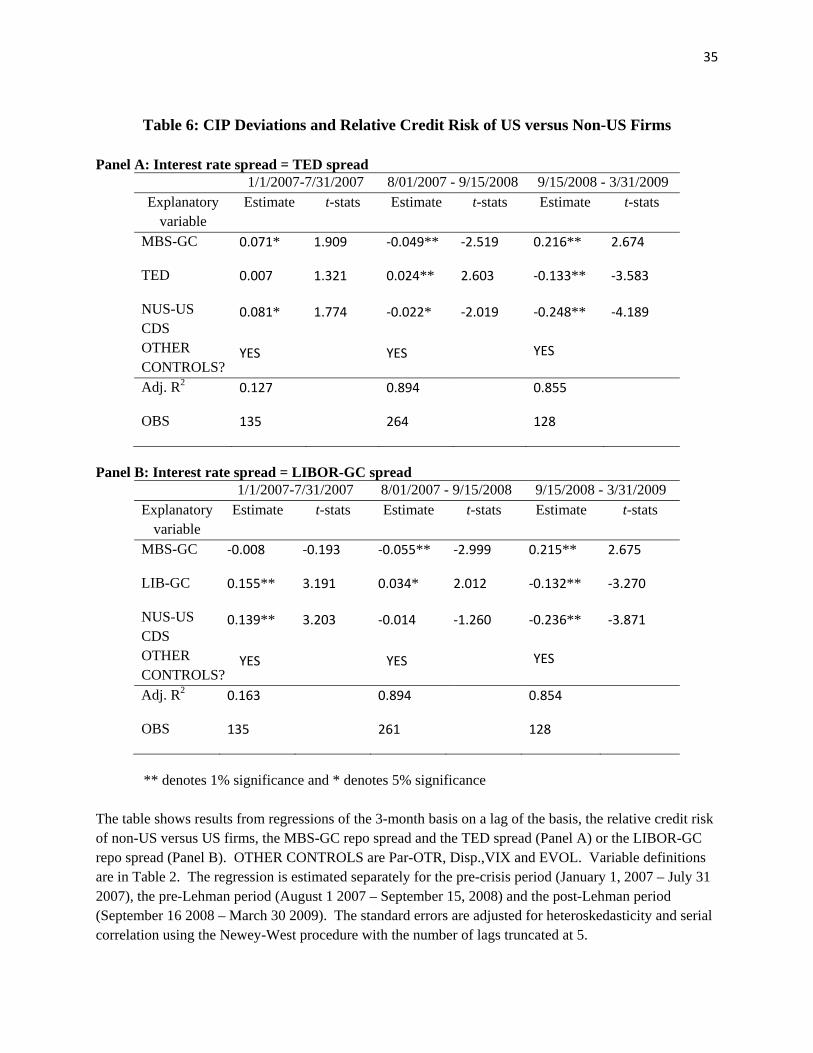
INSERT TABLE 6 HERE
Table 6 shows results from the same regression as earlier, with the difference that the
CDX index is replaced by the relative credit risk of non-US versus US banks. For brevity, we do
not show results for the other risk measures. The results in Panel A, using the TED spread,
shows that the relative credit risk measure is significant in all periods. The results in Panel B,
using the LIBOR-GC repo spread, shows that it is significant in every period except the pre-
Lehman crisis period. Replacing the CDX index with the relative credit risk measure increases
the adjusted R-squared in the pre-crisis period and the post-Lehman period.
In this section, we have provided evidence that changes in margin constraints and the cost
of capital were significant determinants of CIP deviations during the crisis period, consistent
with the hypothesis that the CIP deviations represent violations of the Law of One Price as
arbitrageurs became capital constrained. Market liquidity risk and the relative credit risk of non-
US institutions are also significant determinants of CIP deviations, especially after the Lehman
bankruptcy. Indeed, the Federal Reserve provided unlimited amounts of dollars to foreign
9 The 10 systematically important US banks are those defined by the Treasury in its TARP plan. : Bank of America, Bank of NY Mellon, Citigroup, Goldman Sachs, JP Morgan Chase, Morgan Stanley, Merrill Lynch, State Street Corp, Wachovia, Wells Fargo. Bank of America agreed to buy Merrill Lynch on September 15 2008 but the acquisition did not officially close till January 2009. Wells Fargo acquired Wachovia on October 4 2008.
21
Central Banks after September 20008. In the next section, we examine whether the Fed’s dollar
liquidity supply eased funding constraints and reduced the basis.
V. Central Bank Currency Swaps and CIP Deviations
In this section, we investigate the effect of the Central Bank swap lines on deviations of
CIP. To the extent that the deviations are due to arbitrageur’s capital constraints in the
international money markets, the supply of dollars by the Federal Reserve may be expected to
alleviate the problem. The Fed supplies dollars to international Central Banks through bilateral
currency arrangements whereby it supplies dollars in exchange for foreign currency for a
specified period. The foreign Central Bank then supplies dollars to banks in its jurisdictions via
auctions.
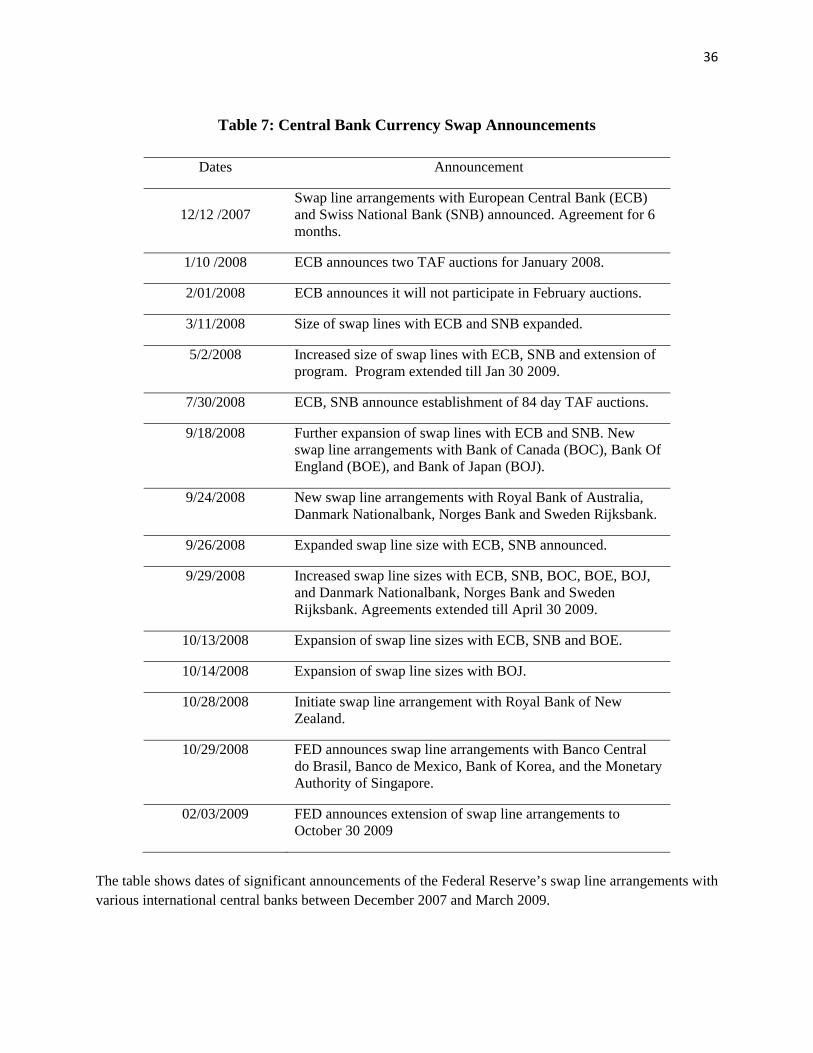
INSERT TABLE 7 HERE
Table 7 shows significant announcement dates for the program. The program was
initiated on December 12 2007 as the Fed arranged swap lines with the European Central Bank
(ECB) and the Swiss National Bank (SNB). As the dollar shortage in the international money
markets became more acute, the program was expanded in size and scope. After the Lehman
bankruptcy in September 2008, the size of the swap lines was greatly expanded and ultimately
the cap on the amount distributed was removed altogether.
To determine the effect of the program on the basis, we define a dummy variable that
equals 1 on days with swap announcements. The only exception is February 1 2008 when the
dummy has value -1 because the ECB withdrew from the auctions in February, which effectively
constituted a negative supply of dollars. We also have a dummy variable for days when the Fed
conducted TAF auctions where US branches of foreign banks participated and obtained dollars.
We do not include dummy variables for auction dates of the ECB since these dates coincided
22
with TAF auction days leading to a collinearity problem in the regressions. While we expect the
market impact of the program to be manifested mainly on announcement days, the initial
auctions may be expected to have additional impacts as market participants learnt about the
program. As the program progressed, and participants became familiar, the auctions (which fall
on specific dates of the month), are expected to have less effect on the basis.
In estimating the effects of the swap lines, we control for credit risk but not for liquidity
risk. This is because the swap lines are expected to reduce liquidity risk. In addition, we control
for term risk since the loans are for term maturities (mostly for 28 and 84 day maturities) rather
than for overnight maturities. We use the difference between the 10-year Treasury note and the
3-month bill (both constant maturity) to capture changes in the slope of the yield curve. Finally,
we switch from using the level of the basis to using changes in the basis. This is because the
swap dummy is a binary variable. If the effect of the swap lines is persistent, then it is necessary
to use the change in the basis to capture this effect, as explained by McAndrews et al (2008) in
the context of the Fed’s Term Auction Facilities (TAF).
The regression is of the following form:
tttt CONTROLSAuctionsSwapAnnInterceptBasis εαα +Δ+++=Δ $21 (7)
where SwapAnn is a dummy variable for announcement days of the swap line program,
$Auctions is a dummy variable for TAF auction days, CONTROL are the variables to control for
credit risk and market risk and Δ indicates that the variable is in changes. The control factors are
the CDX index, Dispersion, VIX, EVOL and the term spread.
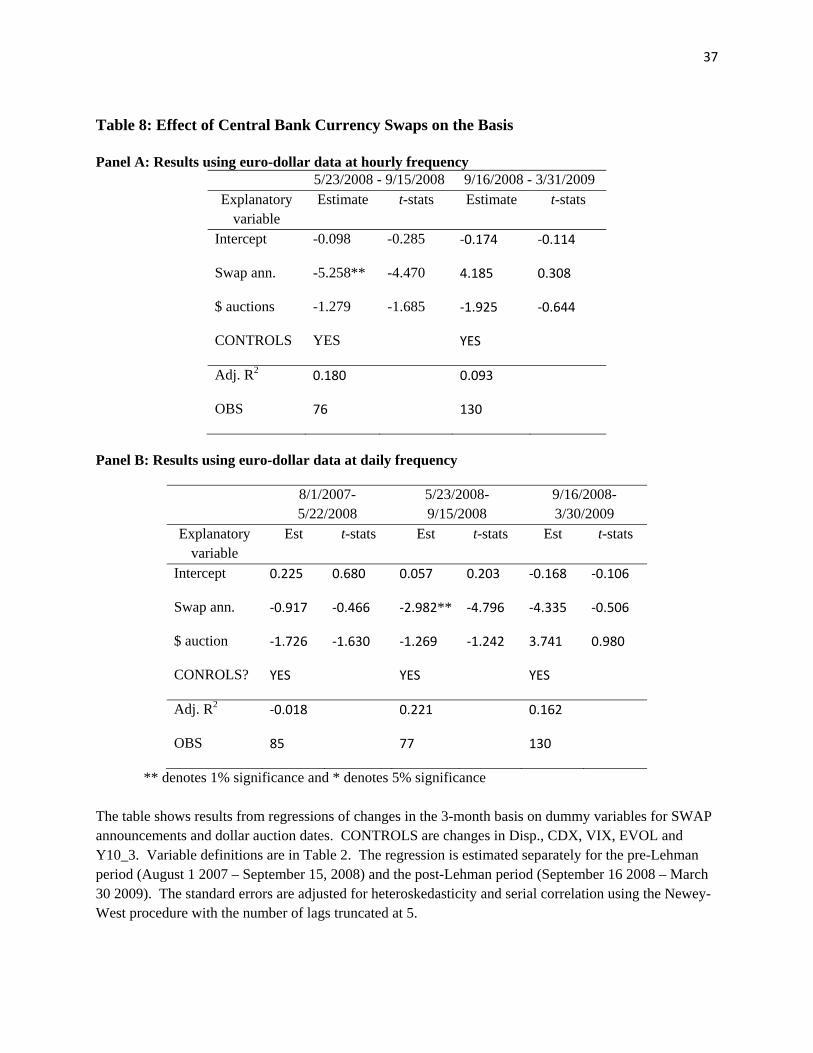
INSERT TABLE 8 HERE
The results of the regression are in Table 8. The sample period is August 1 2007 till
March 30 2009. Since announcement effects may be short-lived, higher data frequency is likely
23
to improved results. Consequently, we initially report results in Panel A for the basis using the
hourly euro-dollar FX data which is available from May 23 2008. To check for robustness, we
then repeat the regression using the daily euro-dollar FX data. The results in Panel A indicate
that, in the period from May 23 2008 to September 15 2008, the swap line announcements
reduced the basis by an average of more than 5 basis points. In addition, the dollar auctions
reduced the basis by an additional 1.3 basis point per auction, although this result is only
significant at the 10% level. In contrast, for the period after Lehman, there is no statistically
significant effect of the swap lines on the basis. This result is intuitive since, from our prior
results, counterparty risk was a significant determinant of the basis in the post-Lehman period
and the Fed’s program was not designed to reduce counterparty risk.
The results in Panel B, using daily data, are qualitatively similar to those in Panel A when
considering the same sample period. Thus for the period from May 23 2008 to September 15
2008, the swap announcements reduce the basis by an average of 3 basis points but there is no
statistically significant effect in the post-Lehman period. Considering the period from August
2007 to September 15 2008, we find that the swap announcements were not significant but the
auctions reduced the basis by almost 1.5 basis points per auction. For the period from December
2007 till May 2008, the swap line announcements had no significant effect on the basis while the
auctions reduced the basis by about 2 basis points per auction (although this effect is significant
only at the 10% level).
In summary, the Fed’s swap lines program appears to have been successful in reducing
the basis during periods when capital constraints were binding and less so during periods when
counterparty risk was a significant determinant of the basis. In the above analysis, we only
looked at the effect of swap lines on the interest rate basis. Aizenman and Pasricha (2009) find

24
that the swap lines significantly impact exchange rates of emerging market countries. Thus, it is
possible that the swap lines affect CIP deviations through exchange rate changes in addition to
the interest rate differentials.
VI. Conclusion
In this paper, we document a substantial and significant breakdown in CIP following the
onset of the current crisis. Specifically, we measure the deviation from CIP by the dollar
“basis”, defined as the difference between the dollar rate implied by the CIP relation (henceforth,
the “implied rate”) and a benchmark dollar interest rate. We show that, while in normal periods,
the basis is miniscule it has been consistently large and positive since the start of the crisis and
increased dramatically in mid-September 2008 following the bankruptcy of Lehman Brothers.
This result is robust to the use of alternative benchmark dollar interest rates (such as USD
LIBOR, NYFR and Treasury Bill rates) and the use of different currency pairs (such as the USD-
euro, USD-Japanese Yen, USD - British pound, USD - Swiss franc, and USD - New Zealand
dollar) in deriving the basis.
Our results show that capital constraints of arbitrageurs appear to be a key driver of CIP
deviations. Our proxy for margin conditions and the cost of capital are significant determinants
of the basis, especially during the crisis period. These results are consistent with a deviation of
the Law of One Price during the crisis as arbitrage transactions became difficult in the
international money markets due to funding constraints. In addition, we find evidence that
counterparty risk became an issue following the bankruptcy of Lehman Brothers, so that
previously riskless cash flows became risky. These results indicate a breakdown of arbitrage
transactions in the international capital markets partly due to lack of capital and partly due to
heightened counterparty credit risk.
25
To ease short-term dollar funding constraints in the international money markets, the
Federal Reserve agreed to supply dollars to foreign central banks via reciprocal currency
arrangements (swap lines) with several developed and a few emerging market countries. We
find that announcements of the swap lines program were successful in bringing down the basis
by an average of 5 basis points. The actual auctions of dollars were also effective in bringing
down the basis. However, in the post-Lehman period, the swap lines programs did not have a
significant effect on the basis possibly because they were not designed to bring down high levels
of counterparty risk. In addition, the swap might affect exchange rates as shown by Aizenman
and Pasricha (2009) who find an affect of the swap lines on emerging market countries
(however, they did not examine exchange rates of developed countries). This is an area for
further research.
26
References
Aizenman, Joshua and Gurnain Kaur Pasricha, 2009, Selective Swap Arrangements and the
Global Financial Crisis, Analysis and Interpretation, NBER Working Paper 14821.
Baba, Naohiko and Frank Packer, 2008, Interpreting Deviations from Covered Interest Rate
Parity during the Financial Market Turmoil of 2007-2008, Bank of International
Settlements.
Basak, Suleyman and Benjamin Croitoru, 2006, On the Role of Arbitrageurs in Financial
Markets, Journal of Financial Economics, 81, 1, 143-173.
Brunnermeier, Markus, Nagel, Stefan and Lasse H. Pedersen, 2008, Carry Trades and Currency
Crashes, NBER Macroeconomics Annual, Vol. 23.
Duffie, Darrell and Ming Huang, 1996, Swap Rates and Credit Quality, Journal of Finance, 51,
921-950.
Fleming, Michael J., Hrung, Warren B. and Frank M. Keane, 2009, The Term Securities Lending
Facility: Origin, Design, and Effects, Current Issues in Economics and Finance, 15, 2.
Geanakoplos, John, 2003, Liquidity, Default and Crashes: Endogenous Contracts in General
Equilibrium, in Advances in Economics and Econometrics: Theory and Applications II,
Econometric Society Monographs: Eighth World Congress, ed. by M. Dewatripont, L. P.
Hansen, and S.J. Turnovsky. Cambridge University Press, Cambridge, UK, vol. 2, pp 170-
205.
Garleanu, Nicolae and Lasse Heje Pedersen, 2009, Margin-Based Asset Pricing and Deviations
from the Law of One Price, Working Paper, NYU and UC Berkeley.
Gromb D. and D. Vayanos, 2002, Equilibrium and Welfare in Markets with Financial
Constrained Arbitrageurs, Journal of Financial Economics, 66 (2-3), 361-407.
27
McAndrews, James, Sarkar, Asani and Zhenyu Wang, 2008, The Effect of the Term Auction
Facility on the London Inter-Bank Offered Rate, Working Paper, Federal Reserve Bank of
New York.
Obstfeld, Maurice, Shambaugh, Jay C. and Alan M. Taylor, 2009, Financial Instability, Reserves
and Central Bank Swap Lines, NBER Working Paper 14826.
Shleifer, Andrei and Larry H. Summers, 1990, The Noise Trader Approach to Finance, Journal
of Economic Perspectives, 4(2), 19-33.
Shleifer, Andrei and Larry H. Summers, 1997, The Limits of Arbitrage, Journal of Finance,
52(1), 35-55.
Taylor, John. B. and John C. Williams, 2009, A Black Swan in the Money Market, American
Economic Journal: Macroeconomics 1(1), 58-83.
Taylor, Mark P., 1989, Covered Interest Arbitrage and Market Turbulence, Economic Journal
99, 376-391.
28
Table 1: Measures of CIP Deviation
Panel A: Estimates based on euro-dollar exchange rate and alternative dollar interest rates
1/1/2007-7/31/2007 8/01/2007 - 9/15/2008 9/15/2008 - 3/31/2009 Interest
rate FX data
frequency Mean Max Mean Max Mean Max
LIBOR Daily -1.322 1.740 18.046 39.674 65.353 233.022
Obs. 144 279 135
LIBOR Hourly --- --- 27.073 40.772 70.024 246.314
Obs. --- 79 134
NYFR Daily --- --- 25.090 38.869 55.915 195.022
Obs. --- 75 133
T. Bill Daily 35.782 79.226 141.555 242.260 247.003 572.891
Obs. 145 281 135
29
Table 1 (continued) Panel B: Estimates based on dollar LIBOR rate and alternative currencies vis-à-vis dollar
8/01/2007 - 9/15/2008 9/15/2008 - 3/31/2009 Currency Mean Max Mean Max AUS 10.790 40.218 122.483 509.532
Obs 275 73
CHF 20.576 43.328 41.301 191.037
Obs 275 134
GBP 24.342 51.676 90.038 235.752
Obs 275 133
JPY 11.950 31.471 32.257 219.336
Obs 275 134
NZD 4.847 37.193 49.983 140.820
Obs 275 73
The table shows the mean and maximum values of deviations from Covered Interest Rate Parity (CIP) in basis points for the pre-crisis period (January 1, 2007 – July 31 2007), the pre-Lehman period (August 1 2007 – September 15, 2008) and the post-Lehman period (September 16 2008 – March 30 2009). The deviations are equal to the US dollar (USD) interest rate implied by the CIP relation (“the implied rate”) minus the USD interest rate. In Panel A of the table, the implied rate is estimated using the euro-dollar exchange rate and the euro LIBOR rate. The USD interest rates are USD LIBOR, NYFR or Treasury bill rates. The euro-dollar data frequency is either daily or hourly. The hourly dollar-euro data is available from May 23 2008 only. In Panel B of the table, the USD interest rate is USD LIBOR. The implied rate is based on the following exchange rates: USD-Australian dollar (AUS), USD-Swiss franc (CHF), USD -British pound (GBP), USD -Japanese Yen (JPY) and USD -New Zealand dollar (NZD). The USD-AUS and USD-NZD exchange rate data are only available through December 31 2008.
30
Table 2: Variable Definitions Basis USD interest rate implied by the CIP relation (“the implied rate”) minus the USD
LIBOR rate. The implied rate is estimated using the euro-dollar spot and forward exchange rates and the euro LIBOR rate.
MBS_GC 3-month agency MBS repo rate minus General Collateral (GC) repo spread LIB_GC 3-month LIBOR-GC repo spread: LIBOR rate minus GC repo rate TED 3-month LIBOR rate minus 3-month Treasury bill rate Par-OTR Yield on hypothetical off-the-run 10-year Treasury trading at par minus yield the
on-the-run 10-year Treasury CDX CDX IG index NUS-US CDS Average of CDS prices of 13 non-US banks in LIBOR panel minus average of
CDS prices of 10 systemically important US banks Disp. Maximum minus minimum quote of banks in USD LIBOR panel VIX Equity implied volatility Index EVOL Euro-US dollar exchange rate implied volatility Swap ann. Dummy variable equal to 1 on days with announcements of the Fed’s currency
swap lines program (dates in Table 7) $ auctions Dates of days when the Fed auctioned dollars to banks The table describes the variables used in the regressions.
31
Table 3: Correlation of Basis and Its Determinants
Panel A: January 1, 2007 –July 31, 2007 Basis MBS_
GC TED LIB_
GC Par_ OTR
Disp. CDX VIX EVOL
Basis 1.000 MBS_GC 0.218 1.000 TED 0.244 0.392 1.000 LIB_GC 0.282 0.855 0.507 1.000 Par_OTR -0.138 0.143 0.056 0.049 1.000 Disp. -0.183 -0.431 -0.117 -0.368 -0.267 1.000 CDX 0.006 0.628 0.249 0.658 0.505 -0.327 1.000 VIX 0.010 0.482 0.349 0.453 0.521 -0.286 0.800 1.000 EVOL -0.198 -0.230 -0.401 -0.322 0.101 0.061 -0.055 -0.129 1.000
Panel B: August 1, 2007 –September 15, 2008
Basis MBS_GC
TED LIB_ GC
Par_ OTR
Disp. CDX VIX EVOL
Basis 1.000 MBS_GC -0.400 1.000 TED -0.054 0.535 1.000 LIB_GC 0.114 0.685 0.732 1.000 Par_OTR 0.472 0.109 -0.118 0.258 1.000 Disp. 0.069 0.213 0.530 0.369 -0.296 1.000 CDX 0.196 0.071 -0.238 0.034 0.720 -0.514 1.000 VIX -0.455 0.383 0.152 0.014 0.155 -0.205 0.331 1.000 EVOL 0.498 -0.018 -0.053 0.211 0.732 -0.214 0.679 0.101 1.000
Panel C: September 15, 2008 –March 30, 2009
Basis MBS_GC
TED LIB_ GC
Par_ OTR
Disp. CDX VIX EVOL
Basis 1.000 MBS_GC 0.383 1.000 TED 0.605 0.442 1.000 LIB_GC 0.492 0.483 0.967 1.000 Par_OTR -0.380 0.315 -0.357 -0.251 1.000 Disp. 0.611 0.329 0.898 0.843 -0.469 1.000 CDX -0.112 0.112 -0.284 -0.256 0.380 -0.405 1.000 VIX 0.350 0.652 0.450 0.504 0.296 0.308 0.355 1.000 EVOL -0.124 0.330 -0.277 -0.215 0.651 -0.301 0.339 0.324 1.000
The table shows the correlations between the basis and its determinants for the pre-crisis period (January 1, 2007 – July 31 2007; Panel A), the pre-Lehman period (August 1 2007 – September 15, 2008; Panel B) and the post-Lehman period (September 16 2008 – March 30 2009; Panel C). Variable definitions are in Table 2.
32
Table 4: CIP Deviations, Margin Constraints and Interest Rate Spreads
Panel A: Interest rate spread = TED spread 1/1/2007-7/31/2007 8/01/2007 - 9/15/2008 9/15/2008 - 3/31/2009
Explanatory variable
Estimate t-stats Estimate t-stats Estimate t-stats
Intercept -2.138** -4.419 0.670 0.921 5.601 1.585
Lag Basis 0.038 0.365 0.922** 43.210 0.796** 9.600
MBS-GC 0.045 1.289 -0.024* -1.917 0.100* 1.809
TED 0.012* 2.540 0.015* 2.031 0.017 0.358
Adj. R2 0.058 0.890 0.783
OBS 137 235 132
Panel B: Interest rate spread = LIBOR-GC repo spread
1/1/2007-7/31/2007 8/01/2007 - 9/15/2008 9/15/2008 - 3/31/2009 Explanatory
variable Estimate t-stats Estimate t-stats Estimate t-stats
Intercept -3.429** -3.283 0.405 0.498 6.796* 1.833
Lag Basis 0.034 0.296 0.896** 37.315 0.817** 11.870
MBS-GC -0.025 -0.670 -0.044** -2.800 0.109* 2.009
LIB-GC 0.118* 2.239 0.037** 2.619 0.001 0.024
Adj. R2 0.062 0.893 0.782
OBS 137 272 131
** denotes 1% significance and * denotes 5% significance The table shows results from regressions of the 3-month basis on a lag of the basis, the MBS-GC repo spread and the TED spread (Panel A) or the LIBOR-GC repo spread (Panel B). Variable definitions are in Table 2. The regression is estimated separately for the pre-crisis period (January 1, 2007 – July 31 2007), the pre-Lehman period (August 1 2007 – September 15, 2008) and the post-Lehman period (September 16 2008 – March 30 2009). The standard errors are adjusted for heteroskedasticity and serial correlation using the Newey-West procedure with the number of lags truncated at 5.
33
Table 5: CIP Deviations, Credit Risk and Liquidity Risk
Panel A: Interest rate spread = TED spread 1/1/2007-7/31/2007 8/01/2007 - 9/15/2008 9/15/2008 - 3/31/2009
Explanatory variable
Estimate t-stats Estimate t-stats Estimate t-stats
Intercept 0.730 0.821 0.463 0.186 34.354 1.383
Lag Basis ‐0.029 ‐0.294 0.812** 19.674 0.716** 9.572
MBS-GC 0.051 1.575 ‐0.055** ‐2.628 0.195* 2.366
TED 0.012* 2.116 0.025** 2.592 ‐0.121* ‐2.207
Liquidity Risk
PAR-OTR ‐0.137 ‐1.431 0.330** 3.342 ‐0.736* ‐2.106
Credit Risk
CDX ‐0.013 ‐0.828 0.008 0.648 0.068 0.713
Disp. ‐0.541** ‐2.607 0.113 1.142 0.370** 3.102
Market Risk
VIX ‐0.011 ‐0.237 ‐0.205* ‐2.183 0.184 0.444
EVOL ‐0.085 ‐1.125 ‐0.103 ‐0.460 ‐0.228 ‐0.304
Adj. R2 0.109 0.894 0.820
OBS 135 265 129
34
Table 5 (continued) Panel B: Interest rate spread = LIBOR-GC repo spread
1/1/2007-7/31/2007 8/01/2007 - 9/15/2008 9/15/2008 - 3/31/2009 Explanatory
variable Estimate t-stats Estimate t-stats Estimate t-stats
Intercept ‐1.719 ‐1.350 1.083 0.437 34.124 1.385
Lag Basis ‐0.060 ‐0.635 0.828** 20.977 0.679** 9.335
MBS-GC ‐0.017 ‐0.425 ‐0.056** ‐2.970 0.196* 2.394
LIB-GC 0.160** 3.257 0.033* 1.909 ‐0.133* ‐2.421
Liquidity Risk
PAR-OTR ‐0.066 ‐0.666 0.275** 3.092 ‐0.701* ‐1.923
Credit Risk
CDX ‐0.044** ‐2.637 0.002 0.131 0.052 0.516
Disp. ‐0.469* ‐2.156 0.092 1.015 0.337** 3.379
Market Risk
VIX 0.037 0.837 ‐0.135 ‐1.467 0.260 0.581
EVOL ‐0.069 ‐0.888 ‐0.159 ‐0.680 ‐0.195 ‐0.252
Adj. R2 0.125 0.895 0.823
OBS 135 262 129
** denotes 1% significance and * denotes 5% significance
The table shows results from regressions of the 3-month basis on a lag of the basis, risk measures, the MBS-GC repo spread and the TED spread (Panel A) or the LIBOR-GC repo spread (Panel B). Variable definitions are in Table 2. The regression is estimated separately for the pre-crisis period (January 1, 2007 – July 31 2007), the pre-Lehman period (August 1 2007 – September 15, 2008) and the post-Lehman period (September 16 2008 – March 30 2009). The standard errors are adjusted for heteroskedasticity and serial correlation using the Newey-West procedure with the number of lags truncated at 5.
35
Table 6: CIP Deviations and Relative Credit Risk of US versus Non-US Firms
Panel A: Interest rate spread = TED spread 1/1/2007-7/31/2007 8/01/2007 - 9/15/2008 9/15/2008 - 3/31/2009
Explanatory variable
Estimate t-stats Estimate t-stats Estimate t-stats
MBS-GC 0.071* 1.909 ‐0.049** ‐2.519 0.216** 2.674
TED 0.007 1.321 0.024** 2.603 ‐0.133** ‐3.583
NUS-US CDS
0.081* 1.774 ‐0.022* ‐2.019 ‐0.248** ‐4.189
OTHER CONTROLS?
YES YES YES
Adj. R2 0.127 0.894 0.855
OBS 135 264 128
Panel B: Interest rate spread = LIBOR-GC spread
1/1/2007-7/31/2007 8/01/2007 - 9/15/2008 9/15/2008 - 3/31/2009 Explanatory
variable Estimate t-stats Estimate t-stats Estimate t-stats
MBS-GC ‐0.008 ‐0.193 ‐0.055** ‐2.999 0.215** 2.675
LIB-GC 0.155** 3.191 0.034* 2.012 ‐0.132** ‐3.270
NUS-US CDS
0.139** 3.203 ‐0.014 ‐1.260 ‐0.236** ‐3.871
OTHER CONTROLS?
YES YES YES
Adj. R2 0.163 0.894 0.854
OBS 135 261 128
** denotes 1% significance and * denotes 5% significance
The table shows results from regressions of the 3-month basis on a lag of the basis, the relative credit risk of non-US versus US firms, the MBS-GC repo spread and the TED spread (Panel A) or the LIBOR-GC repo spread (Panel B). OTHER CONTROLS are Par-OTR, Disp.,VIX and EVOL. Variable definitions are in Table 2. The regression is estimated separately for the pre-crisis period (January 1, 2007 – July 31 2007), the pre-Lehman period (August 1 2007 – September 15, 2008) and the post-Lehman period (September 16 2008 – March 30 2009). The standard errors are adjusted for heteroskedasticity and serial correlation using the Newey-West procedure with the number of lags truncated at 5.
36
Table 7: Central Bank Currency Swap Announcements
Dates Announcement
12/12 /2007 Swap line arrangements with European Central Bank (ECB) and Swiss National Bank (SNB) announced. Agreement for 6 months.
1/10 /2008 ECB announces two TAF auctions for January 2008.
2/01/2008 ECB announces it will not participate in February auctions.
3/11/2008 Size of swap lines with ECB and SNB expanded.
5/2/2008 Increased size of swap lines with ECB, SNB and extension of program. Program extended till Jan 30 2009.
7/30/2008 ECB, SNB announce establishment of 84 day TAF auctions.
9/18/2008 Further expansion of swap lines with ECB and SNB. New swap line arrangements with Bank of Canada (BOC), Bank Of England (BOE), and Bank of Japan (BOJ).
9/24/2008 New swap line arrangements with Royal Bank of Australia, Danmark Nationalbank, Norges Bank and Sweden Rijksbank.
9/26/2008 Expanded swap line size with ECB, SNB announced.
9/29/2008 Increased swap line sizes with ECB, SNB, BOC, BOE, BOJ, and Danmark Nationalbank, Norges Bank and Sweden Rijksbank. Agreements extended till April 30 2009.
10/13/2008 Expansion of swap line sizes with ECB, SNB and BOE.
10/14/2008 Expansion of swap line sizes with BOJ.
10/28/2008 Initiate swap line arrangement with Royal Bank of New Zealand.
10/29/2008 FED announces swap line arrangements with Banco Central do Brasil, Banco de Mexico, Bank of Korea, and the Monetary Authority of Singapore.
02/03/2009 FED announces extension of swap line arrangements to October 30 2009
The table shows dates of significant announcements of the Federal Reserve’s swap line arrangements with various international central banks between December 2007 and March 2009.
37
Table 8: Effect of Central Bank Currency Swaps on the Basis Panel A: Results using euro-dollar data at hourly frequency
5/23/2008 - 9/15/2008 9/16/2008 - 3/31/2009 Explanatory
variable Estimate t-stats Estimate t-stats
Intercept -0.098 -0.285 ‐0.174 ‐0.114
Swap ann. -5.258** -4.470 4.185 0.308
$ auctions -1.279 -1.685 ‐1.925 ‐0.644
CONTROLS YES YES
Adj. R2 0.180 0.093
OBS 76 130
Panel B: Results using euro-dollar data at daily frequency
8/1/2007-5/22/2008
5/23/2008-9/15/2008
9/16/2008-3/30/2009
Explanatory variable
Est t-stats Est t-stats Est t-stats
Intercept 0.225 0.680 0.057 0.203 ‐0.168 ‐0.106
Swap ann. ‐0.917 ‐0.466 ‐2.982** ‐4.796 ‐4.335 ‐0.506
$ auction ‐1.726 ‐1.630 ‐1.269 ‐1.242 3.741 0.980
CONROLS? YES YES YES
Adj. R2 ‐0.018 0.221 0.162
OBS 85 77 130
** denotes 1% significance and * denotes 5% significance The table shows results from regressions of changes in the 3-month basis on dummy variables for SWAP announcements and dollar auction dates. CONTROLS are changes in Disp., CDX, VIX, EVOL and Y10_3. Variable definitions are in Table 2. The regression is estimated separately for the pre-Lehman period (August 1 2007 – September 15, 2008) and the post-Lehman period (September 16 2008 – March 30 2009). The standard errors are adjusted for heteroskedasticity and serial correlation using the Newey-West procedure with the number of lags truncated at 5.
38
Figure 1: Euro‐USD FX Swap
U.S. Treasury Bill
European investor who has Euros and wantsto buy U.S. Treasury bill
Counterparty to FX Swap
Start: USD for bill
purchase
Maturity: final USD payment
Start: USD cash
Start: EUR cash
Maturity: EUR cash
Maturity: USD cashFX
Swap
The figure illustrates the mechanics of an FX basis swap for an European investor swapping euros for US dollars to buy Treasury Bills.

39
Figure 2: CIP Deviations Based on US Dollar LIBOR and Euro‐Dollar Exchange Rate January 2007 –March 2009
‐10
40
90
140
190
240
Jan‐07 Apr‐07 Jul‐07 Oct‐07 Jan‐08 Apr‐08 Jul‐08 Oct‐08 Jan‐09
Basis Po
ints
Date
Basis_hourly Basis_daily
The figure plots estimates of Covered Interest Rate Parity (CIP) deviations in US dollars (USD), calculated as the CIP implied USD rate minus the USD LIBOR rate. The CIP implied USD rate is estimated using the euro-dollar exchange rate and the euro LIBOR rate. The dashed line is based on daily exchange rate data and the solid line is based on hourly exchange rate data. The sample period is from January 1 2007 till March 30 2009 except for the hourly data which is available from May 23 2008.
40
Figure 3: CIP Deviations Based on Dollar LIBOR, NYFR and Treasury Bill Rates, and the Euro‐Dollar Exchange Rate, January 2007 –March 2009
0
100
200
300
400
500
600
‐50
0
50
100
150
200
250
Jan‐07 Apr‐07 Jul‐07 Oct‐07 Jan‐08 Apr‐08 Jul‐08 Oct‐08 Jan‐09
Basis Po
ints
Basis Po
ints
Date
Basis NYFR basis Treas basis
The figure plots estimates of Covered Interest Rate Parity (CIP) deviations in US dollars (USD), calculated as the CIP implied USD rate minus several benchmark USD rates. The benchmark USD rates shown are the USD LIBOR rate (left axis), the NYFR rate (left axis) and the Treasury Bill rate (right axis). The CIP implied rate USD is estimated using daily euro-dollar exchange rates and the euro LIBOR rate. The sample period is from January 1 2007 till March 30 2009 except for the NYFR data which is available from May 30 2008.
41
Figure 4: FX Basis Calculated For Different Currency Pairs, January 2007 –March 2009
‐50
0
50
100
150
200
250
Aug‐07 Nov‐07 Feb‐08 May‐08 Aug‐08 Nov‐08 Feb‐09
Basis Po
ints
Date
USD/JPY
USD/CHF
GBP/USD
NZD/USD
AUD/USD
The figure plots estimates of Covered Interest Rate Parity (CIP) deviations in US dollars (USD), calculated as the CIP implied USD rate minus the USD LIBOR rate. The CIP implied USD rate is is estimated using exchange rates and interest rates denominated in the following currencies: the Australian dollar (AUD), the Swiss franc (CHF), the British pound (GBP), the Japanese Yen (JPY) and the New Zealand dollar (NZD). The sample period is from January 1 2007 till March 30 2009 except for the USD-AUD and the USD-NZD data that are available till December 31 2008.
42
Figure 5: FX Basis, MBS‐GC Repo Spread and TED Spread
‐10
10
30
50
70
90
110
130
150
170
190
‐10
40
90
140
190
240
290
340
390
440
490
Jan‐07 Apr‐07 Jul‐07 Oct‐07 Jan‐08 Apr‐08 Jul‐08 Oct‐08 Jan‐09
Basis Po
ints
Basis Po
ints
Date
Basis TED_m3 MBS_GC_m3
The figure plots estimates of Covered Interest Rate Parity (CIP) deviations in US dollars (USD), calculated as the CIP implied USD rate minus the USD LIBOR rate. The CIP implied USD rate is estimated using the euro-dollar exchange rate and the euro LIBOR rate. Also plotted are the 3-month agency MBS minus GC repo spread and the 3-month TED spread (i.e. the LIBOR minus the Treasury bill rate). The sample period is from January 1 2007 till March 30 2009.
43
Figure 6: Spread between Average non‐US and US USD LIBOR Quotes
‐50
0
50
100
150
200
250
300
350
‐5
0
5
10
15
20
25
30
35
Jan‐07 Apr‐07 Jul‐07 Oct‐07 Jan‐08 Apr‐08 Jul‐08 Oct‐08
Basis Po
ints
Basis Po
ints
Date
Basis(RightAxis)
Quote spread(Left Axis)