cancer product selection guide
DESCRIPTION
Comprehensive Solutions from Hallmarks to Biomarkers Our understanding of cancer is rooted in identifying the phenotypic differences between cancer cells and corresponding normal cells of the same lineage. Although the recent, huge output of comparative genomic, proteomic, and epigenomic data comparing tumor and non-tumor has yet to be fully mined, the data point to eight key traits, shared by most tumor types, that drive disease progression. Recognizing both the tremendous opportunities and the challenges facing cancer research, EMD Millipore has been dedicated to developing and refining technologies for the study of cancer. With EMD Millipore’s comprehensive portfolio, including the Upstate, Chemicon, and Calbiochem brands of reagents and antibodies, researchers can count on dependable, high quality solutions for analyzing all the hallmarks of cancer.TRANSCRIPT

CancerComprehensive Solutions from Hallmarks to Biomarkers
Data SheetProduct Selection Guide
Hallmarks of
Cancer
Self-sufficiency inproliferation signals
Insensitivity to
proliferation
inhibiting signals
Evading apoptosis
Tiss
ue in
vasio
n
& met
asta
sis
Limitl
ess r
eplic
ative
pote
ntial
Sustained angiogenesis
Metabolic
reprogramming
Escape from
imm
une control
ATPSTOPTOP

As a tools provider and partner in research, EMD Millipore is committed to the advancement of life science research
and therapeutic development. This guide includes a number of new products for target identification, pathway
detection, and profiling. These products provide proven solutions for a range of applications and are backed by
extensive technical support.
Platforms and Technologies
Antibodies and ImmunoassaysEMD Millipore offers an extensive, focused portfolio of antibodies and immunoassays. With the expertise of
Upstate® and Chemicon®, EMD Millipore provides validated products with breadth and depth in major
research areas backed by excellent service and support.
Cell-Based Assays and Quantitative Cell ImagingEMD Millipore offers a significant portfolio of live cell, whole-cell, and cell-based activity assays and
reporter systems for direct and indirect detection. These technologies facilitate protein target validation,
identify cellular pathways, and determine mechanism of action for lead optimization environments. EMD
Millipore also offers an array of assays for high-content, multiparametric cell imaging, enabling identifica-
tion of cellular responses and events under user-defined conditions.
Flow Cytometry Assays and SystemsFlow cytometry is an essential tool for in-depth cell analysis, with the capacity to simultaneously measure
multiple parameters on individual cells. Guava® flow cytometers provide direct, precise measurement via
microcapillary technology that translates into smaller samples, less reagents, and minimal waste. EMD Milli-
pore also offers FlowCellect™ reagents and kits that are optimized for guava systems and compatible with
traditional core lab environments, along with application-specific analysis software modules, to provide a
complete solution for flow cytometry.
MILLIPLEX® MAP Multiplex AssaysMILLIPLEX map assays offer the broadest selection of multiplex kits and reagents in a wide variety of
therapeutic areas, measuring multiple biomarkers using a small sample size. Compared to conventional
methods, such as ELISAs and Western blots, MILLIPLEX map enables the simultaneous detection of multiple
soluble or intracellular biomarkers. Using the Luminex® xMAP® bead-based technology, EMD Millipore’s
flexible and customizable assays are exhaustively tested and qualified for sensitivity, specificity,
reproducibility and wide dynamic range.
Calbiochem® CompoundsCalbiochem provides high quality inhibitors, biochemicals, antibodies, proteins, and kits that have been cited
in thousands of peer-reviewed publications. Small-molecule compounds, including inhibitors, activators, and
other pathway modulators, are critical tools for researchers studying cell signaling and other intracellular
mechanisms that control cell fate, function and phenotype. From libraries and pathway panels to individual
reagents, the Calbiochem line of products offers the widest and most cited selection of inhibitors and
activators worldwide.
ServicesEMD Millipore advances drug discovery and evaluation by providing products and services to complement
your work and help you achieve results faster than ever before. We offer a suite of products that span the
drug discovery pipeline from target identification to clinical studies. Our expert team of scientists and
engineers understands the complexity of your discovery and development and can support you in these
challenges.

3
CoMPrEHEnSIvE SoLutIonS FroM HALLMArkS to BIoMArkErS Our understanding of cancer is rooted in identifying the
phenotypic differences between cancer cells and
corresponding normal cells of the same lineage. Although the
recent, huge output of comparative genomic, proteomic, and
epigenomic data comparing tumor and non-tumor has yet to
be fully mined, the data point to eight key traits, shared by
most tumor types, that drive disease progression. These are
listed in the table of contents (right).
These “hallmarks” of cancer, an update to the original list
of Hanahan and Weinberg1, are important—not only because
they represent opportunities for therapeutic intervention, but
also because they are opportunities to use tumors as models
to decipher the signaling pathways underlying both normal and
diseased cellular processes. As a result, oncology research not
only impacts cancer drug discovery, but also advances
understanding of all of biology, from developmental
mechanisms to aging.
Although it is tempting to view these eight hallmarks as a
linear path ending in metastatic cancer, challenges such as
tumor heterogeneity, individual polymorphisms, nonparallelism
in model systems, and inability to distinguish cell-intrinsic from
cell-extrinsic factors require an unbiased, multidisciplinary,
cross-platform approach to cancer research.
Recognizing both the tremendous opportunities and the
challenges facing cancer research, EMD Millipore has been
dedicated to developing and refining technologies for the
study of cancer. With EMD Millipore’s comprehensive portfolio,
including the Upstate, Chemicon, and Calbiochem brands of
reagents and antibodies, researchers can count on
dependable, high quality solutions for analyzing all the
hallmarks of cancer.
Reference
1. Hanahan D., Weinberg R.A. (2000) The Hallmarks of Cancer. Cell. 100:57-70.
FEAturED ProDuCtS• MILLIPLEX map EpiQuant EGFR Pathway 6
Magnetic Bead Panel
• Calbiochem InhibitorSelect 96-well Protein 6
Kinase Inhibitor Library I
• FlowCellect Bivariate Cell Cycle Kit for DNA Replication 10
• FlowCellect MitoDamage Kit 14
• Calbiochem InhibitorSelect Akt/PI 3-K/mTOR 15
Signaling Pathway Panel
• H2A.X Phosphorylation & p53 DNA Damage Assay 15
• Phospho-Histone H3 (Ser10) and Cyclin B1 18
QCI /HCA Assay
• In Vitro Vascular Permeability Assay 19
• MILLIPLEX map Human Circulating Cancer 27
Biomarker Panel 1
tABLE oF ContEntS
Self-sufficiency in proliferation signals 4
Insensitivity to proliferation inhibiting signals 9
Evading apoptosis 13
Limitless replicative potential 17
Sustained angiogenesis 19
Metabolic reprogramming 23
Escape from immune control 26
Tissue invasion and metastasis 28
ATP
STOPTOP
ATP
STOPTOP
ATP
STOPTOP
ATP
STOPTOP
ATP
STOPTOP
ATP
STOPTOP
ATP
STOPTOP
ATP
STOPTOP
PAGE
PAGE
Introducing EMD MilliporeThe acquisition of Millipore by Merck KGaA brings the
expertise and complementary capabilities of two
companies with a history of providing superior products
and solutions to the Life Science industry. As EMD
Millipore, we are intent on being your world-class Life
Science partner, driving innovation through strong
customer relationships, significant investment in R&D and
the contribution of our employees. This Cancer Product
Selection Guide is the first integrated presentation of our
comprehensive range of solutions to support cancer-
related research.

4
Anti-mtor, clone 2ID8.2 (Catalogue No. 05-1592)
mTOR affects cell proliferation and survival primarily by
phosphorylating Akt, an effector of the PI3 kinase pathway. In
addition, mTOR regulates cell growth and autophagy. The mTOR
pathway is frequently dysregulated in cancer. Validated for
Western blotting and immunocytochemistry, anti-mTOR is one
of our numerous antibodies for studying self-sustained
proliferation, including key receptors such as EGFR, ErbB2, Met,
VEGFR, and IR and downstream targets such as Ras, PI3-Kinase,
Akt, Mek, and Erk.
PI3 kinase Activity/Inhibitor ELISA (Catalogue No. 17-493)
The discovery of tumor-specific mutations in PI3 kinase (PI3K)
genes has shifted research focus on PI3K from basic
biochemistry to target validation and drug development. These
mutations single out class I PI3K as an important contributor
to oncogenesis. Most human cancers also show activated PI3K
signaling. Easily evaluate PI3K activation and inhibition with this
competitive ELISA kit. The PI3 Kinase Activity/Inhibitor Assay
enables fast and sensitive quantitation of activity of the four
class I PI3 kinases (p110 a, b, d, g).
Self-Sufficiency in Proliferation Signals
Confocal immunofluorescence analysis of NIH 3T3 cells using anti-mTOR
(05-1592) (red) shows diffuse cytoplasmic distribution. Actin filaments have
been labeled with Alexa Fluor 488-Phalloidin (green). Nuclei are stained with
DAPI (blue).
Results from the PI3K ELISA kit demonstrate inhibition via isoform-specific
and general class I inhibitors.
Normal cell proliferation is commonly regulated by cell signaling pathways that lead to reversible
modification of existing proteins and phospholipids. These modifications, which include
phosphorylation, methylation, acetylation, ubiquitination, and hydroxylation, function in
combination to control individual proteins or multi-protein pathways. While normal cells require
extracellular cues for cell division, cancer cells possess mutations, often due to genetic
instability, that render their proliferation independent of these cues. Rapid proliferation, in
turn, provides more opportunities for tumor cells to acquire mutations favoring tumor
progression.
Selectivity and Profiling AgainstPI3 Kinase Isotypes
0
20
40
60
80
100
120LY294002
Wortmannin
PI-103
TGX-221
AS-252424
% C
ontr
ol
p110α p110β p110δ p110γ
Selectivity and Profiling AgainstPI3 Kinase Isotypes
0
20
40
60
80
100
120LY294002
Wortmannin
PI-103
TGX-221
AS-252424
% C
ontr
ol
p110α p110β p110δ p110γ
Selectivity and Profiling AgainstPI3 Kinase Isotypes
0
20
40
60
80
100
120LY294002
Wortmannin
PI-103
TGX-221
AS-252424
% C
ontr
ol
p110α p110β p110δ p110γ
ATP
STOPTOP

5
ras Activation ELISA Assay (Catalogue No. 17-497)
Oncogenic mutations resulting in constitutively active Ras are
correlated with tumor development in a variety of tissues.
Therefore, quantitatively measuring stimulated Ras is
important for the study of oncogenic pathways. This kit
detects activated Ras through selective binding of immobilized
Raf-1 in the presence of GTP. Using a monoclonal anti-Ras
antibody, detection of Ras isoforms across three different
species enables simple quantitative analysis and is amenable to
high throughput environments. Individual components are also
available.
FlowCellect PI3k/MAPk Dual Pathway Activation and Cancer Marker Detection kit (Catalogue No. FCCS025100)
The two kinases PI3K and MAPK often mediate aberrant cell proliferation, and recent research suggests cross-talk among their
downstream effectors. This flow cytometry kit enables easy analysis of the role of cross-talk in proliferation by providing three
fully validated and optimized antibodies to measure specific cell signaling events along both pathways. The kit uses directly labeled
antibodies against phospho-Akt and phospho-ERK1/2 to analyze signaling activation and cross-talk, plus a Ki-67 marker to identify
the proliferative fraction.
Elevated levels of activated Ras are easily detected in HeLa cells
stimulated with EGF versus unstimulated cells.
HEK293 cells were stimulated by insulin (B, E) or PMA (C, F) and simultaneously stained with antibodies against phospho-Akt and phospho-ERK1/2. The cross-talk
between the PI3K and MAPK signaling pathways is demonstrated by the sharp decrease in ERK phosphorylation after five minutes of insulin stimulation.
1 x 10⁶
0
2 x 10⁶
3 x 10⁶
4 x 10⁶
5 x 10⁶
6 x 10⁶
7 x 10⁶
1040.97% 0.47%
0.30%
103
102
101
100
100 101 102 103 104
pAKT-Alexa 488
pER
K-P
E
98.26%
1040.78% 61.94%
30.37%
103
102
101
100
100 101 102 103 104
pAKT-Alexa 488
pER
K-P
E
6.91%
104 100%90%80%70%60%50%40%30%20%10%
0%pAkt pErk
Untreated100 nM Insulin 3 min100 µg/mL PMA 3 min
Ki67
30.30% 60.06%
1.28%
103
102
101
100
100 101 102 103 104
pAKT-Alexa 488
pER
K-P
E
8.35%
104 1.04% 0.31%
0.18%
103
102
101
100
100 101 102 103 104
pAKT-Alexa 488
A. Untreated B. Insulin Treated C. PMA Treated
D. Untreated E. Insulin Treated F. PMA Treated
HEK293
HEK293
3-M
inut
e Sti
mul
atio
n5
-Min
ute
Sti
mul
atio
n
pER
K-P
E
98.47%
104 0.72% 15.46%
75.15%
103
102
101
100
100 101 102 103 104
pAKT-Alexa 488
pER
K-P
E
8.67%
104 34.29% 49.52%
3.46%
103
102
101
100
100 101 102 103 104
pAKT-Alexa 488
pER
K-P
E
12.73%
100%90%80%70%60%50%40%30%20%10%
0%pAkt pErk Ki67

6
InhibitorSelect 96-Well Protein Kinase Inhibitor
Libraries I & II (160 inhibitors; Cat. Nos.
539744* and 539745*) were screened for
influence on proliferation and survival of mouse
neural stem cells (mNS) in a cell viability assay
under 4 conditions:
(A) No GFs – No Growth Factors (to identify
survival/proliferation factors)
(B) Sub EGF – Sub-optimal EGF (to identify
inhibitors/potentiators)
20 pg/mL EGF
(C) Sub FGF2 – Sub-optimal FGF2 (to identify
inhibitors/potentiators)
500 pg/mL FGF2
(D) Max GFs – Maximal EGF + FGF2 (to identify
inhibitors/potentiators)
20 ng/mL EGF + 20 ng/mL FGF2
The presence of inhibitor K-252a, Nocardiopsis
sp. (Cat. No. 420297) alone in the culture
medium resulted in a 10-fold mNS cell viability.
Data courtesy of Donna McLaren, Stem Cell Sciences, Cambridge, UK
Phosphorylated EGFR pathway proteins, as well as total EGFR, were
simultaneously detected in A431 cells treated with 1000, 333, 111, 37,12.3
and 0 ng/mL EGF. Lysates were collected after 5 minutes EGF stimulation.
Values are internally normalized utilizing the TAFII68 loading control.
MILLIPLEX map EpiQuant EGFr Pathway Magnetic Bead Panel (Catalogue No. MPEQMAG-110K)
Epidermal growth factor receptors (EGFR) play crucial roles
in regulating cell proliferation, differentiation, motility, and
apoptosis, contributing to cancer and other pathological
processes. EpiQuant technology enables absolute
quantitation of the phosphorylation status of EGFR family
members and related signal transduction proteins, providing
a thorough understanding of this signaling pathway. By
detecting multiple analytes simultaneously, this assay
conserves sample and increases accuracy. The magnetic
bead format of the assay provides additional convenience,
with walk-away washing options, and increased consistency,
with lower coefficients of variation.
Calbiochem InhibitorSelect 96-Well Protein kinase Inhibitor Library I (EMD Chemicals Catalogue No. 539744*)
This panel of compounds consists of 80, well-characterized protein kinase inhibitors, the majority of which are cell-
permeable and ATP-competitive. The library is useful for cancer signaling pathway analysis, cell-based assays, target
identification in drug discovery, screening new protein kinases, and other related applications. It is supplied with a CD
containing comprehensive documentation for each inhibitor.
[EGF] (ng/ mL)
[Ana
lyte
] (p
M)
EpiQuant EGFR Panel: EGF Dose Response
EGFR (pY1110/1125)
ERK1/2 (pY204/187)
1
10
100
1,000
10,000
1 10 100 1,000 10,000
EGFR (pY1069/1092)
Shc (pY349/350)
ErbB3 (pY1197/1307)
0
2
4
6
8
10
12No GFs
Sub EGF
Sub FGF2
Max GFs
Mouse Neural Stem Cell Viability
SU
6656
GSK-3
Inhi
bito
r XI
II
Isog
ranu
lati
mid
e
IC261
IKK-2
Inhi
bito
r IV
Indi
rubi
n D
eriv
ativ
e E8
04
JNK In
hibi
tor
II
JNK In
hibi
tor,
Neg
ativ
e C
ontr
ol
JNK In
hibi
tor
V
JNK In
hibi
tor
IX
MK2a
Inhi
bito
r
JNK In
hibi
tor
VIII
K-2
52a,
Noc
ardi
opsi
s sp
.
Ken
paul
lone
KN
-93
MEK
Inhi
bito
r I
MEK
Inhi
bito
r II
MEK
1/2
Inhi
bito
r
MN
K1
Inhi
bito
r
NK-k
B A
ctiv
atio
n In
hibi
tor
Fold
cha
nge
rela
tive
to
DM
SO
Con
trol
Gro
wth
Fac
tor
Bac
kgro
und

7
Lead Discovery Profiling Services
GPCrProfiler ServiceGPCRProfiler is the first complete cell-based functional
platform that uses a common validated readout for over
155 GPCRs. The foundation of GPCRProfiler is EMD
Millipore’s ChemiScreen GPCR stable cell lines that are used
for real-time calcium flux assays to rapidly, reliably and
reproducibly screen and profile compounds. Using one
platform allows ligands to be screened with identical buffer
conditions and incubation times for the entire spectrum of
GPCRs for easy analysis and comparison.
Quickly implement screening in a new disease area or
target receptor, or increase your current screening
capacity with GPCRProfiler services. Our unbiased profiling
screens can determine if drugs are full or partial agonists
or antagonists. We also perform dose-response assays to
determine EC50 values for agonists and IC
50 values for
antagonists. You will typically receive results within 1-3
weeks of compound submission, in a thorough and intuitive
report. GPCRProfiler gives you the flexibility to choose from
1 to ≥155 different receptors to screen. Or, choose
between 15 different service panels, including more than
60 distinct ligand families, 2 safety panels and 11 disease-
focused panels.
kinase & Phosphatase Profiling ServicesIn 2000, the KinaseProfiler service developed by Upstate,
now a part of EMD Millipore, brought selectivity profiling to
kinase drug discovery researchers. Today, the
KinaseProfiler panel includes almost 300 protein and lipid
kinases, 21 phosphatases and a complementary suite of
secondary assays, forming the most diverse, disease-
relevant panel available commercially. As the partner of
choice for kinase screening, we provide validated data using
the robust and reliable radiometric kinase assay trusted by
the world’s leading pharmaceutical companies.
SignalProfiler ServicesProviding fresh insights to the cellular activity of
compounds, SignalProfiler service employs MILLIPLEX
MAPmate cell signaling kits to profile samples against a
panel of 90+ modified and total proteins. SignalProfiler can
be used to measure the effectiveness of kinase inhibitors
and GPCR ligands by measuring changes in signaling
cascades in relevant cell backgrounds. In addition, early
signaling events leading to cellular toxicity can be studied
to help assess potential compound liabilities in early stages
of drug development.
tECHnoLoGY HIGHLIGHt
Mutations of many receptor tyrosine kinases, G protein-coupled receptors, and intracellular kinases are responsible for
uncoupling the requirement for external proliferation cues in cancer cells. Many small molecule GPCR and kinase inhibitors
have been successfully been developed as anti-tumorigenic drugs. EMD Millipore’s Lead Discovery Services are well suited to
extensive profiling of these drugs against a broad range of targets to reveal interactions that may have additional
therapeutic value or present adverse reactions.
Visual display using EMD Millipore’s DART™ (Data Analysis and
Reporting Tool) of the inhibitory activity of the anti-cancer agent
imatinib (Gleevec®, Novartis) which was functionally profiled against
a large portion of the kinome using KinaseProfiler service.

8
kEY ProDuCtS - ProLIFErAtIon SIGnALInG
Antibodies and Proteins
Description Catalogue No.
Anti-EGFR, neutralizing, clone LA1 05-101
Anti-phospho-erbB-2/HER-2 (Tyr1248) 06-229
Anti-Ras, (K-, H-, N-), clone 9A11.2 05-1072
Anti-Ras-related protein Ral-A 07-2132
EGFR, active, purified kinase 14-531
Assays
Erk 1/2 (Thr202/Tyr204)/Thr185/Tyr187) 17-442
Dual Detect CELISA
PIP3 Quantification TR-FRET Assay 17-494
c-ErbB2/c-Neu Rapid Format ELISA Kit QIA10*
Description Catalogue No.
Raf-1 Kinase Assay Kit, 17-360
Chemiluminescence Detection
MILLIPLEX map EpiQuant EGFR Pathway MPEQMG-110K-PX22
Magnetic Bead 22-Plex Premix
MILLIPLEX map MAPK/SAPK Cell Signaling 10-Plex 48-660
FlowCellect MAPK Activation Dual Detection kit FCCS025106
FlowCellect PI3K Activation Dual Detection Kit FCCS025105
FlowCellect EGFR/MAPK Pathway Activation FCCS025101
Detection Kit
K-LISA™ mTOR (Recombinant) Activity Kit CBA104*
PI3-Kinase HTRF Screening Assay 33-016
Phospho-ERK1/2 (Thr185/Tyr187) QCI / HCA Assay Kit HCS230
Compound Libraries
InhibitorSelect 96-Well Protein Kinase Inhibitor Library II 539745*
InhibitorSelect 96-Well Protein Kinase Inhibitor Library III 539746*
InhibitorSelect 384-Well Protein Kinase Inhibitor Library I 539743*
StemSelect® Small Molecule Regulators 384-Well Library I 569744*
*Available from EMD Chemicals Inc.
For a complete listing of cancer-related products from Millipore, please visit www.millipore.com/cancer.
For a complete listing of cancer-related products from EMD Chemicals, please visit www.emdbiosciences.com.

9
Anti-Cyclin B1, clone GnS3 (8A5D12) (Catalogue No. 05-373)
Cyclin B1 triggers mitosis by binding and activating cdc2
kinase, which phosphorylates multiple protein targets.
Validated for immunoprecipitation and Western blotting, this
monoclonal antibody complements EMD Millipore’s huge
portfolio of transcription factor antibodies, including other
important cell cycle regulators, including Rb, Wee1, and CDCs.
EMD Millipore also offers numerous Antibody Minipacks
supporting various cell cycle stages and DNA repair pathways
that enable you to explore more for less.
Akt (Ser473) Dual Detect CELISA Assay kit (Fluorogenic Detection) (Catalogue No. 17-444)
The Ser/Thr kinase Akt (PKB), when phosphorylated on Ser473
by the mTOR complex, becomes active and phosphorylates
targets in multiple pathways including cell survival, cell cycle
control, cell growth, and cell metabolism. Akt pathways are
frequently dysregulated in cancer. The Dual Detect CELISA is
an efficient and sensitive assay for simultaneous quantification
of phosphorylated Akt (Ser473) and total Akt in whole cells.
Non-stimulated A431 cell lysate
was resolved by electrophoresis,
transferred to nitrocellulose
and probed with anti-Cyclin B1
(05-373, 0.5 µg/mL). Proteins
were visualized using a goat
anti-mouse secondary antibody
conjugated to HRP and a
chemiluminescence detection
system. Arrow indicates Cyclin
B1 (~58 kDa).
NIH3T3 cells were seeded at 1x10⁴ cells per well, cultured for 24 hr, serum
starved 16 hr, and stimulated with 50 ng/mL of PDGF for 0, 1, 5, 15, or 30
minutes. Total and phospho Akt levels were determined using Akt (Ser473)
Dual Detect CELISA Kit (17-444). Phosphorylated Akt levels are normalized
to the total Akt. Inset shows the corresponding Western blot.
97
66
45
00
0 1 5 15 30 minTotal-AKTPhospho-AKT (s473)
1 5 15 30
0.5
1.0
1.5
2.0
2.5
3.0
3.5
Rel
ativ
e Pho
spho
-Akt
(Ser
47
3)
(Nor
mal
ized
by
Tota
l Akt
)
Time (minutes)
NIH3T3 cells treated with 50 ng/mL PDGF
Insensitivity to Proliferation Inhibiting SignalsTo maintain normal cellular homeostasis, proliferation inhibiting signals, including soluble
inhibitors and inhibitors residing on the surface of nearby cells, must be received and
transmitted through intracellular pathways. Adaptation through mutation may render tumor
cells resistant to these proliferation inhibiting signals, enabling them to overcome cell cycle
checkpoints. These aberrant signal transduction networks can either induce or support tumor
cell development and proliferation in an organism. Cell cycle signaling through retinoblastoma
(Rb) and TGFb are two widely studied pathways upon which proliferation inducing signals
converge.
ATP
STOPTOP

10
Human A549 lung cancer cells
stained for BrdU (green) and
Ki-67 (red) using the BrdU and
Ki-67 QCI/HCA kit. Nuclei are
stained with Hoechst dye (blue).
FlowCellect Bivariate Cell Cycle kit for DnA replication (Catalogue No. FCCH025102)
Flow cytometry is an accurate, high-throughput, high content
method for studying proliferating cells undergoing DNA
replication in the S-phase of the cell cycle. The kit includes a
directly conjugated Anti-BrdU Alexa Fluor 488 conjugate plus a
DNA dye (propidium iodide) which enables the researcher to
perform bivariate analysis of proliferating cells without the
need of software modules for data interpretation.
Brdu and ki-67 QCI / HCA Assay kit (Catalogue No. HCS213)
Incorporation of BrdU into cellular DNA correlates with cell
proliferation rate and the number of cells in S phase. Ki-67
antigen is a proliferation marker preferentially expressed
during late G1, S, G2 and M phases. The BrdU and Ki-67
Quantitative Cell Imaging (QCI) kit offers an easy assay for cell
division in the presence of proliferation inhibiting factors,
either by automated microscopy or traditional (manual)
analysis. Couple this assay with other QCI kits to capture a
comprehensive picture of cell cycle progression and arrest.
MILLIPLEX map Human Src Family kinase (SFk) Multiplex Assay (Catalogue No. 48-650)
SFKs play crucial roles in embryonic development and cell
proliferation, regulating such functions as adhesion,
differentiation, and survival. These proteins are often involved
in the progression and oncogenesis of non-small cell lung
cancer (NSCLC), squamous cell head and neck and pancreatic
cancers. EMD Millipore’s MILLIPLEX map Src Family Kinase 8-Plex
is the only multiplex cell signaling kit available able to assess
and distinguish the phosphorylation status of each SFK.
Detection of DNA
replication by
analysis of S phase
cells. Bivariate flow
cytometric analysis
using BrdU Alexa Fluor
488 conjugate can
distinguish S phase cells
with great accuracy,
not only based on
their difference in DNA
content from G1 or
G2/M cells but also as
having incorporated
BrdU.
Phospho-SFK detection in cell lysates. Tumor cells (Ramos, HL-60, HeLa,
and DLD-1) were treated with pervanadate (5 minutes) to enrich for
phosphorylated proteins. Cell lysates prepared from untreated and
pervanadate-treated cells were incubated with a mixture of all eight
antibody-coated beads. Tyrosine phosphorylation of SFKs was detected
with antiphosphotyrosine antibody. Multiplex analysis (A) showed Blk, Fgr,
and Fyn phosphorylation in Ramos cells; Lck, Lyn, and Hck phosphorylation
in HL-60 cells; and Yes and Src phosphorylation in HeLa and DLD-1 cells,
respectively. The confirmatory immunoprecipitation/Western blots are
shown in (B).
Med
ian
Fluo
resc
ence
Inte
nsit
y
4,500
4,000
3,500
3,000
2,500
2,000
1,500
1,000
500
0Blk Fgr Fyn Lck Lyn Hck Yes Src
Pervanadate-treated cellsNon-stimulated cells
A.
B.
BlkIP Antibody
Pervanadate
Fgr Lck Lyn
Ramos HL-60
+- +- +- +-
IP: Specific Capture Ab Blot: Phosphotyrosine Ab
Ramos HL-60 HeLaDLD-1
FynIP Antibody
Pervanadate
Hck Yes Src
+- +- +- +-
BlkIP Antibody
Pervanadate
Fgr Lck Lyn
Ramos HL-60
+- +- +- +-
IP: Specific Capture Ab Blot: Phosphotyrosine Ab
Ramos HL-60 HeLaDLD-1
FynIP Antibody
Pervanadate
Hck Yes Src
+- +- +- +-BlkIP Antibody
Pervanadate
Fgr Lck Lyn
Ramos HL-60
+- +- +- +-
IP: Specific Capture Ab Blot: Phosphotyrosine Ab
Ramos HL-60 HeLaDLD-1
FynIP Antibody
Pervanadate
Hck Yes Src
+- +- +- +-

11
Calbiochem InhibitorSelect Protein Kinase Inhibitor Libraries
Inhibitor Characteristics• Cell-permeable†
• Potent and selective†
• ATP-competitive†
• Reversible†
• Stable in DMSO
• Structurally diverse
• Some target multiple kinases
• Known pharmacological activity
• Less toxic
Highest Quality Control• Purity by HPLC (≥95% )†
• Lot-specific data for every inhibitor in solution
• DMSO-resistant polypropylene deep-well microplates
CD-roM with comprehensive data set included in each library• Inhibitor description
• Published IC50
/Ki values
• Literature citations
• SD files
• CAS numbers
• PubChem compound ID
• Molecular weight
• Molecular structure
†Pertains to the majority of inhibitors.
tECHnoLoGY HIGHLIGHt
Interrogate multiple proliferation and survival signaling pathways simultaneously and efficiently by using InhibiorSelect
Protein Kinase Inhibitor Libraries. Targets (see comprehensive table below) include kinases important for cancer research,
such as Aurora, Bcr-Abl, Ras, Rho, and Wee1.
Target Kinases
96-well Library I
96-well Library II
96-well Library III
384-well Library I
Adenosine Kinase
X
Akt X X X
AMPK X X
ATM X X
ATR X X
Aurora X X X X
Bcr-Abl X X
CaMK X X X
Cdks X X X
cFMS X X
Chk1,2 X X X
CK1,2 X X X
c-Met X X
DAG X X X
DNA-PK X X X
eEF2EGFR X X X
ERK X X
Flt3 X X X
GSK-3 X X
IGFR X X X
IKK X X X
IP3K X
IRAK X X
JAK X X
JNK X X
Lck X X
MAPK X X X
MEK X X X
MLCK X
MNK1 X X
p70 S6 X X
P90 S6 X
PAK X
PDGFR X X
PDK1 X X
PI 3-K X X X
PIKFyve X
PIM X
PKA X
PKC X X X
PKG X
PKR X X
PLK X
Rho X X X
RIP X
SK X X
Src X X X
Syk X X
TGF-bR X X
Tpl2 X
VEGFR X X
Wee1 X

12
kEY ProDuCtS - ProLIFErAtIon CHECkPoInt
Antibodies and Proteins
Description Catalogue No.
Cell Cycle-G2/M Phase Pathway Explorer 15-120
Antibody Minipack
Anti-Wee1 06-972
Anti-Cdk5, clone DC17 05-364
Akt Magnetic Bead conjugate 16-318
Anti-Cdc42-interacting protein 4 ABS69
TGFBR-1, active 14-912
Assays
Description Catalogue No.
MILLIPLEX map Multi-species TGFb 3-Plex TGFB-64K-03
MILLIPLEX map Human Multi-Pathway Signaling Kit 48-680
FlowCellect Bivariate Cell Cycle Kit for G2/M Analysis FCCH025103
guava Cell Cycle Reagent Propidium Iodide Solution 4500-0220
Cyclin B1 and Ki-67 QCI / HCA Assay Kit HCS210
Phospho-Histone H3 (Ser-10) and Ki-67 HCS209
QCI / HCA Assay Kit
p53 and p21 QCI / HCA Assay Kit HCS235
Inhibitors
Chk2 Inhibitor II 220486*
SB 218078 559402*
Staurosporine 569397*
Cdk1 Inhibitor IV, RO-3306 217699*
*Available from EMD Chemicals Inc.
For a complete listing of cancer-related products from Millipore, please visit www.millipore.com/cancer.
For a complete listing of cancer-related products from EMD Chemicals, please visit www.emdbiosciences.com.

13
Anti-Fas (human, activating), clone CH11 (Catalogue No. 05-201)
Fas is a transmembrane receptor that activates cell death by
binding extracellular Fas ligand. Activated Fas then recruits
caspase pathway proteins to its cytoplasmic domain. This
monoclonal antibody is ideal for measuring apoptosis and
resistance to pro-apoptotic signaling by flow cytometry,
immunocytochemistry, or Western blotting. In addition, when
this antibody binds to Fas, it activates cell death in multiple cell
types. For a complete analysis, use our antibodies to
cytoplasmic and mitochondrial death signaling proteins to
measure response to pro-apoptotic (Bax, Bak, Bid, Bim) and
anti-apoptotic (Bcl-2, Bcl-xl, Bcl-W) signals.
Etoposide-, UV-, and Fas-
mediated apoptosis in Jurkat
cells. Apoptotic response,
as measured by annexin V
binding (top) and caspase
activity (bottom), was the
fastest upon stimulation
with anti-Fas antibody
(05-201). This research
was originally published in
the Journal of Biological
Chemistry. Widmann, C et
al. 1998; JBC 273(12):7141-
7147. © the American
Society for Biochemistry and
Molecular Biology.
0
0 5 10 15
25
50
75
Etoposide
UV
Fas
% A
nnex
in
posi
tive
cel
lsD
EVD
dir
ecte
d ca
spas
eac
tivi
ty (ar
bitr
ary
unit
s)
Time (hr)
0
500
1000
1500
Evading ApoptosisThe ability to elude programmed cell death (apoptosis) is a hallmark of most types of
cancer. A variety of proteins, including cell surface receptors, adaptors, proteases and
mitochondrial components, regulate a fine balance between cell survival and death by
apoptosis. Mutations of these proteins may tip the balance, resulting in the uncontrolled survival
and proliferation of cancer cells. In many cancers, aberrant regulation results in overexpression of
survivin, a potent anti-apoptotic protein. Recent studies also show that autophagy, the lysosomal
breakdown of a cell’s own components, exhibits cross-talk with apoptotic pathways, and autophagy-
deficient cells may be prone to tumorigenesis. Understanding apoptotic and autophagy signaling and
mechanisms can help exploit these pathways for therapeutic benefit.
Apoptag® ISoL Dual Fluorescence Apoptosis Detection kit (Catalogue No. APT1000)
During apoptosis, one class of DNases, which includes DNase I,
is activated via caspase signaling, while the other class, which
includes DNase II, is activated via a caspase-independent
pathway. The ApopTag ISOL Apoptosis Kit facilitates the
differentiation of apoptotic cells from necrotic or transiently
damaged cells by using a proprietary dual fluorescent-labeled
oligonucleotide to detect simultaneously both DNase I and
DNase II-type DNA fragments in a single sample, thus
distinguishing caspase-dependent and caspase–independent
apoptotic events. While conventional in situ detection
techniques such as ISEL (Klenow DNA polymerase), TUNEL
(terminal deoxynucleotidyl transferase, TdT) and ISNT (DNA
Polymerase I) are useful in detecting internucleosomal DNA
cleavage, they do not differentiate DNase Type I and DNase
Type II cleavage. The ISOL technique shows concordant results
with the TUNEL technique in specimens without necrosis, and
in specimens presenting necrosis, the ISOL technique shows
improved selectivity as compared to TUNEL.
Detection of caspase-
dependent (red) and
caspase-independent
(green) DNase activity in
paraffin-embedded rat
mammary gland tissue
sections using ApopTag
ISOL Dual Fluorescence
Apoptosis Detection Kit
(APT1000).
ATP
STOPTOP

14
Jurkat cells were uninduced (A), induced to apoptosis with staurosporine (B) or with CCCP (C), then stained using
the MitoDamage kit. Flow cytometry showed that staurosporine induced apoptosis in Jurkat cells, and that CCCP
depolarized the mitochondrial membrane, but neither condition was sufficient for cell membrane permeabilization and
death.
FlowCellect MitoDamage kit (Catalogue No.
FCCH100106)
Multiparametric, flow
cytometric evaluation of
apoptosis markers enables
detailed kinetic and temporal
analysis of the events that
lead to apoptosis, both in
individual cells and cell
populations. This kit enables
the simultaneous
measurement of 3 important
cell health parameters;
change in mitochondrial
potential (an early hallmark
of apoptosis and cellular
stress), phospatidylserine
expression on the cell
surface of apoptotic cells as
assessed by Annexin V
binding and plasma
membrane permeabilization
(indicating cell death).
MILLIPLEX map Human Apoptosis and MAPmates™ (Catalogue Nos. 48-670, 46-694, 46-692)
Apoptosis depends on coordinated regulation by multiple, interconnected pathways, therefore, it requires understanding the
roles of pathway proteins in both normal apoptosis and dysregulated cancer cells, which necessitates the quantitation of
multiple biomarkers in each sample. A portolio of MILLIPLEX map MAPmates enables the accurate, Luminex technology-based
detection of expression of key apoptosis proteins.
Single-plex Detection of Analytes Using Apoptosis MAPmates. Three different apoptosis biomarkers (active Caspase 3, phospho-histone H2A.X, and cleaved
PARP) were detected from Jurkat cells untreated or treated with 25 mM anisomycin for 4 hours using individual MAPmates. The anti-apoptotic marker phospho-
Bad was detected in A431 cells untreated or treated with 100 ng/mL EGF for 5 minutes. Insets show Western blots of active caspase 3, cleaved PARP, phospho-
H2A.X, and phospho Bad (both capture and detection antibodies). MFI represents Mean Fluorescence Intensity.
7-A
AD
Annexin V, CF488A
Red
2 F
luor
esce
nce
(RD
2-H
Log)
Green Fluorescence (GRN-HLog)
0.16%
95.2% 3.2%100 101 102 103 104
100
101
102
103
104
1.4%
Red
2 F
luor
esce
nce
(RD
2-H
Log)
Red Fluorescence (RED-HLog)
0.06%
70.5% 28.2%100 101 102 103 104
100
101
102
103
104
1.2%
Red
2 F
luor
esce
nce
(RD
2-H
Log)
Red Fluorescence (RED-HLog)
0.10%
93.9% 4.8%100 101 102 103 104
100
101
102
103
104
1.2%
Mit
oSen
se R
ed
Annexin V, CF488A
Red
2 F
luor
esec
ence
(R
D2-H
Log)
Green Fluorescence (GRN-HLog)
94.4%
0.75% 3.7%
Uninduced
100 101 102 103 104100
101
102
103
104
1.1%
Red
2 F
luor
esec
ence
(R
D2-H
Log)
Green Fluorescence (GRN-HLog)
54.7%
14.6% 27.0%
2 µM Staurosporine
100 101 102 103 104100
101
102
103
104
3.7%
Red
2 F
luor
esec
ence
(R
D2-H
Log)
Green Fluorescence (GRN-HLog)
0.20%
93.2% 6.6%
50 µM CCCP
100 101 102 103 104100
101
102
103
104
0.04%
Mit
oSen
se R
ed
Red
2 F
luor
esce
nce
(RD
2-H
Log)
Red Fluorescence (RED-HLog)
95.2%
3.2% 1.3%100 101 102 103 104
100
101
102
103
104
0.3%
Red
2 F
luor
esce
nce
(RD
2-H
Log)
Red Fluorescence (RED-HLog)
0.26%
98.4% 1.3%100 101 102 103 104
100
101
102
103
104
0.02%
7-AAD
100 101 102 103 104
101
102
103
104
Depolarized Cells
Dead Cells
Live Cells58.1% 0.08%
41.0% 0.8%
Red
2 F
luor
esce
nce
(RD
2-H
Log)
Red Fluoresecence (RED-HLog)
100
A B C
A. Active Caspase 3 B. Phospho-H2A.X C. Cleaved PArP D. Phospho-Bad

15
Cytokines
CytokineReceptor
GrowthFactors
RTKsIGF-1
IGF-1R
CaspaseCascade
GlycogenSynthesis
Translation
ProteinSynthesis
p53 DegradationNucleus
PDK1/Akt/Flt Dual Pathway Inhibitor
PDK1/Akt/Flt Dual Pathway Inhibitor,Akt Inhibitor IV, Akt Inhibitor VIII
PI-103,PI 3-Kα Inhibitor VIII
PI-103,Rapamycin
Ro-31-8220
LY 294002, PI-103,PI 3-Kγ Inhibitor,PI 3-Kγ Inhibitor II,PI 3-Kα Inhibitor IV,PI 3-Kα Inhibitor VIII,Wortmannin
ERKPathway
BCRAg
Caspase9P
PKCα
JAK1 JAK1
SYK
PDK1
AKT1mTOR
p70S6K
DNA-PK
GSK-3
Raf1
GAB1
4EBP1
eIF4E
HSP90
CDC37
BCAP
PI 3-K
PP2AMDM2
MDM2
p53
P
P
P
P
P
Calbiochem InhibitorSelect Akt/PI 3-k/mtor Signaling Pathway Inhibitor Panel (EMD Chemicals Catalogue No. 124031*)
Activation of the Akt pathway can mediate evasion of
apoptosis by tumor cells, because Akt can both inactivate
pro-apoptotic factors as well as activate transcription of
survival genes. The InhibitorSelect Akt/PI 3-K/mTOR Pathway
Panel consists of 12 highly potent and selective kinase
inhibitors and a negative control for studying the Akt
pathway in one convenient package to help elucidate
specific steps in apoptosis while staying within budget.
kEY ProDuCtS - APoPtoSIS
Antibodies and Proteins
Description Catalogue No.
Anti-Cytochrome C, clone 7H8.2C12 MAB1800
Anti-Bax, N-terminus 06-499
Anti-Bcl2, clone 100 05-729
Caspase-3, Human, Recombinant, E. coli 235417*
Assays
ApopNexin® Annexin V FITC Apoptosis Kit APT750
TUNEL Apoptosis Detection Kit 17-141
MILLIPLEX MAP Human Apoptosis – 3-Plex 48-670
FlowCellect MitoLive Kit FCCH100107
FlowCellect MitoStress Kit FCCH100109
FlowCellect Cytochrome c Kit FCCH100110
Cytochrome C QCI / HCA Assay Kit HCS236
related Inhibitor Panels
InhibitorSelect EGFR Signaling Pathway Panel 324839*
InhibitorSelect MAPK Signaling Pathway Panel 444189*
InhibitorSelect NF-kB Signaling Pathway Panel 481487*
InhibitorSelect JAK/STAT Signaling Pathway Panel 420138*
InhibitorSelect WNT Signaling Pathway Panel 681666*
Phospho-Histone H2A.X (Ser 139) and p53 QCI / kit Assay kit (Catalogue No. HCS225)
DNA damage and repair are often early indicators of
apoptosis. Phosphorylation of H2A.X is important in the
rapid formation of a stable repair complex at the site of
damage. The tumor-suppressor, p53, is involved in a complex
network, including both DNA damage and apoptosis
pathways. Together these two markers can provide insight
to the mechanism of action for how cells evade apoptosis.
Detection of DNA damage in A549 cells. A549 cells were treated for 24
hours with etoposide (left panel) or 0.4% DMSO (right). Cell handling, fixation,
and immunostaining were performed as according to HCS225 assay
protocols. Hoechst HCS nuclear stain (blue), phospho-histone H2A.X (green),
and p53 (red) fluorescence.
*Available from EMD Chemicals Inc.
For a complete listing of cancer-related products from Millipore, please visit www.millipore.com/cancer.
For a complete listing of cancer-related products from EMD Chemicals, please visit www.emdbiosciences.com.
Annotated in brown are inhibitors included in the Calbiochem InhibitorSelect
Akt/PI3K/mTOR Signaling Pathway Inhibitor Panel (124031*).
16
Family of TUNEL Assay Products for Apoptosis Detection
tECHnoLoGY HIGHLIGHt
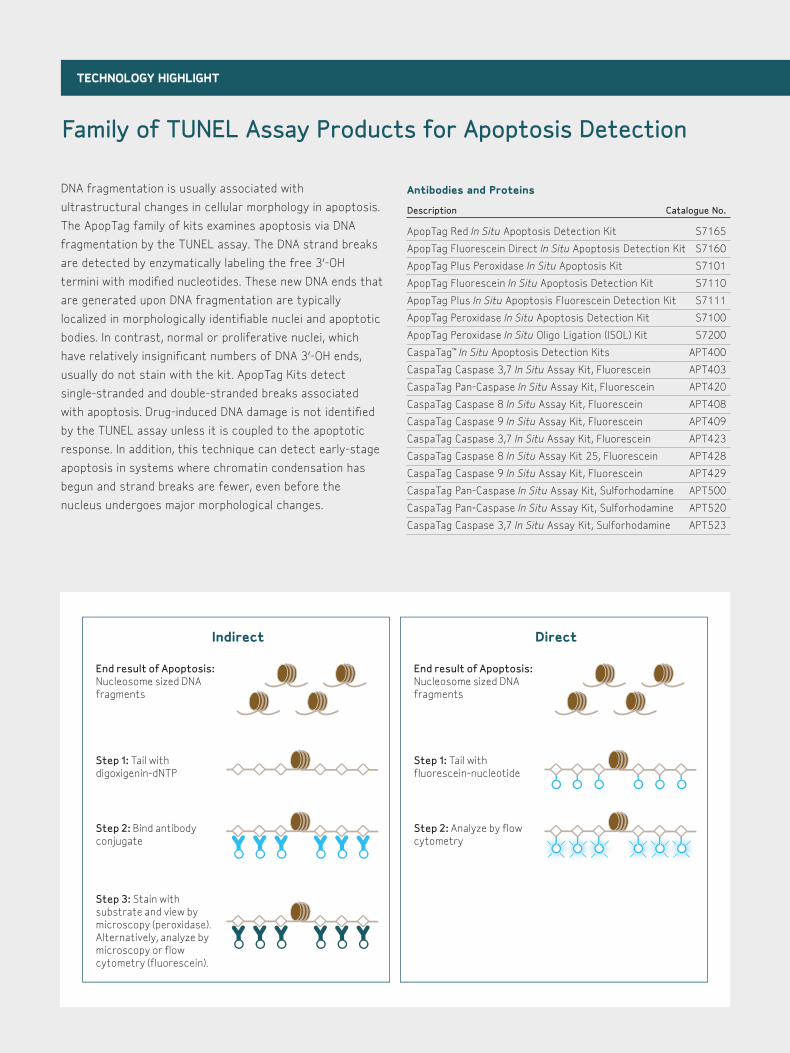
DNA fragmentation is usually associated with
ultrastructural changes in cellular morphology in apoptosis.
The ApopTag family of kits examines apoptosis via DNA
fragmentation by the TUNEL assay. The DNA strand breaks
are detected by enzymatically labeling the free 3’-OH
termini with modified nucleotides. These new DNA ends that
are generated upon DNA fragmentation are typically
localized in morphologically identifiable nuclei and apoptotic
bodies. In contrast, normal or proliferative nuclei, which
have relatively insignificant numbers of DNA 3’-OH ends,
usually do not stain with the kit. ApopTag Kits detect
single-stranded and double-stranded breaks associated
with apoptosis. Drug-induced DNA damage is not identified
by the TUNEL assay unless it is coupled to the apoptotic
response. In addition, this technique can detect early-stage
apoptosis in systems where chromatin condensation has
begun and strand breaks are fewer, even before the
nucleus undergoes major morphological changes.
Indirect
End result of Apoptosis:Nucleosome sized DNA fragments
Step 1: Tail with digoxigenin-dNTP
Step 2: Bind antibody conjugate
Step 3: Stain withsubstrate and view bymicroscopy (peroxidase). Alternatively, analyze by microscopy or flow cytometry (fluorescein).
Direct
End result of Apoptosis:Nucleosome sized DNA fragments
Step 1: Tail with fluorescein-nucleotide
Step 2: Analyze by flow cytometry
Antibodies and Proteins
Description Catalogue No.
ApopTag Red In Situ Apoptosis Detection Kit S7165
ApopTag Fluorescein Direct In Situ Apoptosis Detection Kit S7160
ApopTag Plus Peroxidase In Situ Apoptosis Kit S7101
ApopTag Fluorescein In Situ Apoptosis Detection Kit S7110
ApopTag Plus In Situ Apoptosis Fluorescein Detection Kit S7111
ApopTag Peroxidase In Situ Apoptosis Detection Kit S7100
ApopTag Peroxidase In Situ Oligo Ligation (ISOL) Kit S7200
CaspaTag™ In Situ Apoptosis Detection Kits APT400
CaspaTag Caspase 3,7 In Situ Assay Kit, Fluorescein APT403
CaspaTag Pan-Caspase In Situ Assay Kit, Fluorescein APT420
CaspaTag Caspase 8 In Situ Assay Kit, Fluorescein APT408
CaspaTag Caspase 9 In Situ Assay Kit, Fluorescein APT409
CaspaTag Caspase 3,7 In Situ Assay Kit, Fluorescein APT423
CaspaTag Caspase 8 In Situ Assay Kit 25, Fluorescein APT428
CaspaTag Caspase 9 In Situ Assay Kit, Fluorescein APT429
CaspaTag Pan-Caspase In Situ Assay Kit, Sulforhodamine APT500
CaspaTag Pan-Caspase In Situ Assay Kit, Sulforhodamine APT520
CaspaTag Caspase 3,7 In Situ Assay Kit, Sulforhodamine APT523
17
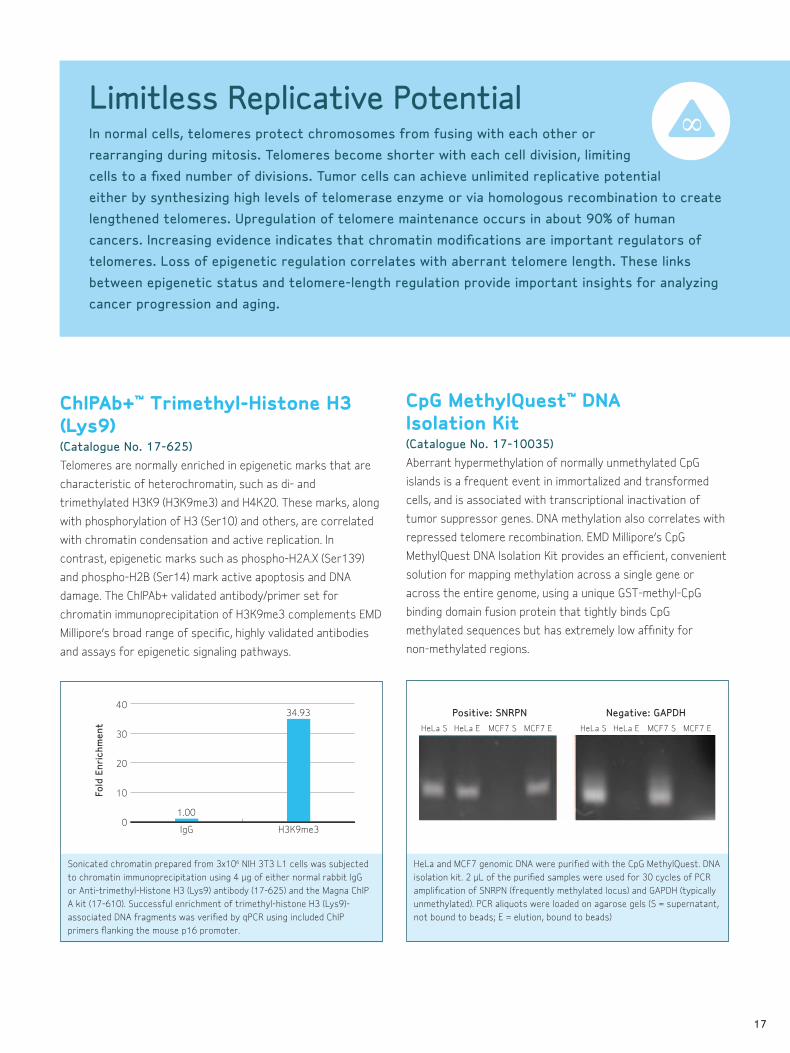
ChIPAb+™ trimethyl-Histone H3 (Lys9) (Catalogue No. 17-625)
Telomeres are normally enriched in epigenetic marks that are
characteristic of heterochromatin, such as di- and
trimethylated H3K9 (H3K9me3) and H4K20. These marks, along
with phosphorylation of H3 (Ser10) and others, are correlated
with chromatin condensation and active replication. In
contrast, epigenetic marks such as phospho-H2A.X (Ser139)
and phospho-H2B (Ser14) mark active apoptosis and DNA
damage. The ChIPAb+ validated antibody/primer set for
chromatin immunoprecipitation of H3K9me3 complements EMD
Millipore’s broad range of specific, highly validated antibodies
and assays for epigenetic signaling pathways.
CpG MethylQuest™ DnA Isolation kit (Catalogue No. 17-10035)
Aberrant hypermethylation of normally unmethylated CpG
islands is a frequent event in immortalized and transformed
cells, and is associated with transcriptional inactivation of
tumor suppressor genes. DNA methylation also correlates with
repressed telomere recombination. EMD Millipore’s CpG
MethylQuest DNA Isolation Kit provides an efficient, convenient
solution for mapping methylation across a single gene or
across the entire genome, using a unique GST-methyl-CpG
binding domain fusion protein that tightly binds CpG
methylated sequences but has extremely low affinity for
non-methylated regions.
Sonicated chromatin prepared from 3x10⁶ NIH 3T3 L1 cells was subjected
to chromatin immunoprecipitation using 4 µg of either normal rabbit IgG
or Anti-trimethyl-Histone H3 (Lys9) antibody (17-625) and the Magna ChIP
A kit (17-610). Successful enrichment of trimethyl-histone H3 (Lys9)-
associated DNA fragments was verified by qPCR using included ChIP
primers flanking the mouse p16 promoter.
HeLa and MCF7 genomic DNA were purified with the CpG MethylQuest. DNA
isolation kit. 2 µL of the purified samples were used for 30 cycles of PCR
amplification of SNRPN (frequently methylated locus) and GAPDH (typically
unmethylated). PCR aliquots were loaded on agarose gels (S = supernatant,
not bound to beads; E = elution, bound to beads)
0
10
20
30
40
H3K9me3IgG
Fold
Enr
ichm
ent
1.00
34.93
Limitless Replicative PotentialIn normal cells, telomeres protect chromosomes from fusing with each other or
rearranging during mitosis. Telomeres become shorter with each cell division, limiting
cells to a fixed number of divisions. Tumor cells can achieve unlimited replicative potential
either by synthesizing high levels of telomerase enzyme or via homologous recombination to create
lengthened telomeres. Upregulation of telomere maintenance occurs in about 90% of human
cancers. Increasing evidence indicates that chromatin modifications are important regulators of
telomeres. Loss of epigenetic regulation correlates with aberrant telomere length. These links
between epigenetic status and telomere-length regulation provide important insights for analyzing
cancer progression and aging.
HeLa S HeLa E MCF7 S
Positive: SNRPN Negative: GAPDH
MCF7 E HeLa S HeLa E MCF7 S MCF7 E
HeLa S HeLa E MCF7 S MCF7 E
Positive: SNRPN
Negative: GAPDH
ATP
STOPTOP

18
Fluorescent Conjugated Antibodies for Cell Surface CD Markers (Catalogue Nos. FCMAB211F, FCMAB188F and others)
The replicative potential of cancer cells is analogous to that
of stem cells. In fact, many studies have shown tumors’
stem-like characteristics to correlate with malignancy. One
strategy to isolate cancer cells with high replicative
potential is using flow cytometry to identify cells that
express stem cell surface markers, such as CD90 and CD34.
EMD Millipore’s growing selection of directly conjugated
antibodies for cancer-relevant CD markers is specifically
designed, optimized, and validated for flow cytometry.
Phospho-Histone H3(Ser10) and Cyclin B1 QCI /HCA Assay kit (Catalogue No. HCS211)
Cyclin B1 and histone H3, active in chromatin condensation,
play key roles in DNA replication and mitosis. QCI of histone
H3 phosphorylation and cyclin B1 expression have proven to
be powerful tools in drug discovery; for example, High
Content Analysis (HCA) of histone H3 phosphorylation has
been used to characterize Aurora kinase inhibitors. HCA of
cyclin B1 expression is used for cell cycle inhibitor profiling.
Calbiochem Brdu Cell Proliferation Assay (EMD Chemicals Catalogue No. QIA58*)
DNA replication in normal and tumor cells can be accurately
measured by assessing the degree to which BrdU, a modified
nucleotide, is incorporated into DNA. This BrdU Cell
Proliferation Assay is a non-isotopic immunoassay for
quantification of BrdU incorporation into newly synthesized
DNA of actively replicating genomes. It is sensitive, rapid,
and easy to perform.
Human peripheral blood
lymphocytes were
stained with Milli-Mark™
human CD90-FITC
antibody and analyzed
by flow cytometry. The
right-hand (lower) peak
represents CD90-
expressing cells.Immunofluorescence of untreated and cell cycle-arrested HeLa cells. HeLa
cells were treated with either 0.4% DMSO control (left) or the G2/M phase
cell cycle arresting agents, vinblastine sulfate (top right) or paclitaxel
(bottom right). The cells were fixed and stained for Phospho-Histone
H3(Ser10) (top, green) or Cyclin B1 (bottom, red) and Hoechst nuclear stain
(blue). The percentage of cells expressing phospho-histone H3 or nuclear
cyclin B1 increased following arrest of cells in M phase.
The Calbiochem BrdU Cell Proliferation Assay responds to increasing cell
number with higher sensitivity than a competing assay.
00.2 0.5 1.0 4.0
19 hr BrdU Calbiochem Assay
2 hr BrdU Calbiochem Assay
19 hr BrdU Competitor Assay
2 hr BrdU Competitor Assay
10.0 100.0
Cell Number/Well x 10
Sensitivity of Calbiochem BrdU Cell Proliferation Assayvs. Competitor BrdU Labeling Kit
40
80
120
S/N
(si
gnal
/sig
nal
of n
o ce
lls)
kEY ProDuCtS - rEPLICAtIvE PotEntIAL
Antibodies and Proteins
Description Catalogue No.
Anti-phospho-Histone H2A.X (Ser139), clone JBW301 05-636
Anti-phospho-Histone H2B (Ser14) 07-191
Anti-HDAC9, clone LH/JC2 05-897
Aurora A, active purified kinase 14-511
Anti-CD34 Class III, clone 581, FITC conjugated CBL555F
Assays
CpGenome Turbo Bisulfite Modification Kit S7847
CpG WIZ® ERa Amplification Kit S7815
TRAPeze® Telomerase Detection Kit S7700
BrdU Cell Proliferation Assay, HTS HTS01*
BrdU Immunohistochemistry System HCS30*
Senescence Detection Kit QIA117*
p53 and p21 QCI / HCA Assay Kit HCS235
*Available from EMD Chemicals Inc.
For a complete listing of cancer-related products from
Millipore, please visit www.millipore.com/cancer.
For a complete listing of cancer-related products from EMD Chemicals, please visit www.emdbiosciences.com.

19
Anti-vEGF, clone JH (Catalogue No. 05-443)
Vascular endothelial growth factor (VEGF) is a pro-angiogenic
growth factor both secreted by tumor cells and expressed in
response to hypoxia via HIF signaling. Specially validated for
immunohistochemistry of paraffin-embedded tissues, this
antibody complements EMD Millipore’s comprehensive
offering of antibodies against targets of various stimulating
mechanisms of angiogenesis, including various VEGF
isoforms, VEGF Receptors, FGFs, and angiopoietins.
In Vitro vascular Permeability Assays (24- & 96-Well) (Catalogue Nos. ECM644, ECM642)
The In Vitro Vascular Permeability Assay provides an efficient
system for evaluating the effects of chemicals and drugs on
endothelial cell adsorption, transport, and permeability.
Endothelial cells are seeded onto collagen-coated inserts in
multiwell plates and treated with cytokines, growth factors,
or any reagent of interest. After treatment, the extent of
permeability is determined by measuring the fluorescence of
the plate well solution.
Immunohistochemistry of paraffin-embedded human breast carcinoma
stained with anti-VEGF (05-443).
Permeability analysis of HUVEC monolayers. HUVEC cells were cultured, treated
with TNFa, then subjected to FITC-dextran permeability testing and monolayer
staining. Data showed high permeability in the absence of an occlusive
endothelial cell monolayer. The “No Treatment” sample exhibits a visually
confluent monolayer, as supported by low FITC-dextran permeability. Disruption
of monolayer integrity is observable both visually and by quantification of
increased plate well solution fluorescence following TNFa treatment.
Sustained AngiogenesisAngiogenesis, the development of new vascular networks, is rare in adult tissues. In
tumors, dysregulated signaling and hypoxic conditions lead to sustained, almost
uncontrolled angiogenesis, a necessary component of tumor growth and metastasis. Chronic
inflammation mechanisms, such as the production of reactive oxygen species during infection and
secretion of pro-inflammatory cytokines, can also foster angiogenesis in tumor progression.
Angiogenic signaling in tumors is similar to normal angiogenesis, mediated by soluble growth factors,
membrane-bound receptors, and cell-cell and cell-matrix interactions. Such signaling regulates cell
migration, which is vital to angiogenesis. However, there are multiple differences between tumor
angiogenesis and normal blood vessel formation. Tumor endothelial cells proliferate faster than
non-tumor endothelial cells. Tumor vasculature differs from normal vasculature in morphology,
enhanced leakiness, and structural abnormalities. Finally, tumor vessels are often not capable of
transporting oxygen to and removing waste products from all of the tumor tissues, resulting in
frequent tumor cell necrosis.
no Monolayer
100 ng/mL tnF-a
no treatment
NoMonolayer
NoTreatment
100 ng/mL TNF-α
30
20
10
Fluo
resc
ent
Cou
nt
( x 1
00
0)
0
NoTreatment
100 ng/mL TNF-α
2.0
1.0
0.5
1.5
Fluo
resc
ent
Cou
nt
( x 1
00
0)
0
NoMonolayer
NoTreatment
100 ng/mL TNF-α
30
20
10
Fluo
resc
ent
Cou
nt
( x 1
00
0)
0
NoTreatment
100 ng/mL TNF-α
2.0
1.0
0.5
1.5
Fluo
resc
ent
Cou
nt
( x 1
00
0)
0
ATP
STOPTOP

20
MILLIPLEX map Human Cytokine/Chemokine Panel I(Catalogue No. HCYTOMAG-60K)
Response to anti-angiogenic chemotherapy is highly dependent on the genetic profile of both the individual and the tumor. For
example, preclinical studies of the vascular targeting cancer drug candidate NSC 640488 demonstrated two processes critical
for anti-tumor effects: (1) tumor vascular endothelial apoptosis and (2) production of anti-vascular and pro-immunity
cytokines1,2. This MILLIPLEX map multiplex analyte panel enables characterization of multiple biomarkers associated with
individual genetic profiles simultaneously, increasing the sensitivity and specificity of the assay while conserving precious
samples.
References1. Jassar AS et al. Activation of tumor-associated macrophages by the vascular disrupting agent 5,6-dimethylxanthenone-4-acetic acid induces an effective
CD8+ T-cell-mediated antitumor immune response in murine models of lung cancer and mesothelioma. Cancer Res. 2005 Dec 15;65(24):11752-61.
2. Ching LM et al. Induction of endothelial cell apoptosis by the antivascular agent 5,6-Dimethylxanthenone-4-acetic acid. Br J Cancer. 2002 Jun
17;86(12):1937-42.
In a clinical trial for the anticancer drug NSC 640488, researchers used the MILLIPLEX map Human Cytokine 42-plex assay to identify a consistent pattern of
cytokine/chemokine modulation in the peripheral blood lymphocytes (PBL) of human donors that responded best to NSC 640488. Shown are fold changes in
cytokine concentrations in PBLs from subjects treated with the drug as compared to untreated PBLs from different donors. A small cohort of donors showed
downregulation of IP-10, MCP-1, and sCD40L and increased induction of TNFa, MIP-1a, IL-6, and IL-8. This pattern of detection may potentially correlate with a
patient’s responsiveness to NSC 640488: high responders (group A) or low responders (group B). NC denotes less than a 1.5-fold change.
Group Aα α α
ααα

21
ready-to-Assay™ CXCr2 Chemokine receptor Frozen Cells (Catalogue No. HTS002RTA)
The chemokine IL-8 is highly expressed in many cancers; IL-8
behaves as a chemoattractant for endothelial cells
expressing IL-8-interacting CXCR2 receptors, promoting
their migration to cancers, ultimately facilitating
angiogenesis. Ready-to-Assay CXCR2 frozen cells are fully
validated for assessing the functional activity of CXCR2-
interacting compounds, providing cell-based assay data
while eliminating time-consuming cell culture.
Calcium flux in CXCR2–expressing Chem-1 cell line induced by rhGROα.
CXCR2–expressing Chem-1 Ready-to-Assay cells were loaded with a calcium
dye, and calcium flux in response to the indicated ligand (4-fold serial
dilution with each concentration performed in duplicate) was determined on
a Molecular Devices FLIPRTETRA®. Maximal fluorescence signal obtained in
this experiment was 2,500 RLU (Relative Light Units).
0
-12 -11 -10 -9 -8 -7
rhGROα
-6
20
40
60
80
100
120
Rel
ativ
e Li
ght
Uni
ts(%
of
max
imum
)
Log [Dopamine], M
kEY ProDuCtS - AnGIoGEnESIS
Antibodies and Proteins
Description Catalogue No.
Anti-Angiopoietin-1 AB10516
Anti-VEGF Receptor-3, extracellular domain, MAB3757
clone 9D9F9
Anti-FGF-2/basic FGF (neutralizing), clone bFM-1 05-117
Flt-1(VEGFR1) active purified kinase 14-562
Assays
In Vitro Angiogenesis Assay Kit ECM625
Fibrin In Vitro Angiogenesis Assay ECM630
MILLIPLEX map Human Cytokine/Chemokine HCYP2MAG-62K
Magnetic Bead Panel II
MILLIPLEX map Human Soluble Cytokine Panel HSCR-32K
ChemiScreen™ CXCR2 Chemokine Receptor HTS002M
Membrane Preps
Ready-to-Assay EP2 Prostanoid Receptor HTS185RTA
Frozen Cells
related Inhibitors
InhibitorSelect VEGF Signaling Pathway Panel 676502*
TAS-301 608050*
VEGF Inhibitor, CBO-P11 676496*
Withaferin A, Withania somnifera 681535*
*Available from EMD Chemicals Inc.
For a complete listing of cancer-related products from
Millipore, please visit www.millipore.com/cancer.
For a complete listing of cancer-related products from EMD Chemicals, please visit www.emdbiosciences.com.

22
Millicell® µ-Angiogenesis Assay Kits
tECHnoLoGY HIGHLIGHt
(Catalogue Nos. MMA125 and MMA130)
Quantify activation or inhibition of tumor angiogenesis with Millicell µ-Angiogenesis Assay Kits. These kits provide a
powerful, quantitative, slide-based platform for superior, real-time visualization of tubule formation in angiogenesis. The kits
are optimized and easy to use with properties that prevent meniscus formation and out-of-focus areas. An entire well can
be visualized at low magnification, generating enormous time and cost savings.
Millicell µ-Angiogenesis Activation Assay. The angiogenesis activation kit includes fibrinogen and thrombin components to make the fibrin gel, the activation
control PMA (phorbol myristate acetate), and calcein-AM to visualize the cells in real time. (Left to right and top to bottom) Bright field, calcein-AM, DAPI, and
calcein-DAPI merge micrographs show robust tubule formation and lumen structure in the presence of phorbol myristate acetate (PMA, a proangiogenic agent).
Millicell µ-Slide vs. 96-Well Plate
no meniscus• Improved optics
• All cells in focus
• 10 µL inner well volume
• 15 wells
• Slide format
10x 10x
DepthFocus
unique well design eliminates meniscus• Upper well contains
media/reagents
• Inner well contains
cells and/or matrix
Meniscus formation• Conventional optics
• Few cells in focus
• 100 µL well volume
• 96 wells
• Multiwell format
With no stimulant Lumen StructureWith 50 µg/mL PMA and 1 x ITS
Grow, treat, stain, and visualize cells all in one device:
Enhanced imaging capabilities of Millicell slides improve studies of angiogenesis:

23
Anti-Hypoxia Inducible Factor 1a (HIF-1a)(Catalogue No. 07-628)
Tumor-specific altered metabolism (the “Warburg
Phenomenon”) consists of an increase in aerobic glycolysis.
A principal mechanism of aerobic glycolysis involves
activation of HIF-1a, overexpressed in many cancers. HIF-1a
also promotes increased vascularization and tumor
progression. This antibody is validated for
immunoprecipitation, immunohistochemistry, and Western
blotting, and complements EMD Millipore’s comprehensive
offering of antibodies related to tumor-specific alterations
of celluar metabolism, including antibodies for receptor
tyrosine kinases, the PI3K-AKT signaling pathway, and
mitochondrial detection.
Calbiochem Anti-PDH-E1a (pSer293) rabbit pAb (EMD Chemicals Catalogue No. AP1062*)
Dysregulation of the pyruvate dehydrogenase (PDH) complex
(PDC) in skeletal muscle has been implicated in type 2
diabetes and various mitochondrial diseases. Recently, it has
been shown that inhibition of PDC activity in cancer cells
promotes Warburg metabolic and malignant phenotype. The
activity of PDC is mainly regulated by the phosphorylation
state of Ser293, Ser232, and Ser300 on the E1a subunit.
Modified nuclear extract
from normal MCF-7
cells (Lane 1) and MCF-7
cells treated with 150
mM cobalt chloride (a
hypoxia mimetic) for
16 hours (Lane 2) and
analyzed by Western
blotting with anti-HIF-
1a (07-628).
Detection of phospho-PDH-E1a (Ser293) by immunocytochemistry. COS7
cells were incubated in dichloroacetate (DCA), an inhibitor of PDH kinase.
All samples were incubated with mitochondrial stain (red), fixed and
permeabilized. Primary antibodies: PhosphoDetect™ Anti-PDH-E1a (pSer293)
Rabbit pAb (Cat. No. AP1062, green, top) or anti-PDH-E1a antibody (green,
bottom). Detection: fluorescence (Alexa Fluor 488 secondary antibody) with
DAPI (blue). Data courtesy of Sandra Wiley and Matthew Rardin, University
of California, San Diego.
116
66
97
45
1 2
2 hrDCA
2 hrDCA
Mitochondria MergePhospho-
PDH
Metabolic ReprogrammingNormal cellular metabolism involves a complex series of controlled biochemical
reactions that produce energy in the form of ATP to maintain homeostasis and allow
cells to respond to environmental changes. These biochemical reactions are disrupted during
tumorigenesis as cancer cell proliferation results in increased distances from vascular basement
membranes, causing regional hypoxia. When ATP production from glucose metabolism falls below
maintenance levels, there is an upregulation of anaerobic glycolysis that can then become
permanent through the stabilization of hypoxia-inducible factor 1a (HIF-1a) and/or the upregulation
of phosphorylated c-myc. This glycolytic adapatation causes regional acidosis, which provides
growth advantages to the cancer population, allowing tumor cells to modify their environment in a
way that is toxic to non-tumor cells. The acidic environment also leads to increased motility and
cancer cell invasion into adjacent normal tissue, putting cancer cells in direct contact with
mesenchymal cells.
ATP
STOPTOP

24
A. U937 cells were stimulated with IFNg, IL-6, and GMCSF, then stained with antibodies against phospho-STAT1, phospho-STAT3, and phospho-STAT5A/B. Double
positive cells (blue) are seen in each plot, indicating simultaneous detection of all three activated STAT proteins. Untreated U937 cells (red) are shown for
comparison. B. Single parameter overlays of activated STAT proteins in untreated (red) vs. treated (blue) U937 cells stimulated with IFNg for STAT1 activation, IL-6
for STAT3 activation, and GM-CSF for STAT5A/B activation.
HIF-1a EZ-tFA transcription Factor Assays (Catalogue Nos. 70-670, 70-570, 70-500)
The transcription factor HIF1a is a key regulator of the
hypoxia response, mediating both metabolic reprogramming
of tumor cells as well as stimulating angiogenesis. EMD
Millipore’s HIF-1a EZ-TFA Transcription Factor Assays are
powerful tools for measuring the DNA binding activity of
HIF-1a in nuclear extracts. The assays are provided in
non-radioactive, 96-well formats.
FlowCellect Multi-StAt Activation Profiling kit (Catalogue No. FCCS025550)
STAT transcription factors regulate cell proliferation, survival, and migration downstream of transmembrane receptors.
Recent research reports additional roles for STATs in metabolic reprogramming. Active, nuclear STAT3 increases transcription
of HIF-1a, promoting tumorigenesis, while mitochondrial STAT3 helps mediate transformation by affecting glycolysis and
oxidative phosphorylation. By providing simultaneous detection of phosphorylated STATs, the FlowCellect Multi-STAT
Activation Kit enables quick profiling of the status of constitutive activation of STAT1, STAT3, and STAT5 within a population
of cells or tumors.
Nuclear extract from CoCl2-treated Cos-7 cells were assayed with the EZ-
TFA HIF-1a assay kit and showed robust binding to the DNA capture probe,
which is complementary to the endogenous HIF-1a DNA-binding sequence,
the hypoxia response element (HRE). Specific binding was confirmed, as
addition of specific competitor oligonucleotide reduced the observed
signal. Signal was further diminished in the absence of DNA capture probe
(“Negative Control”).
0CoCl2 +
Cos-7 cellsCompetitor Negative
ControlBackground
cps
( x
10
6)
8
10
12
6
4
2
104
103
102
101
100
100 101 102 103 104
104
103
102
101
100
100 101 102 103 104
104
103
102
101
100
100 101 102 103 104
pSTAT3-Alexa® 488 (GRN-HLog) pSTAT5-PE (YLW-HLog) pSTAT5-PE (YLW-HLog)
STAT1-PerCP (RED-HLog) STAT3-Alexa 488 (GRN-HLog) STAT5-PE (YLW-HLog)
100
0
48
95
143
190
101 102 103 104
Cou
nt
pSTA
T1-P
erC
P
pSTA
T1-P
erC
P
pSTA
T3-A
lexa
488
100
0
63
125
188
250
101 102 103 104
Cou
nt
100
0
53
105
158
210
101 102 103 104
Cou
nt
A.
B.

25
MILLIPLEX map Akt/mtor Multiplex Assay (Catalogue No. 48-611)
The Akt/mTOR pathway regulates production of key
metabolic effectors:
• RNA Polymerase I and III: protein synthesis, cell
metabolism
• HIF-1a and b: angiogenesis, cell metabolism, proliferation,
motility
Akt signaling is initiated by binding of growth factors to
receptors such as the insulin receptor and EGFR.
Dysregulation of Akt/mTOR pathways results in multiple
disease states, including cancer. The MILLIPLEX map Akt/
mTOR panel uses the Luminex xMAP-based platform to
detect simultaneously changes in 11 pathway targets.
kEY ProDuCtS - MEtABoLISM
Antibodies
Description Catalogue No.
Anti-Hypoxia Inducible Factor 1a (HIF-1a), MAB5382
clone H1a67
Anti-Mitochondria, surface of intact mitochondria, MAB1273
clone 113-1
Anti-PI3 Kinase, p110a 09-481
Anti-PDH-E1a (pSer232) Rabbit pAb AP1063*
Anti-PDH-E1a (pSer300) Rabbit pAb AP1064*
Anti-BRCA1 (Ab-1) Mouse mAb (MS110) OP92*
Assays
Description Catalogue No.
Mitochondria/Cytosol Fractionation Kit MIT1000
MILLIPLEX map Akt/mTOR – 8 Plex 48-611
MILLIPLEX map Total HIF-1a MAPmate 46-665
MILLIPLEX map GSK3b (Ser9) MAPmate 46-690
FlowCellect EGFR/STAT1 Activation FCCS025142
Dual Detection Kit
FlowCellect EGFR/STAT3 Activation FCCS025143
Dual Detection Kit
Effects of inhibition and stimulation of HepG2 cells on Akt/mTOR phospho-
proteins. To demonstrate the power of the Akt/mTOR panel, HepG2 cells
were treated with specific inhibitors such as wortmannin, which blocked
phosphorylation of mTOR, TSC2, Akt, GSK3a, GSK3b, p70S6K, and RPS6.
This was followed by stimulation with 50 ng/mL IGF1 or 1 µM insulin for 15
minutes. Various phosphorylated biomarkers were simultaneously detected
by the Luminex xMAP platform (represented as average MFI) using EMD
Millipore’s Akt/mTOR panel.
2,000
p70S6
KIRS
GSK3α
IGF1R
GSK3β Akt
PTEN IR
RPS6
TSC2
mTOR0
MFI
4,000
6,000
HepG2 + InhibitorsHepG2 + Insulin
*Available from EMD Chemicals Inc.
For a complete listing of cancer-related products from Millipore, please visit www.millipore.com/cancer.
For a complete listing of cancer-related products from EMD Chemicals, please visit www.emdbiosciences.com.

26
Anti-FoXP3, clone 3G3 (Catalogue No. 04-960)
FOXP3 regulates the development and differentiation of T
regulatory T-cells in the normal immune system. However,
many cancers express high levels of FOXP3, suggesting that
it mediates tumor escape from immune control. This FOXP3
antibody is validated for flow cytometry and ELISA, making it
ideal for multiparametric studies of the immune system. It
complements EMD Millipore’s wide range of antibodies for
studying immune cell regulation including antibodies against
IL-17, CTLA4, various cytokines and chemokines, and
members of the JAK/STAT pathway.
FlowCellect Human FoXP3 treg Characterization kit (Catalogue No. FCIM025118)
Regulatory T-cells suppress the activation of the immune
system following infections, maintaining homeostasis. Some
cancer patients have increased numbers of regulatory
T-cells, allowing malignant cells to escape the activation of
the immune system. This kit helps phenotypically distinguish
and quantify human regulatory T-cells with high accuracy
and specificity. Our combination of directly conjugated
antibodies and optimized buffers enable simultaneous
detection of CD3 and CD4 on the surface and FOXP3 in the
nucleus.
FoxP3 is expressed in
mouse splenocytes.
Surface staining of
mouse CD4+ CD25+
splenocytes with 5 µg
of a biotinylated version
of Anti-FOXP3, clone
3G3 (open histogram) or
with mouse biotinylated
IgG isotype control
(shaded histogram).
Cells were detected
using Streptavidin-FITC
and analyzed using flow
cytometry. Human PBMCs were stimulated with IL-2 for 2 days. Total T-cells (CD3-
positive lymphocytes) were analyzed for dual expression of CD4 and FOXP3
(shown in the upper right quadrant of right plot). 3.25% of the T-cells for
this sample are CD3+, CD4+, and FOXP3+. A CD3 gate is used to eliminate
cell types other than T-cells, such as monocytes, which can also express
FOXP3, to avoid false positives.
32
0100 101 102
FL1-H
103 104
Escape from Immune ControlUnlike other harmful agents that invade the body, cancer cells avoid immune control by two
major mechanisms: first, they avoid antigenic recognition by immune cells, and second, they
neutralize immunogenic response. Cancer cells avoid antigenic recognition by hiding within difficult-
to-access tissues and by shedding adhesion molecules and antigens that would otherwise attract
immune cells. Cancer cells neutralize the immunogenic response by secreting immunosuppressive
cytokines (such as TGFb, IL-10, and VEGF) and by secreting anti-apoptotic signals. Cancer-driven
suppression of immune response can potentially impact the way in which the host immune system
recruits immune regulatory cells, uses inhibitory receptor-ligands, and produces inhibitory or
inflammatory cytokines. Resulting dysfunctions in the host’s own immune system further facilitate
evasion of immune control by cancer cells.
Anti-CD3-PE/Cy5 Anti-CD4-FITC
ATP
STOPTOP
Ant
i-FO
XP3-A
lexa
Flu
or 6
47
Sid
e Sca
tter
(SSC)

27
MILLIPLEX map Human Circulating Cancer Biomarker Panel 1 (Catalogue No. HCCBP1MAG-58K, magnetic)
Understanding the role of cytokines and chemokines
secreted either by tumors to avoid immune control or by the
body to effect immune response or inflammation has shed
light on the interactions between a tumor and its
environment. This multiplexed analyte panel consists of 26
circulating cancer biomarkers that include cytokines,
chemokines, and metabolic markers. Some biomarkers are
tumor type-specific, such as prostate-specific antigen (PSA),
while others, such as IL-8, have been detected in many
cancers.
Detection of circulating cancer biomarkers using the MILLIPLEX map Human
Circulating Cancer Biomarker Panel 1 in normal, lung and prostate cancer
samples.
kEY ProDuCtS - IMMunE ControL
Antibodies
Description Catalogue No.
Anti-CTLA4 (CD152), clone 9H10 04-963
Anti-JAK3, clone HL423 04-011
Assays MILLIPLEX map Human Sepsis Panel 1 HSEP-63K
FlowCellect Mouse FoxP3 Identification Kit FCIM025126
Flowcellect Human Lymphocyte ZAP-70 FCIM025122
Characterization Kit
FlowCellect Mouse Th1/Th17 FCIM025138
Intracellular Cytokine Kit
Inhibitors
17-AAG 100068*
Geldanamycin, Streptomyces hygroscopicus 345805*
Heat Shock Protein Inhibitor I 373260*
Hsp25 Kinase Inhibitor 385880*
Con
cent
rati
on
4
3
2
1
0
200
150
100
50
Normal
CYFR
A21-1
FGF2 IL6
IL8
Prl
Lept
inCA
125
sFas
OPN
sFas
lTN
F-α
MIF
AFP
HG
FH
CG
-βH
E4CA
19-9
CA
15-3
VEG
FSCF
TR
AIL
TG
F-α
Toal
PSA
CEA
Con
cent
rati
on
30
25
20
15
10
5
4
3
2
1
0
Lung Cancer
CYF
RA
21-1
FGF2 IL6
IL8
Prl
Lept
inCA
125
sFas
OPN
sFas
lTN
F-α
MIF
AFP
HG
FH
CG
-βH
E4CA
19-9
CA
15-3
VEG
FSCF
TR
AIL
TG
F-α
Toal
PSA
CEA
Con
cent
rati
on
15000
10000
5000
0
Prostate Cancer
CYF
RA
21-1
FGF2 IL6
IL8
Prl
Lept
inCA
125
sFas
OPN
sFas
lTN
F-α
MIF
AFP
HG
FH
CG
-βH
E4CA
19-9
CA
15-3
VEG
FSCF
TR
AIL
TG
F-α
Toal
PSA
CEA
*Available from EMD Chemicals Inc.
For a complete listing of cancer-related products from
Millipore, please visit www.millipore.com/cancer.
For a complete listing of cancer-related products from EMD Chemicals, please visit www.emdbiosciences.com.
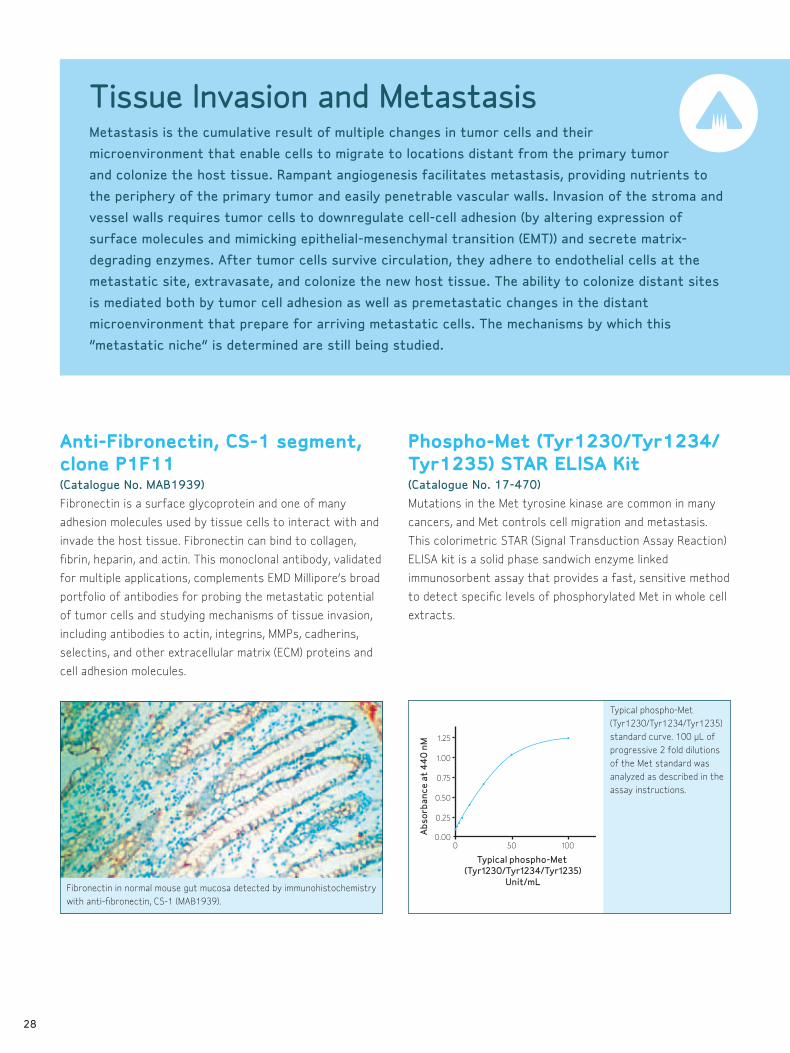
28
Typical phospho-Met
(Tyr1230/Tyr1234/Tyr1235)
standard curve. 100 µL of
progressive 2 fold dilutions
of the Met standard was
analyzed as described in the
assay instructions.
Anti-Fibronectin, CS-1 segment, clone P1F11 (Catalogue No. MAB1939)
Fibronectin is a surface glycoprotein and one of many
adhesion molecules used by tissue cells to interact with and
invade the host tissue. Fibronectin can bind to collagen,
fibrin, heparin, and actin. This monoclonal antibody, validated
for multiple applications, complements EMD Millipore’s broad
portfolio of antibodies for probing the metastatic potential
of tumor cells and studying mechanisms of tissue invasion,
including antibodies to actin, integrins, MMPs, cadherins,
selectins, and other extracellular matrix (ECM) proteins and
cell adhesion molecules.
Phospho-Met (tyr1230/tyr1234/tyr1235) StAr ELISA kit (Catalogue No. 17-470)
Mutations in the Met tyrosine kinase are common in many
cancers, and Met controls cell migration and metastasis.
This colorimetric STAR (Signal Transduction Assay Reaction)
ELISA kit is a solid phase sandwich enzyme linked
immunosorbent assay that provides a fast, sensitive method
to detect specific levels of phosphorylated Met in whole cell
extracts.
Fibronectin in normal mouse gut mucosa detected by immunohistochemistry
with anti-fibronectin, CS-1 (MAB1939).
1.25
Abs
orba
nce
at 4
40
nM
Typical phospho-Met (Tyr1230/Tyr1234/Tyr1235)
Unit/mL
0 50
1.00
0.75
0.50
0.25
0.00100
Tissue Invasion and MetastasisMetastasis is the cumulative result of multiple changes in tumor cells and their
microenvironment that enable cells to migrate to locations distant from the primary tumor
and colonize the host tissue. Rampant angiogenesis facilitates metastasis, providing nutrients to
the periphery of the primary tumor and easily penetrable vascular walls. Invasion of the stroma and
vessel walls requires tumor cells to downregulate cell-cell adhesion (by altering expression of
surface molecules and mimicking epithelial-mesenchymal transition (EMT)) and secrete matrix-
degrading enzymes. After tumor cells survive circulation, they adhere to endothelial cells at the
metastatic site, extravasate, and colonize the new host tissue. The ability to colonize distant sites
is mediated both by tumor cell adhesion as well as premetastatic changes in the distant
microenvironment that prepare for arriving metastatic cells. The mechanisms by which this
“metastatic niche” is determined are still being studied.
ATP
STOPTOP

29
QCM™ Cell Invasion/Migration/Chemotaxis Assays (Catalogue Nos. ECM551, ECM558, ECM510, ECM580
and others)
The most widely accepted in vitro approach to evaluating cell
invasion as a function of metastasis is the Boyden chamber
method. The porous membrane insert of a multiwell plate is
layered with an extracellular matrix (ECM) or basement
membrane protein to simulate the barriers invaded by tumor
cells in vivo. EMD Millipore’s QCM inclusive invasion, migration,
and chemotaxis assays enable the investigation of various
elements of cell movement during metastasis.
ChemiScreen CXCr4 Chemokine receptor Membrane Preparations (Catalogue No. HTS004M)
Many cancers overexpress CXCR4 chemokine receptors,
which likely facilitate their invasive and metastatic potential.
Various tissues and organs release SDF1, a chemoattractant
and the endogenous ligand for CXCR4 receptors. CXCR4
receptors likely contribute to metastasis by guiding cells
towards tissues enriched with SDF1. EMD Millipore’s CXCR4
membrane preps enable accurate, efficient identification of
molecules that can compete for SDF1 binding to CXCR
receptors.
MILLIPLEX map Human MMP Panels 1 and 2 (Catalogue Nos. HMMP1-55K, HMMP2-55K)
The MMPs and tissue inhibitors of metalloproteases (TIMPs)
are responsible for the balance in the breakdown of
extracellular matrix (ECM), playing a key role in normal
physiological processes, such as embryonic development and
tissue morphogenesis. Disruption of the MMP/TIMP balance
can result tumor growth and metastasis. The MILLIPLEX map
Human MMP and TIMP Panels enable you to explore the
modulation of TIMP expression and the function of the MMP/
TIMP balance.
Matrix metalloprotease (MMP) inhibitor blocks invasion by HT-1080 cells.
After applying a general MMP inhibitor (GM6001) to both a metastatic
cancer cell line (HT-1080) and normal fibroblast cell line (NIH 3T3), cell
invasion was initiated using 10% FBS as a chemoattractant and measured
using the QCM Cell Invasion Assay (ECM551).
Competition binding for
CXCR4. 5 mg/well CXCR4
Membrane Preparation
was incubated with
125I-labeled SDF-1a
(0.065, 1.3 or 0.25
nM), and increasing
concentrations of
unlabeled SDF-1a, and
4-fold signal:background
was obtained.
25
[125 I
]-S
DF-
1α b
ound
(cpm
x 1
,00
0)
[unlabeled SDF-1α] log M
-14 -13
20
15
10
5
0-12 -11 -10 -9 -8
0.065 nM SDF-1α
0.13 nM SDF-1α
0.25 nM SDF-1α
-7 -6 -5
kEY ProDuCtS
Metastasis Antibodies and Proteins
Description Catalogue No.
Anti-Integrin aVb3, clone LM609, azide free MAB1976Z
Anti-MMP-9, catalytic domain AB19016
Anti-Met (extracellular), clone 4F8.2 05-1049
Met (D1246N), active 14-818
TIMP-2, human, recombinant PF021*
Metastasis Assays Endothelial Cell Adhesion Assay ECM645
Integrin-mediated & ECM530 and others
ECM Cell Adhesion Arrays
Quantitative Pseudopodia Assay Kit ECM650
MILLIPLEX map Human TIMP Panel 2 HTIMP2-54K
Ready-to-Assay LPA1 Lysophospholipid HTS089RTA
Receptor Frozen Cells
ChemiScreen EP2 Prostanoid Receptor Membrane Preps HTS185M
ChemiScreen LPA1 Lysophospholipid Membrane Preps HTS089M
Metastasis Inhibitors GM6001 (MMP inhibitor) 364206*
MMP Inhibitor Set I 444255*
TGFb RI Inhibitor II 616452*
*Available from EMD Chemicals Inc.
For a complete listing of cancer-related products from Millipore, please visit www.millipore.com/cancer.
For a complete listing of cancer-related products from EMD Chemicals, please visit www.emdbiosciences.com.
Use our easy online tool to design your MILLIPLEX map kits. Simply choose the species, panel, and analytes that best fit your needs, and EMD Millipore will build the kit to your specifications. Visit www.millipore.com/kits.

30
Related Research Support ToolsEnsure that your discoveries have the highest impact and biological relevance by starting with quality cell
and tissue samples. EMD Millipore’s sterile filtration tools, cultureware, and automated cell counting
system enable robust, uniform, contamination-free cell and tissue culture.
Sterile FiltrationEliminating contaminants from your cell growth media and additives is absolutely crucial to preserving the
integrity and accuracy of your cell cultures. EMD Millipore’s comprehensive line of sterile filtration tools have
been specifically designed to address these needs and to ensure the reproducibility of your cancer research.
vacuum-Driven Sterile FiltersStericup® filter devices combine a filter unit with a receiver flask and cap for processing and storage.
Description Membrane/Application Pore Size (µm)Funnel Capacity (mL) Receiver Bottle Catalogue No.
Stericup-GP Filter Units Millipore Express PLUS (PES) / fast
filtration of tissue culture media and
buffers
0.22 500 500 mL SCGPU05RE
Cultureware
Description No. of Layers Total Surface Area (cm2) Qty/Pk Catalogue No.
Millicell HY FlaskSTEM CELL TESTED
3 600 16 PFHYS0616
5 1000 8 PFHYS1008
Description System Components Membrane/Pore Size Qty/Pk Catalogue No.
Millicell-96 cell culture insert plates
96-well cell culture plate, single-well feeder tray and lid Isopore (Polycarbonate) 5 PSHT004R5
96-well cell culture plate, 96-well receiver tray and lid Isopore (Polycarbonate) 5 PSHT004S5
Description Qty/Pk Catalogue No.
Millicell EZ SLIDE (4-well glass) 16 PFHYS0616
8 PFHYS1008
Millicell EZ SLIDE (8-well glass) 16 PEZGS0816
96 PEZGS0896
Millicell EZ SLIDE Microscope Slide Holder 1 PEZXMSH01
Millicell Membrane-Based Cell CultureFor more relevant cell-based assays, try growing your cells on EMD Millipore’s membrane-based cell culture
products. The optimized membranes result in cells with structure and function that more closely mimic what
occurs in vivo. Obtain high quality results for screening, cell signaling assays, proliferation studies, and more.
Millicell HY (High-Yield) Cell Culture FlasksSimplify your cell culture. Obtain robust cell growth for your next big experiment by using
Millicell HY multilayer flasks to save time, incubator space, reagents, and money.
Millicell EZ SLIDESUse the Millicell EZ SLIDE to culture, fix, stain and view your cells all in one device. There’s no need to tediously move
cover slips from your culture dish to a slide. Leave the wells intact to fix and stain and acquire data simply and quickly
with Millicell EZ SLIDES.


Millipore, guava, MILLIPLEX, Upstate, Chemicon, Linco, Millicell, ApopTag, ApopNexin, CpG WIZ, TRAPeze, Stericup, Millex, and Advancing Life Science Together are registered trademarks of Millipore Corporation. The M mark, , FlowCellect, Milli-Mark, QCM, Scepter, MAPmates, ChemiScreen, Ready-to-Assay, MethylQuest, DART, and EpiQuant are trademarks of Millipore Corporation.Calbiochem and StemSelect are registered trademarks of EMD Chemicals Inc.K-LISA and InhibitorSelect are trademarks of EMD Chemicals Inc.Lit. No. PB1095EN00 Rev B Printed in U.S.A. 12/10 LS-SBU-10-03916© 2010 Millipore Corporation, Billerica, MA 01821 U.S.A. All rights reserved.
www.millipore.com
HALLMArkS oF CAnCEr
Self-sufficiency in proliferation signals
Insensitivity to proliferation inhibiting signals
Evading apoptosis
Limitless replicative potential
Sustained angiogenesis
Metabolic reprogramming
Escape from immune control
Tissue invasion and metastasis
ATP
STOPTOP
ATP
STOPTOP
ATP
STOPTOP
ATP
STOPTOP
ATP
STOPTOP
ATP
STOPTOP
ATP
STOPTOP
ATP
STOPTOP
to PLACE An orDEr or rECEIvE tECHnICAL ASSIStAnCE FroM MILLIPorE In the U.S. and Canada, call toll-free 1-800-Millipore (1-800-645-5476)
Visit our website at www.millipore.com.
to PLACE An orDEr or rECEIvE tECHnICAL ASSIStAnCE FroM EMD CHEMICALS In the U.S. and Canada, call toll-free 1-800-854-3417
Visit our website www.emdbiosciences.com.