cancer facts and figures 2016 - health statistics home department of health - cancer facts and...
TRANSCRIPT

Division of Health Informatics
Adams
577
Allegheny8,060
Armstrong
454Beaver1,220
Bedford275
Berks
2,190
Blair807
Bradford
382
Bucks3,694
Butler991
Cambria
993
Cameron
37
Carbon386
Centre
577
Chester
2,580
Clarion204
Clearfield528
Clinton
225Columbia
397
Crawford571
Cumberland
1,074
Dauphin1,342
Delaware3,056
Elk197
Erie1,551
Fayette896
Forest
42
Franklin
730
Fulton
87Greene238
Huntingdon237
Indiana
511
Jefferson
276
Juniata119
Lackawanna
1,388
Lancaster2,578
Lawrence743
Lebanon702
Lehigh1,964
Luzerne
2,033
Lycoming
705
McKean
260
Mercer
783
Mifflin261
Monroe829
Montgomery4,321
Montour136
Northampton
1,757
Northumberland
629
Perry236
Philadelphia7,987
Pike
316
Potter
123
Schuylkill
1,009
Snyder
201
Somerset557
Sullivan
51
Susquehanna268Tioga
264
Union199
Venango373
Warren323
Washington
1,454
Wayne
358
Westmoreland2,340
Wyoming
135
York
2,969
Pennsylvania, 2016
Estimated Number of New Cancer Cases For 2016 By County
State Total: 78,498
CANCER FACTSand FIGURES
INTRODUCTION This publication presents observed and projected cancer incidence and mortality statistics for the Commonwealth of Pennsylvania. By utilizing the data collected by the Pennsylvania Cancer Registry, the Department of Health can develop programs to better address Pennsylvania's Cancer Program needs. Registry data are used to plan and evaluate cancer control measures in areas of risk assessment, prevention, early detection, patient care, public and professional education, and clinical research. Detailed incidence data for Pennsylvania are available to government agencies, as well as educational, planning and research organizations, and concerned private citizens. A Technical Notes section appears at the beginning of this report to emphasize the importance of understanding and appropriately using the data shown. This section explains all steps used in the presentation of the data for this report. If you use any of the statistics presented in this report, we highly recommend that you read the Technical Notes section carefully and thoroughly. The Division of Health Informatics specifically acknowledges the American Cancer Society (ACS). The ACS granted permission to use their annual publication “Cancer Facts and Figures” as a direct reference in the development of this publication. We appreciate their cooperation. The division welcomes comments and suggestions on the content and format of this report. Staff members are available to answer questions regarding the report, including utilization and limitations of the data. Please address all comments, questions, requests for data, etc., to:
Division of Health Informatics Pennsylvania Department of Health
2150 Herr St. Harrisburg, PA 17103
Telephone: 717-782-2448 Cancer incidence data were collected by the Pennsylvania Cancer Registry (PCR) located in the Bureau of Health Statistics and Registries. The PCR is a full participant in the National Program of Cancer Registries (NPCR) of the Centers for Disease Control and Prevention (CDC).
This report and other cancer and health statistics are on the Health Statistics web pages at www.statistics.health.pa.gov.
June 2016
The Pennsylvania Department of Health is an equal opportunity provider of grants, contracts, services and employment. HD0059P

Pennsylvania Department of Health - Cancer Facts and Figures Pennsylvania, 2016 – Page 1
CONTENTS Average Day of Cancer Cases and Deaths ................ 2 Pennsylvania and U.S. Select Mortality Rates ............ 12 Basic Facts about Cancer in Pennsylvania ................ 3 Chart: Mortality Rates by 23 Sites.......................... 13 Incidence Trends: All Cancers by Sex....................... 4 Trends for Top Four Cancer Sites ............................... 14 Mortality Trends: All Cancers by Sex ....................... 5 2016 Projected Cancer Cases by Site and Sex ............. 16 Incidence and Mortality Trends by Race ................... 6 2016 Projected Cancer Deaths by Site and Sex ........... 18 Stage of Disease: All Cancers by Sex........................ 7 2016 Projected Cancer Cases by County ..................... 20 Stage of Disease: All Cancers by Race ...................... 8 2016 Projected Cancer Deaths by County ................... 21 Behavioral Risk Factors ............................................ 9 Cancer Prevention and Control Section Initiatives ...... 22 Pennsylvania and U.S. Select Incidence Rates ........ 10 References ................................................................... 23 Chart: Incidence Rates by 23 Sites ..................... 11
TECHNICAL NOTES
Incidence data: Cancer abstracts collected by the Pennsylvania Cancer Registry are the source for Pennsylvania cancer incidence data shown here. Data from the PCR were used to project the expected number of cancer cases listed in this report. Primary cancer sites follow the definitions used by the National Cancer Institute’s SEER Program and are therefore comparable. Unless noted, in situ cases for sites other than urinary bladder cancer are not included in any calculation or projection contained in this report. Cancer cases were coded using International Classification of Diseases for Oncology – Third Edition (ICD-O-3) and staged according to the “SEER Summary Staging Manual” categories. As of the writing of this report, 2013 is the latest year of available incidence data for the commonwealth.
Mortality data: Pennsylvania's Certificate of Death is the source document for Pennsylvania cancer mortality data. The actual numbers of Pennsylvania cancer deaths reported were used to forecast the expected number of cancer deaths listed in this report. Currently, 2013 is the latest year of available mortality data for the commonwealth.
Incidence and mortality projections: The projections of new cancer cases in this report were obtained by fitting an autoregressive integrated moving average model (ARIMA) to the annual incidence counts from 2000 through 2013. The parameters of the model were selected by a stepwise algorithm to minimize the corrected Akaike information criterion (AICc). Because certain events, such as new screening recommendations, can impact the incidence in a year, the models for certain primary sites included this information in their projections. In this report, the primary sites that included such predictors were female breast and prostate cancers. The projections for all sites were, in turn, used to determine the projection for total cancer cases in the state. This same method was applied to projecting the number of cancer deaths, using data from 2000 to 2013.
Precision of projections: The projected figures should be used cautiously. Considerable variation may occur, particularly with estimates of small numbers. The percentage changes between the most recent data and projections are meant for simple comparisons. To accurately judge trends, the projection should be considered along with multiple observed data years.
Age-adjusted rates (direct method): Age-specific rates for a selected population are applied to a standard population (in this report, the 2000 U.S. standard million population for 19 age groups) in order to calculate what rate would be expected if the selected population had the same age distribution as the standard. The total of these expected events divided by the total of the standard population and multiplied by 100,000 yields the age-adjusted rate per 100,000. It is important to use the same standard population in the computation of each age-adjusted rate to allow comparability. Age-adjusted rates should never be compared with any other type of rate or be used as absolute measurements of vital events. All state population figures used for calculating rates are estimates produced jointly by the U.S. Census Bureau and the Pennsylvania State Data Center of Penn State at Harrisburg.
Data use and limitations: It is highly recommended that any user of the data presented in this report read the information provided in this Technical Notes section carefully and review as many of the cited references as possible. Of primary concern when using forecasted values is the high probability of variation due to unknown (or uncontrollable) factors. This includes the concern of chance variation associated with the small number of events that can occur when using county statistics.
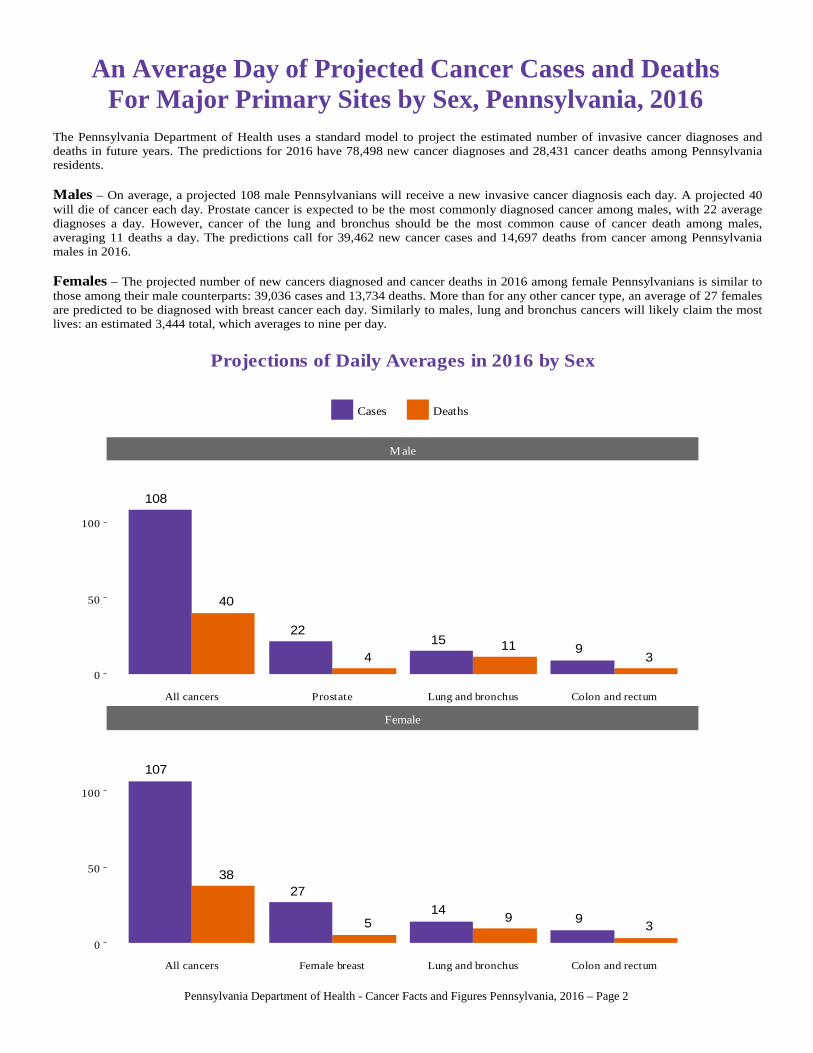
An Average Day of Projected Cancer Cases and DeathsFor Major Primary Sites by Sex, Pennsylvania, 2016
The Pennsylvania Department of Health uses a standard model to project the estimated number of invasive cancer diagnoses anddeaths in future years. The predictions for 2016 have 78,498 new cancer diagnoses and 28,431 cancer deaths among Pennsylvaniaresidents. Males – On average, a projected 108 male Pennsylvanians will receive a new invasive cancer diagnosis each day. A projected 40will die of cancer each day. Prostate cancer is expected to be the most commonly diagnosed cancer among males, with 22 averagediagnoses a day. However, cancer of the lung and bronchus should be the most common cause of cancer death among males,averaging 11 deaths a day. The predictions call for 39,462 new cancer cases and 14,697 deaths from cancer among Pennsylvaniamales in 2016. Females – The projected number of new cancers diagnosed and cancer deaths in 2016 among female Pennsylvanians is similar tothose among their male counterparts: 39,036 cases and 13,734 deaths. More than for any other cancer type, an average of 27 femalesare predicted to be diagnosed with breast cancer each day. Similarly to males, lung and bronchus cancers will likely claim the mostlives: an estimated 3,444 total, which averages to nine per day.
40
108
4
221115
39
38
107
5
27
914
39
Male
Female
0
50
100
0
50
100
All cancers Prostate Lung and bronchus Colon and rectum
All cancers Female breast Lung and bronchus Colon and rectum
Cases Deaths
Projections of Daily Averages in 2016 by Sex
Pennsylvania Department of Health - Cancer Facts and Figures Pennsylvania, 2016 – Page 2
Pennsylvania Department of Health - Cancer Facts and Figures Pennsylvania, 2016 – Page 3
What is cancer? Cancer is a group of diseases related to the
uncontrolled growth and spread of abnormal cells. Death can occur if growth of abnormal cells spreads. If detected early and treated promptly, many cancers
can be cured.
What causes cancer? Tobacco, diet and obesity are believed to be major
contributors of cancer. Other contributors are believed to include sedentary
lifestyle, occupation, family history, viruses/biologic agents, prenatal factors/growth, reproductive factors, alcohol, socioeconomic status, environmental pollution, ionizing/ultraviolet radiation and some drugs/prescription medicines.
How is cancer prevented? Primary prevention includes avoiding oncogenic
exposures (tobacco, sun exposure, excess dietary fat). Secondary prevention includes early detection and
treatment of benign precursor lesions.
How is cancer treated? Surgery, radiation, chemotherapy, hormones and
immunotherapy
Who gets cancer? Cancer strikes all segments of the state’s population. Occurrence of cancer rises with age and exposure to
risk factors.
What are the most common cancers? Invasive incidence in 2013: 1. Female breast: 10,973 2. Lung and bronchus: 10,656 3. Prostate: 7,973 4. Colon and rectum: 6,913 5. Urinary bladder: 4,198*
How many new cancer cases and deaths will there be this year? About 78,498* Pennsylvanians are projected to be
diagnosed with invasive cancer in 2016. There were 77,565* Pennsylvanians diagnosed with
invasive cancer in 2013. About 28,431 Pennsylvanians are projected to die
from cancer in 2016. There were 28,418 Pennsylvanians who died of cancer
in 2013.
* Includes in situ stage for urinary bladder cancer
Are cancer incidence rates increasing in Pennsylvania? Overall, annual age-adjusted cancer rates have increased
from 443.2 per 100,000 in 1990 to 483.0 in 2013.
Are cancer death rates declining in Pennsylvania? In 2013, the age-adjusted cancer death rate of 169.4 per
100,000 was the lowest recorded during 1990-2013. Similarly, cancer death rates among men and women
have declined since 1990, and both had their lowest rates in 2013.
What is a cancer cluster? A cancer cluster is a larger than expected number of
cancer cases during a limited time period in a specific geographic area.
How are cancer clusters investigated? By examining data from cancer registries By comparing the observed number of cancers in a
specific geographic area to the expected number
Where can additional information on cancer be obtained? National statistics and information
– Centers for Disease Control and Prevention www.cdc.gov/cancer
– National Cancer Institute www.cancer.gov – American Cancer Society www.cancer.org – Cancer Care www.cancercare.org – BreastCancer.org – Prostate Cancer Foundation www.pcf.org – Lung Cancer Alliance www.LungCancerAlliance.org – Colon Cancer Alliance www.CCAlliance.org – Skin Cancer Foundation www.skincancer.org – National Ovarian Cancer Coalition www.ovarian.org – American College of Obstetricians and Gynecologists
www.acog.org/patients/faqs/cervical-cancer – American Bladder Cancer Society
www.BladderCancerSupport.org State and local statistics and information
– Pennsylvania Department of Health: Health Statistics
www.statistics.health.pa.gov Cancer Prevention/Control Section
www.health.state.pa.us/cancer 717-787-5251
– Your local American Cancer Society – Your local department of health – Your local American Lung Association
BASIC FACTS ABOUT CANCER IN PENNSYLVANIA
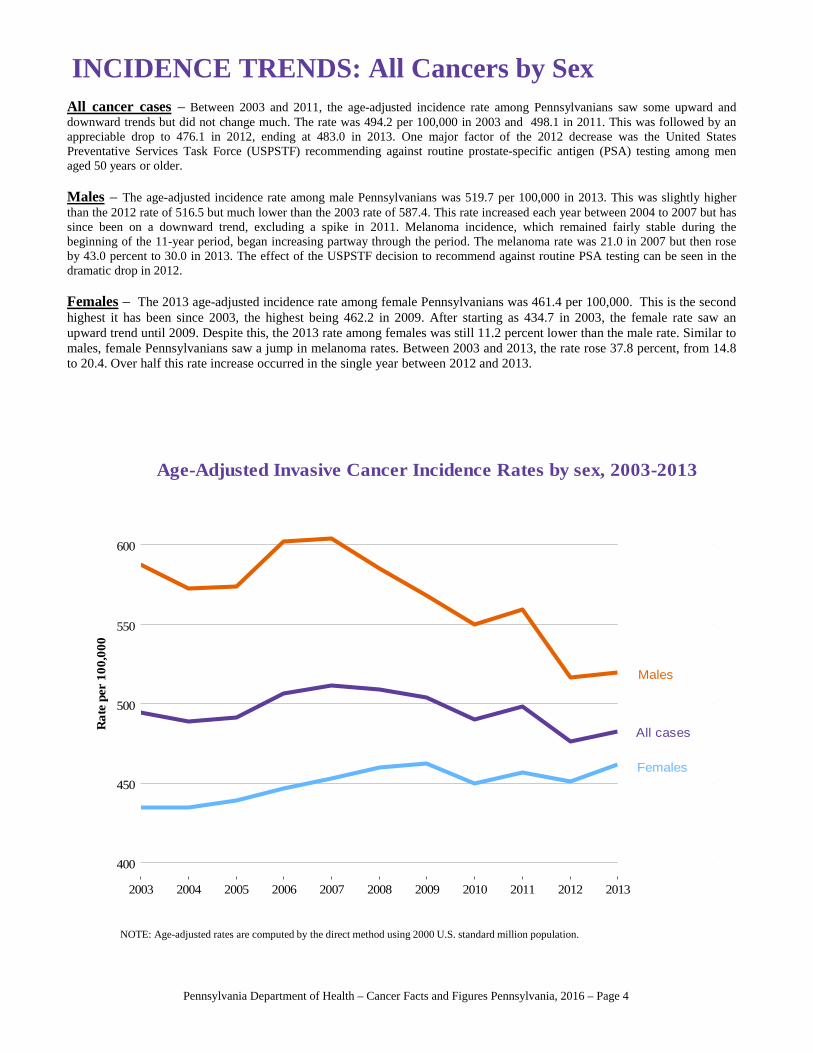
INCIDENCE TRENDS: All Cancers by SexAll cancer cases – Between 2003 and 2011, the age-adjusted incidence rate among Pennsylvanians saw some upward anddownward trends but did not change much. The rate was 494.2 per 100,000 in 2003 and 498.1 in 2011. This was followed by anappreciable drop to 476.1 in 2012, ending at 483.0 in 2013. One major factor of the 2012 decrease was the United StatesPreventative Services Task Force (USPSTF) recommending against routine prostate-specific antigen (PSA) testing among menaged 50 years or older.
Males – The age-adjusted incidence rate among male Pennsylvanians was 519.7 per 100,000 in 2013. This was slightly higherthan the 2012 rate of 516.5 but much lower than the 2003 rate of 587.4. This rate increased each year between 2004 to 2007 but hassince been on a downward trend, excluding a spike in 2011. Melanoma incidence, which remained fairly stable during thebeginning of the 11-year period, began increasing partway through the period. The melanoma rate was 21.0 in 2007 but then roseby 43.0 percent to 30.0 in 2013. The effect of the USPSTF decision to recommend against routine PSA testing can be seen in thedramatic drop in 2012.
Females – The 2013 age-adjusted incidence rate among female Pennsylvanians was 461.4 per 100,000. This is the secondhighest it has been since 2003, the highest being 462.2 in 2009. After starting as 434.7 in 2003, the female rate saw anupward trend until 2009. Despite this, the 2013 rate among females was still 11.2 percent lower than the male rate. Similar tomales, female Pennsylvanians saw a jump in melanoma rates. Between 2003 and 2013, the rate rose 37.8 percent, from 14.8to 20.4. Over half this rate increase occurred in the single year between 2012 and 2013.
NOTE: Age-adjusted rates are computed by the direct method using 2000 U.S. standard million population.
Females
Males
All cases
400
450
500
550
600
2003 2004 2005 2006 2007 2008 2009 2010 2011 2012 2013
Rat
e pe
r 10
0,00
0
Age-Adjusted Invasive Cancer Incidence Rates by sex, 2003-2013
Pennsylvania Department of Health – Cancer Facts and Figures Pennsylvania, 2016 – Page 4
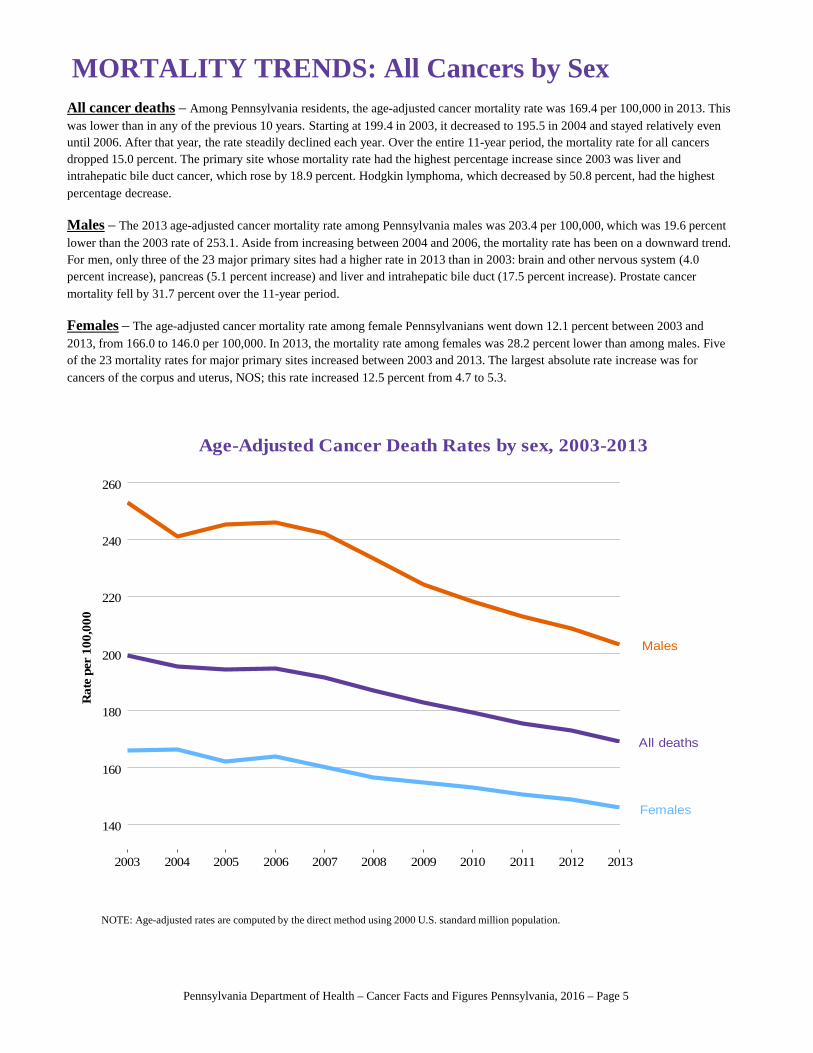
MORTALITY TRENDS: All Cancers by SexAll cancer deaths – Among Pennsylvania residents, the age-adjusted cancer mortality rate was 169.4 per 100,000 in 2013. This was lower than in any of the previous 10 years. Starting at 199.4 in 2003, it decreased to 195.5 in 2004 and stayed relatively even until 2006. After that year, the rate steadily declined each year. Over the entire 11-year period, the mortality rate for all cancers dropped 15.0 percent. The primary site whose mortality rate had the highest percentage increase since 2003 was liver and intrahepatic bile duct cancer, which rose by 18.9 percent. Hodgkin lymphoma, which decreased by 50.8 percent, had the highestpercentage decrease.
Males – The 2013 age-adjusted cancer mortality rate among Pennsylvania males was 203.4 per 100,000, which was 19.6 percent lower than the 2003 rate of 253.1. Aside from increasing between 2004 and 2006, the mortality rate has been on a downward trend.For men, only three of the 23 major primary sites had a higher rate in 2013 than in 2003: brain and other nervous system (4.0percent increase), pancreas (5.1 percent increase) and liver and intrahepatic bile duct (17.5 percent increase). Prostate cancermortality fell by 31.7 percent over the 11-year period.
Females – The age-adjusted cancer mortality rate among female Pennsylvanians went down 12.1 percent between 2003 and 2013, from 166.0 to 146.0 per 100,000. In 2013, the mortality rate among females was 28.2 percent lower than among males. Five of the 23 mortality rates for major primary sites increased between 2003 and 2013. The largest absolute rate increase was forcancers of the corpus and uterus, NOS; this rate increased 12.5 percent from 4.7 to 5.3.
NOTE: Age-adjusted rates are computed by the direct method using 2000 U.S. standard million population.
Females
Males
All deaths
140
160
180
200
220
240
260
2003 2004 2005 2006 2007 2008 2009 2010 2011 2012 2013
Rat
e pe
r 10
0,00
0
Age-Adjusted Cancer Death Rates by sex, 2003-2013
Pennsylvania Department of Health – Cancer Facts and Figures Pennsylvania, 2016 – Page 5
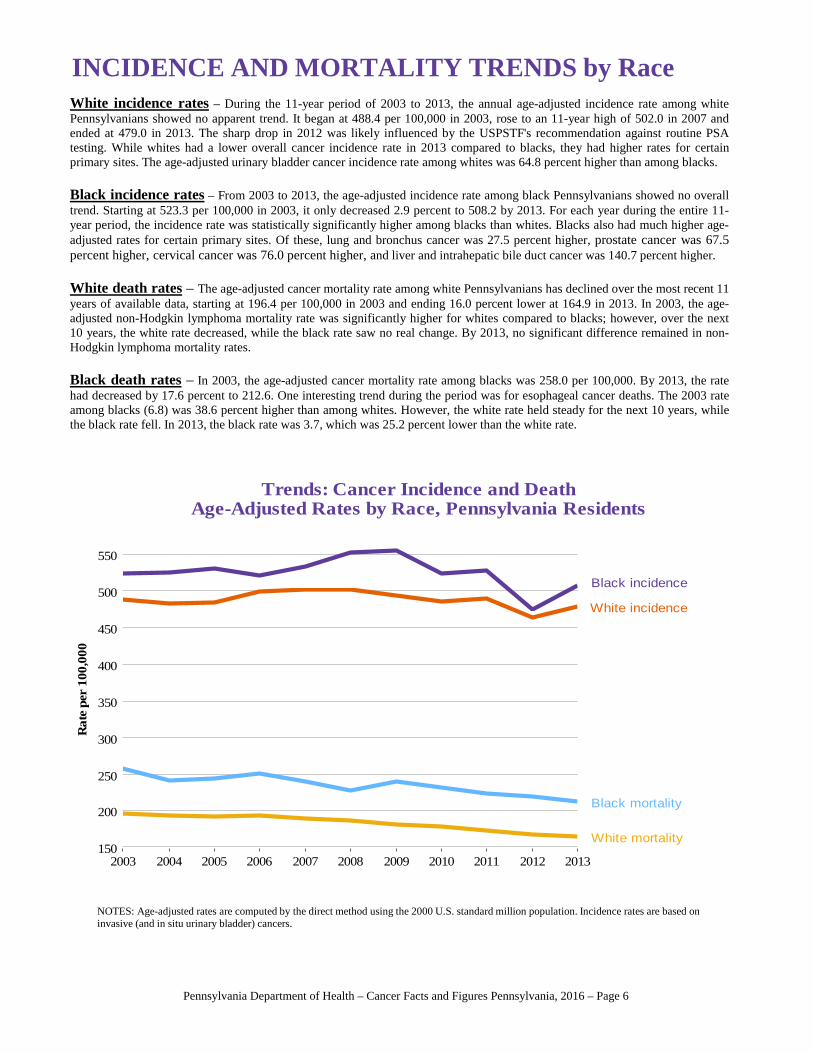
INCIDENCE AND MORTALITY TRENDS by RaceWhite incidence rates – During the 11-year period of 2003 to 2013, the annual age-adjusted incidence rate among whitePennsylvanians showed no apparent trend. It began at 488.4 per 100,000 in 2003, rose to an 11-year high of 502.0 in 2007 andended at 479.0 in 2013. The sharp drop in 2012 was likely influenced by the USPSTF's recommendation against routine PSAtesting. While whites had a lower overall cancer incidence rate in 2013 compared to blacks, they had higher rates for certainprimary sites. The age-adjusted urinary bladder cancer incidence rate among whites was 64.8 percent higher than among blacks.
Black incidence rates – From 2003 to 2013, the age-adjusted incidence rate among black Pennsylvanians showed no overalltrend. Starting at 523.3 per 100,000 in 2003, it only decreased 2.9 percent to 508.2 by 2013. For each year during the entire 11-year period, the incidence rate was statistically significantly higher among blacks than whites. Blacks also had much higher age-adjusted rates for certain primary sites. Of these, lung and bronchus cancer was 27.5 percent higher, prostate cancer was 67.5percent higher, cervical cancer was 76.0 percent higher, and liver and intrahepatic bile duct cancer was 140.7 percent higher.
White death rates – The age-adjusted cancer mortality rate among white Pennsylvanians has declined over the most recent 11years of available data, starting at 196.4 per 100,000 in 2003 and ending 16.0 percent lower at 164.9 in 2013. In 2003, the age-adjusted non-Hodgkin lymphoma mortality rate was significantly higher for whites compared to blacks; however, over the next10 years, the white rate decreased, while the black rate saw no real change. By 2013, no significant difference remained in non-Hodgkin lymphoma mortality rates.
Black death rates – In 2003, the age-adjusted cancer mortality rate among blacks was 258.0 per 100,000. By 2013, the ratehad decreased by 17.6 percent to 212.6. One interesting trend during the period was for esophageal cancer deaths. The 2003 rateamong blacks (6.8) was 38.6 percent higher than among whites. However, the white rate held steady for the next 10 years, whilethe black rate fell. In 2013, the black rate was 3.7, which was 25.2 percent lower than the white rate.
NOTES: Age-adjusted rates are computed by the direct method using the 2000 U.S. standard million population. Incidence rates are based on invasive (and in situ urinary bladder) cancers.
Black incidence
White incidence
Black mortality
White mortality150
200
250
300
350
400
450
500
550
2003 2004 2005 2006 2007 2008 2009 2010 2011 2012 2013
Rat
e pe
r 10
0,00
0
Trends: Cancer Incidence and DeathAge-Adjusted Rates by Race, Pennsylvania Residents
Pennsylvania Department of Health – Cancer Facts and Figures Pennsylvania, 2016 – Page 6
10.0%13.0%
39.0%41.1%
18.0%19.9%
25.1%
19.9%
7.9%6.1%
0%
10%
20%
30%
40%
In situ Localized Regional Distant Unstaged
Male
Female
Males and Females: Percentage of Cancer Cases by Stage, 2013
9.1%11.6%
41.0% 40.1%
19.9% 19.0% 19.6%22.4%
10.4%6.9%
0%
10%
20%
30%
40%
In situ Localized Regional Distant Unstaged
2003
2013
2003 and 2013: Percentage of Cancer Cases by Stage
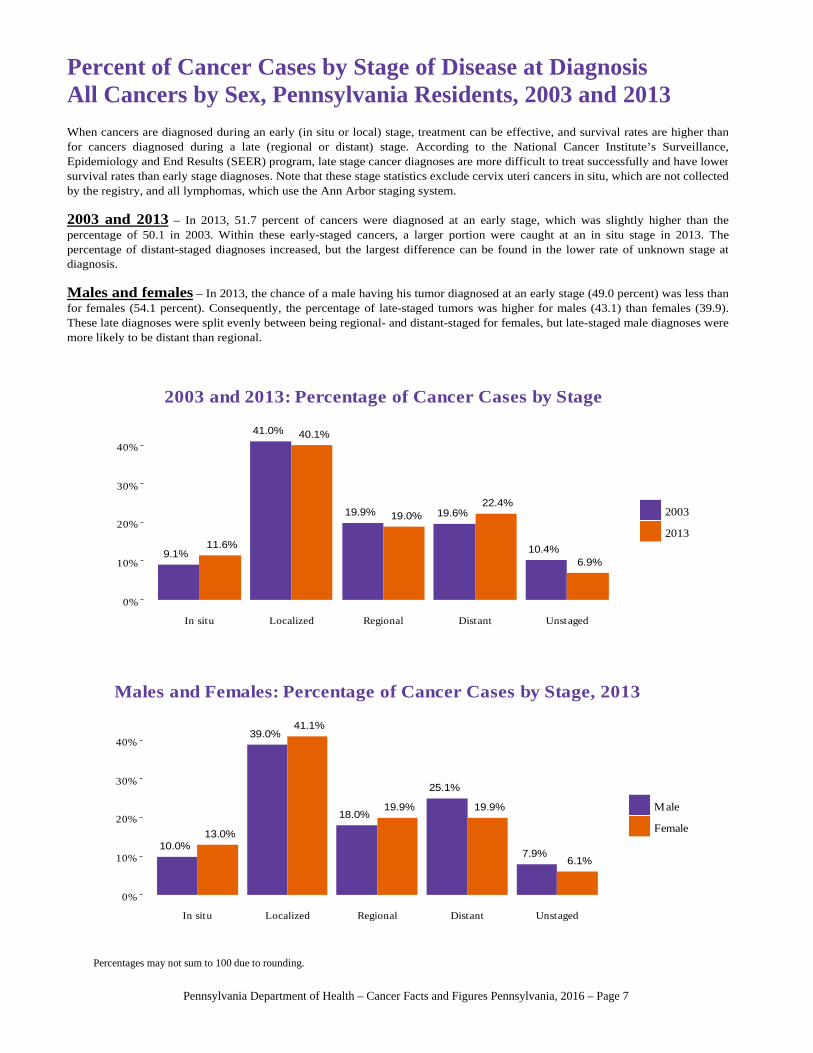
Percent of Cancer Cases by Stage of Disease at DiagnosisAll Cancers by Sex, Pennsylvania Residents, 2003 and 2013
When cancers are diagnosed during an early (in situ or local) stage, treatment can be effective, and survival rates are higher than for cancers diagnosed during a late (regional or distant) stage. According to the National Cancer Institute’s Surveillance,Epidemiology and End Results (SEER) program, late stage cancer diagnoses are more difficult to treat successfully and have lower survival rates than early stage diagnoses. Note that these stage statistics exclude cervix uteri cancers in situ, which are not collected by the registry, and all lymphomas, which use the Ann Arbor staging system. 2003 and 2013 – In 2013, 51.7 percent of cancers were diagnosed at an early stage, which was slightly higher than the percentage of 50.1 in 2003. Within these early-staged cancers, a larger portion were caught at an in situ stage in 2013. The percentage of distant-staged diagnoses increased, but the largest difference can be found in the lower rate of unknown stage at diagnosis. Males and females – In 2013, the chance of a male having his tumor diagnosed at an early stage (49.0 percent) was less thanfor females (54.1 percent). Consequently, the percentage of late-staged tumors was higher for males (43.1) than females (39.9).These late diagnoses were split evenly between being regional- and distant-staged for females, but late-staged male diagnoses were more likely to be distant than regional.
Percentages may not sum to 100 due to rounding.
Pennsylvania Department of Health – Cancer Facts and Figures Pennsylvania, 2016 – Page 7
10.8%8.7%
40.9% 39.7%
19.4% 19.8%22.6%
25.4%
6.3% 6.5%
0%
10%
20%
30%
40%
In situ Localized Regional Distant Unstaged
White
Black
Whites and Blacks: Percentage of Cancer Cases by Stage, 2013
7.0%8.7%
37.9%39.7%
20.5% 19.8%22.7%
25.4%
11.9%
6.5%
0%
10%
20%
30%
40%
In situ Localized Regional Distant Unstaged
2003
2013
Blacks: Percentage of Cancer Cases by Stage, 2003 and 2013
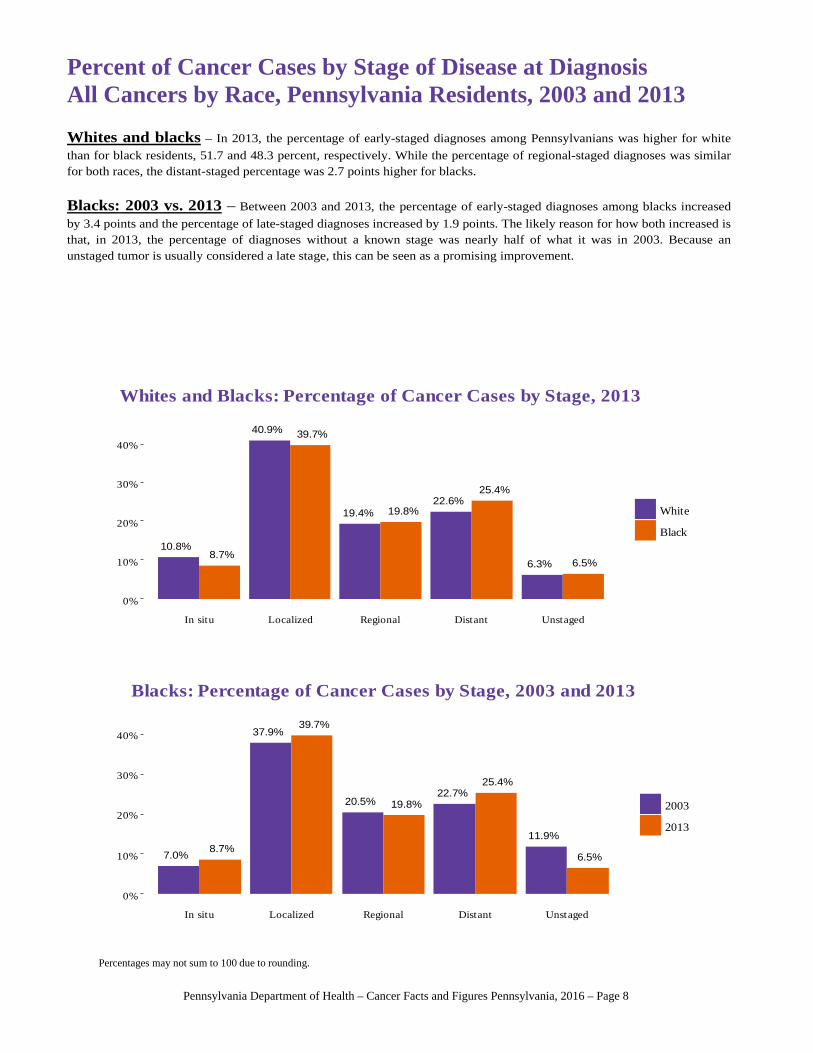
Percent of Cancer Cases by Stage of Disease at DiagnosisAll Cancers by Race, Pennsylvania Residents, 2003 and 2013
Whites and blacks – In 2013, the percentage of early-staged diagnoses among Pennsylvanians was higher for white
than for black residents, 51.7 and 48.3 percent, respectively. While the percentage of regional-staged diagnoses was similar for both races, the distant-staged percentage was 2.7 points higher for blacks.
Blacks: 2003 vs. 2013 – Between 2003 and 2013, the percentage of early-staged diagnoses among blacks increased
by 3.4 points and the percentage of late-staged diagnoses increased by 1.9 points. The likely reason for how both increased isthat, in 2013, the percentage of diagnoses without a known stage was nearly half of what it was in 2003. Because an unstaged tumor is usually considered a late stage, this can be seen as a promising improvement.
Percentages may not sum to 100 due to rounding.
Pennsylvania Department of Health – Cancer Facts and Figures Pennsylvania, 2016 – Page 8
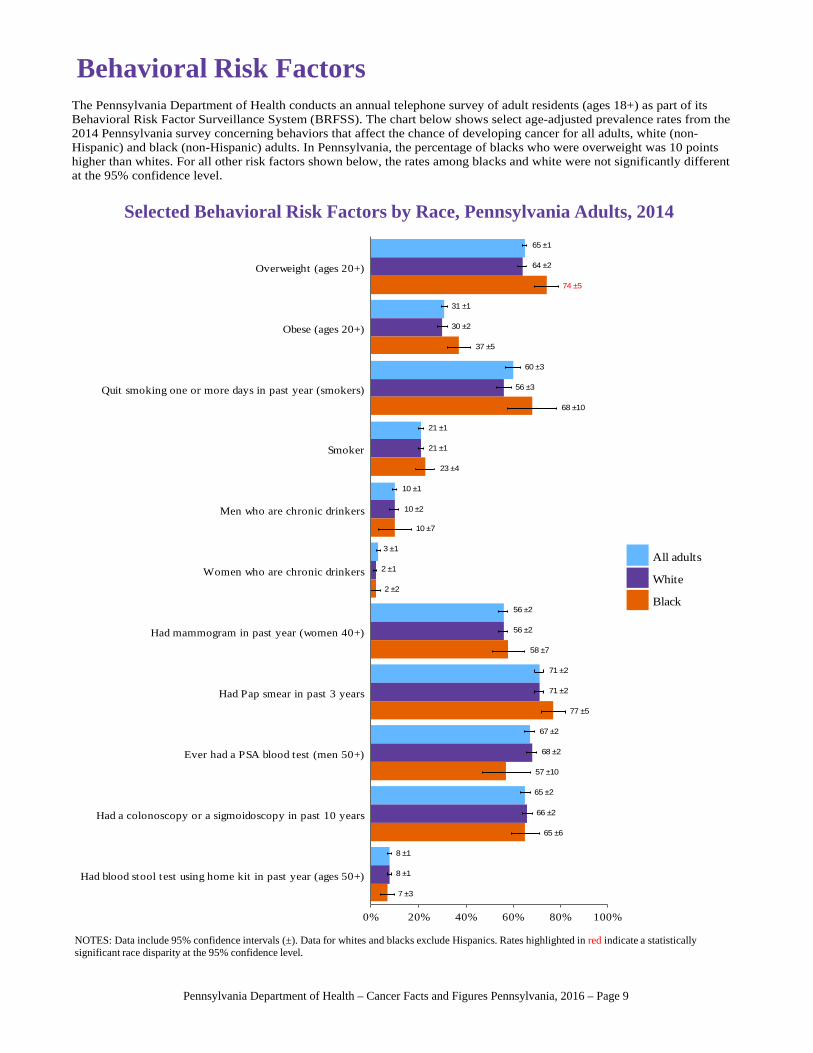
Behavioral Risk Factors
NOTES: Data include 95% confidence intervals (±). Data for whites and blacks exclude Hispanics. Rates highlighted in red indicate a statistically significant race disparity at the 95% confidence level.
The Pennsylvania Department of Health conducts an annual telephone survey of adult residents (ages 18+) as part of its Behavioral Risk Factor Surveillance System (BRFSS). The chart below shows select age-adjusted prevalence rates from the 2014 Pennsylvania survey concerning behaviors that affect the chance of developing cancer for all adults, white (non-Hispanic) and black (non-Hispanic) adults. In Pennsylvania, the percentage of blacks who were overweight was 10 points higher than whites. For all other risk factors shown below, the rates among blacks and white were not significantly differentat the 95% confidence level.
8 ±1
8 ±1
7 ±3
65 ±2
66 ±2
65 ±6
67 ±2
68 ±2
57 ±10
71 ±2
71 ±2
77 ±5
56 ±2
56 ±2
58 ±7
3 ±1
2 ±1
2 ±2
10 ±1
10 ±2
10 ±7
21 ±1
21 ±1
23 ±4
60 ±3
56 ±3
68 ±10
31 ±1
30 ±2
37 ±5
65 ±1
64 ±2
74 ±5
Had blood stool test using home kit in past year (ages 50+)
Had a colonoscopy or a sigmoidoscopy in past 10 years
Ever had a PSA blood test (men 50+)
Had Pap smear in past 3 years
Had mammogram in past year (women 40+)
Women who are chronic drinkers
Men who are chronic drinkers
Smoker
Quit smoking one or more days in past year (smokers)
Obese (ages 20+)
Overweight (ages 20+)
0% 20% 40% 60% 80% 100%
All adults
White
Black
Selected Behavioral Risk Factors by Race, Pennsylvania Adults, 2014
Pennsylvania Department of Health – Cancer Facts and Figures Pennsylvania, 2016 – Page 9
All Cancers Colon and Rectum
Lung and Bronchus Female Breast
Prostate Urinary Bladder
440
460
480
500
40
45
50
55
55
60
65
70
123
126
129
100
120
140
160
20
22
24
2003 04 05 06 07 08 09 10 11 12
2013
2003 04 05 06 07 08 09 10 11 12
2013
2003 04 05 06 07 08 09 10 11 12
2013
2003 04 05 06 07 08 09 10 11 12
2013
2003 04 05 06 07 08 09 10 11 12
2013
2003 04 05 06 07 08 09 10 11 12
2013
Pa.
U.S.
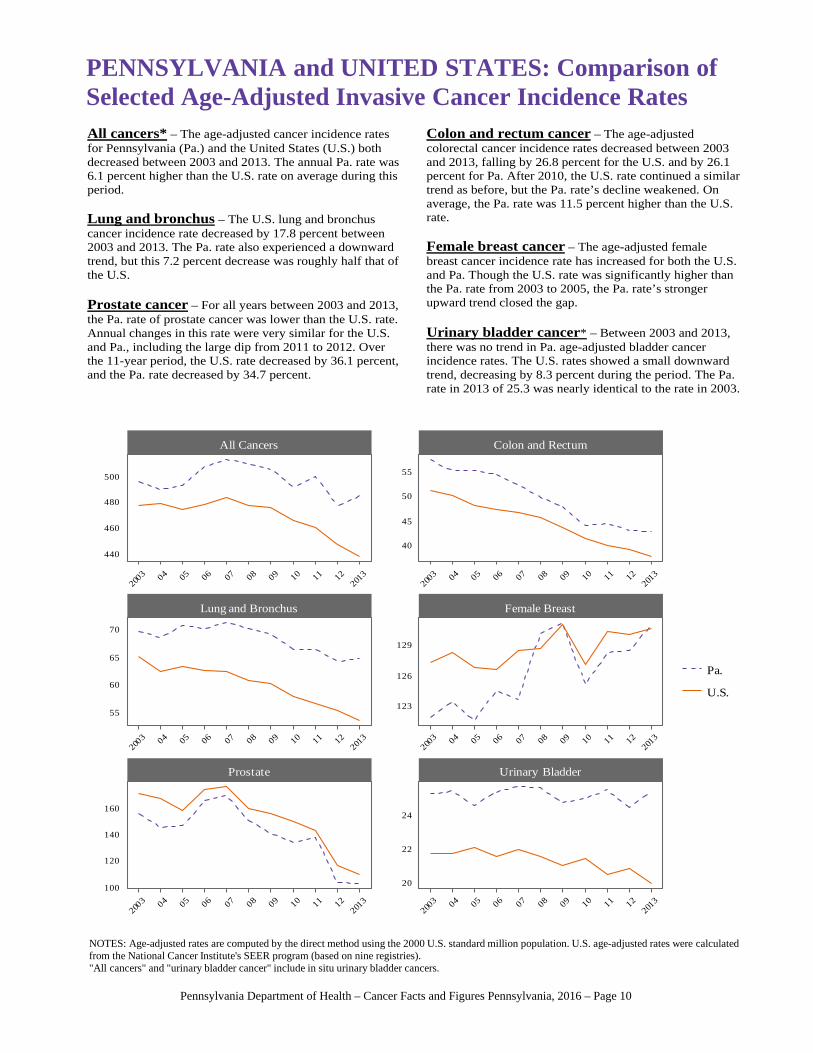
All cancers* – The age-adjusted cancer incidence rates for Pennsylvania (Pa.) and the United States (U.S.) both decreased between 2003 and 2013. The annual Pa. rate was 6.1 percent higher than the U.S. rate on average during this period. Lung and bronchus – The U.S. lung and bronchus cancer incidence rate decreased by 17.8 percent between 2003 and 2013. The Pa. rate also experienced a downward trend, but this 7.2 percent decrease was roughly half that of the U.S. Prostate cancer – For all years between 2003 and 2013, the Pa. rate of prostate cancer was lower than the U.S. rate. Annual changes in this rate were very similar for the U.S. and Pa., including the large dip from 2011 to 2012. Over the 11-year period, the U.S. rate decreased by 36.1 percent, and the Pa. rate decreased by 34.7 percent.
Colon and rectum cancer – The age-adjusted colorectal cancer incidence rates decreased between 2003 and 2013, falling by 26.8 percent for the U.S. and by 26.1 percent for Pa. After 2010, the U.S. rate continued a similar trend as before, but the Pa. rate’s decline weakened. On average, the Pa. rate was 11.5 percent higher than the U.S. rate. Female breast cancer – The age-adjusted female breast cancer incidence rate has increased for both the U.S. and Pa. Though the U.S. rate was significantly higher than the Pa. rate from 2003 to 2005, the Pa. rate’s stronger upward trend closed the gap. Urinary bladder cancer* – Between 2003 and 2013, there was no trend in Pa. age-adjusted bladder cancer incidence rates. The U.S. rates showed a small downward trend, decreasing by 8.3 percent during the period. The Pa. rate in 2013 of 25.3 was nearly identical to the rate in 2003.
PENNSYLVANIA and UNITED STATES: Comparison ofSelected Age-Adjusted Invasive Cancer Incidence Rates
NOTES: Age-adjusted rates are computed by the direct method using the 2000 U.S. standard million population. U.S. age-adjusted rates were calculated from the National Cancer Institute's SEER program (based on nine registries)."All cancers" and "urinary bladder cancer" include in situ urinary bladder cancers.
Pennsylvania Department of Health – Cancer Facts and Figures Pennsylvania, 2016 – Page 10
Pa. 3.1U.S. 2.7
Pa. 3.7U.S. 2.8
Pa. 5.2U.S. 4.3
Pa. 6.1U.S. 6.7
Pa. 6.4U.S. 6.0
Pa. 6.4U.S. 6.8
Pa. 7.1U.S. 6.4
Pa. 7.3U.S. 6.4
Pa. 7.9U.S. 8.4
Pa. 11.7U.S. 11.4
Pa. 11.9U.S. 11.4
Pa. 13.4U.S. 12.7
Pa. 13.7U.S. 13.8
Pa. 17.3U.S. 15.3
Pa. 20.8U.S. 19.5
Pa. 20.8U.S. 15.1
Pa. 24.3U.S. 24.0
Pa. 25.3U.S. 19.8
Pa. 32.7U.S. 26.9
Pa. 42.3U.S. 37.2
Pa. 64.3U.S. 53.2
Pa. 101.2U.S. 108.6
Pa. 130.8U.S. 130.4
Hodgkin lymphoma
Larynx
Esophagus
Stomach
Testis
Myeloma
Cervix uteri
Brain and other nervous system
Liver and intrahepatic bile duct
Ovary
Oral cavity and pharynx
Pancreas
Leukemia
Kidney and renal pelvis
Non-Hodgkin lymphoma
Thyroid
Melanoma of the skin
Urinary bladder
Corpus and uterus, NOS
Colon and rectum
Lung and bronchus
Prostate
Female breast
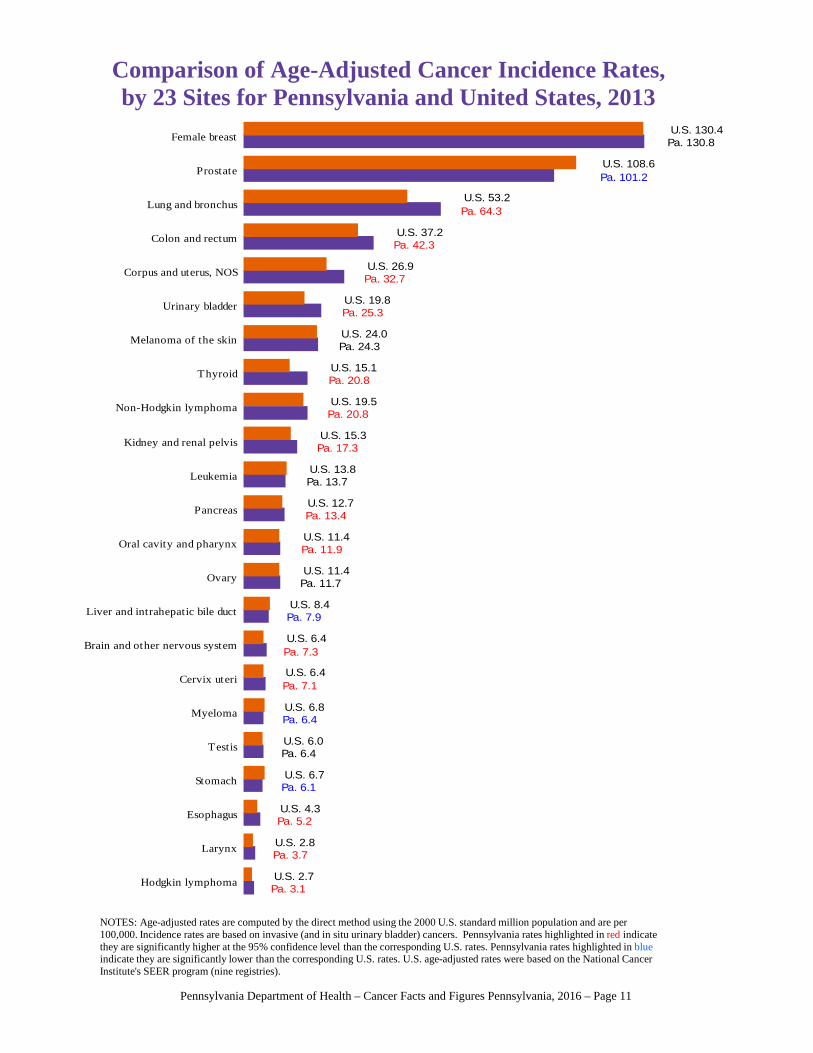
NOTES: Age-adjusted rates are computed by the direct method using the 2000 U.S. standard million population and are per 100,000. Incidence rates are based on invasive (and in situ urinary bladder) cancers. Pennsylvania rates highlighted in red indicate they are significantly higher at the 95% confidence level than the corresponding U.S. rates. Pennsylvania rates highlighted in blueindicate they are significantly lower than the corresponding U.S. rates. U.S. age-adjusted rates were based on the National Cancer Institute's SEER program (nine registries).
Comparison of Age-Adjusted Cancer Incidence Rates,by 23 Sites for Pennsylvania and United States, 2013
Pennsylvania Department of Health – Cancer Facts and Figures Pennsylvania, 2016 – Page 11
All Cancers Colon and Rectum
Lung and Bronchus Female Breast
Prostate Urinary Bladder
170
180
190
200
16
18
20
45.0
47.5
50.0
52.5
22
24
26
21
24
27
4.50
4.75
5.00
2003 04 05 06 07 08 09 10 11 12
2013
2003 04 05 06 07 08 09 10 11 12
2013
2003 04 05 06 07 08 09 10 11 12
2013
2003 04 05 06 07 08 09 10 11 12
2013
2003 04 05 06 07 08 09 10 11 12
2013
2003 04 05 06 07 08 09 10 11 12
2013
Pa.
U.S.
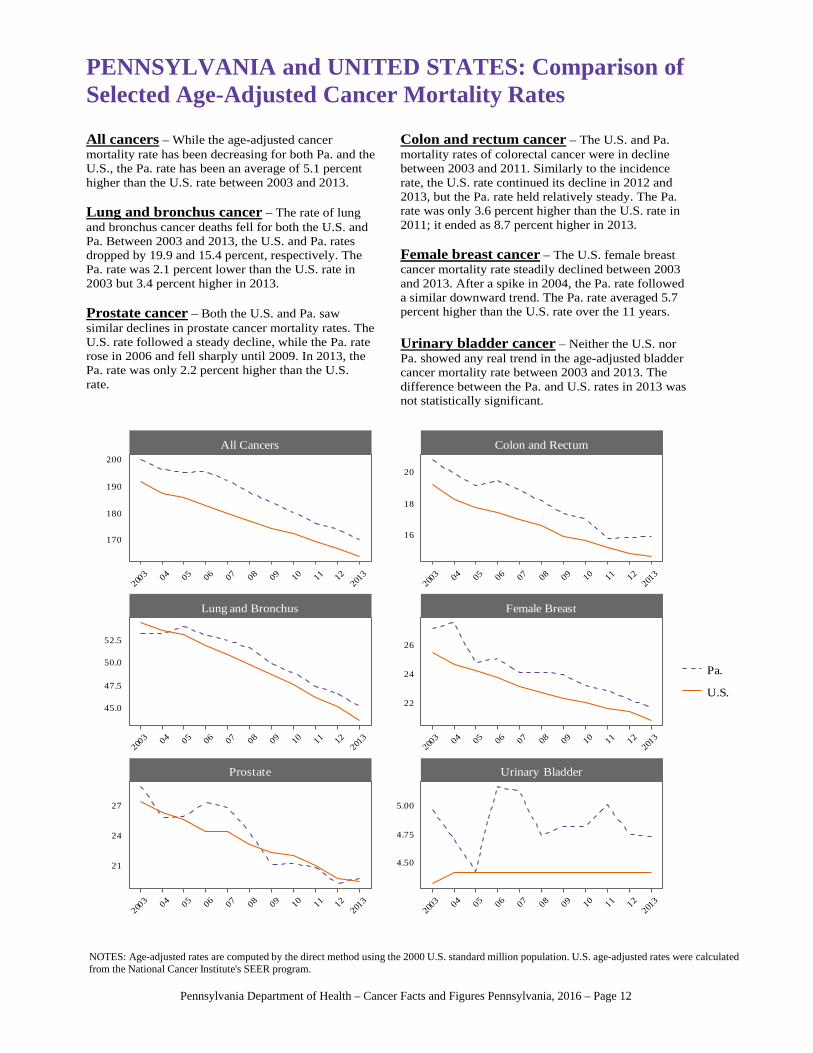
All cancers – While the age-adjusted cancer mortality rate has been decreasing for both Pa. and the U.S., the Pa. rate has been an average of 5.1 percent higher than the U.S. rate between 2003 and 2013. Lung and bronchus cancer – The rate of lung and bronchus cancer deaths fell for both the U.S. and Pa. Between 2003 and 2013, the U.S. and Pa. rates dropped by 19.9 and 15.4 percent, respectively. The Pa. rate was 2.1 percent lower than the U.S. rate in 2003 but 3.4 percent higher in 2013. Prostate cancer – Both the U.S. and Pa. saw similar declines in prostate cancer mortality rates. The U.S. rate followed a steady decline, while the Pa. rate rose in 2006 and fell sharply until 2009. In 2013, the Pa. rate was only 2.2 percent higher than the U.S. rate.
Colon and rectum cancer – The U.S. and Pa. mortality rates of colorectal cancer were in decline between 2003 and 2011. Similarly to the incidence rate, the U.S. rate continued its decline in 2012 and 2013, but the Pa. rate held relatively steady. The Pa. rate was only 3.6 percent higher than the U.S. rate in 2011; it ended as 8.7 percent higher in 2013. Female breast cancer – The U.S. female breast cancer mortality rate steadily declined between 2003 and 2013. After a spike in 2004, the Pa. rate followed a similar downward trend. The Pa. rate averaged 5.7 percent higher than the U.S. rate over the 11 years. Urinary bladder cancer – Neither the U.S. nor Pa. showed any real trend in the age-adjusted bladder cancer mortality rate between 2003 and 2013. The difference between the Pa. and U.S. rates in 2013 was not statistically significant.
PENNSYLVANIA and UNITED STATES: Comparison ofSelected Age-Adjusted Cancer Mortality Rates
NOTES: Age-adjusted rates are computed by the direct method using the 2000 U.S. standard million population. U.S. age-adjusted rates were calculated from the National Cancer Institute's SEER program.
Pennsylvania Department of Health – Cancer Facts and Figures Pennsylvania, 2016 – Page 12
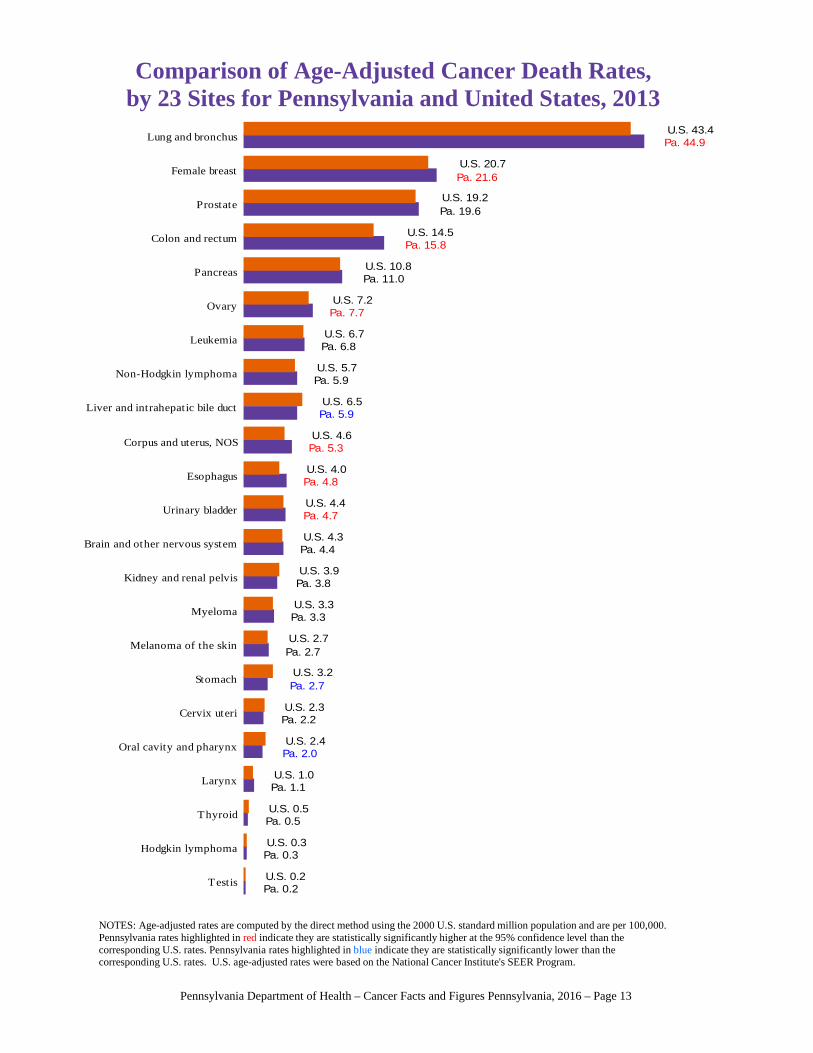
Pa. 0.2U.S. 0.2
Pa. 0.3U.S. 0.3
Pa. 0.5U.S. 0.5
Pa. 1.1U.S. 1.0
Pa. 2.0U.S. 2.4
Pa. 2.2U.S. 2.3
Pa. 2.7U.S. 3.2
Pa. 2.7U.S. 2.7
Pa. 3.3U.S. 3.3
Pa. 3.8U.S. 3.9
Pa. 4.4U.S. 4.3
Pa. 4.7U.S. 4.4
Pa. 4.8U.S. 4.0
Pa. 5.3U.S. 4.6
Pa. 5.9U.S. 6.5
Pa. 5.9U.S. 5.7
Pa. 6.8U.S. 6.7
Pa. 7.7U.S. 7.2
Pa. 11.0U.S. 10.8
Pa. 15.8U.S. 14.5
Pa. 19.6U.S. 19.2
Pa. 21.6U.S. 20.7
Pa. 44.9U.S. 43.4
Testis
Hodgkin lymphoma
Thyroid
Larynx
Oral cavity and pharynx
Cervix uteri
Stomach
Melanoma of the skin
Myeloma
Kidney and renal pelvis
Brain and other nervous system
Urinary bladder
Esophagus
Corpus and uterus, NOS
Liver and intrahepatic bile duct
Non-Hodgkin lymphoma
Leukemia
Ovary
Pancreas
Colon and rectum
Prostate
Female breast
Lung and bronchus
NOTES: Age-adjusted rates are computed by the direct method using the 2000 U.S. standard million population and are per 100,000.Pennsylvania rates highlighted in red indicate they are statistically significantly higher at the 95% confidence level than the corresponding U.S. rates. Pennsylvania rates highlighted in blue indicate they are statistically significantly lower than the corresponding U.S. rates. U.S. age-adjusted rates were based on the National Cancer Institute's SEER Program.
Comparison of Age-Adjusted Cancer Death Rates,by 23 Sites for Pennsylvania and United States, 2013
Pennsylvania Department of Health – Cancer Facts and Figures Pennsylvania, 2016 – Page 13
Pennsylvania Department of Health – Cancer Facts and Figures Pennsylvania, 2016 – Page 14
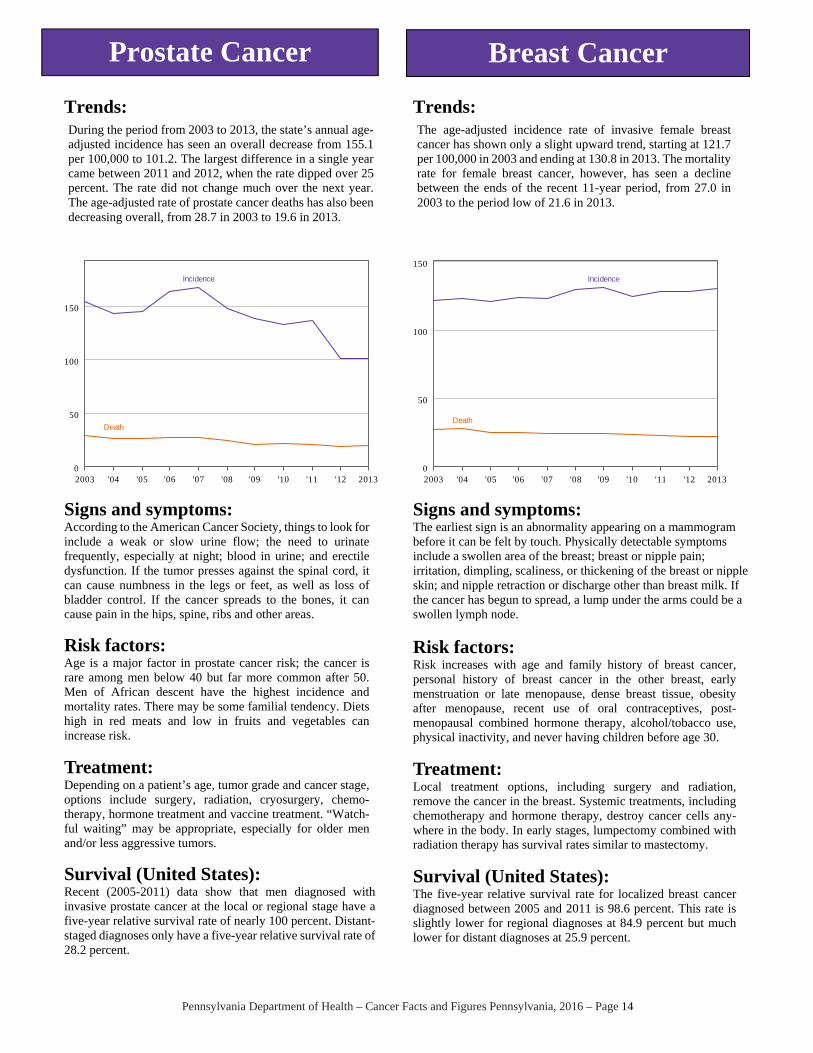
Prostate Cancer Breast Cancer
Trends:
Signs and symptoms: According to the American Cancer Society, things to look for include a weak or slow urine flow; the need to urinate frequently, especially at night; blood in urine; and erectile dysfunction. If the tumor presses against the spinal cord, it can cause numbness in the legs or feet, as well as loss of bladder control. If the cancer spreads to the bones, it can cause pain in the hips, spine, ribs and other areas.
Risk factors: Age is a major factor in prostate cancer risk; the cancer is rare among men below 40 but far more common after 50. Men of African descent have the highest incidence and mortality rates. There may be some familial tendency. Diets high in red meats and low in fruits and vegetables can increase risk.
Treatment: Depending on a patient’s age, tumor grade and cancer stage, options include surgery, radiation, cryosurgery, chemo-therapy, hormone treatment and vaccine treatment. “Watch-ful waiting” may be appropriate, especially for older men and/or less aggressive tumors.
Survival (United States): Recent (2005-2011) data show that men diagnosed with invasive prostate cancer at the local or regional stage have a five-year relative survival rate of nearly 100 percent. Distant-staged diagnoses only have a five-year relative survival rate of 28.2 percent.
Trends:
Signs and symptoms: The earliest sign is an abnormality appearing on a mammogram before it can be felt by touch. Physically detectable symptoms include a swollen area of the breast; breast or nipple pain; irritation, dimpling, scaliness, or thickening of the breast or nipple skin; and nipple retraction or discharge other than breast milk. If the cancer has begun to spread, a lump under the arms could be a swollen lymph node.
Risk factors: Risk increases with age and family history of breast cancer, personal history of breast cancer in the other breast, early menstruation or late menopause, dense breast tissue, obesity after menopause, recent use of oral contraceptives, post-menopausal combined hormone therapy, alcohol/tobacco use, physical inactivity, and never having children before age 30.
Treatment: Local treatment options, including surgery and radiation, remove the cancer in the breast. Systemic treatments, including chemotherapy and hormone therapy, destroy cancer cells any-where in the body. In early stages, lumpectomy combined with radiation therapy has survival rates similar to mastectomy.
Survival (United States): The five-year relative survival rate for localized breast cancer diagnosed between 2005 and 2011 is 98.6 percent. This rate is slightly lower for regional diagnoses at 84.9 percent but much lower for distant diagnoses at 25.9 percent.
Incidence
Death
0
50
100
150
2003 '04 '05 '06 '07 '08 '09 '10 '11 '12 2013
Incidence
Death
0
50
100
150
2003 '04 '05 '06 '07 '08 '09 '10 '11 '12 2013
During the period from 2003 to 2013, the state’s annual age-adjusted incidence has seen an overall decrease from 155.1 per 100,000 to 101.2. The largest difference in a single year came between 2011 and 2012, when the rate dipped over 25 percent. The rate did not change much over the next year. The age-adjusted rate of prostate cancer deaths has also been decreasing overall, from 28.7 in 2003 to 19.6 in 2013.
The age-adjusted incidence rate of invasive female breast cancer has shown only a slight upward trend, starting at 121.7 per 100,000 in 2003 and ending at 130.8 in 2013. The mortality rate for female breast cancer, however, has seen a decline between the ends of the recent 11-year period, from 27.0 in 2003 to the period low of 21.6 in 2013.
Pennsylvania Department of Health – Cancer Facts and Figures Pennsylvania, 2016 – Page 15
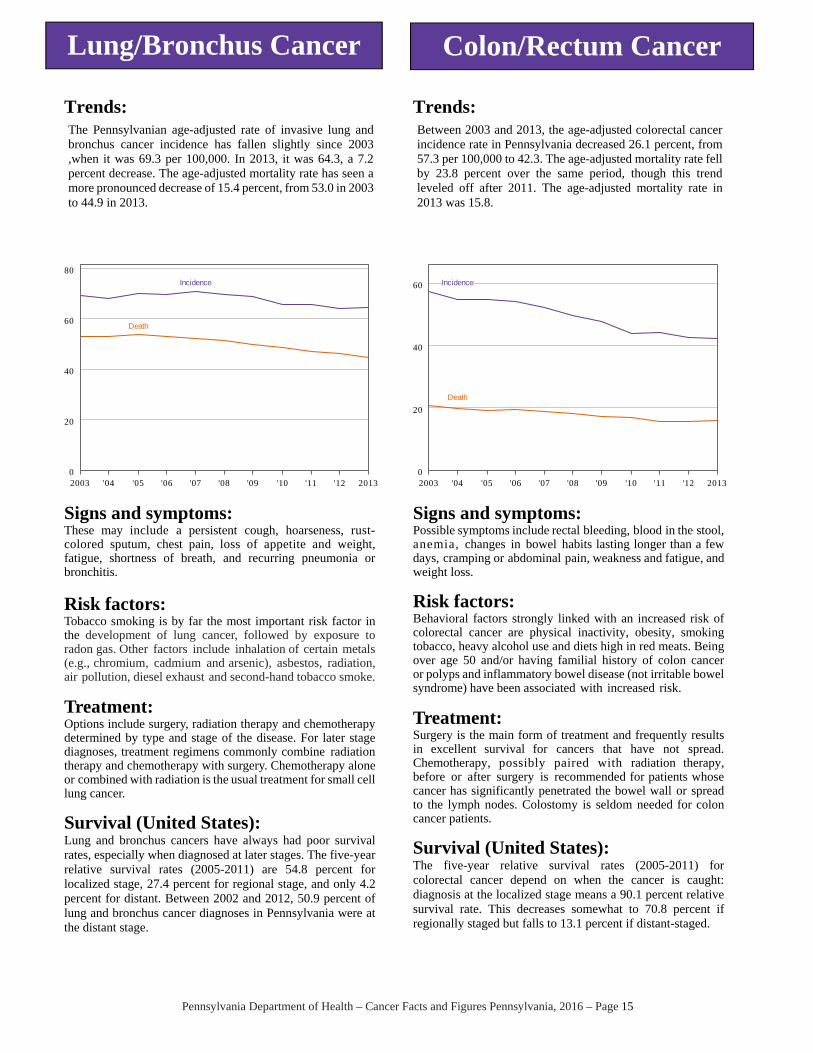
Lung/Bronchus Cancer Colon/Rectum Cancer
Trends:
Signs and symptoms: These may include a persistent cough, hoarseness, rust-colored sputum, chest pain, loss of appetite and weight, fatigue, shortness of breath, and recurring pneumonia or bronchitis.
Risk factors: Tobacco smoking is by far the most important risk factor in the development of lung cancer, followed by exposure to radon gas. Other factors include inhalation of certain metals (e.g., chromium, cadmium and arsenic), asbestos, radiation, air pollution, diesel exhaust and second-hand tobacco smoke.
Treatment: Options include surgery, radiation therapy and chemotherapy determined by type and stage of the disease. For later stage diagnoses, treatment regimens commonly combine radiation therapy and chemotherapy with surgery. Chemotherapy alone or combined with radiation is the usual treatment for small cell lung cancer.
Survival (United States): Lung and bronchus cancers have always had poor survival rates, especially when diagnosed at later stages. The five-year relative survival rates (2005-2011) are 54.8 percent for localized stage, 27.4 percent for regional stage, and only 4.2 percent for distant. Between 2002 and 2012, 50.9 percent of lung and bronchus cancer diagnoses in Pennsylvania were at the distant stage.
Trends:
Signs and symptoms: Possible symptoms include rectal bleeding, blood in the stool, anemia, changes in bowel habits lasting longer than a few days, cramping or abdominal pain, weakness and fatigue, and weight loss.
Risk factors: Behavioral factors strongly linked with an increased risk of colorectal cancer are physical inactivity, obesity, smoking tobacco, heavy alcohol use and diets high in red meats. Being over age 50 and/or having familial history of colon cancer or polyps and inflammatory bowel disease (not irritable bowel syndrome) have been associated with increased risk.
Treatment: Surgery is the main form of treatment and frequently results in excellent survival for cancers that have not spread. Chemotherapy, possibly paired with radiation therapy, before or after surgery is recommended for patients whose cancer has significantly penetrated the bowel wall or spread to the lymph nodes. Colostomy is seldom needed for colon cancer patients.
Survival (United States): The five-year relative survival rates (2005-2011) for colorectal cancer depend on when the cancer is caught: diagnosis at the localized stage means a 90.1 percent relative survival rate. This decreases somewhat to 70.8 percent if regionally staged but falls to 13.1 percent if distant-staged.
Incidence
Death
0
20
40
60
80
2003 '04 '05 '06 '07 '08 '09 '10 '11 '12 2013
Incidence
Death
0
20
40
60
2003 '04 '05 '06 '07 '08 '09 '10 '11 '12 2013
The Pennsylvanian age-adjusted rate of invasive lung and bronchus cancer incidence has fallen slightly since 2003 ,when it was 69.3 per 100,000. In 2013, it was 64.3, a 7.2 percent decrease. The age-adjusted mortality rate has seen a more pronounced decrease of 15.4 percent, from 53.0 in 2003 to 44.9 in 2013.
Between 2003 and 2013, the age-adjusted colorectal cancer incidence rate in Pennsylvania decreased 26.1 percent, from 57.3 per 100,000 to 42.3. The age-adjusted mortality rate fell by 23.8 percent over the same period, though this trend leveled off after 2011. The age-adjusted mortality rate in 2013 was 15.8.
Cancer site2016
projected2013
observedPercent change
2016 projected
2013 observed
Percent change
2016 projected
2013 observed
Percent change
All cancers1 78,498 77,565 1.2 39,462 38,161 3.4 39,036 39,401 -0.9
Brain and other nervous system
1,105 1,065 3.7 606 566 7.0 499 499 0.0
Cervix uteri 539 507 6.3 – – – 539 507 6.3
Colon and rectum 6,467 6,913 -6.5 3,298 3,554 -7.2 3,168 3,359 -5.7
Corpus and uterus, NOS 3,035 2,873 5.6 – – – 3,035 2,873 5.6
Esophagus 867 866 0.1 685 685 0.0 182 181 0.4
Female breast 9,741 10,974 -11.2 – – – 9,741 10,973 -11.2
Hodgkin lymphoma 420 402 4.6 225 224 0.6 195 178 9.6
Kidney and renal pelvis 2,894 2,729 6.0 1,828 1,663 9.9 1,066 1,066 0.0
Larynx 617 611 0.9 485 468 3.6 132 143 -8.0
Leukemia 2,253 2,128 5.9 1,340 1,215 10.3 913 913 0.0
Liver and intrahepatic bile duct
1,598 1,351 18.3 1,170 975 20.0 428 376 13.9
Lung and bronchus 10,804 10,656 1.4 5,540 5,596 -1.0 5,264 5,059 4.1
Melanoma of the skin 4,375 3,728 17.3 2,508 2,137 17.4 1,866 1,591 17.3
Myeloma 1,108 1,045 6.0 649 586 10.8 459 459 0.0
Non-Hodgkin lymphoma 3,328 3,328 0.0 1,744 1,744 0.0 1,584 1,584 0.0
Oral cavity and pharynx 2,040 1,927 5.9 1,455 1,341 8.5 585 585 0.0
Ovary 998 998 0.0 – – – 998 998 0.0
Pancreas 2,398 2,223 7.9 1,247 1,151 8.4 1,151 1,072 7.3
Prostate 7,907 7,973 -0.8 7,907 7,973 -0.8 – – –
Stomach 986 993 -0.7 658 665 -1.0 328 328 0.0
Testis 371 374 -0.8 371 374 -0.8 – – –
Thyroid 3,022 2,853 5.9 845 700 20.7 2,177 2,153 1.1
Urinary bladder1 4,246 4,198 1.1 3,258 3,164 3.0 988 1,034 -4.5
All Cases Males Females
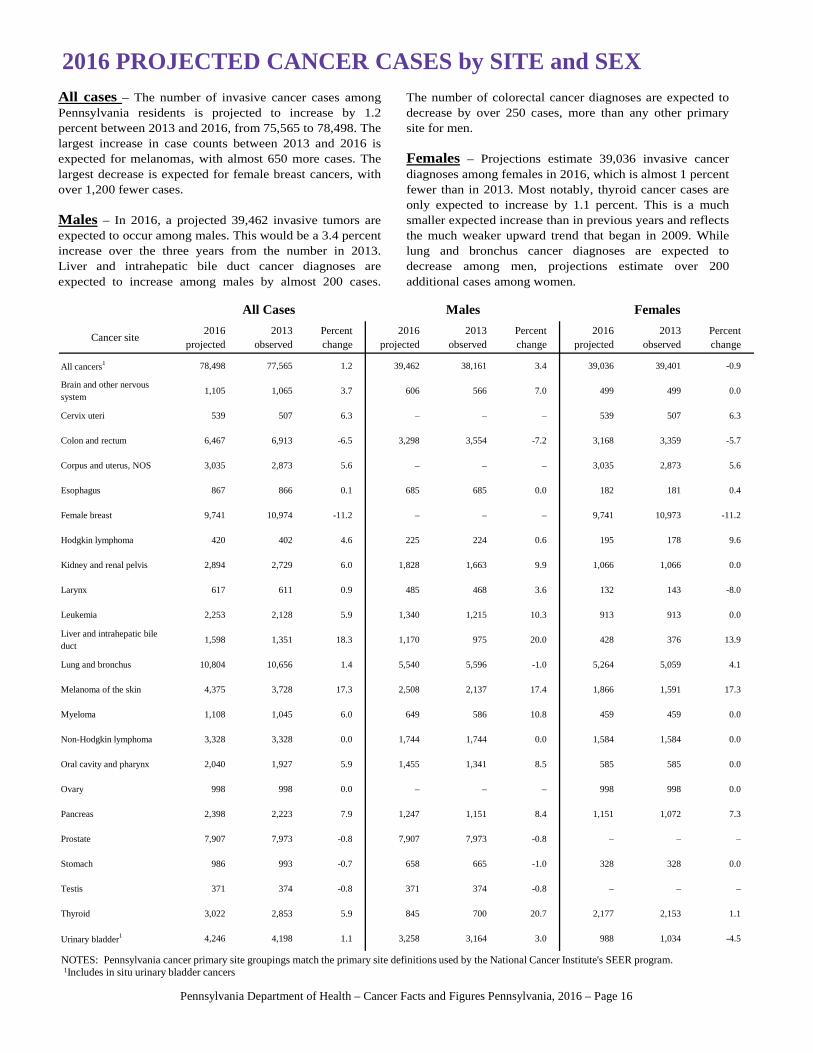
2016 PROJECTED CANCER CASES by SITE and SEX
NOTES: Pennsylvania cancer primary site groupings match the primary site definitions used by the National Cancer Institute's SEER program.1Includes in situ urinary bladder cancers
All cases – The number of invasive cancer cases among Pennsylvania residents is projected to increase by 1.2 percent between 2013 and 2016, from 75,565 to 78,498. The largest increase in case counts between 2013 and 2016 is expected for melanomas, with almost 650 more cases. The largest decrease is expected for female breast cancers, with over 1,200 fewer cases.
Males – In 2016, a projected 39,462 invasive tumors are expected to occur among males. This would be a 3.4 percent increase over the three years from the number in 2013. Liver and intrahepatic bile duct cancer diagnoses are expected to increase among males by almost 200 cases.
The number of colorectal cancer diagnoses are expected todecrease by over 250 cases, more than any other primarysite for men. Females – Projections estimate 39,036 invasive cancer diagnoses among females in 2016, which is almost 1 percentfewer than in 2013. Most notably, thyroid cancer cases areonly expected to increase by 1.1 percent. This is a muchsmaller expected increase than in previous years and reflectsthe much weaker upward trend that began in 2009. Whilelung and bronchus cancer diagnoses are expected todecrease among men, projections estimate over 200additional cases among women.
Pennsylvania Department of Health – Cancer Facts and Figures Pennsylvania, 2016 – Page 16
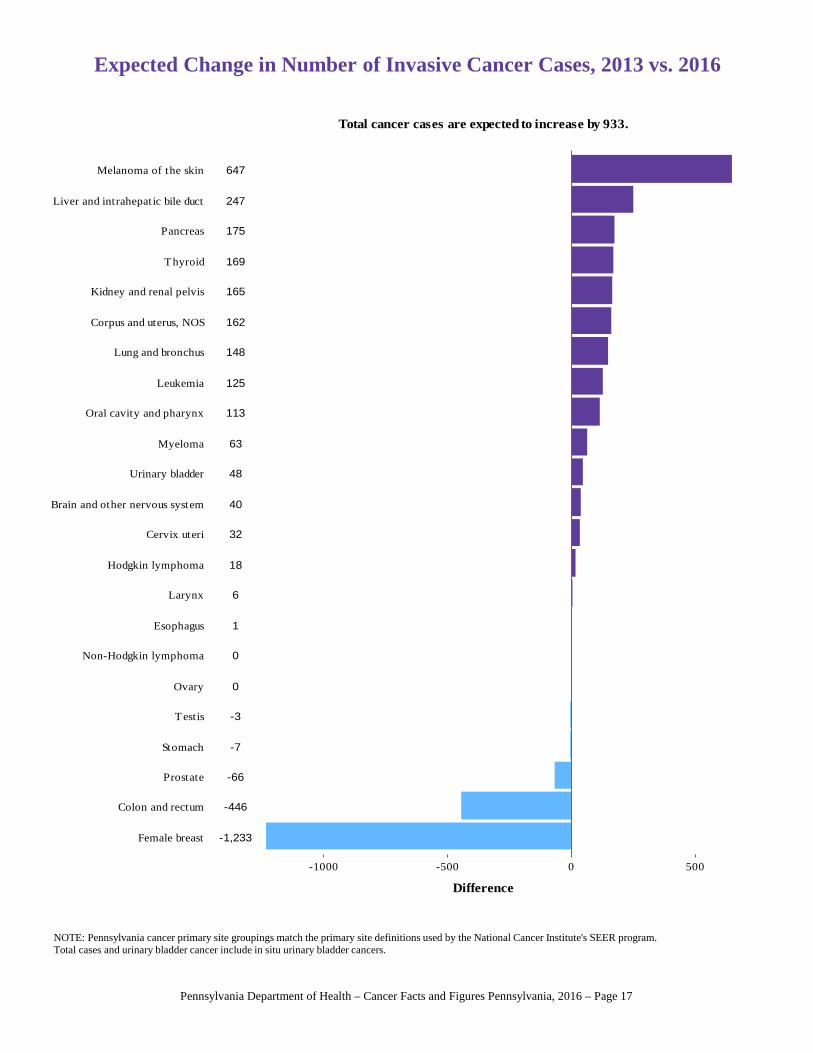
Expected Change in Number of Invasive Cancer Cases, 2013 vs. 2016
NOTE: Pennsylvania cancer primary site groupings match the primary site definitions used by the National Cancer Institute's SEER program.Total cases and urinary bladder cancer include in situ urinary bladder cancers.
113
1
-7
-446
247
175
6
148
647
-1,233
32
162
0
-66
-3
48
165
40
169
0
18
63
125
Female breast
Colon and rectum
Prostate
Stomach
Testis
Ovary
Non-Hodgkin lymphoma
Esophagus
Larynx
Hodgkin lymphoma
Cervix uteri
Brain and other nervous system
Urinary bladder
Myeloma
Oral cavity and pharynx
Leukemia
Lung and bronchus
Corpus and uterus, NOS
Kidney and renal pelvis
Thyroid
Pancreas
Liver and intrahepatic bile duct
Melanoma of the skin
-1000 -500 0 500
Difference
Total cancer cases are expected to increase by 933.
Pennsylvania Department of Health – Cancer Facts and Figures Pennsylvania, 2016 – Page 17
Cancer site2016
projected2013
observedPercent change
2016 projected
2013 observed
Percent change
2016 projected
2013 observed
Percent change
All cancers 28,431 28,418 0.0 14,697 14,631 0.4 13,734 13,787 -0.4
Brain and other nervous system
649 693 -6.4 369 369 0.0 280 324 -13.7
Cervix uteri 167 170 -1.9 – – – 167 170 -1.9
Colon and rectum 2,500 2,653 -5.8 1,244 1,312 -5.1 1,255 1,341 -6.4
Corpus and uterus, NOS 508 508 0.0 – – – 508 508 0.0
Esophagus 796 794 0.3 635 637 -0.2 161 157 2.4
Female breast 1,994 1,994 0.0 – – – 1,994 1,994 0.0
Hodgkin lymphoma 48 46 4.2 22 22 0.0 26 24 8.0
Kidney and renal pelvis 626 629 -0.6 376 375 0.2 250 254 -1.7
Larynx 192 194 -1.0 149 148 1.0 43 46 -7.5
Leukemia 1,137 1,114 2.1 631 620 1.8 506 494 2.5
Liver and intrahepatic bile duct
1,130 1,014 11.4 796 680 17.1 334 334 0.0
Lung and bronchus 7,515 7,507 0.1 4,071 4,150 -1.9 3,444 3,357 2.6
Melanoma of the skin 443 446 -0.6 282 282 0.0 161 164 -1.7
Myeloma 533 557 -4.3 268 294 -8.9 265 263 0.9
Non-Hodgkin lymphoma 979 997 -1.8 539 539 0.0 440 458 -3.9
Oral cavity and pharynx 349 344 1.3 235 243 -3.3 114 101 12.4
Ovary 713 713 0.0 – – – 713 713 0.0
Pancreas 1,933 1,863 3.8 1,016 946 7.4 917 917 0.0
Prostate 1,359 1,359 0.0 1,359 1,359 0.0 – – –
Stomach 441 441 0.0 271 271 0.0 170 170 0.0
Testis 16 11 44.3 16 11 44.3 – – –
Thyroid 79 84 -5.9 34 34 0.0 45 50 -9.8
Urinary bladder 815 821 -0.7 580 580 0.0 235 241 -2.3
All Cases Males Females
2016 PROJECTED CANCER DEATHS by SITE and SEX
NOTES: Pennsylvania cancer primary site groupings match the primary site definitions used by the National Cancer Institute's SEER program.
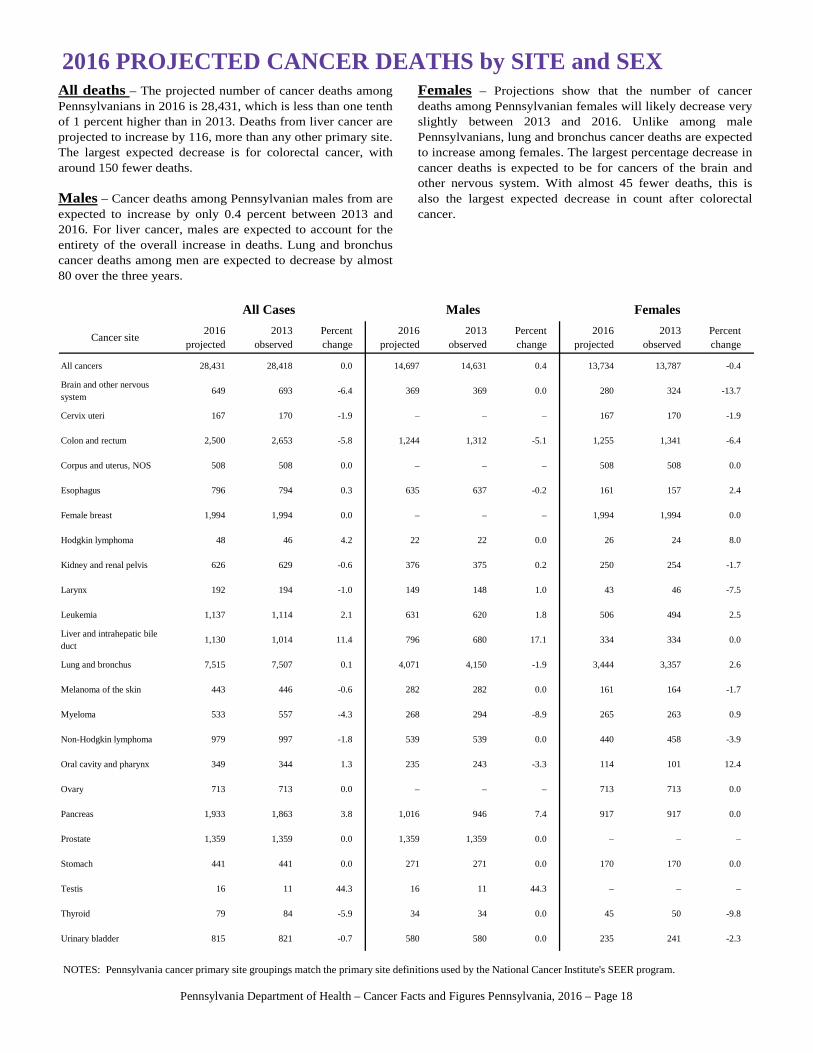
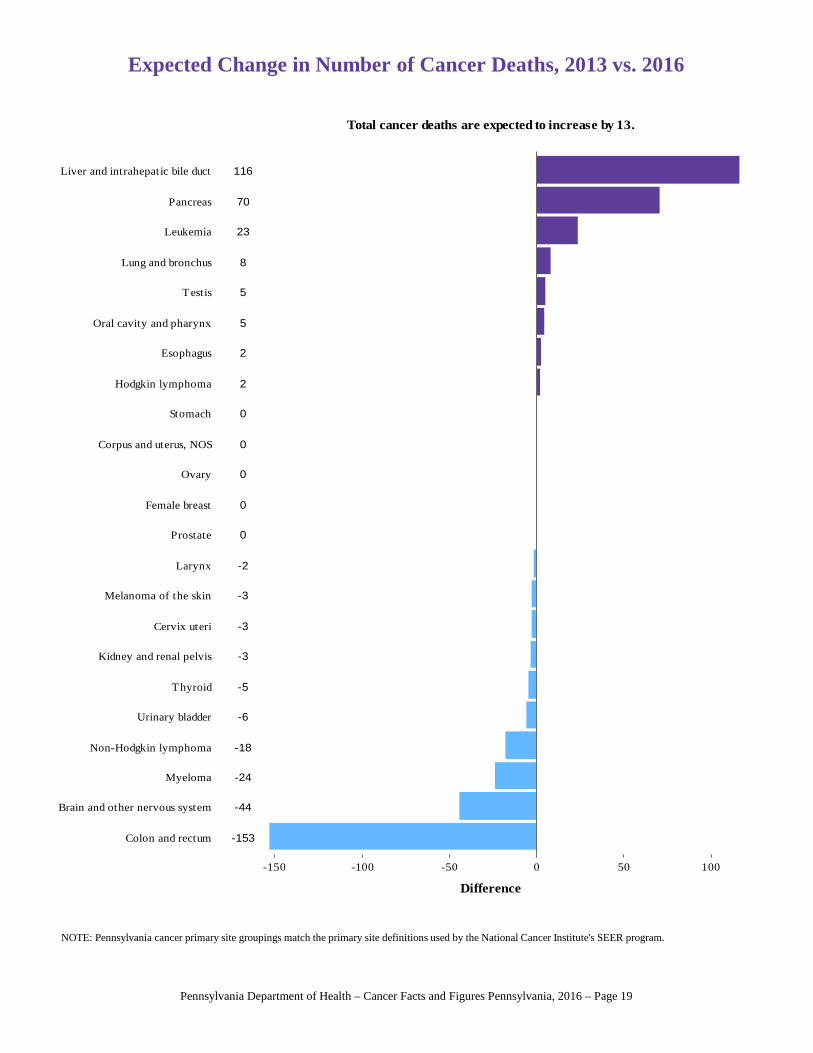
All deaths – The projected number of cancer deaths among Pennsylvanians in 2016 is 28,431, which is less than one tenth of 1 percent higher than in 2013. Deaths from liver cancer are projected to increase by 116, more than any other primary site. The largest expected decrease is for colorectal cancer, with around 150 fewer deaths. Males – Cancer deaths among Pennsylvanian males from are expected to increase by only 0.4 percent between 2013 and 2016. For liver cancer, males are expected to account for the entirety of the overall increase in deaths. Lung and bronchus cancer deaths among men are expected to decrease by almost 80 over the three years.
Females – Projections show that the number of cancerdeaths among Pennsylvanian females will likely decrease veryslightly between 2013 and 2016. Unlike among malePennsylvanians, lung and bronchus cancer deaths are expectedto increase among females. The largest percentage decrease incancer deaths is expected to be for cancers of the brain andother nervous system. With almost 45 fewer deaths, this isalso the largest expected decrease in count after colorectalcancer.
Pennsylvania Department of Health – Cancer Facts and Figures Pennsylvania, 2016 – Page 18
5
2
0
-153
116
70
-2
8
-3
0
-3
0
0
0
5
-6
-3
-44
-5
-18
2
-24
23
Colon and rectum
Brain and other nervous system
Myeloma
Non-Hodgkin lymphoma
Urinary bladder
Thyroid
Kidney and renal pelvis
Cervix uteri
Melanoma of the skin
Larynx
Prostate
Female breast
Ovary
Corpus and uterus, NOS
Stomach
Hodgkin lymphoma
Esophagus
Oral cavity and pharynx
Testis
Lung and bronchus
Leukemia
Pancreas
Liver and intrahepatic bile duct
-150 -100 -50 0 50 100
Difference
Total cancer deaths are expected to increase by 13.
Expected Change in Number of Cancer Deaths, 2013 vs. 2016
NOTE: Pennsylvania cancer primary site groupings match the primary site definitions used by the National Cancer Institute's SEER program.
Pennsylvania Department of Health – Cancer Facts and Figures Pennsylvania, 2016 – Page 19
County2016
Projected2013
ObservedPercent Change
County2016
Projected2013
ObservedPercent Change
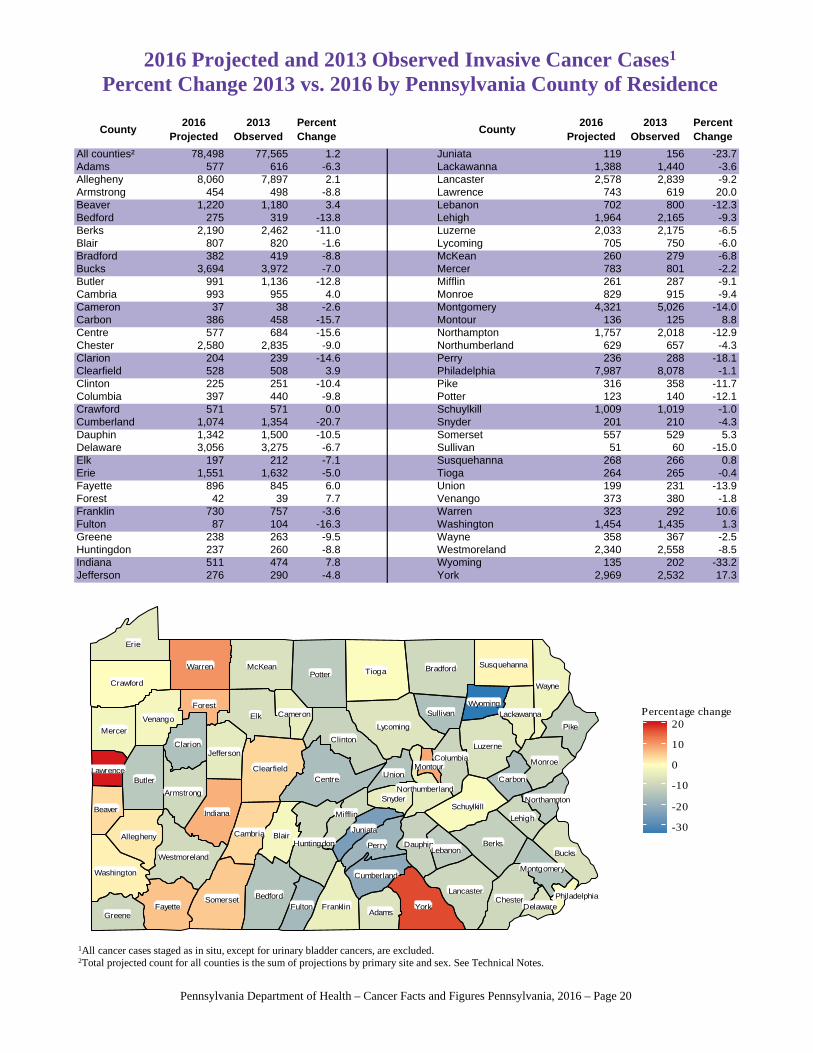
All counties² 78,498 77,565 1.2 Juniata 119 156 -23.7Adams 577 616 -6.3 Lackawanna 1,388 1,440 -3.6Allegheny 8,060 7,897 2.1 Lancaster 2,578 2,839 -9.2Armstrong 454 498 -8.8 Lawrence 743 619 20.0Beaver 1,220 1,180 3.4 Lebanon 702 800 -12.3Bedford 275 319 -13.8 Lehigh 1,964 2,165 -9.3Berks 2,190 2,462 -11.0 Luzerne 2,033 2,175 -6.5Blair 807 820 -1.6 Lycoming 705 750 -6.0Bradford 382 419 -8.8 McKean 260 279 -6.8Bucks 3,694 3,972 -7.0 Mercer 783 801 -2.2Butler 991 1,136 -12.8 Mifflin 261 287 -9.1Cambria 993 955 4.0 Monroe 829 915 -9.4Cameron 37 38 -2.6 Montgomery 4,321 5,026 -14.0Carbon 386 458 -15.7 Montour 136 125 8.8Centre 577 684 -15.6 Northampton 1,757 2,018 -12.9Chester 2,580 2,835 -9.0 Northumberland 629 657 -4.3Clarion 204 239 -14.6 Perry 236 288 -18.1Clearfield 528 508 3.9 Philadelphia 7,987 8,078 -1.1Clinton 225 251 -10.4 Pike 316 358 -11.7Columbia 397 440 -9.8 Potter 123 140 -12.1Crawford 571 571 0.0 Schuylkill 1,009 1,019 -1.0Cumberland 1,074 1,354 -20.7 Snyder 201 210 -4.3Dauphin 1,342 1,500 -10.5 Somerset 557 529 5.3Delaware 3,056 3,275 -6.7 Sullivan 51 60 -15.0Elk 197 212 -7.1 Susquehanna 268 266 0.8Erie 1,551 1,632 -5.0 Tioga 264 265 -0.4Fayette 896 845 6.0 Union 199 231 -13.9Forest 42 39 7.7 Venango 373 380 -1.8Franklin 730 757 -3.6 Warren 323 292 10.6Fulton 87 104 -16.3 Washington 1,454 1,435 1.3Greene 238 263 -9.5 Wayne 358 367 -2.5Huntingdon 237 260 -8.8 Westmoreland 2,340 2,558 -8.5Indiana 511 474 7.8 Wyoming 135 202 -33.2Jefferson 276 290 -4.8 York 2,969 2,532 17.3
Adams
Allegheny
Armstrong
Beaver
Bedford
BerksBlair
Bradford
Bucks
Butler
Cambria
Cameron
CarbonCentre
Chester
Clarion
Clearfield
Clinton
Columbia
Crawford
Cumberland
Dauphin
Delaware
Elk
Erie
Fayette
Forest
FranklinFultonGreene
Huntingdon
Indiana
Jefferson
Juniata
Lackawanna
Lancaster
Lawrence
Lebanon
Lehigh
Luzerne
Lycoming
McKean
Mercer
Mifflin
Monroe
Montgomery
Montour
NorthamptonNorthumberland
Perry
Philadelphia
Pike
Potter
SchuylkillSnyder
Somerset
Sullivan
SusquehannaTioga
Union
Venango
Warren
Washington
Wayne
Westmoreland
Wyoming
York
-30
-20
-10
0
10
20Percentage change
2016 Projected and 2013 Observed Invasive Cancer Cases1
Percent Change 2013 vs. 2016 by Pennsylvania County of Residence
1All cancer cases staged as in situ, except for urinary bladder cancers, are excluded.2Total projected count for all counties is the sum of projections by primary site and sex. See Technical Notes.
Pennsylvania Department of Health – Cancer Facts and Figures Pennsylvania, 2016 – Page 20
County2016
Projected2013
ObservedPercent Change
County2016
Projected2013
ObservedPercent Change
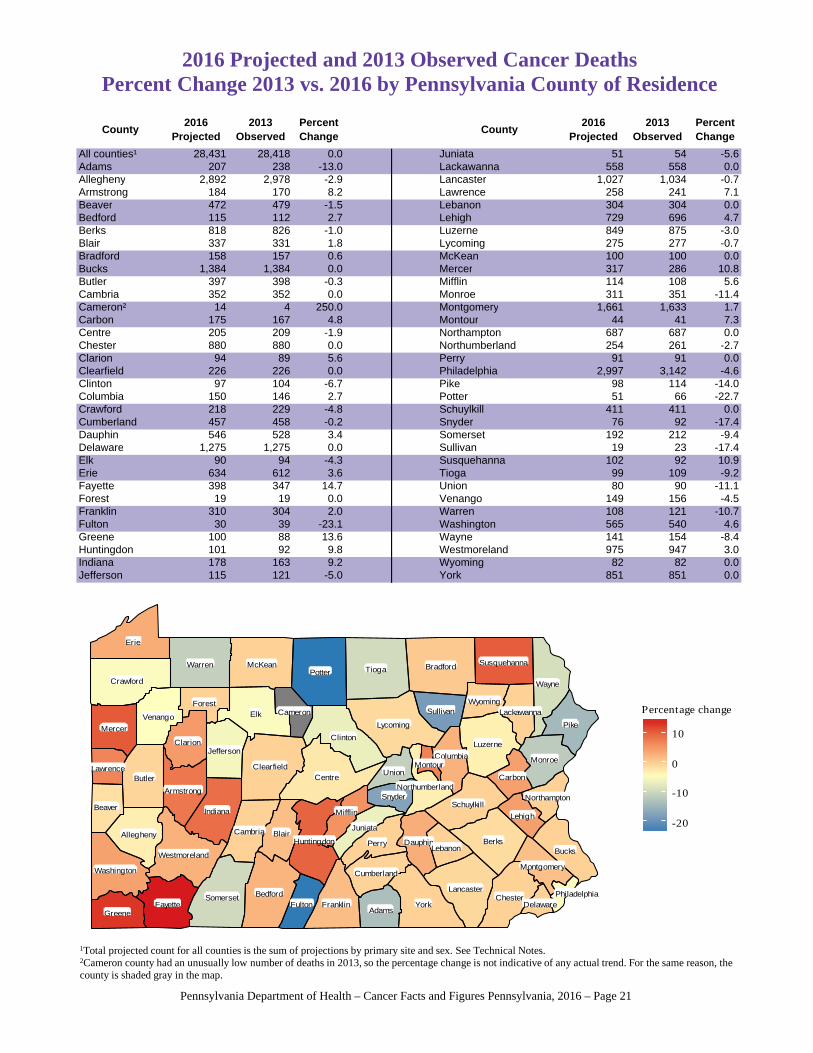
All counties¹ 28,431 28,418 0.0 Juniata 51 54 -5.6Adams 207 238 -13.0 Lackawanna 558 558 0.0Allegheny 2,892 2,978 -2.9 Lancaster 1,027 1,034 -0.7Armstrong 184 170 8.2 Lawrence 258 241 7.1Beaver 472 479 -1.5 Lebanon 304 304 0.0Bedford 115 112 2.7 Lehigh 729 696 4.7Berks 818 826 -1.0 Luzerne 849 875 -3.0Blair 337 331 1.8 Lycoming 275 277 -0.7Bradford 158 157 0.6 McKean 100 100 0.0Bucks 1,384 1,384 0.0 Mercer 317 286 10.8Butler 397 398 -0.3 Mifflin 114 108 5.6Cambria 352 352 0.0 Monroe 311 351 -11.4Cameron² 14 4 250.0 Montgomery 1,661 1,633 1.7Carbon 175 167 4.8 Montour 44 41 7.3Centre 205 209 -1.9 Northampton 687 687 0.0Chester 880 880 0.0 Northumberland 254 261 -2.7Clarion 94 89 5.6 Perry 91 91 0.0Clearfield 226 226 0.0 Philadelphia 2,997 3,142 -4.6Clinton 97 104 -6.7 Pike 98 114 -14.0Columbia 150 146 2.7 Potter 51 66 -22.7Crawford 218 229 -4.8 Schuylkill 411 411 0.0Cumberland 457 458 -0.2 Snyder 76 92 -17.4Dauphin 546 528 3.4 Somerset 192 212 -9.4Delaware 1,275 1,275 0.0 Sullivan 19 23 -17.4Elk 90 94 -4.3 Susquehanna 102 92 10.9Erie 634 612 3.6 Tioga 99 109 -9.2Fayette 398 347 14.7 Union 80 90 -11.1Forest 19 19 0.0 Venango 149 156 -4.5Franklin 310 304 2.0 Warren 108 121 -10.7Fulton 30 39 -23.1 Washington 565 540 4.6Greene 100 88 13.6 Wayne 141 154 -8.4Huntingdon 101 92 9.8 Westmoreland 975 947 3.0Indiana 178 163 9.2 Wyoming 82 82 0.0Jefferson 115 121 -5.0 York 851 851 0.0
2016 Projected and 2013 Observed Cancer DeathsPercent Change 2013 vs. 2016 by Pennsylvania County of Residence
Adams
Allegheny
Armstrong
Beaver
Bedford
BerksBlair
Bradford
Bucks
Butler
Cambria
Cameron
CarbonCentre
Chester
Clarion
Clearfield
Clinton
Columbia
Crawford
Cumberland
Dauphin
Delaware
Elk
Erie
Fayette
Forest
FranklinFultonGreene
Huntingdon
Indiana
Jefferson
Juniata
Lackawanna
Lancaster
Lawrence
Lebanon
Lehigh
Luzerne
Lycoming
McKean
Mercer
Mifflin
Monroe
Montgomery
Montour
NorthamptonNorthumberland
Perry
Philadelphia
Pike
Potter
SchuylkillSnyder
Somerset
Sullivan
SusquehannaTioga
Union
Venango
Warren
Washington
Wayne
Westmoreland
Wyoming
York
-20
-10
0
10
Percentage change
1Total projected count for all counties is the sum of projections by primary site and sex. See Technical Notes.2Cameron county had an unusually low number of deaths in 2013, so the percentage change is not indicative of any actual trend. For the same reason, the county is shaded gray in the map.
Pennsylvania Department of Health – Cancer Facts and Figures Pennsylvania, 2016 – Page 21
Pennsylvania Department of Health – Cancer Facts and Figures Pennsylvania, 2016 – Page 22
Cancer Prevention and Control Initiatives of the Pennsylvania Department of Health
The Pennsylvania Department of Health wants you to know … what we know about cancer.
78,498 → This many Pennsylvanians are expected to be diagnosed with cancer in 2016.
28,431 → This many Pennsylvanians are expected to die of cancer in 2016.
2 in 5 → Chance that men in the United States are expected to get cancer in their lifetime1 1 in 3 → Chance that women in the United States are expected to get cancer in their lifetime1
Lung Cancer: More people died from lung cancer between 2009 and 2013 than prostate, breast and colorectal cancer
combined,2 making it the leading cancer killer in America. Quitting smoking remains the best way to reduce your risk of developing or dying from lung cancer,
followed by testing your home for radon and fixing high levels. Breast Cancer: Breast cancer is treatable if caught early. Remember to have your mammogram every year if you are 40 or older.
Cervical Cancer: No woman should die of cervical cancer. Regular Pap tests are the best way to find cancer early. We know that human papillomavirus (HPV) causes most cases of cervical cancer. HPV vaccination is the best defense in stopping HPV-related cancers, including cervical cancer.
Colorectal Cancer: Colorectal cancer is treatable if caught early. If you are 50 or older, talk to your health care provider about getting tested for colon cancer.
Prostate Cancer: One in seven men gets prostate cancer in his lifetime. Black men have the highest rates of prostate cancer incidence in the United States.2 Know the facts about prostate cancer screening and talk to your health care provider about the risks
and benefits of prostate cancer screening. Melanoma: An estimated 10,130 people in the United States will die of melanoma in 2016.3 Melanoma is the deadliest form of skin cancer. Skin cancer is preventable.
1 SEER Cancer Statistics Review, 1975-2012 2 SEER Cancer Statistics Review, 1975-2013 3 Cancer Facts and Figures 2016
Continued on page 23
Pennsylvania Department of Health – Cancer Facts and Figures Pennsylvania, 2016 – Page 23
Cancer Prevention and Control Initiatives (continued)
We offer free breast and cervical cancer screening to women ages 40 to 64. Call 1-800-215-7494 or visit our website at www.health.pa.gov/My%20Health/Womens%20Health to see if you are eligible. We can bring our free breast cancer photo exhibit, “67 Women, 67 Counties: Facing Breast Cancer in Pennsylvania,” to your community. Call 1-800-377-8828 to schedule a photo exhibit opening in your home town or visit www.pbccexhibit.org. Additional information on cancer screening guidelines and diagnostic tests can be found on the American Cancer Society’s website at http://www.cancer.org/healthy/findcancerearly or the U.S. Preventive Service Task Force’s website at www.USPreventiveServicesTaskForce.org. Please note that the Pennsylvania Department of Health does not explicitly endorse one set of guidelines over another.
Now you know what we know about cancer.
Visit www.health.state.pa.us/cancer for more information about cancer control programs in Pennsylvania.
References
American Cancer Society. “Cancer Facts and Figures 2016,” Atlanta, GA: 2016.
American Cancer Society. “Cancer Prevention and Early Detection Facts and Figures 2015-2016,” Atlanta, GA: 2016.
National Cancer Institute. “SEER Cancer Statistics, Review 1975-2013.” Bethesda, MD: 2016 <http//seer.cancer.gov>.
Pennsylvania Department of Health. “Pennsylvania Cancer Incidence and Mortality 2012.” Harrisburg, PA: 2015.
Samuel B. Richmond. “Statistical Analysis, Second Edition.” Graduate School of Business, Columbia University: John Wiley and Sons, 1964.
World Health Organization. “ICD-O International Classification of Diseases for Oncology Second Edition.” Geneva. ISBN 92 4 1544147: 1990.
World Health Organization. “ICD-O International Classification of Diseases for Oncology Third Edition.” Geneva, Switzerland: 2000.
World Health Organization. “Manual of the International Statistical Classification of Diseases, Injuries, and Causes of Death.” Geneva: Ninth Revision. ISBN 92 4 154005 2: 1977.
World Health Organization, “International Statistical Classification of Diseases and Related Health Problems: Tenth Revision.” Geneva 1992.