canadian university survey consortium … · 8.4 credit cards ... 9.0 future education and...
TRANSCRIPT
WINNIPEG | OTTAWA | EDMONTON | REGINA
[email protected] www.pra.ca
Prepared for:
Canadian University Survey Consortium
June 2012
CANADIAN UNIVERSITY SURVEY CONSORTIUM
2012 SURVEY OF GRADUATING UNDERGRADUATE STUDENTS
University of the Fraser Valley
Canadian University Survey Consortium
2012 Survey of Graduating StudentsJune 2012
AGREEMENT FOR DATA USE
Members of the consortium are bound by the following Agreement for the control of survey data.
It was agreed by the participants that data are owned collectively and will be distributed only by
collective agreement.
1. TERMS AND CONDITIONS
Each participating member institution of the Canadian University Survey Consortium /
Consortium canadien de recherche sur les étudiants universitaires (CUSC/CCREU) has
committed, through a signed agreement, to terms and conditions regarding the collection,
storage, and use of survey data and the dissemination of related reports as follows:
A. The Corporation hereby known as the Canadian University Survey Consortium /
Consortium canadien de recherche sur les étudiants universitaires (CUSC/CCREU)
coordinates surveys of students in member institutions, facilitates the exchange of the
survey data among member institutions, and promotes awareness of the value of the
surveys among university administrators and policy makers in the post-secondary
educational system.
B. The survey data and analysis have five broad purposes for the members:
1) to better understand and track student experience and satisfaction with many aspects
of the institutions they attend
2) to improve student educational outcomes
3) to improve the services available to students
4) to benchmark for purposes of internal management and decision making
5) to contribute to accountability reports to the governing bodies of member institutions,
governments, and the public
C. The exchange of confidential data among member institutions requires goodwill and trust
among the member institutions. This Agreement shall be guided by the principle that
member institutions of CUSC/CCREU will act in the best interests of all member
institutions of the Corporation. The primary consideration in issues of disclosure of
research results shall be the avoidance of public comparisons that could damage the
reputation of a member institution.
D. Statistical measures and analysis of survey data may be of interest to wider audiences
than the members of the Corporation for policy formulation, advocacy, or publication of
research. Members of the Corporation are encouraged to make best use of the survey
data, including publication of research results while observing confidentiality
requirements.
E. The Corporation and each member institution define their respective obligations in
relation to the use of the data that is shared between the Corporation and the Members as
follows:
Canadian University Survey Consortium
2012 Survey of Graduating StudentsJune 2012
Definitions:
In this Agreement, unless the context requires or specifies otherwise:
a. “Data” means an electronic record of the answers to the questions on the survey
instrument given by each respondent at the universities that participated in the survey.
b. “Aggregate Data” means all of the data or data for groups of universities. Generally,
aggregate data is expressed as statistics and research findings across data drawn from all
universities or groups of universities.
c. “Member Institution” means a university that is a member of CUSC/CCREU.
d. “Publish” means dissemination of research findings beyond the senior administration of a
member institution.
e. “Senior Administration” means the officer of a member institution with overall
responsibility for academic programs and student services.
2. OWNERSHIP OF SURVEY DATA
The data collected in surveys of students attending a member institution is the property of that
institution.
3. EXCHANGE OF SURVEY DATA AMONG MEMBERS
Each member institution will make its survey data available to other member institutions for the
general purposes as outlined in Parts A to E above. Each member institution is bound by
restrictions on the use and disclosure of data belonging to other member institutions.
4. COMPARISONS LIMITED TO AGGREGATE DATA
The only interuniversity comparisons permitted for publication or circulation beyond a member
institution’s senior administration are those based on the aggregate data for all member
institutions or the aggregate data for the groups of member institutions identified by
CUSC/CCREU.
A member institution may prepare and circulate reports based on aggregated data from selected
groups of member institutions for internal use only to senior administrators of its institution.
5. LIMITATIONS ON THE USE OF DATA
A member institution may not publish statistical measures or analysis of its own data for
purposes of institutional promotion in a manner that would harm the reputation of another
member institution.
Canadian University Survey Consortium
2012 Survey of Graduating StudentsJune 2012
A member institution may not publish statistical measures or analysis of data collected at another
member institution with the name of the institution disclosed. Member institutions may publish
statistical measures and analysis of their own data.
A member institution may not publish statistical measures or analysis of data collected at another
member institution that would allow an informed reader to identify the institution by reference to
location, uncommon programs, or other information contained in the published material.
6. REQUIREMENTS FOR CONFIDENTIALITY
A member institution may make available to its senior administrators statistical measures and
analysis of data from another member institution, with the identity of the member disclosed, for
the purposes outlined in Parts A–E above. The member institution disclosing the identity of
another member institution in these circumstances must ensure that those to whom the
information is made available are aware of its confidential nature and restricted audience.
A member institution may be requested to disclose data or statistical measures under freedom of
information legislation or other requirements for accountability. In these circumstances, member
institutions may disclose their own data to fulfill the request. Member institutions shall not
disclose data that belongs to other member institutions unless the request explicitly demands it
and legal counsel advises that the request must be fulfilled. If it must be fulfilled, the member
institution shall notify immediately the other member institution(s). If it does not have to be
fulfilled the requester should be referred to the other member institution(s), which should be
notified immediately.
7. EXCLUSIVE USE OF INSTRUMENTS AND METHODOLOGY
The survey instruments and methodology are for the exclusive use of the member institutions
and are not to be shared with organizations outside the Corporation.
8. ACCESS TO AGGREGATE DATA
Access to the aggregate data for research purposes may be granted to interested persons,
provided the intended use is a legitimate, non-commercial one, and the researcher is qualified
and agrees to acknowledge ownership of the data by participating universities and provide the
consortium with a copy of any report or publication that is produced. Decisions on such requests
will be made by the CUSC/CCREU Board of Directors in consultation with members of the
consortium (all participating institutions) in the case of requests that seem problematic.
Canadian University Survey Consortium
2012 Survey of Graduating StudentsJune 2012
Table of Contents
AGREEMENT FOR DATA USE
EXECUTIVE SUMMARY ............................................................................................................. i
1.0 Introduction ......................................................................................................................... 1
1.1 Methodology ........................................................................................................... 2 1.2 University comparisons .......................................................................................... 5 1.3 Comparison with previous graduating students surveys ......................................... 7 1.4 Statistically significant differences ......................................................................... 7 1.5 Non-response .......................................................................................................... 7
2.0 Profile of graduating students ............................................................................................. 8
2.1 Student profile ......................................................................................................... 8
2.2 Living arrangements ............................................................................................. 10 2.3 Permanent residence ............................................................................................. 10
2.4 Disciplines............................................................................................................. 12 2.5 Academic profile ................................................................................................... 14 2.6 Scholarships .......................................................................................................... 17
2.7 Interruption of studies ........................................................................................... 18 2.8 Students’ grades .................................................................................................... 19
2.9 Parents’ education ................................................................................................. 20
3.0 Experiences at university .................................................................................................. 21 3.1 Class-based experiences........................................................................................ 21
3.2 Academic experiences .......................................................................................... 22
3.3 Experiences with faculty ....................................................................................... 25
4.0 Extracurricular activities ................................................................................................... 27 4.1 Student services and supports ............................................................................... 27
4.2 Non-academic campus activities........................................................................... 29 4.3 Interactions with others ......................................................................................... 31
5.0 Use of and satisfaction with facilities and services .......................................................... 34
5.1 General facilities and services .............................................................................. 34 5.2 Special services ..................................................................................................... 35
6.0 Skill growth and development .......................................................................................... 37
6.1 Academic skills ..................................................................................................... 37 6.2 Communication skills ........................................................................................... 38 6.3 Analytical and learning skills................................................................................ 39 6.4 Life skills: working and knowledge skills ............................................................ 41
6.5 Life skills: personal and relationship skills ........................................................... 43 6.6 Most important factors .......................................................................................... 44
Canadian University Survey Consortium
2012 Survey of Graduating StudentsJune 2012
7.0 Student satisfaction ........................................................................................................... 45 7.1 Satisfaction with faculty ....................................................................................... 45 7.2 Satisfaction with support staff .............................................................................. 46 7.3 Overall satisfaction with quality of teaching ........................................................ 47 7.4 Overall satisfaction with university ...................................................................... 47
7.5 Meeting students’ expectations ............................................................................. 52 7.6 Value for money ................................................................................................... 53 7.7 Students recommend their university.................................................................... 53
8.0 Education financing and debt............................................................................................ 56 8.1 Debt from financing education ............................................................................. 56
8.2 Average debt by source ......................................................................................... 58 8.3 Sources of funding education................................................................................ 59
8.4 Credit cards ........................................................................................................... 63
8.5 Current employment ............................................................................................. 64
9.0 Future education and employment .................................................................................... 66 9.1 Satisfaction with information about career options .............................................. 66 9.2 Preparedness for employment ............................................................................... 67
9.3 Immediate plans after graduation .......................................................................... 69 9.4 Future employment ............................................................................................... 70
9.5 Job arranged .......................................................................................................... 71 9.6 Source of job ......................................................................................................... 73 9.7 Satisfaction with job ............................................................................................. 73
9.8 Anticipated earnings ............................................................................................. 74 9.9 Job prospects ......................................................................................................... 76
10.0 Conclusion ........................................................................................................................ 77
Appendix A – 2012 CUSC Survey
Canadian University Survey Consortium i
2012 Survey of Graduating StudentsJune 2012
EXECUTIVE SUMMARY
This is the 18th
cooperative study undertaken by the Canadian University Survey Consortium
(CUSC). Since 1996, the survey has run in a three-year cycle, with different student populations
targeted each year. This year’s study presents the results for graduating students, the last of
which was conducted in 2009.
The current survey includes 37 participating universities and responses from over 15,000
students across Canada.
Profile of graduating students
Examining the profile of students participating in the survey shows the following:
► The majority of graduating students are female, 22 and younger, single, and living
independently. Academically, the majority are attending full-time, are in a program that
takes four or more years to complete, and are graduating with an average grade of B+ or
higher. Although students’ programs typically take about four years, they have been
studying for slightly longer (about one year), which is likely due to the fact that many
students are studying part-time and have had to interrupt or delay their studies.
► Students represent a variety of disciplines, with about 2 in 5 in generalist (i.e., Social
Science or Arts and Humanities) or professional (i.e., Business, Professional,
Engineering, or Education) programs. About 1 in 5 students are in a science program
(i.e., Biological or Physical sciences).
► About 16% of students are first-generation students; that is, neither their mother nor their
father had any post-secondary education. Older students are more likely to be first-
generation students.
Experiences at university
Among 16 activities tested, several stand out as contributing most to students’ growth and
development. Most notably, practicums, internships, co-ops, and work experiences related to
their program tend to contribute the most, with classroom instruction following slightly behind.
Online instruction and recommended readings are viewed by students as contributing least to
their growth and to development of the aspects tested.
Extracurricular activities
Among 17 extracurricular activities tested to show the impact they had on students’ growth and
development, students are most likely to say that participating in international study or exchanges
had the most impact on their growth and development. However, just 11% of students had
experience with this aspect. Interacting with other students is the second highest rated aspect
contributing to students’ development (among the 17), and 97% have experience with it. The aspect
that students think contributed the least was attending home games of university athletic teams.
Canadian University Survey Consortium ii
2012 Survey of Graduating StudentsJune 2012
Use of and satisfaction with facilities and services
Among 19 different facilities and services at their universities, the vast majority of students are
satisfied, as between 78% and 90% are satisfied with each. At the high end of this range is
satisfaction with library facilities and computer support services.
Skill growth and development
Students rated their universities’ contribution to their development in 33 specific skills. These
skills were further segmented into academic, communication, analytical and learning, working
and knowledge, and personal and relationship skills.
► Academic skills. Among academic skills, only universities’ contribution to broad
knowledge of my major field of study (76%) has more than half of students who say their
university contributed much or very much to their development. The fewest students rate
universities as contributing much or very much to mathematical skills (28%) among the
academic skills tested.
► Communication skills. Among four communication skills tested, students are most
likely to say that the university contributed much or very much to their written
communication (66%) skills. They are least likely rate their universities’ contribution to
second or third language skills (17%) as much or very much.
► Analytical and learning skills. Among seven analytical and learning skills, students are
most likely to rate their university as contributing much or very much to their ability to
think logically and analytically (71%). Students are least likely to say that their university
contributed much or very much to identifying and solving problems (52%).
► Working and knowledge skills. Students are much more likely to rate positively their
universities’ contribution to working independently (73%), which is much higher than the
other working and knowledge skills. Students are least likely to say their universities
contributed much or very much to their entrepreneurial skills (18%).
► Personal and relationship skills. Among the nine areas classified as personal and
relationship skills, persistence with difficult tasks (58%) and time management skills
(56%) receiving the highest ratings. Students are least likely to say their universities
contributed much or very much to their spiritual development (16%).
Among the 33 areas, students were asked to rate twenty of them in order to identify the three
most important areas for a student’s development. When compared to how universities are doing
with students’ development, broad knowledge of their major field of study was the area students
thought universities contributed most to, and it was the second highest rated in terms of
importance. Conversely, appreciation of the arts and spiritual development were areas students
thought universities contributed least to, and students also rate them as less important factors for
universities to concentrate on.
Canadian University Survey Consortium iii
2012 Survey of Graduating StudentsJune 2012
Student satisfaction
Examining aspects of students’ satisfaction show the following key results:
► Students are very positive about their interactions with faculty. The only exception is
satisfaction that most of their professors were knowledgeable of career opportunities in
their field, as 64% are satisfied (compared to 72% to 96% who are satisfied with other
areas).
► Many students appear to be less satisfied with their university in terms of the concern
shown by the institution for students as individuals. Fewer than 6 in 10 report being
satisfied — including just 8% who are very satisfied — with the concern their university
showed for them as individuals.
► Students are also positive about their education, as almost 9 students in 10 agree that
generally, they are satisfied with the quality of teaching they have received, are satisfied
overall quality of education they received, and are satisfied with their decision to attend
their university.
► Although students are very positive about their educational experiences, about 2 students
in 3 agree that they received good value for their money, while about 1 in 3 students
disagree.
Education financing and debt
Overall, about 6 in 10 students report having some debt from financing their education, with the
typical student reporting $14,453 in debt with 62% of this being accounted for by government
student loans. When adjusted for inflation, students’ total debt in 2000 was a reported $14,547,
which is on par with debt reported by students in 2012.
Among 11 sources students may use to finance their education, the most commonly used sources
of funding are parents or other family members (59%) and personal savings (50%). On average,
students required $11,306 to finance their current year. Compared to 2003, the average amount
students required to finance their education was substantially lower in 2012, when adjusted for
inflation. In 2003, students needed about $12,972 to finance their current year of university
studies, which is about 15% higher than the amount students required in 2012.
Among the 6 in 10 students who are currently employed, students spend about 18 hours a week
working on average. Students’ work appears to have some negative impact on their academic
performance, as about 3 in 10 say it does. Those who are most likely to have their academic
performance negatively affected by their employment are those attending school full-time and
working between 11 to 20 hours a week.
Canadian University Survey Consortium iv
2012 Survey of Graduating StudentsJune 2012
Future education and employment
In their first year after graduating, about half plan on continuing their education. Students’
decisions about whether to take further education after graduating are somewhat influenced by
debt they have incurred, as 60% say their debt load has an impact on their decision about
whether or not to take further education.
Just over 1 in 3 students have a job arranged once they graduate. These students report the
following:
► Most say their job is permanent, a continuation of previous employment, does not require
a degree, and is related to the knowledge and skills they acquired in their program.
► Over 8 in 10 are satisfied with the job they have secured.
► The average annual income students will receive is estimated to be $33,567. Compared to
previous years, the average reported annual salary is much lower. In fact, the reported
salary is 17% lower than 2009, when students reported an average salary of $39,226 (in
2012 dollars).
Slightly fewer than 6 students in 10 believe that there are at least some jobs available in their
field of study, while 4 students in 10 think there are few jobs in their field of study. Students’
perceptions of the job market have grown more negative over time. In 2000, 23% thought there
were few or very few jobs available in their field of study compared to 38% in 2012.
Although students are more pessimistic about employment in their field of study, it does not
appear to translate into students being proactive in preparing for employment. Among nine steps
tested to determine how students are preparing for employment, only creating a resume or CV
(81%) is reported by more than 2 in 3 students.
Canadian University Survey Consortium 1
2012 Survey of Graduating StudentsJune 2012
1.0 Introduction
Since 1994, the Canadian University Survey Consortium / Consortium canadien de recherche sur
les étudiants universitaires (CUSC/CCREU) has coordinated surveys of students attending
member institutions and facilitated sharing the survey data among its member institutions.
The surveys and shared data have five broad purposes:
► to better understand and track students’ experiences and satisfaction with many aspects of
the universities they attend
► to improve students’ educational outcomes
► to improve the services available to students
► to benchmark for purposes of internal management and decision making
► to contribute to accountability reports for the governing bodies of member institutions,
governments, and the public
This is the 18th
cooperative study undertaken by CUSC. The surveys target three undergraduate
sub-samples: first-year, graduating, and all students. This year’s study surveyed graduating
undergraduate students. Table 1 shows the types of students CUSC has surveyed and the number
of participating universities each year.
Table 1: Past CUSC surveys
Year Sample Number of participating
universities
1994 All undergraduates 8
1996 All undergraduates 10
1997 Graduating students 9
1998 First-year students 19
1999 All undergraduates 23
2000 Graduating students 22
2001 First-year students 26
2002 All undergraduates 30
2003 Graduating students 26
2004 First-year students 27
2005 All undergraduates 28
2006 Graduating students 25
2007 First-year students 34
2008 All undergraduates 31
2009 Graduating students 34
2010 First-year students 39
2011 All undergraduates 25
2012 Graduating students 37
Canadian University Survey Consortium 2
2012 Survey of Graduating StudentsJune 2012
1.1 Methodology
As shown in Table 1, the CUSC survey runs in a three-year cycle, targeting particular types of
students each year. The questionnaire used for each of these populations is different.
Each year, PRA Inc. and representatives from participating universities review past
questionnaires and methodology to discuss issues and possible changes. In the fall of 2011,
representatives of participating universities reviewed the questionnaire last used — in this case,
the 2009 questionnaire. The goal of this review was to identify questions that were no longer
appropriate, consider questions that may be added to the survey, and review problems or issues
identified the last time the survey was run. As much as possible, the intent was to leave the
questionnaire unchanged to allow for comparison across time. Based on the outcome of this
meeting, PRA prepared a draft and then, based on comments from CUSC members, produced a
final questionnaire (Appendix A).
Each university supported the study by generating a sample of undergraduate students who were
expected to graduate in 2012. Each institution provided PRA with an electronic database
containing the email addresses for these students.
PRA was responsible for managing the online survey. This involved liaising with the
participating universities, providing the company contracted to host the online survey with a
database of student email addresses, preparing the introductory and reminder emails to students,
and responding to student questions about questionnaire content, as well as technical questions
about using the online survey.
Canadian University Survey Consortium 7
2012 Survey of Graduating StudentsJune 2012
1.3 Comparison with previous graduating students surveys
Throughout this report, we compare the results of the current survey with results from previous
surveys of graduating students (i.e., 2009, 2006, 2003, and 2000). However, not all universities
that participated in the previous studies participated in 2012. In addition, sampling and data
weighting procedures changed for the 2012 survey.
Therefore, any difference between surveys may be the result of these differences rather than
actual changes over time. PRA includes these comparisons as a point of interest; further
investigation may be necessary to assess true differences across time. That being said, there are a
few differences in results between the five surveys.
1.4 Statistically significant differences
Large sample sizes may inflate measures of statistical significance and may lead to false
conclusions about the strength of association. The chi-square measure of association, in
particular, is susceptible to this possibility. Therefore, the standards for designating whether a
relationship can be termed statistically significant have been increased: the Pearson’s chi-square
must have probability of a type 1 error of less than .001 and either the Phi coefficient or
Cramer’s V must have a value of .150 or greater. Throughout this document, any differences
reported meet these criteria, unless otherwise stated.
Table 6: Criteria for statistical significance
Test Level for significance
Pearson’s chi-square <.001
Phi coefficient or Cramer’s V .150 or higher
1.5 Non-response
Non-responses have not been included in the analysis. Therefore, throughout this report, unless
explicitly stated as a subpopulation, overall results exclude those who did not respond to a
particular question.
Canadian University Survey Consortium 8
2012 Survey of Graduating StudentsJune 2012
2.0 Profile of graduating students
In this section, we provide a profile of graduating students who participated in the survey.
2.1 Student profile
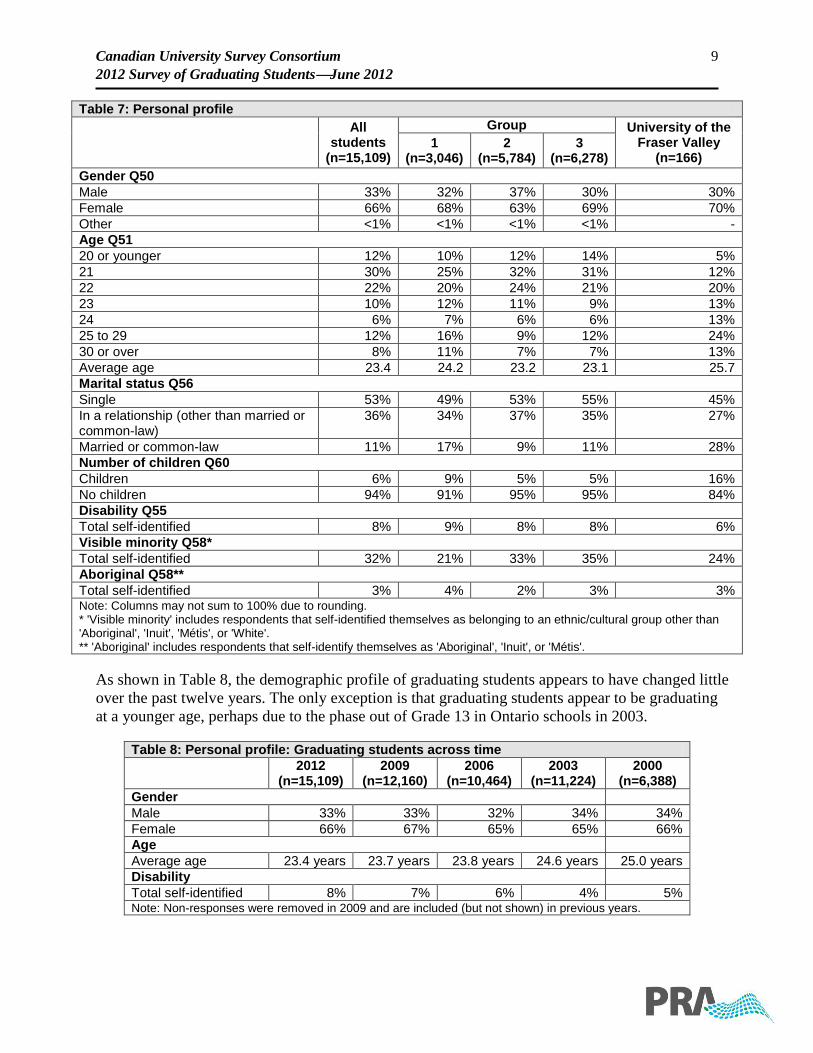
Results in Table 7 show the following:
► Among respondents, graduating students are twice as likely to be women (66%) as men
(33%). Although the sample slightly over represents female graduating students, it
reflects the fact that more women than men graduate from university. It is also important
to note that there are a few statistically significant differences between our female and
male respondents; differences that are statistically significant are discussed throughout
this report.
► While the typical graduating student is just over 23 years of age, 3 students in 4 are 23
years of age or younger. Given that most students are under 23 years of age, it is not
surprising only 6% have children
► More than half of students are single (53%). About 2 in 5 are in a relationship (36%), not
including those who are married or common-law (11%).
► Almost 1 student in 10 (8%) self-reports having some type of disability, most often a
mental health (3%) or learning (2%) disability.
► About 1 in 3 students (32%) self-identify as belonging to an ethnic or cultural group.
Among minority students, the largest proportion is Chinese (28%) students. Other ethnic
groups with sizeable representation among respondents include South Asian (20%) and
Black (14%). Group 1 universities (21%) have a lower proportion of visible minority
students compared to Group 2 (33%) and Group 3 (35%) universities, although this
difference is not statistically significant.
► A few students (3%) identify themselves as First Nation(s), Métis, Inuit, or Non-Status
Aboriginal people.
Canadian University Survey Consortium 9
2012 Survey of Graduating StudentsJune 2012
Table 7: Personal profile
All
students (n=15,109)
Group University of the Fraser Valley
(n=166) 1
(n=3,046) 2
(n=5,784) 3
(n=6,278)
Gender Q50
Male 33% 32% 37% 30% 30%
Female 66% 68% 63% 69% 70%
Other <1% <1% <1% <1% -
Age Q51
20 or younger 12% 10% 12% 14% 5%
21 30% 25% 32% 31% 12%
22 22% 20% 24% 21% 20%
23 10% 12% 11% 9% 13%
24 6% 7% 6% 6% 13%
25 to 29 12% 16% 9% 12% 24%
30 or over 8% 11% 7% 7% 13%
Average age 23.4 24.2 23.2 23.1 25.7
Marital status Q56
Single 53% 49% 53% 55% 45%
In a relationship (other than married or common-law)
36% 34% 37% 35% 27%
Married or common-law 11% 17% 9% 11% 28%
Number of children Q60
Children 6% 9% 5% 5% 16%
No children 94% 91% 95% 95% 84%
Disability Q55
Total self-identified 8% 9% 8% 8% 6%
Visible minority Q58*
Total self-identified 32% 21% 33% 35% 24%
Aboriginal Q58**
Total self-identified 3% 4% 2% 3% 3% Note: Columns may not sum to 100% due to rounding. * 'Visible minority' includes respondents that self-identified themselves as belonging to an ethnic/cultural group other than 'Aboriginal', 'Inuit', 'Métis', or 'White'. ** 'Aboriginal' includes respondents that self-identify themselves as 'Aboriginal', 'Inuit', or 'Métis'.
As shown in Table 8, the demographic profile of graduating students appears to have changed little
over the past twelve years. The only exception is that graduating students appear to be graduating
at a younger age, perhaps due to the phase out of Grade 13 in Ontario schools in 2003.
Table 8: Personal profile: Graduating students across time
2012
(n=15,109) 2009
(n=12,160) 2006
(n=10,464) 2003
(n=11,224) 2000
(n=6,388)
Gender
Male 33% 33% 32% 34% 34%
Female 66% 67% 65% 65% 66%
Age
Average age 23.4 years 23.7 years 23.8 years 24.6 years 25.0 years
Disability
Total self-identified 8% 7% 6% 4% 5% Note: Non-responses were removed in 2009 and are included (but not shown) in previous years.
Canadian University Survey Consortium 10
2012 Survey of Graduating StudentsJune 2012
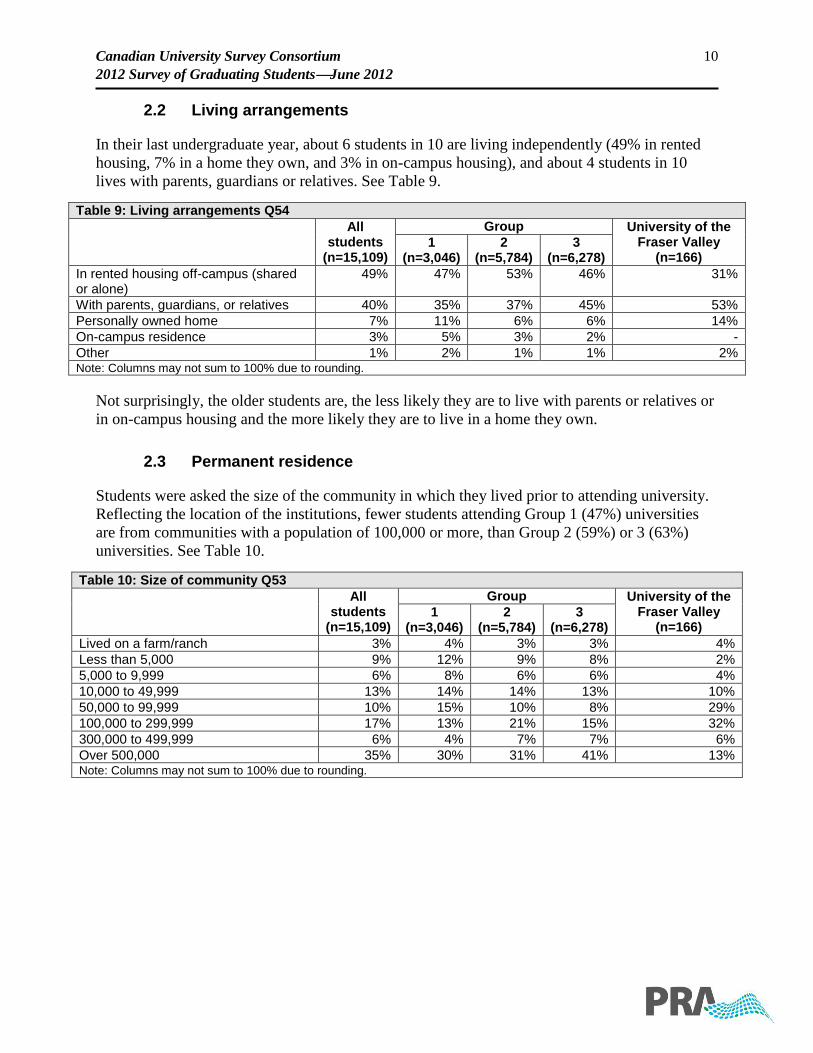
2.2 Living arrangements
In their last undergraduate year, about 6 students in 10 are living independently (49% in rented
housing, 7% in a home they own, and 3% in on-campus housing), and about 4 students in 10
lives with parents, guardians or relatives. See Table 9.
Table 9: Living arrangements Q54
All students
(n=15,109)
Group University of the Fraser Valley
(n=166) 1
(n=3,046) 2
(n=5,784) 3
(n=6,278)
In rented housing off-campus (shared or alone)
49% 47% 53% 46% 31%
With parents, guardians, or relatives 40% 35% 37% 45% 53%
Personally owned home 7% 11% 6% 6% 14%
On-campus residence 3% 5% 3% 2% -
Other 1% 2% 1% 1% 2% Note: Columns may not sum to 100% due to rounding.
Not surprisingly, the older students are, the less likely they are to live with parents or relatives or
in on-campus housing and the more likely they are to live in a home they own.
2.3 Permanent residence
Students were asked the size of the community in which they lived prior to attending university.
Reflecting the location of the institutions, fewer students attending Group 1 (47%) universities
are from communities with a population of 100,000 or more, than Group 2 (59%) or 3 (63%)
universities. See Table 10.
Table 10: Size of community Q53
All
students (n=15,109)
Group University of the Fraser Valley
(n=166) 1
(n=3,046) 2
(n=5,784) 3
(n=6,278)
Lived on a farm/ranch 3% 4% 3% 3% 4%
Less than 5,000 9% 12% 9% 8% 2%
5,000 to 9,999 6% 8% 6% 6% 4%
10,000 to 49,999 13% 14% 14% 13% 10%
50,000 to 99,999 10% 15% 10% 8% 29%
100,000 to 299,999 17% 13% 21% 15% 32%
300,000 to 499,999 6% 4% 7% 7% 6%
Over 500,000 35% 30% 31% 41% 13% Note: Columns may not sum to 100% due to rounding.
Canadian University Survey Consortium 11
2012 Survey of Graduating StudentsJune 2012
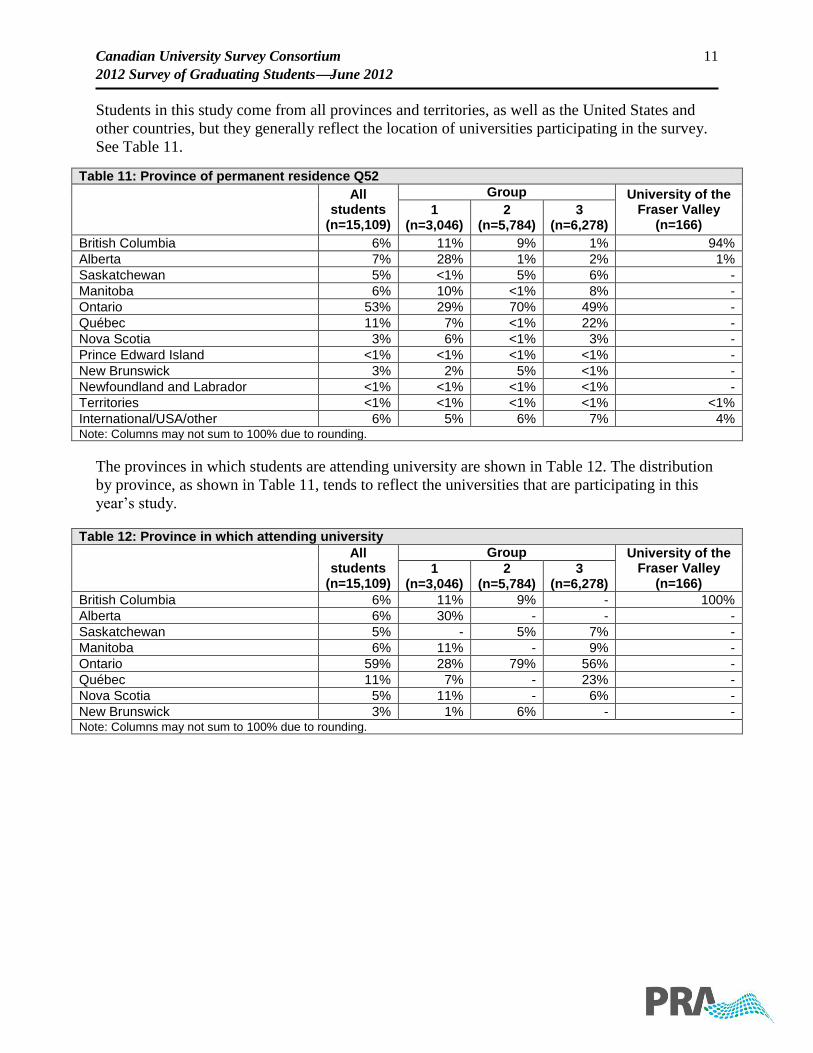
Students in this study come from all provinces and territories, as well as the United States and
other countries, but they generally reflect the location of universities participating in the survey.
See Table 11.
Table 11: Province of permanent residence Q52
All
students (n=15,109)
Group University of the Fraser Valley
(n=166) 1
(n=3,046) 2
(n=5,784) 3
(n=6,278)
British Columbia 6% 11% 9% 1% 94%
Alberta 7% 28% 1% 2% 1%
Saskatchewan 5% <1% 5% 6% -
Manitoba 6% 10% <1% 8% -
Ontario 53% 29% 70% 49% -
Québec 11% 7% <1% 22% -
Nova Scotia 3% 6% <1% 3% -
Prince Edward Island <1% <1% <1% <1% -
New Brunswick 3% 2% 5% <1% -
Newfoundland and Labrador <1% <1% <1% <1% -
Territories <1% <1% <1% <1% <1%
International/USA/other 6% 5% 6% 7% 4% Note: Columns may not sum to 100% due to rounding.
The provinces in which students are attending university are shown in Table 12. The distribution
by province, as shown in Table 11, tends to reflect the universities that are participating in this
year’s study.
Table 12: Province in which attending university
All
students (n=15,109)
Group University of the Fraser Valley
(n=166) 1
(n=3,046) 2
(n=5,784) 3
(n=6,278)
British Columbia 6% 11% 9% - 100%
Alberta 6% 30% - - -
Saskatchewan 5% - 5% 7% -
Manitoba 6% 11% - 9% -
Ontario 59% 28% 79% 56% -
Québec 11% 7% - 23% -
Nova Scotia 5% 11% - 6% -
New Brunswick 3% 1% 6% - - Note: Columns may not sum to 100% due to rounding.
Canadian University Survey Consortium 12
2012 Survey of Graduating StudentsJune 2012
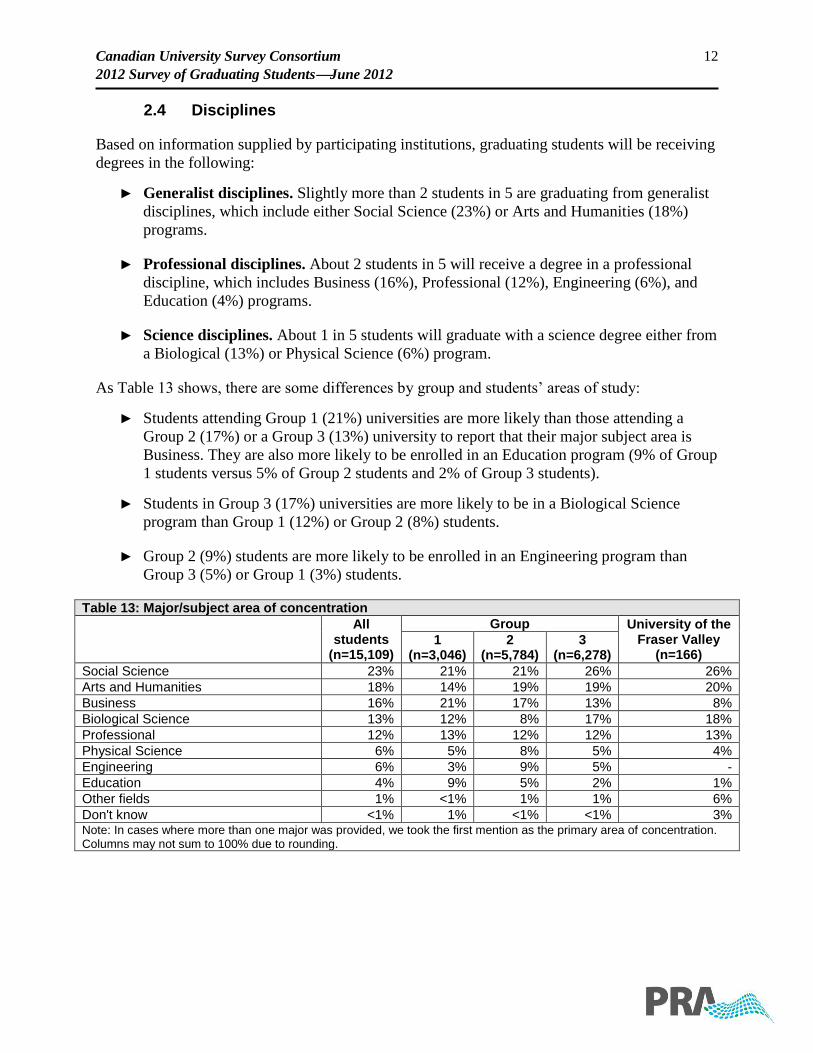
2.4 Disciplines
Based on information supplied by participating institutions, graduating students will be receiving
degrees in the following:
► Generalist disciplines. Slightly more than 2 students in 5 are graduating from generalist
disciplines, which include either Social Science (23%) or Arts and Humanities (18%)
programs.
► Professional disciplines. About 2 students in 5 will receive a degree in a professional
discipline, which includes Business (16%), Professional (12%), Engineering (6%), and
Education (4%) programs.
► Science disciplines. About 1 in 5 students will graduate with a science degree either from
a Biological (13%) or Physical Science (6%) program.
As Table 13 shows, there are some differences by group and students’ areas of study:
► Students attending Group 1 (21%) universities are more likely than those attending a
Group 2 (17%) or a Group 3 (13%) university to report that their major subject area is
Business. They are also more likely to be enrolled in an Education program (9% of Group
1 students versus 5% of Group 2 students and 2% of Group 3 students).
► Students in Group 3 (17%) universities are more likely to be in a Biological Science
program than Group 1 (12%) or Group 2 (8%) students.
► Group 2 (9%) students are more likely to be enrolled in an Engineering program than
Group 3 (5%) or Group 1 (3%) students.
Table 13: Major/subject area of concentration
All
students (n=15,109)
Group University of the Fraser Valley
(n=166) 1
(n=3,046) 2
(n=5,784) 3
(n=6,278)
Social Science 23% 21% 21% 26% 26%
Arts and Humanities 18% 14% 19% 19% 20%
Business 16% 21% 17% 13% 8%
Biological Science 13% 12% 8% 17% 18%
Professional 12% 13% 12% 12% 13%
Physical Science 6% 5% 8% 5% 4%
Engineering 6% 3% 9% 5% -
Education 4% 9% 5% 2% 1%
Other fields 1% <1% 1% 1% 6%
Don't know <1% 1% <1% <1% 3% Note: In cases where more than one major was provided, we took the first mention as the primary area of concentration. Columns may not sum to 100% due to rounding.
Canadian University Survey Consortium 13
2012 Survey of Graduating StudentsJune 2012
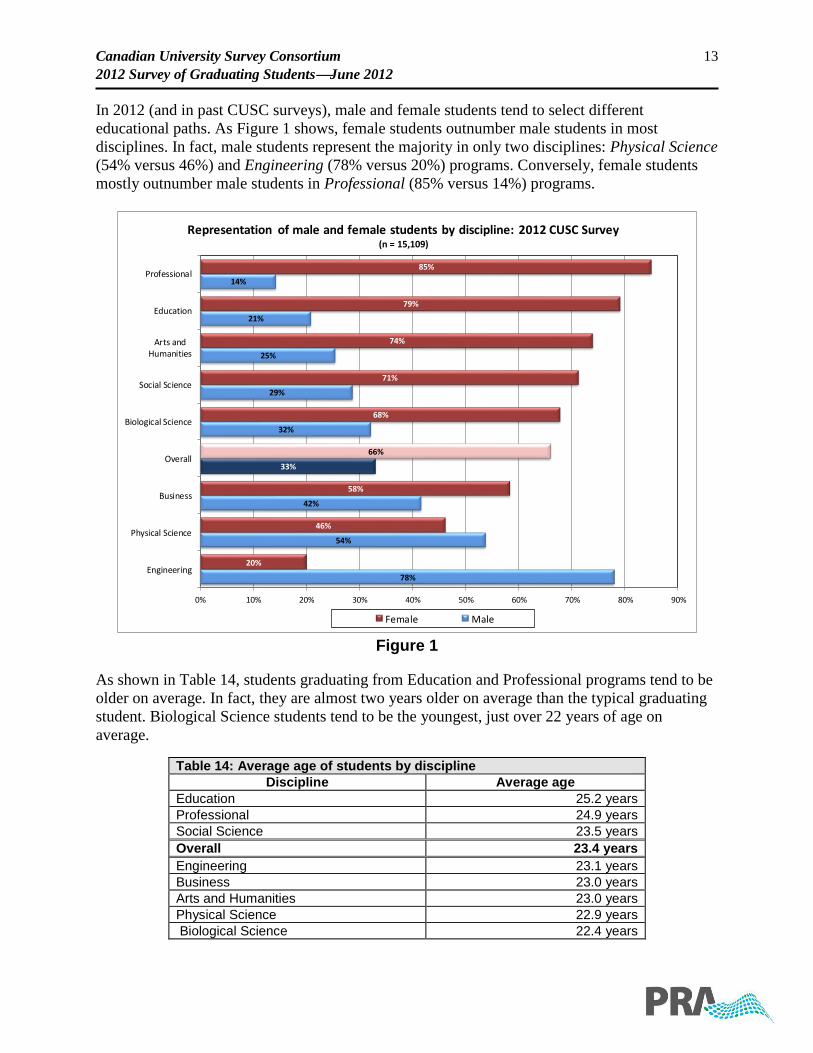
In 2012 (and in past CUSC surveys), male and female students tend to select different
educational paths. As Figure 1 shows, female students outnumber male students in most
disciplines. In fact, male students represent the majority in only two disciplines: Physical Science
(54% versus 46%) and Engineering (78% versus 20%) programs. Conversely, female students
mostly outnumber male students in Professional (85% versus 14%) programs.
78%
54%
42%
33%
32%
29%
25%
21%
14%
20%
46%
58%
66%
68%
71%
74%
79%
85%
0% 10% 20% 30% 40% 50% 60% 70% 80% 90%
Engineering
Physical Science
Business
Overall
Biological Science
Social Science
Arts andHumanities
Education
Professional
Female Male
Representation of male and female students by discipline: 2012 CUSC Survey(n = 15,109)
Figure 1
As shown in Table 14, students graduating from Education and Professional programs tend to be
older on average. In fact, they are almost two years older on average than the typical graduating
student. Biological Science students tend to be the youngest, just over 22 years of age on
average.
Table 14: Average age of students by discipline
Discipline Average age
Education 25.2 years
Professional 24.9 years
Social Science 23.5 years
Overall 23.4 years
Engineering 23.1 years
Business 23.0 years
Arts and Humanities 23.0 years
Physical Science 22.9 years
Biological Science 22.4 years
Canadian University Survey Consortium 14
2012 Survey of Graduating StudentsJune 2012
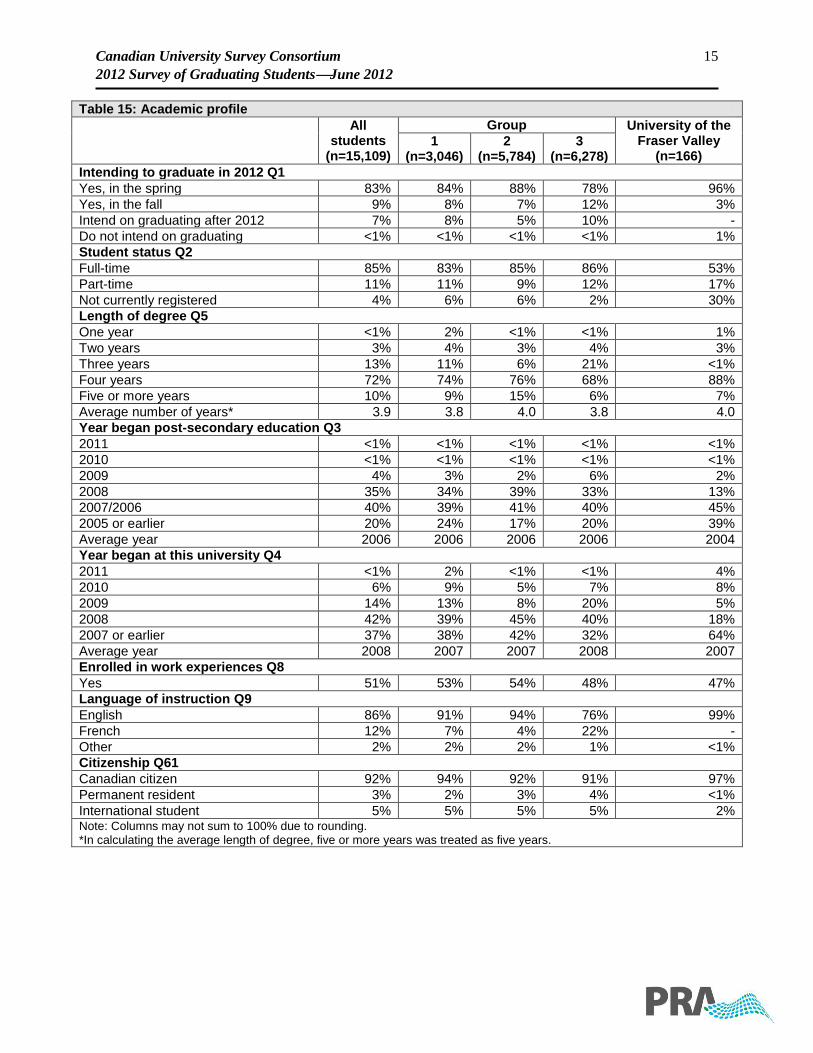
2.5 Academic profile
Examining questions related to students’ academics shows the following:
► Most students (83%) intend to graduate in the spring, with another 9% intending to
graduate in the fall. Another 7% say they do not plan on graduating in 2012.
► The vast majority (85%) of graduating students are attending full-time, although this
seems to vary by age, as older students typically are less likely to report full-time
enrolment. In fact, the proportion steadily decreases from 96% of those 20 and younger
down to 61% of those 30 and older who report they are enrolled full-time.
► Graduating students are taking programs that typically require four years to complete, as
72% report that their program typically takes four years to complete. Students attending
Group 3 (21%) universities are more likely to be enrolled in a three-year program than
Group 1 (11%) or Group 2 (6%) students.
► It appears that many students began their post-secondary education prior to attending
their current university. The typical student started his or her post-secondary studies six
years ago in 2006, but has only been attending his or her university for four years (since
about 2008).
► About half of students (51%) report being in a work experience program, most commonly
a practicum (20%), service learning (14%), or work experience (13%) program.
► Overall, 86% of students are studying in English, while 12% are studying in French.
Language of study varies by university type, as 22% of students in Group 3 universities
report that French is their primary language of study, compared to 7% of Group 1 and 4%
of Group 2 students. This difference likely reflects the location of participating
universities in these groups.
► The majority of students are Canadian citizens (92%), while 5% are international students
and another 3% are a permanent resident.
These and other findings are presented in Table 15.
Canadian University Survey Consortium 15
2012 Survey of Graduating StudentsJune 2012
Table 15: Academic profile
All
students (n=15,109)
Group University of the Fraser Valley
(n=166) 1
(n=3,046) 2
(n=5,784) 3
(n=6,278)
Intending to graduate in 2012 Q1
Yes, in the spring 83% 84% 88% 78% 96%
Yes, in the fall 9% 8% 7% 12% 3%
Intend on graduating after 2012 7% 8% 5% 10% -
Do not intend on graduating <1% <1% <1% <1% 1%
Student status Q2
Full-time 85% 83% 85% 86% 53%
Part-time 11% 11% 9% 12% 17%
Not currently registered 4% 6% 6% 2% 30%
Length of degree Q5
One year <1% 2% <1% <1% 1%
Two years 3% 4% 3% 4% 3%
Three years 13% 11% 6% 21% <1%
Four years 72% 74% 76% 68% 88%
Five or more years 10% 9% 15% 6% 7%
Average number of years* 3.9 3.8 4.0 3.8 4.0
Year began post-secondary education Q3
2011 <1% <1% <1% <1% <1%
2010 <1% <1% <1% <1% <1%
2009 4% 3% 2% 6% 2%
2008 35% 34% 39% 33% 13%
2007/2006 40% 39% 41% 40% 45%
2005 or earlier 20% 24% 17% 20% 39%
Average year 2006 2006 2006 2006 2004
Year began at this university Q4
2011 <1% 2% <1% <1% 4%
2010 6% 9% 5% 7% 8%
2009 14% 13% 8% 20% 5%
2008 42% 39% 45% 40% 18%
2007 or earlier 37% 38% 42% 32% 64%
Average year 2008 2007 2007 2008 2007
Enrolled in work experiences Q8
Yes 51% 53% 54% 48% 47%
Language of instruction Q9
English 86% 91% 94% 76% 99%
French 12% 7% 4% 22% -
Other 2% 2% 2% 1% <1%
Citizenship Q61
Canadian citizen 92% 94% 92% 91% 97%
Permanent resident 3% 2% 3% 4% <1%
International student 5% 5% 5% 5% 2% Note: Columns may not sum to 100% due to rounding. *In calculating the average length of degree, five or more years was treated as five years.
Canadian University Survey Consortium 16
2012 Survey of Graduating StudentsJune 2012
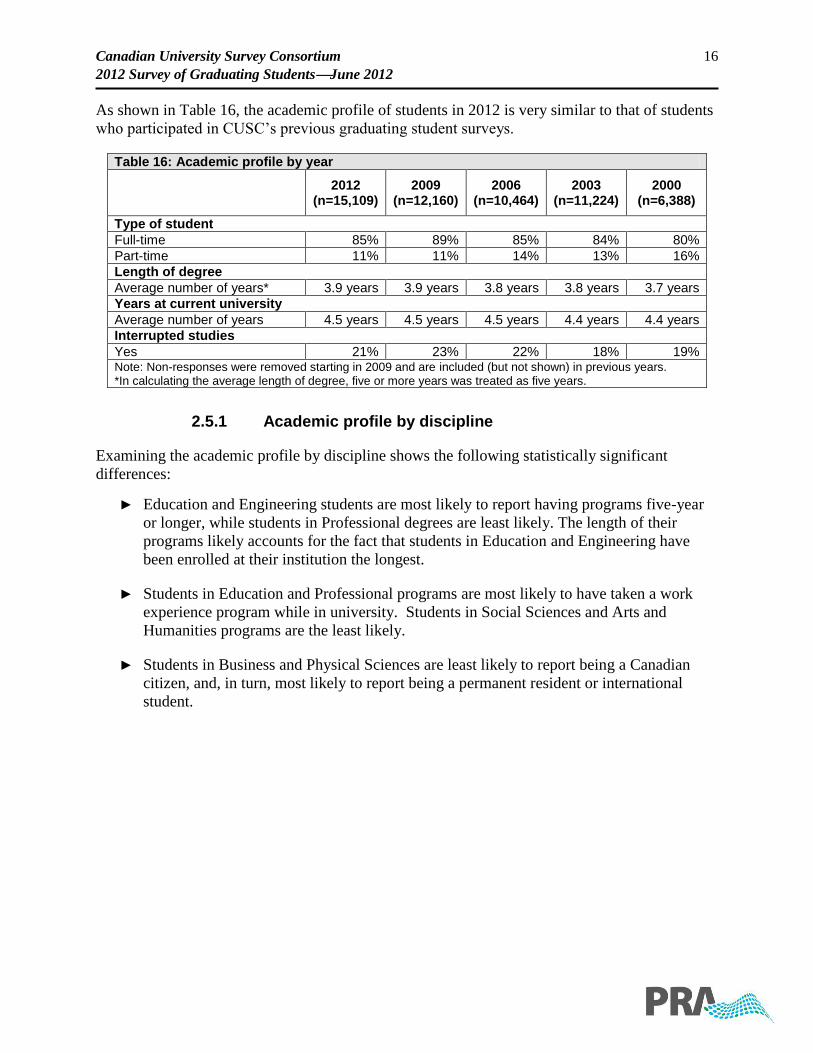
As shown in Table 16, the academic profile of students in 2012 is very similar to that of students
who participated in CUSC’s previous graduating student surveys.
Table 16: Academic profile by year
2012
(n=15,109) 2009
(n=12,160) 2006
(n=10,464) 2003
(n=11,224) 2000
(n=6,388)
Type of student
Full-time 85% 89% 85% 84% 80%
Part-time 11% 11% 14% 13% 16%
Length of degree
Average number of years* 3.9 years 3.9 years 3.8 years 3.8 years 3.7 years
Years at current university
Average number of years 4.5 years 4.5 years 4.5 years 4.4 years 4.4 years
Interrupted studies
Yes 21% 23% 22% 18% 19% Note: Non-responses were removed starting in 2009 and are included (but not shown) in previous years. *In calculating the average length of degree, five or more years was treated as five years.
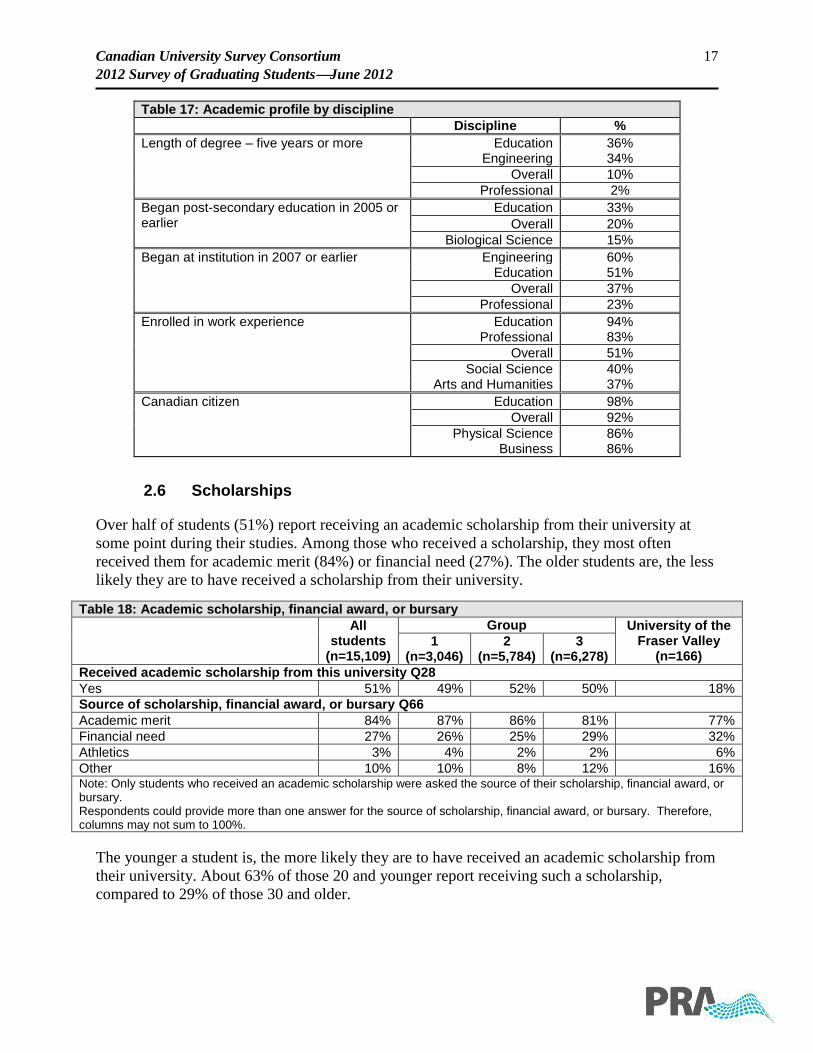
2.5.1 Academic profile by discipline
Examining the academic profile by discipline shows the following statistically significant
differences:
► Education and Engineering students are most likely to report having programs five-year
or longer, while students in Professional degrees are least likely. The length of their
programs likely accounts for the fact that students in Education and Engineering have
been enrolled at their institution the longest.
► Students in Education and Professional programs are most likely to have taken a work
experience program while in university. Students in Social Sciences and Arts and
Humanities programs are the least likely.
► Students in Business and Physical Sciences are least likely to report being a Canadian
citizen, and, in turn, most likely to report being a permanent resident or international
student.
Canadian University Survey Consortium 17
2012 Survey of Graduating StudentsJune 2012
Table 17: Academic profile by discipline
Discipline %
Length of degree – five years or more Education 36% Engineering 34%
Overall 10%
Professional 2%
Began post-secondary education in 2005 or earlier
Education 33%
Overall 20%
Biological Science 15%
Began at institution in 2007 or earlier Engineering 60% Education 51%
Overall 37%
Professional 23%
Enrolled in work experience Education 94% Professional 83%
Overall 51%
Social Science 40% Arts and Humanities 37%
Canadian citizen Education 98%
Overall 92%
Physical Science 86% Business 86%
2.6 Scholarships
Over half of students (51%) report receiving an academic scholarship from their university at
some point during their studies. Among those who received a scholarship, they most often
received them for academic merit (84%) or financial need (27%). The older students are, the less
likely they are to have received a scholarship from their university.
Table 18: Academic scholarship, financial award, or bursary
All students
(n=15,109)
Group University of the Fraser Valley
(n=166) 1
(n=3,046) 2
(n=5,784) 3
(n=6,278)
Received academic scholarship from this university Q28
Yes 51% 49% 52% 50% 18%
Source of scholarship, financial award, or bursary Q66
Academic merit 84% 87% 86% 81% 77%
Financial need 27% 26% 25% 29% 32%
Athletics 3% 4% 2% 2% 6%
Other 10% 10% 8% 12% 16% Note: Only students who received an academic scholarship were asked the source of their scholarship, financial award, or bursary. Respondents could provide more than one answer for the source of scholarship, financial award, or bursary. Therefore, columns may not sum to 100%.
The younger a student is, the more likely they are to have received an academic scholarship from
their university. About 63% of those 20 and younger report receiving such a scholarship,
compared to 29% of those 30 and older.
Canadian University Survey Consortium 18
2012 Survey of Graduating StudentsJune 2012
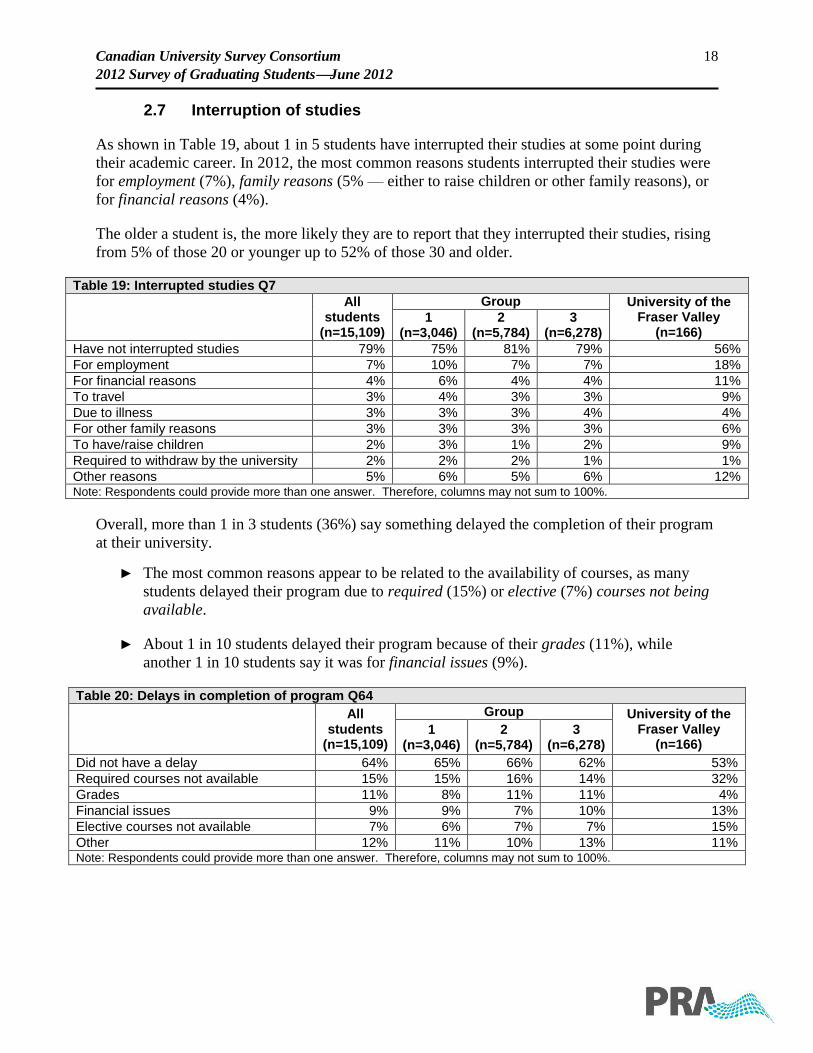
2.7 Interruption of studies
As shown in Table 19, about 1 in 5 students have interrupted their studies at some point during
their academic career. In 2012, the most common reasons students interrupted their studies were
for employment (7%), family reasons (5% — either to raise children or other family reasons), or
for financial reasons (4%).
The older a student is, the more likely they are to report that they interrupted their studies, rising
from 5% of those 20 or younger up to 52% of those 30 and older.
Table 19: Interrupted studies Q7
All students
(n=15,109)
Group University of the Fraser Valley
(n=166) 1
(n=3,046) 2
(n=5,784) 3
(n=6,278)
Have not interrupted studies 79% 75% 81% 79% 56%
For employment 7% 10% 7% 7% 18%
For financial reasons 4% 6% 4% 4% 11%
To travel 3% 4% 3% 3% 9%
Due to illness 3% 3% 3% 4% 4%
For other family reasons 3% 3% 3% 3% 6%
To have/raise children 2% 3% 1% 2% 9%
Required to withdraw by the university 2% 2% 2% 1% 1%
Other reasons 5% 6% 5% 6% 12% Note: Respondents could provide more than one answer. Therefore, columns may not sum to 100%.
Overall, more than 1 in 3 students (36%) say something delayed the completion of their program
at their university.
► The most common reasons appear to be related to the availability of courses, as many
students delayed their program due to required (15%) or elective (7%) courses not being
available.
► About 1 in 10 students delayed their program because of their grades (11%), while
another 1 in 10 students say it was for financial issues (9%).
Table 20: Delays in completion of program Q64
All
students (n=15,109)
Group University of the Fraser Valley
(n=166) 1
(n=3,046) 2
(n=5,784) 3
(n=6,278)
Did not have a delay 64% 65% 66% 62% 53%
Required courses not available 15% 15% 16% 14% 32%
Grades 11% 8% 11% 11% 4%
Financial issues 9% 9% 7% 10% 13%
Elective courses not available 7% 6% 7% 7% 15%
Other 12% 11% 10% 13% 11% Note: Respondents could provide more than one answer. Therefore, columns may not sum to 100%.
Canadian University Survey Consortium 19
2012 Survey of Graduating StudentsJune 2012
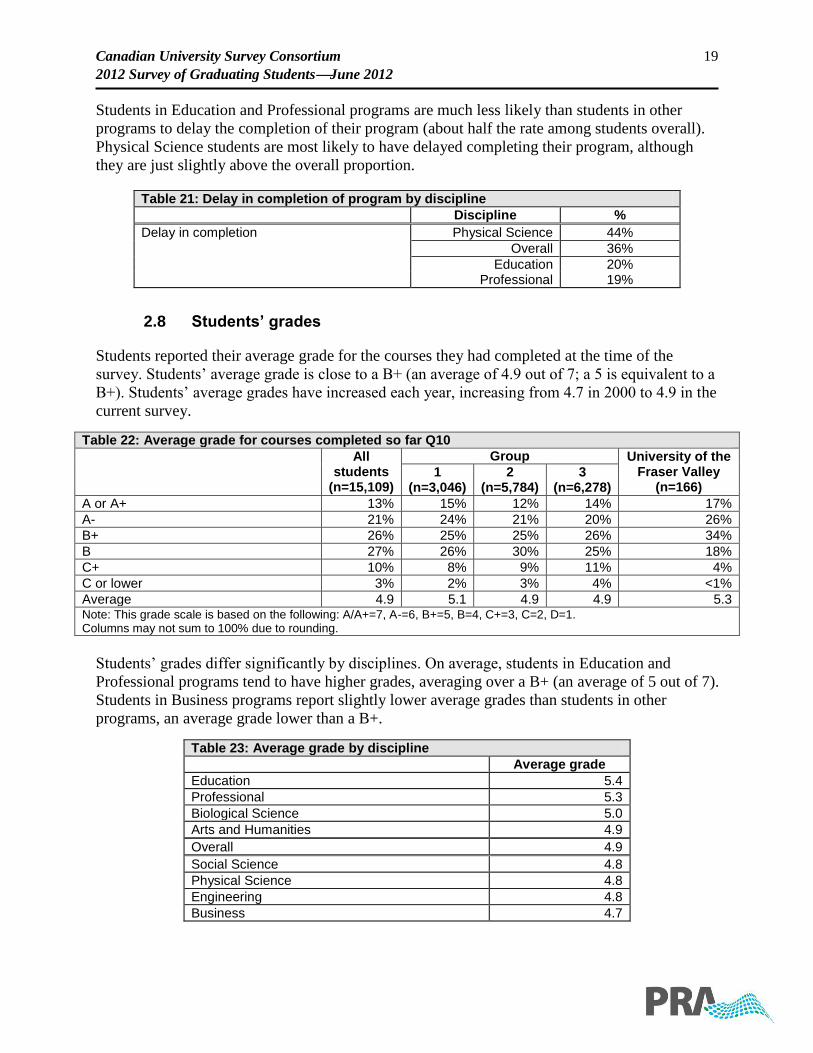
Students in Education and Professional programs are much less likely than students in other
programs to delay the completion of their program (about half the rate among students overall).
Physical Science students are most likely to have delayed completing their program, although
they are just slightly above the overall proportion.
Table 21: Delay in completion of program by discipline
Discipline %
Delay in completion Physical Science 44%
Overall 36%
Education 20% Professional 19%
2.8 Students’ grades
Students reported their average grade for the courses they had completed at the time of the
survey. Students’ average grade is close to a B+ (an average of 4.9 out of 7; a 5 is equivalent to a
B+). Students’ average grades have increased each year, increasing from 4.7 in 2000 to 4.9 in the
current survey.
Table 22: Average grade for courses completed so far Q10
All
students (n=15,109)
Group University of the Fraser Valley
(n=166) 1
(n=3,046) 2
(n=5,784) 3
(n=6,278)
A or A+ 13% 15% 12% 14% 17%
A- 21% 24% 21% 20% 26%
B+ 26% 25% 25% 26% 34%
B 27% 26% 30% 25% 18%
C+ 10% 8% 9% 11% 4%
C or lower 3% 2% 3% 4% <1%
Average 4.9 5.1 4.9 4.9 5.3 Note: This grade scale is based on the following: A/A+=7, A-=6, B+=5, B=4, C+=3, C=2, D=1. Columns may not sum to 100% due to rounding.
Students’ grades differ significantly by disciplines. On average, students in Education and
Professional programs tend to have higher grades, averaging over a B+ (an average of 5 out of 7).
Students in Business programs report slightly lower average grades than students in other
programs, an average grade lower than a B+.
Table 23: Average grade by discipline
Average grade
Education 5.4
Professional 5.3
Biological Science 5.0
Arts and Humanities 4.9
Overall 4.9
Social Science 4.8
Physical Science 4.8
Engineering 4.8
Business 4.7
Canadian University Survey Consortium 20
2012 Survey of Graduating StudentsJune 2012
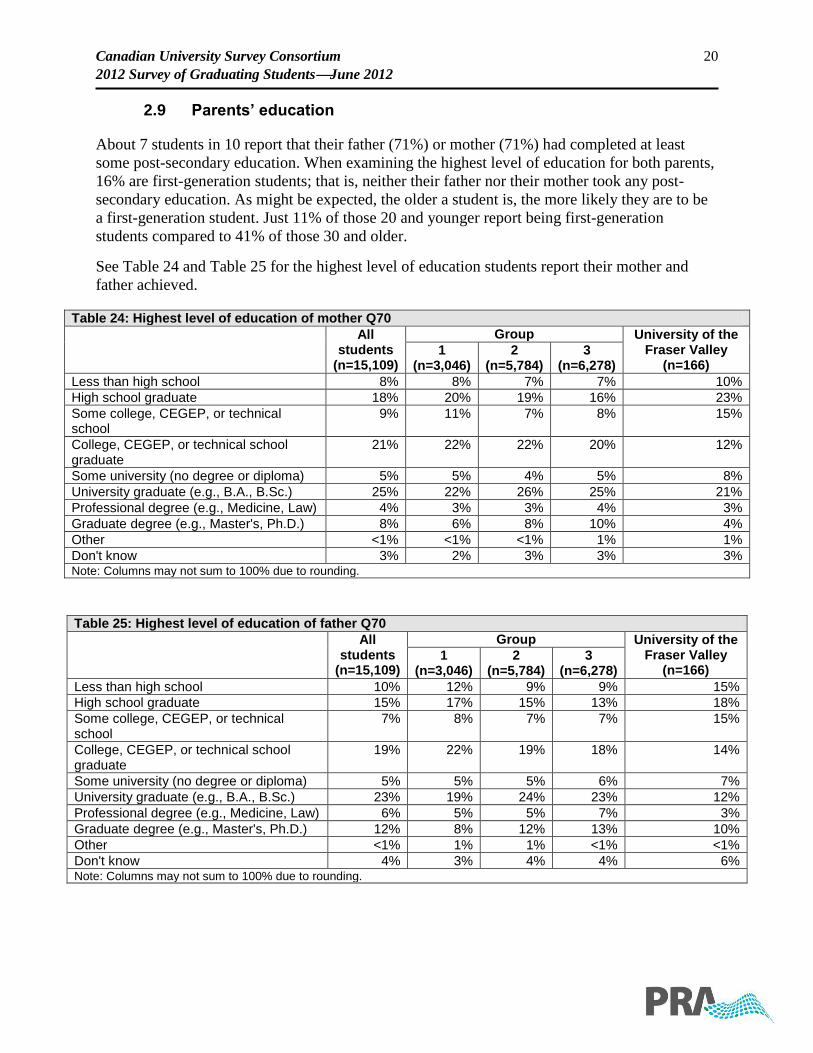
2.9 Parents’ education
About 7 students in 10 report that their father (71%) or mother (71%) had completed at least
some post-secondary education. When examining the highest level of education for both parents,
16% are first-generation students; that is, neither their father nor their mother took any post-
secondary education. As might be expected, the older a student is, the more likely they are to be
a first-generation student. Just 11% of those 20 and younger report being first-generation
students compared to 41% of those 30 and older.
See Table 24 and Table 25 for the highest level of education students report their mother and
father achieved.
Table 24: Highest level of education of mother Q70
All
students (n=15,109)
Group University of the Fraser Valley
(n=166) 1
(n=3,046) 2
(n=5,784) 3
(n=6,278)
Less than high school 8% 8% 7% 7% 10%
High school graduate 18% 20% 19% 16% 23%
Some college, CEGEP, or technical school
9% 11% 7% 8% 15%
College, CEGEP, or technical school graduate
21% 22% 22% 20% 12%
Some university (no degree or diploma) 5% 5% 4% 5% 8%
University graduate (e.g., B.A., B.Sc.) 25% 22% 26% 25% 21%
Professional degree (e.g., Medicine, Law) 4% 3% 3% 4% 3%
Graduate degree (e.g., Master's, Ph.D.) 8% 6% 8% 10% 4%
Other <1% <1% <1% 1% 1%
Don't know 3% 2% 3% 3% 3% Note: Columns may not sum to 100% due to rounding.
Table 25: Highest level of education of father Q70
All
students (n=15,109)
Group University of the Fraser Valley
(n=166) 1
(n=3,046) 2
(n=5,784) 3
(n=6,278)
Less than high school 10% 12% 9% 9% 15%
High school graduate 15% 17% 15% 13% 18%
Some college, CEGEP, or technical school
7% 8% 7% 7% 15%
College, CEGEP, or technical school graduate
19% 22% 19% 18% 14%
Some university (no degree or diploma) 5% 5% 5% 6% 7%
University graduate (e.g., B.A., B.Sc.) 23% 19% 24% 23% 12%
Professional degree (e.g., Medicine, Law) 6% 5% 5% 7% 3%
Graduate degree (e.g., Master's, Ph.D.) 12% 8% 12% 13% 10%
Other <1% 1% 1% <1% <1%
Don't know 4% 3% 4% 4% 6% Note: Columns may not sum to 100% due to rounding.
Canadian University Survey Consortium 21
2012 Survey of Graduating StudentsJune 2012
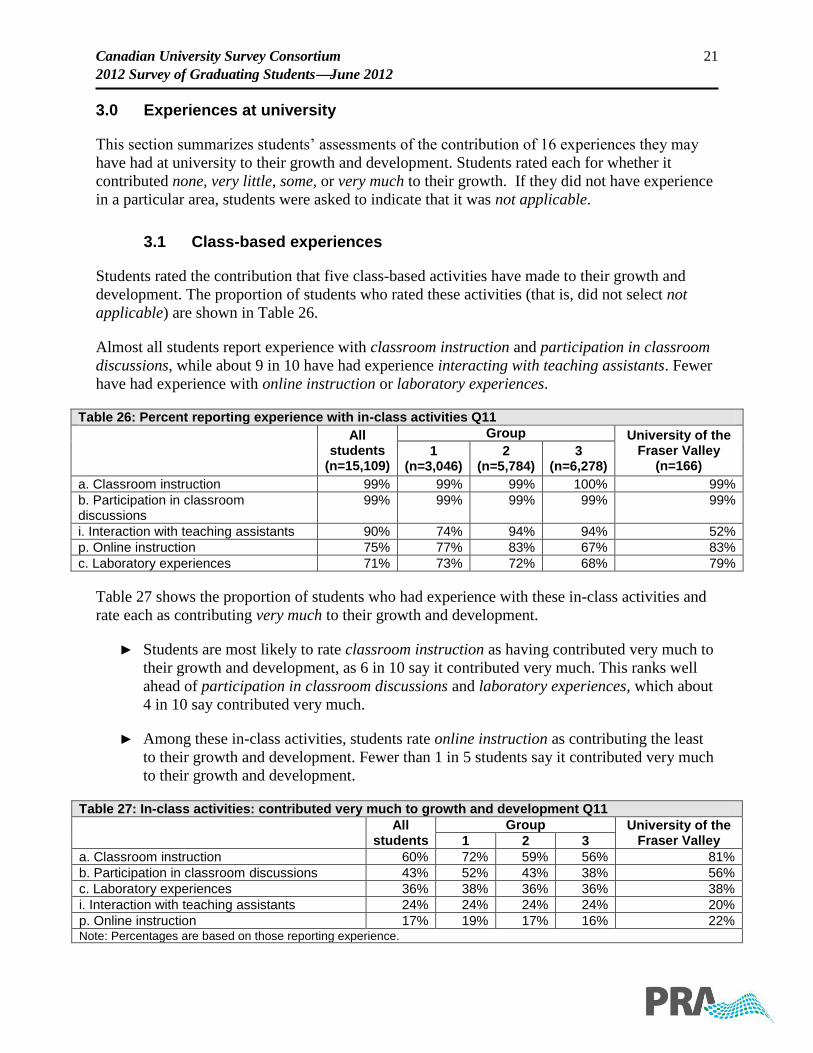
3.0 Experiences at university
This section summarizes students’ assessments of the contribution of 16 experiences they may
have had at university to their growth and development. Students rated each for whether it
contributed none, very little, some, or very much to their growth. If they did not have experience
in a particular area, students were asked to indicate that it was not applicable.
3.1 Class-based experiences
Students rated the contribution that five class-based activities have made to their growth and
development. The proportion of students who rated these activities (that is, did not select not
applicable) are shown in Table 26.
Almost all students report experience with classroom instruction and participation in classroom
discussions, while about 9 in 10 have had experience interacting with teaching assistants. Fewer
have had experience with online instruction or laboratory experiences.
Table 26: Percent reporting experience with in-class activities Q11
All
students (n=15,109)
Group University of the Fraser Valley
(n=166) 1
(n=3,046) 2
(n=5,784) 3
(n=6,278)
a. Classroom instruction 99% 99% 99% 100% 99%
b. Participation in classroom discussions
99% 99% 99% 99% 99%
i. Interaction with teaching assistants 90% 74% 94% 94% 52%
p. Online instruction 75% 77% 83% 67% 83%
c. Laboratory experiences 71% 73% 72% 68% 79%
Table 27 shows the proportion of students who had experience with these in-class activities and
rate each as contributing very much to their growth and development.
► Students are most likely to rate classroom instruction as having contributed very much to
their growth and development, as 6 in 10 say it contributed very much. This ranks well
ahead of participation in classroom discussions and laboratory experiences, which about
4 in 10 say contributed very much.
► Among these in-class activities, students rate online instruction as contributing the least
to their growth and development. Fewer than 1 in 5 students say it contributed very much
to their growth and development.
Table 27: In-class activities: contributed very much to growth and development Q11
All students
Group University of the Fraser Valley 1 2 3
a. Classroom instruction 60% 72% 59% 56% 81%
b. Participation in classroom discussions 43% 52% 43% 38% 56%
c. Laboratory experiences 36% 38% 36% 36% 38%
i. Interaction with teaching assistants 24% 24% 24% 24% 20%
p. Online instruction 17% 19% 17% 16% 22% Note: Percentages are based on those reporting experience.
Canadian University Survey Consortium 22
2012 Survey of Graduating StudentsJune 2012
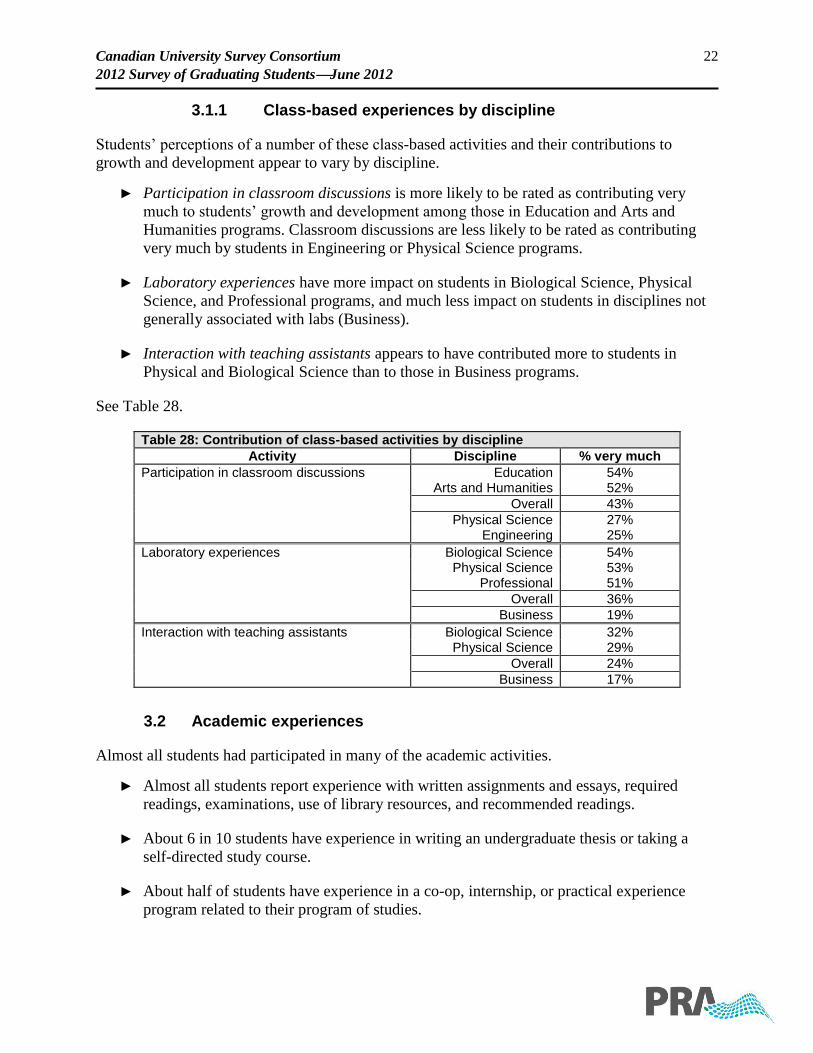
3.1.1 Class-based experiences by discipline
Students’ perceptions of a number of these class-based activities and their contributions to
growth and development appear to vary by discipline.
► Participation in classroom discussions is more likely to be rated as contributing very
much to students’ growth and development among those in Education and Arts and
Humanities programs. Classroom discussions are less likely to be rated as contributing
very much by students in Engineering or Physical Science programs.
► Laboratory experiences have more impact on students in Biological Science, Physical
Science, and Professional programs, and much less impact on students in disciplines not
generally associated with labs (Business).
► Interaction with teaching assistants appears to have contributed more to students in
Physical and Biological Science than to those in Business programs.
See Table 28.
Table 28: Contribution of class-based activities by discipline
Activity Discipline % very much
Participation in classroom discussions Education 54% Arts and Humanities 52%
Overall 43%
Physical Science 27% Engineering 25%
Laboratory experiences Biological Science 54% Physical Science 53% Professional 51%
Overall 36%
Business 19%
Interaction with teaching assistants Biological Science 32% Physical Science 29%
Overall 24%
Business 17%
3.2 Academic experiences
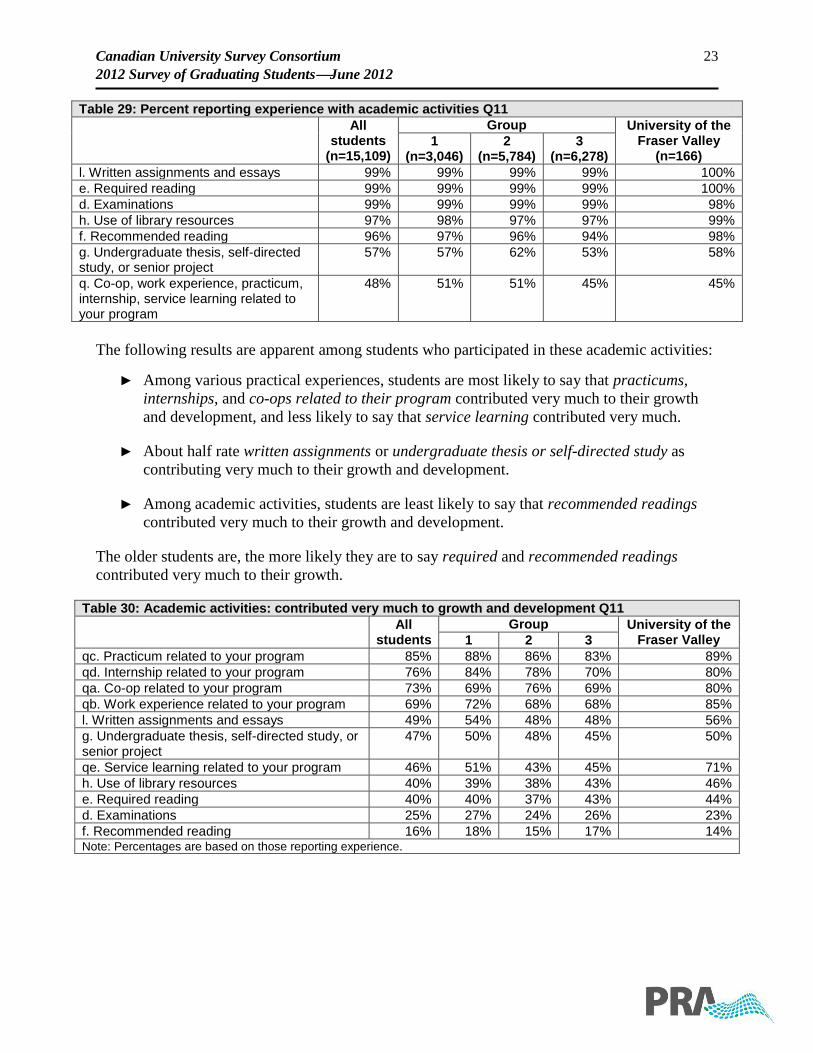
Almost all students had participated in many of the academic activities.
► Almost all students report experience with written assignments and essays, required
readings, examinations, use of library resources, and recommended readings.
► About 6 in 10 students have experience in writing an undergraduate thesis or taking a
self-directed study course.
► About half of students have experience in a co-op, internship, or practical experience
program related to their program of studies.
Canadian University Survey Consortium 23
2012 Survey of Graduating StudentsJune 2012
Table 29: Percent reporting experience with academic activities Q11
All
students (n=15,109)
Group University of the Fraser Valley
(n=166) 1
(n=3,046) 2
(n=5,784) 3
(n=6,278)
l. Written assignments and essays 99% 99% 99% 99% 100%
e. Required reading 99% 99% 99% 99% 100%
d. Examinations 99% 99% 99% 99% 98%
h. Use of library resources 97% 98% 97% 97% 99%
f. Recommended reading 96% 97% 96% 94% 98%
g. Undergraduate thesis, self-directed study, or senior project
57% 57% 62% 53% 58%
q. Co-op, work experience, practicum, internship, service learning related to your program
48% 51% 51% 45% 45%
The following results are apparent among students who participated in these academic activities:
► Among various practical experiences, students are most likely to say that practicums,
internships, and co-ops related to their program contributed very much to their growth
and development, and less likely to say that service learning contributed very much.
► About half rate written assignments or undergraduate thesis or self-directed study as
contributing very much to their growth and development.
► Among academic activities, students are least likely to say that recommended readings
contributed very much to their growth and development.
The older students are, the more likely they are to say required and recommended readings
contributed very much to their growth.
Table 30: Academic activities: contributed very much to growth and development Q11
All
students
Group University of the Fraser Valley 1 2 3
qc. Practicum related to your program 85% 88% 86% 83% 89%
qd. Internship related to your program 76% 84% 78% 70% 80%
qa. Co-op related to your program 73% 69% 76% 69% 80%
qb. Work experience related to your program 69% 72% 68% 68% 85%
l. Written assignments and essays 49% 54% 48% 48% 56%
g. Undergraduate thesis, self-directed study, or senior project
47% 50% 48% 45% 50%
qe. Service learning related to your program 46% 51% 43% 45% 71%
h. Use of library resources 40% 39% 38% 43% 46%
e. Required reading 40% 40% 37% 43% 44%
d. Examinations 25% 27% 24% 26% 23%
f. Recommended reading 16% 18% 15% 17% 14% Note: Percentages are based on those reporting experience.

Canadian University Survey Consortium 24
2012 Survey of Graduating StudentsJune 2012
3.2.1 Academic activities by discipline
Students’ perceptions of the impact that various academic activities had on their growth and
development appear to vary by discipline.
► Written assignments and essays. Arts and Humanities and Social Science students are
most likely to say that written assignments contributed very much to their growth.
Students in Physical Science and Engineering programs are least likely to say that written
assignments contributed very much.
► Undergraduate thesis, self-directed study, or senior project. Students in Professional, or
Education programs are the least likely to say that a thesis contributed very much to their
growth, while those in Biological Science or Engineering are the most likely.
► Required readings. Students in Arts and Humanities programs are the most likely to say
that required readings contributed very much to their growth and development. Those in
Engineering or Education programs are the least likely.
► Use of library resources. Those in Arts and Humanities or Social Science programs are
most likely to rate their use of library resources as contributing very much to their
growth, while students in Physical Science and Engineering programs are least likely.
► Examinations. Engineering students value the contribution examinations had on their
growth and development much more than students in other programs. Arts and
Humanities and Education students are the least likely.
Table 31 shows these results.
Table 31: Contribution of academic activities by discipline
Activity Discipline Very much
Written assignments and essays Arts and Humanities 59% Social Science 57%
Overall 49%
Physical Science 37% Engineering 37%
Undergraduate thesis, self-directed study, or senior project
Biological Science 58%
Engineering 56%
Overall 47%
Professional 37% Education 35%
Required readings Arts and Humanities 50%
Overall 40%
Education 29% Engineering 26%
Use of library resources Arts and Humanities 50% Social Science 48%
Overall 40%
Physical Science 27% Engineering 24%
Examinations Engineering 34%
Overall 25%
Arts and Humanities 17% Education 13%
Canadian University Survey Consortium 25
2012 Survey of Graduating StudentsJune 2012
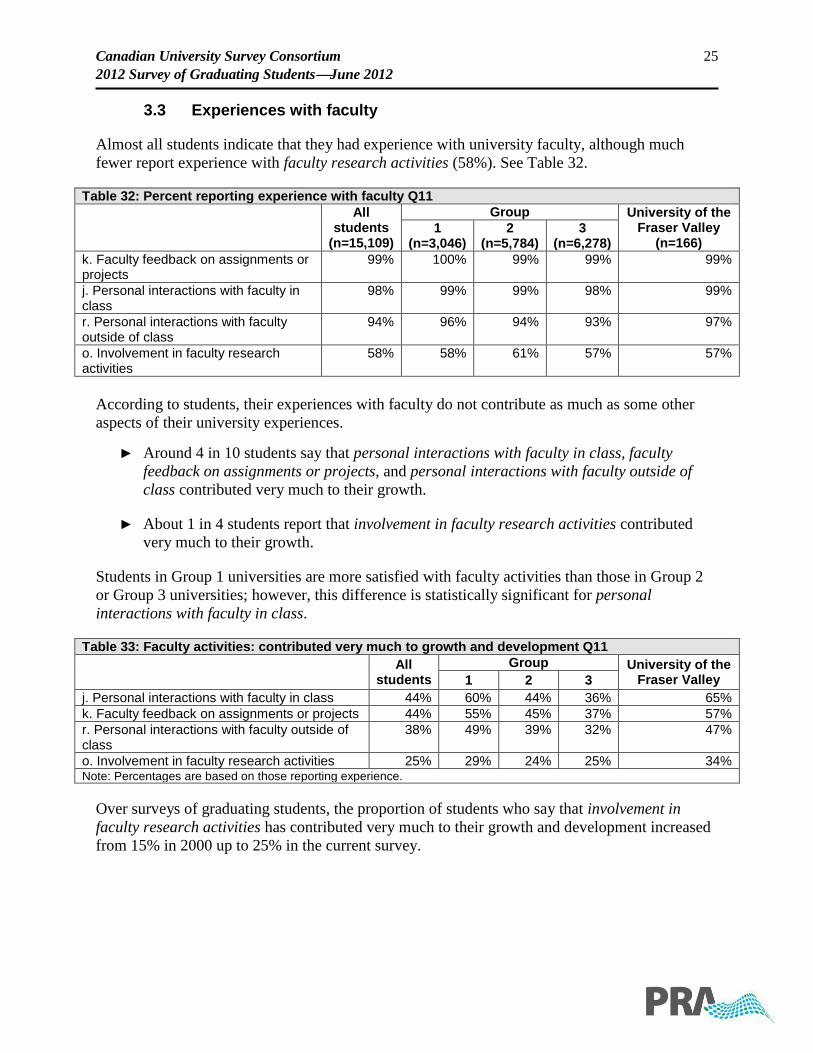
3.3 Experiences with faculty
Almost all students indicate that they had experience with university faculty, although much
fewer report experience with faculty research activities (58%). See Table 32.
Table 32: Percent reporting experience with faculty Q11
All
students (n=15,109)
Group University of the Fraser Valley
(n=166) 1
(n=3,046) 2
(n=5,784) 3
(n=6,278)
k. Faculty feedback on assignments or projects
99% 100% 99% 99% 99%
j. Personal interactions with faculty in class
98% 99% 99% 98% 99%
r. Personal interactions with faculty outside of class
94% 96% 94% 93% 97%
o. Involvement in faculty research activities
58% 58% 61% 57% 57%
According to students, their experiences with faculty do not contribute as much as some other
aspects of their university experiences.
► Around 4 in 10 students say that personal interactions with faculty in class, faculty
feedback on assignments or projects, and personal interactions with faculty outside of
class contributed very much to their growth.
► About 1 in 4 students report that involvement in faculty research activities contributed
very much to their growth.
Students in Group 1 universities are more satisfied with faculty activities than those in Group 2
or Group 3 universities; however, this difference is statistically significant for personal
interactions with faculty in class.
Table 33: Faculty activities: contributed very much to growth and development Q11
All
students
Group University of the Fraser Valley 1 2 3
j. Personal interactions with faculty in class 44% 60% 44% 36% 65%
k. Faculty feedback on assignments or projects 44% 55% 45% 37% 57%
r. Personal interactions with faculty outside of class
38% 49% 39% 32% 47%
o. Involvement in faculty research activities 25% 29% 24% 25% 34% Note: Percentages are based on those reporting experience.
Over surveys of graduating students, the proportion of students who say that involvement in
faculty research activities has contributed very much to their growth and development increased
from 15% in 2000 up to 25% in the current survey.
Canadian University Survey Consortium 26
2012 Survey of Graduating StudentsJune 2012
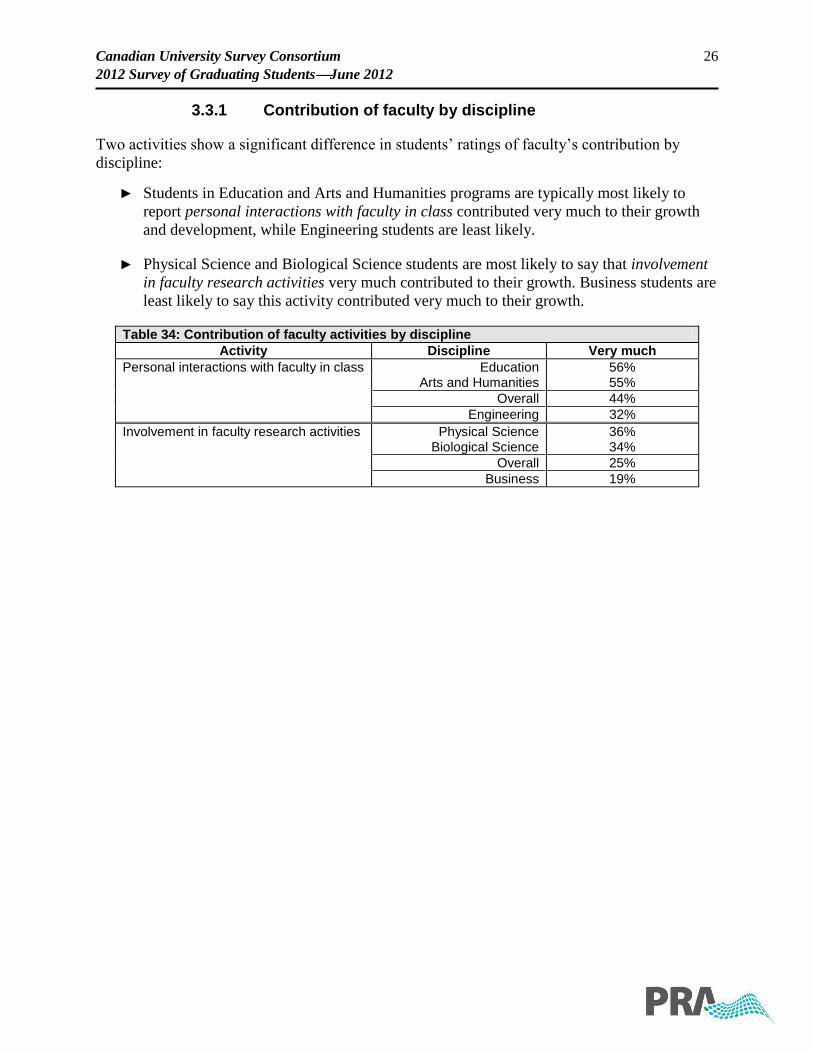
3.3.1 Contribution of faculty by discipline
Two activities show a significant difference in students’ ratings of faculty’s contribution by
discipline:
► Students in Education and Arts and Humanities programs are typically most likely to
report personal interactions with faculty in class contributed very much to their growth
and development, while Engineering students are least likely.
► Physical Science and Biological Science students are most likely to say that involvement
in faculty research activities very much contributed to their growth. Business students are
least likely to say this activity contributed very much to their growth.
Table 34: Contribution of faculty activities by discipline
Activity Discipline Very much
Personal interactions with faculty in class Education 56% Arts and Humanities 55%
Overall 44%
Engineering 32%
Involvement in faculty research activities Physical Science 36% Biological Science 34%
Overall 25%
Business 19%
Canadian University Survey Consortium 27
2012 Survey of Graduating StudentsJune 2012
4.0 Extracurricular activities
This section summarizes the impact that 17 extracurricular activities had on students’ growth and
development. Students were first asked if they had experience with each of these activities, and
for those they had experience, they indicated whether that experience contributed none, very
little, some, or very much to their growth and development.
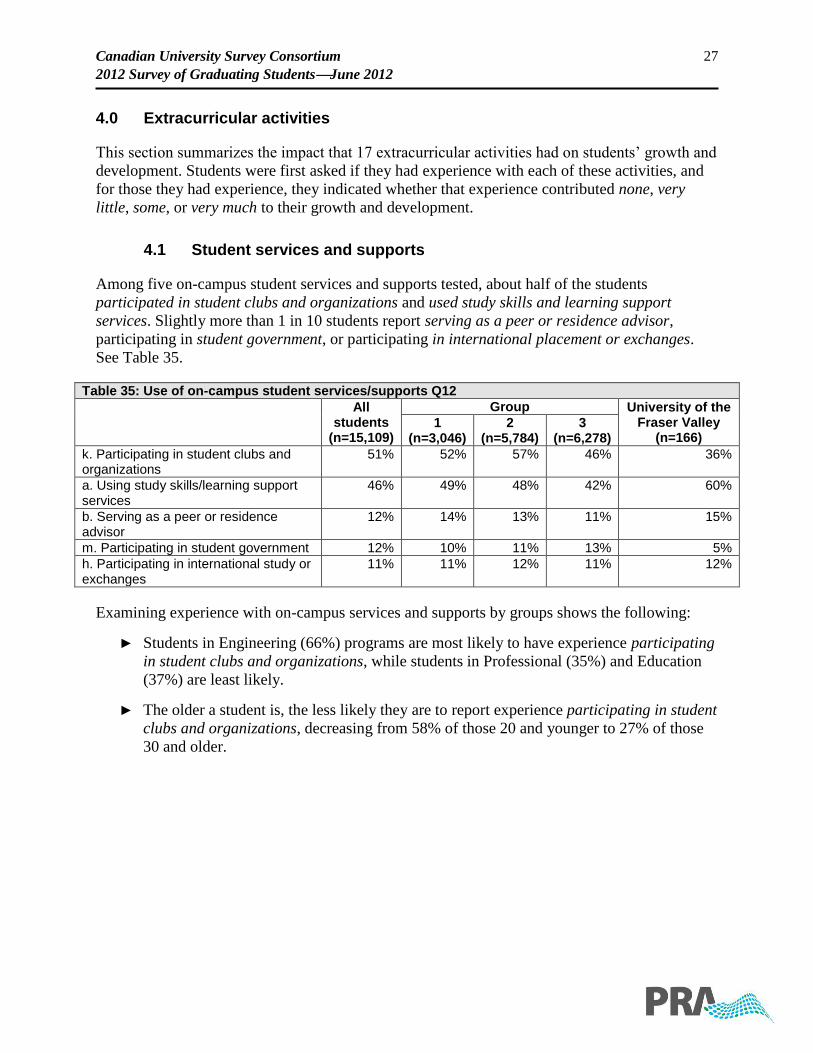
4.1 Student services and supports
Among five on-campus student services and supports tested, about half of the students
participated in student clubs and organizations and used study skills and learning support
services. Slightly more than 1 in 10 students report serving as a peer or residence advisor,
participating in student government, or participating in international placement or exchanges.
See Table 35.
Table 35: Use of on-campus student services/supports Q12
All students
(n=15,109)
Group University of the Fraser Valley
(n=166) 1
(n=3,046) 2
(n=5,784) 3
(n=6,278)
k. Participating in student clubs and organizations
51% 52% 57% 46% 36%
a. Using study skills/learning support services
46% 49% 48% 42% 60%
b. Serving as a peer or residence advisor
12% 14% 13% 11% 15%
m. Participating in student government 12% 10% 11% 13% 5%
h. Participating in international study or exchanges
11% 11% 12% 11% 12%
Examining experience with on-campus services and supports by groups shows the following:
► Students in Engineering (66%) programs are most likely to have experience participating
in student clubs and organizations, while students in Professional (35%) and Education
(37%) are least likely.
► The older a student is, the less likely they are to report experience participating in student
clubs and organizations, decreasing from 58% of those 20 and younger to 27% of those
30 and older.
Canadian University Survey Consortium 28
2012 Survey of Graduating StudentsJune 2012
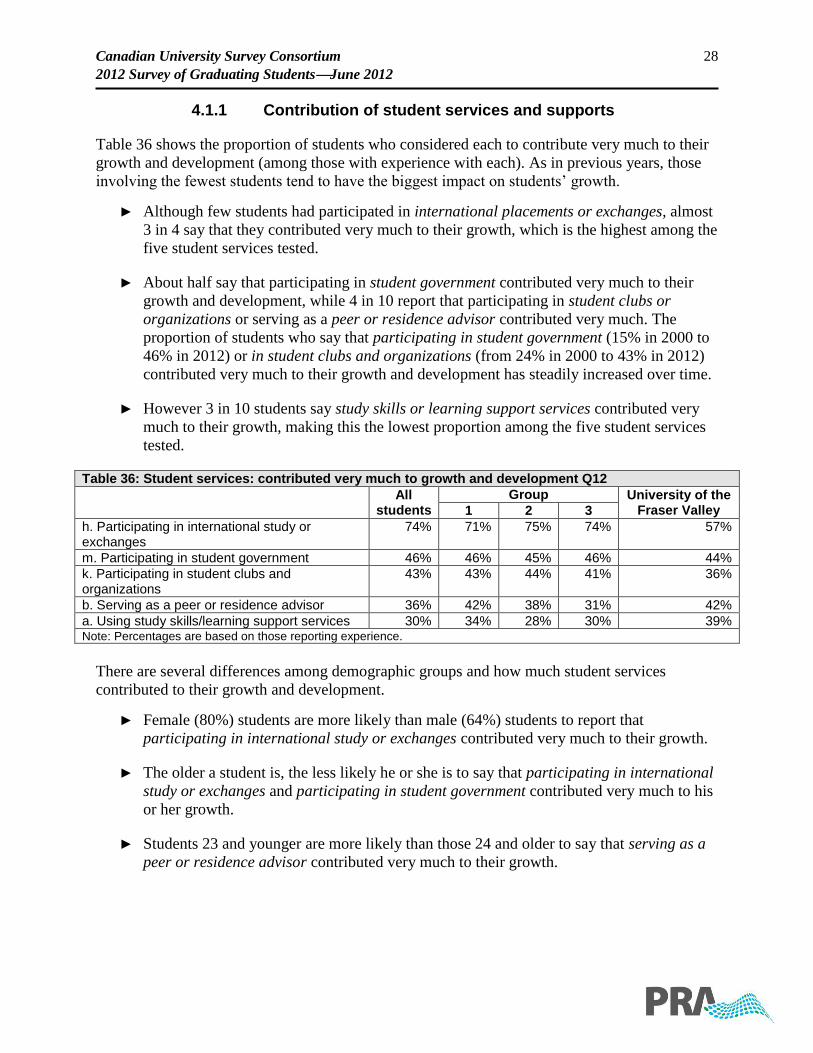
4.1.1 Contribution of student services and supports
Table 36 shows the proportion of students who considered each to contribute very much to their
growth and development (among those with experience with each). As in previous years, those
involving the fewest students tend to have the biggest impact on students’ growth.
► Although few students had participated in international placements or exchanges, almost
3 in 4 say that they contributed very much to their growth, which is the highest among the
five student services tested.
► About half say that participating in student government contributed very much to their
growth and development, while 4 in 10 report that participating in student clubs or
organizations or serving as a peer or residence advisor contributed very much. The
proportion of students who say that participating in student government (15% in 2000 to
46% in 2012) or in student clubs and organizations (from 24% in 2000 to 43% in 2012)
contributed very much to their growth and development has steadily increased over time.
► However 3 in 10 students say study skills or learning support services contributed very
much to their growth, making this the lowest proportion among the five student services
tested.
Table 36: Student services: contributed very much to growth and development Q12
All
students
Group University of the Fraser Valley 1 2 3
h. Participating in international study or exchanges
74% 71% 75% 74% 57%
m. Participating in student government 46% 46% 45% 46% 44%
k. Participating in student clubs and organizations
43% 43% 44% 41% 36%
b. Serving as a peer or residence advisor 36% 42% 38% 31% 42%
a. Using study skills/learning support services 30% 34% 28% 30% 39% Note: Percentages are based on those reporting experience.
There are several differences among demographic groups and how much student services
contributed to their growth and development.
► Female (80%) students are more likely than male (64%) students to report that
participating in international study or exchanges contributed very much to their growth.
► The older a student is, the less likely he or she is to say that participating in international
study or exchanges and participating in student government contributed very much to his
or her growth.
► Students 23 and younger are more likely than those 24 and older to say that serving as a
peer or residence advisor contributed very much to their growth.
Canadian University Survey Consortium 29
2012 Survey of Graduating StudentsJune 2012
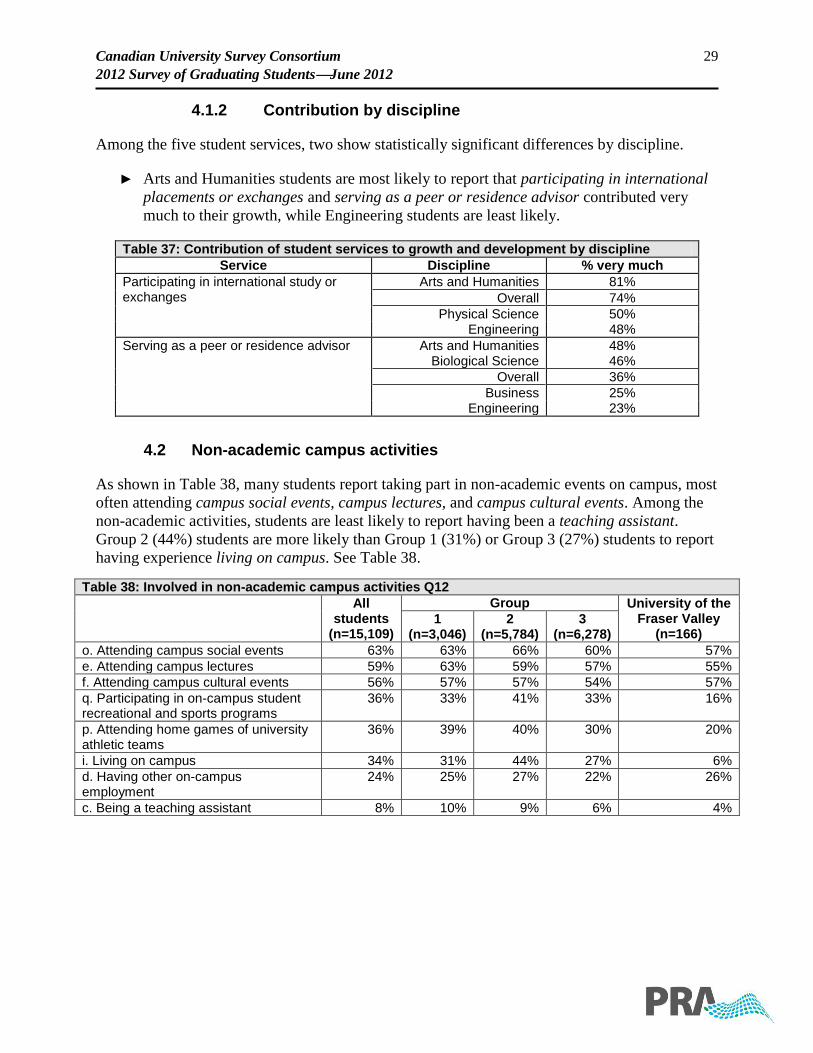
4.1.2 Contribution by discipline
Among the five student services, two show statistically significant differences by discipline.
► Arts and Humanities students are most likely to report that participating in international
placements or exchanges and serving as a peer or residence advisor contributed very
much to their growth, while Engineering students are least likely.
Table 37: Contribution of student services to growth and development by discipline
Service Discipline % very much
Participating in international study or exchanges
Arts and Humanities 81%
Overall 74%
Physical Science 50% Engineering 48%
Serving as a peer or residence advisor Arts and Humanities 48% Biological Science 46%
Overall 36%
Business 25% Engineering 23%
4.2 Non-academic campus activities
As shown in Table 38, many students report taking part in non-academic events on campus, most
often attending campus social events, campus lectures, and campus cultural events. Among the
non-academic activities, students are least likely to report having been a teaching assistant.
Group 2 (44%) students are more likely than Group 1 (31%) or Group 3 (27%) students to report
having experience living on campus. See Table 38.
Table 38: Involved in non-academic campus activities Q12
All students
(n=15,109)
Group University of the Fraser Valley
(n=166) 1
(n=3,046) 2
(n=5,784) 3
(n=6,278)
o. Attending campus social events 63% 63% 66% 60% 57%
e. Attending campus lectures 59% 63% 59% 57% 55%
f. Attending campus cultural events 56% 57% 57% 54% 57%
q. Participating in on-campus student recreational and sports programs
36% 33% 41% 33% 16%
p. Attending home games of university athletic teams
36% 39% 40% 30% 20%
i. Living on campus 34% 31% 44% 27% 6%
d. Having other on-campus employment
24% 25% 27% 22% 26%
c. Being a teaching assistant 8% 10% 9% 6% 4%
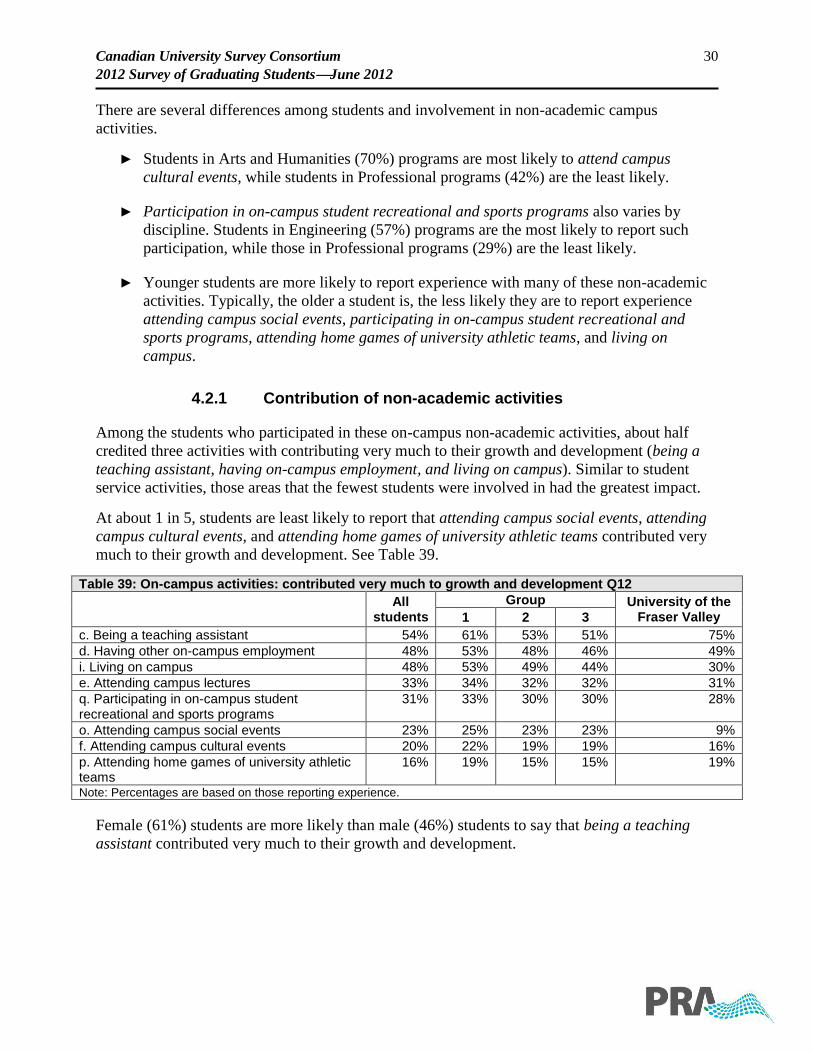
Canadian University Survey Consortium 30
2012 Survey of Graduating StudentsJune 2012
There are several differences among students and involvement in non-academic campus
activities.
► Students in Arts and Humanities (70%) programs are most likely to attend campus
cultural events, while students in Professional programs (42%) are the least likely.
► Participation in on-campus student recreational and sports programs also varies by
discipline. Students in Engineering (57%) programs are the most likely to report such
participation, while those in Professional programs (29%) are the least likely.
► Younger students are more likely to report experience with many of these non-academic
activities. Typically, the older a student is, the less likely they are to report experience
attending campus social events, participating in on-campus student recreational and
sports programs, attending home games of university athletic teams, and living on
campus.
4.2.1 Contribution of non-academic activities
Among the students who participated in these on-campus non-academic activities, about half
credited three activities with contributing very much to their growth and development (being a
teaching assistant, having on-campus employment, and living on campus). Similar to student
service activities, those areas that the fewest students were involved in had the greatest impact.
At about 1 in 5, students are least likely to report that attending campus social events, attending
campus cultural events, and attending home games of university athletic teams contributed very
much to their growth and development. See Table 39.
Table 39: On-campus activities: contributed very much to growth and development Q12
All
students
Group University of the Fraser Valley 1 2 3
c. Being a teaching assistant 54% 61% 53% 51% 75%
d. Having other on-campus employment 48% 53% 48% 46% 49%
i. Living on campus 48% 53% 49% 44% 30%
e. Attending campus lectures 33% 34% 32% 32% 31%
q. Participating in on-campus student recreational and sports programs
31% 33% 30% 30% 28%
o. Attending campus social events 23% 25% 23% 23% 9%
f. Attending campus cultural events 20% 22% 19% 19% 16%
p. Attending home games of university athletic teams
16% 19% 15% 15% 19%
Note: Percentages are based on those reporting experience.
Female (61%) students are more likely than male (46%) students to say that being a teaching
assistant contributed very much to their growth and development.
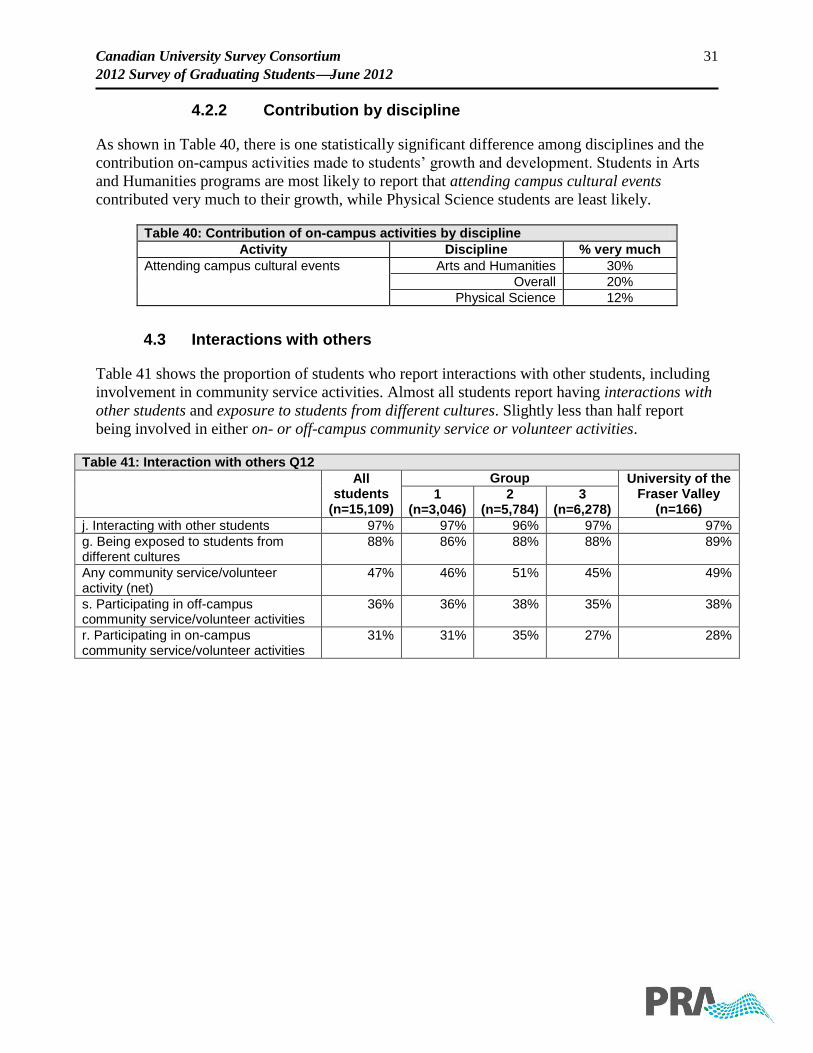
Canadian University Survey Consortium 31
2012 Survey of Graduating StudentsJune 2012
4.2.2 Contribution by discipline
As shown in Table 40, there is one statistically significant difference among disciplines and the
contribution on-campus activities made to students’ growth and development. Students in Arts
and Humanities programs are most likely to report that attending campus cultural events
contributed very much to their growth, while Physical Science students are least likely.
Table 40: Contribution of on-campus activities by discipline
Activity Discipline % very much
Attending campus cultural events Arts and Humanities 30%
Overall 20%
Physical Science 12%
4.3 Interactions with others
Table 41 shows the proportion of students who report interactions with other students, including
involvement in community service activities. Almost all students report having interactions with
other students and exposure to students from different cultures. Slightly less than half report
being involved in either on- or off-campus community service or volunteer activities.
Table 41: Interaction with others Q12
All
students (n=15,109)
Group University of the Fraser Valley
(n=166) 1
(n=3,046) 2
(n=5,784) 3
(n=6,278)
j. Interacting with other students 97% 97% 96% 97% 97%
g. Being exposed to students from different cultures
88% 86% 88% 88% 89%
Any community service/volunteer activity (net)
47% 46% 51% 45% 49%
s. Participating in off-campus community service/volunteer activities
36% 36% 38% 35% 38%
r. Participating in on-campus community service/volunteer activities
31% 31% 35% 27% 28%
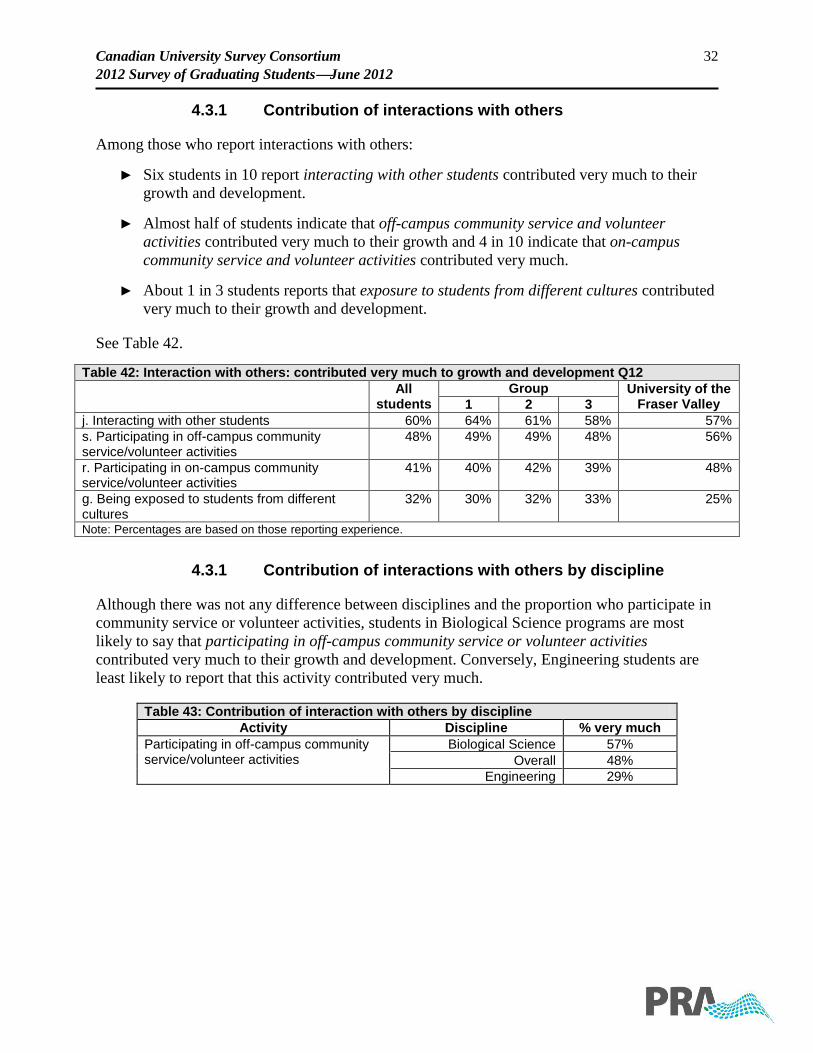
Canadian University Survey Consortium 32
2012 Survey of Graduating StudentsJune 2012
4.3.1 Contribution of interactions with others
Among those who report interactions with others:
► Six students in 10 report interacting with other students contributed very much to their
growth and development.
► Almost half of students indicate that off-campus community service and volunteer
activities contributed very much to their growth and 4 in 10 indicate that on-campus
community service and volunteer activities contributed very much.
► About 1 in 3 students reports that exposure to students from different cultures contributed
very much to their growth and development.
See Table 42.
Table 42: Interaction with others: contributed very much to growth and development Q12
All students
Group University of the Fraser Valley 1 2 3
j. Interacting with other students 60% 64% 61% 58% 57%
s. Participating in off-campus community service/volunteer activities
48% 49% 49% 48% 56%
r. Participating in on-campus community service/volunteer activities
41% 40% 42% 39% 48%
g. Being exposed to students from different cultures
32% 30% 32% 33% 25%
Note: Percentages are based on those reporting experience.
4.3.1 Contribution of interactions with others by discipline
Although there was not any difference between disciplines and the proportion who participate in
community service or volunteer activities, students in Biological Science programs are most
likely to say that participating in off-campus community service or volunteer activities
contributed very much to their growth and development. Conversely, Engineering students are
least likely to report that this activity contributed very much.
Table 43: Contribution of interaction with others by discipline
Activity Discipline % very much
Participating in off-campus community service/volunteer activities
Biological Science 57%
Overall 48%
Engineering 29%
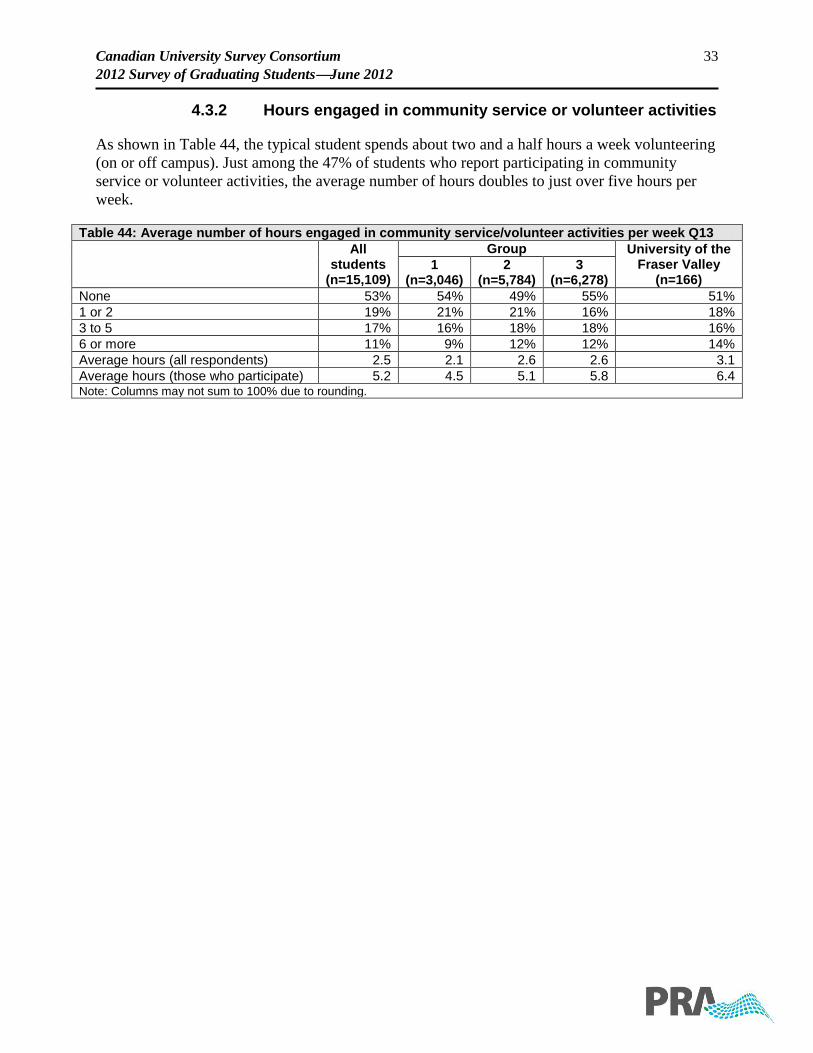
Canadian University Survey Consortium 33
2012 Survey of Graduating StudentsJune 2012
4.3.2 Hours engaged in community service or volunteer activities
As shown in Table 44, the typical student spends about two and a half hours a week volunteering
(on or off campus). Just among the 47% of students who report participating in community
service or volunteer activities, the average number of hours doubles to just over five hours per
week.
Table 44: Average number of hours engaged in community service/volunteer activities per week Q13
All
students (n=15,109)
Group University of the Fraser Valley
(n=166) 1
(n=3,046) 2
(n=5,784) 3
(n=6,278)
None 53% 54% 49% 55% 51%
1 or 2 19% 21% 21% 16% 18%
3 to 5 17% 16% 18% 18% 16%
6 or more 11% 9% 12% 12% 14%
Average hours (all respondents) 2.5 2.1 2.6 2.6 3.1
Average hours (those who participate) 5.2 4.5 5.1 5.8 6.4 Note: Columns may not sum to 100% due to rounding.
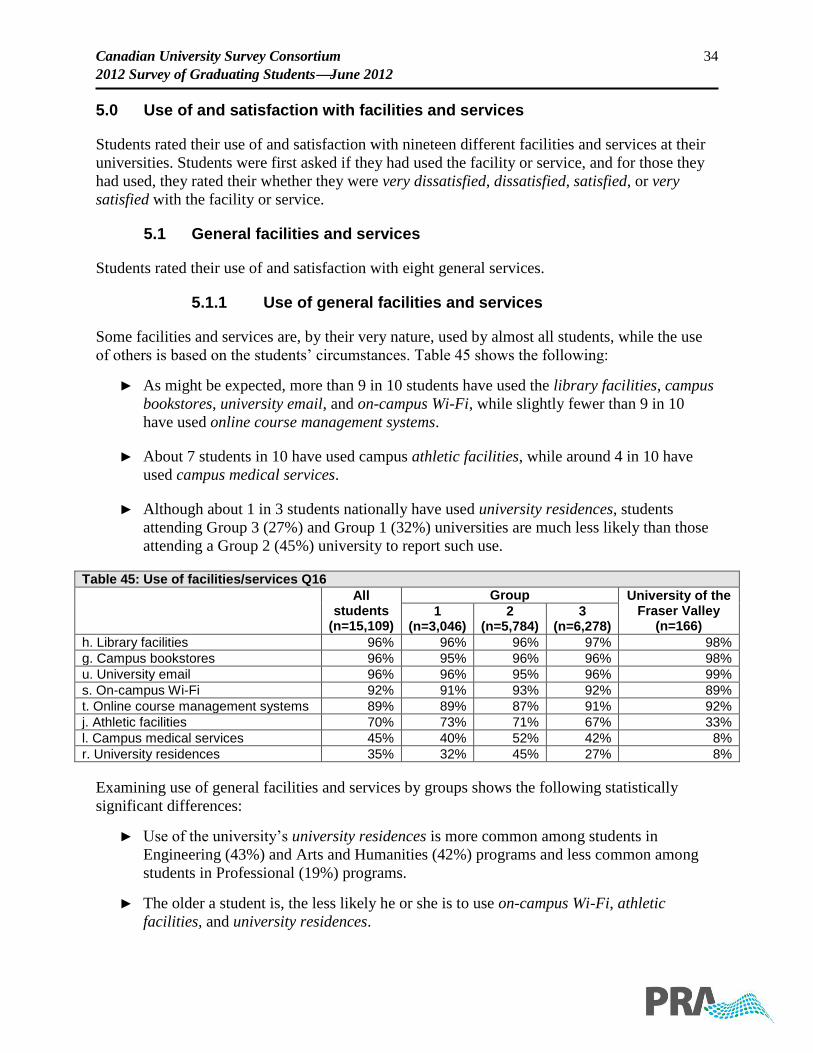
Canadian University Survey Consortium 34
2012 Survey of Graduating StudentsJune 2012
5.0 Use of and satisfaction with facilities and services
Students rated their use of and satisfaction with nineteen different facilities and services at their
universities. Students were first asked if they had used the facility or service, and for those they
had used, they rated their whether they were very dissatisfied, dissatisfied, satisfied, or very
satisfied with the facility or service.
5.1 General facilities and services
Students rated their use of and satisfaction with eight general services.
5.1.1 Use of general facilities and services
Some facilities and services are, by their very nature, used by almost all students, while the use
of others is based on the students’ circumstances. Table 45 shows the following:
► As might be expected, more than 9 in 10 students have used the library facilities, campus
bookstores, university email, and on-campus Wi-Fi, while slightly fewer than 9 in 10
have used online course management systems.
► About 7 students in 10 have used campus athletic facilities, while around 4 in 10 have
used campus medical services.
► Although about 1 in 3 students nationally have used university residences, students
attending Group 3 (27%) and Group 1 (32%) universities are much less likely than those
attending a Group 2 (45%) university to report such use.
Table 45: Use of facilities/services Q16
All students
(n=15,109)
Group University of the Fraser Valley
(n=166) 1
(n=3,046) 2
(n=5,784) 3
(n=6,278)
h. Library facilities 96% 96% 96% 97% 98%
g. Campus bookstores 96% 95% 96% 96% 98%
u. University email 96% 96% 95% 96% 99%
s. On-campus Wi-Fi 92% 91% 93% 92% 89%
t. Online course management systems 89% 89% 87% 91% 92%
j. Athletic facilities 70% 73% 71% 67% 33%
l. Campus medical services 45% 40% 52% 42% 8%
r. University residences 35% 32% 45% 27% 8%
Examining use of general facilities and services by groups shows the following statistically
significant differences:
► Use of the university’s university residences is more common among students in
Engineering (43%) and Arts and Humanities (42%) programs and less common among
students in Professional (19%) programs.
► The older a student is, the less likely he or she is to use on-campus Wi-Fi, athletic
facilities, and university residences.
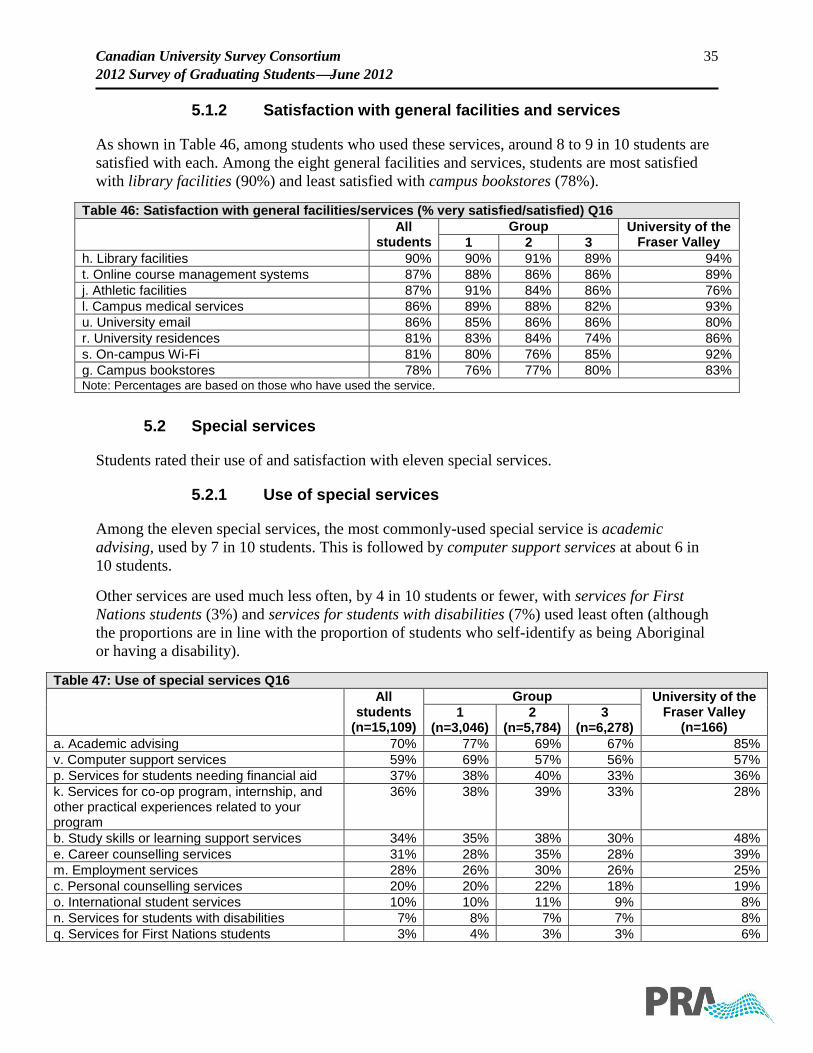
Canadian University Survey Consortium 35
2012 Survey of Graduating StudentsJune 2012
5.1.2 Satisfaction with general facilities and services
As shown in Table 46, among students who used these services, around 8 to 9 in 10 students are
satisfied with each. Among the eight general facilities and services, students are most satisfied
with library facilities (90%) and least satisfied with campus bookstores (78%).
Table 46: Satisfaction with general facilities/services (% very satisfied/satisfied) Q16
All students
Group University of the Fraser Valley 1 2 3
h. Library facilities 90% 90% 91% 89% 94%
t. Online course management systems 87% 88% 86% 86% 89%
j. Athletic facilities 87% 91% 84% 86% 76%
l. Campus medical services 86% 89% 88% 82% 93%
u. University email 86% 85% 86% 86% 80%
r. University residences 81% 83% 84% 74% 86%
s. On-campus Wi-Fi 81% 80% 76% 85% 92%
g. Campus bookstores 78% 76% 77% 80% 83% Note: Percentages are based on those who have used the service.
5.2 Special services
Students rated their use of and satisfaction with eleven special services.
5.2.1 Use of special services
Among the eleven special services, the most commonly-used special service is academic
advising, used by 7 in 10 students. This is followed by computer support services at about 6 in
10 students.
Other services are used much less often, by 4 in 10 students or fewer, with services for First
Nations students (3%) and services for students with disabilities (7%) used least often (although
the proportions are in line with the proportion of students who self-identify as being Aboriginal
or having a disability).
Table 47: Use of special services Q16
All
students (n=15,109)
Group University of the Fraser Valley
(n=166) 1
(n=3,046) 2
(n=5,784) 3
(n=6,278)
a. Academic advising 70% 77% 69% 67% 85%
v. Computer support services 59% 69% 57% 56% 57%
p. Services for students needing financial aid 37% 38% 40% 33% 36%
k. Services for co-op program, internship, and other practical experiences related to your program
36% 38% 39% 33% 28%
b. Study skills or learning support services 34% 35% 38% 30% 48%
e. Career counselling services 31% 28% 35% 28% 39%
m. Employment services 28% 26% 30% 26% 25%
c. Personal counselling services 20% 20% 22% 18% 19%
o. International student services 10% 10% 11% 9% 8%
n. Services for students with disabilities 7% 8% 7% 7% 8%
q. Services for First Nations students 3% 4% 3% 3% 6%
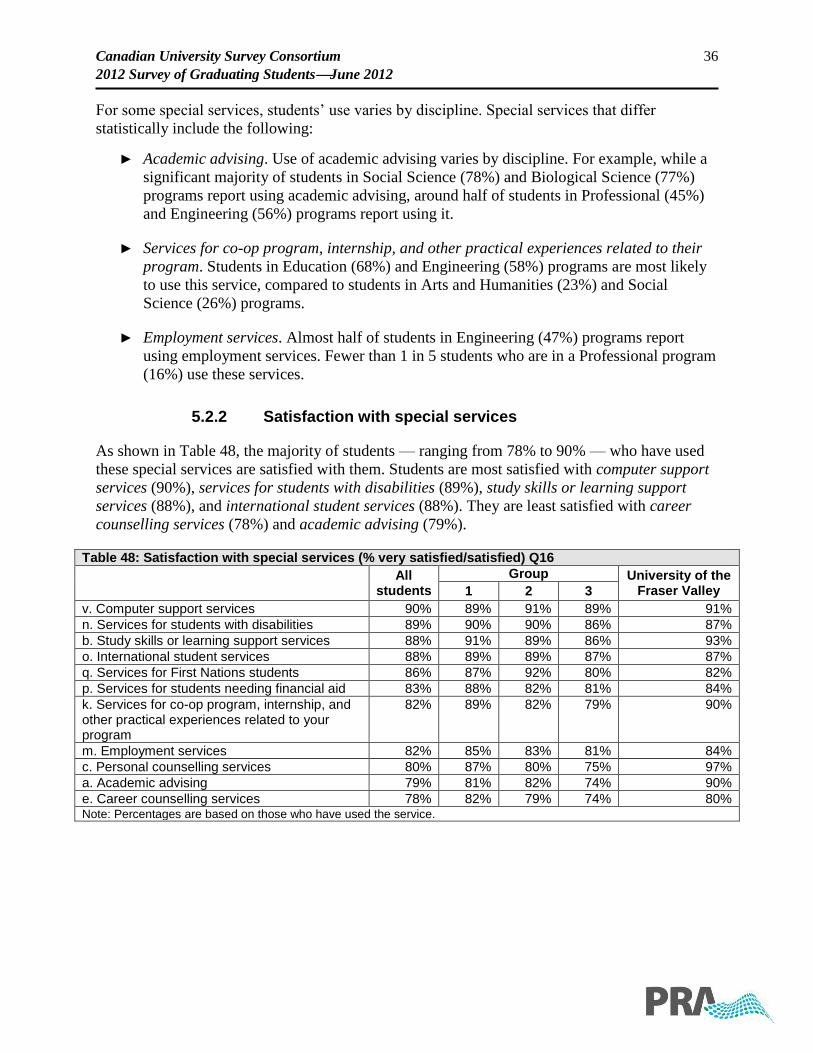
Canadian University Survey Consortium 36
2012 Survey of Graduating StudentsJune 2012
For some special services, students’ use varies by discipline. Special services that differ
statistically include the following:
► Academic advising. Use of academic advising varies by discipline. For example, while a
significant majority of students in Social Science (78%) and Biological Science (77%)
programs report using academic advising, around half of students in Professional (45%)
and Engineering (56%) programs report using it.
► Services for co-op program, internship, and other practical experiences related to their
program. Students in Education (68%) and Engineering (58%) programs are most likely
to use this service, compared to students in Arts and Humanities (23%) and Social
Science (26%) programs.
► Employment services. Almost half of students in Engineering (47%) programs report
using employment services. Fewer than 1 in 5 students who are in a Professional program
(16%) use these services.
5.2.2 Satisfaction with special services
As shown in Table 48, the majority of students — ranging from 78% to 90% — who have used
these special services are satisfied with them. Students are most satisfied with computer support
services (90%), services for students with disabilities (89%), study skills or learning support
services (88%), and international student services (88%). They are least satisfied with career
counselling services (78%) and academic advising (79%).
Table 48: Satisfaction with special services (% very satisfied/satisfied) Q16
All students
Group University of the Fraser Valley 1 2 3
v. Computer support services 90% 89% 91% 89% 91%
n. Services for students with disabilities 89% 90% 90% 86% 87%
b. Study skills or learning support services 88% 91% 89% 86% 93%
o. International student services 88% 89% 89% 87% 87%
q. Services for First Nations students 86% 87% 92% 80% 82%
p. Services for students needing financial aid 83% 88% 82% 81% 84%
k. Services for co-op program, internship, and other practical experiences related to your program
82% 89% 82% 79% 90%
m. Employment services 82% 85% 83% 81% 84%
c. Personal counselling services 80% 87% 80% 75% 97%
a. Academic advising 79% 81% 82% 74% 90%
e. Career counselling services 78% 82% 79% 74% 80% Note: Percentages are based on those who have used the service.
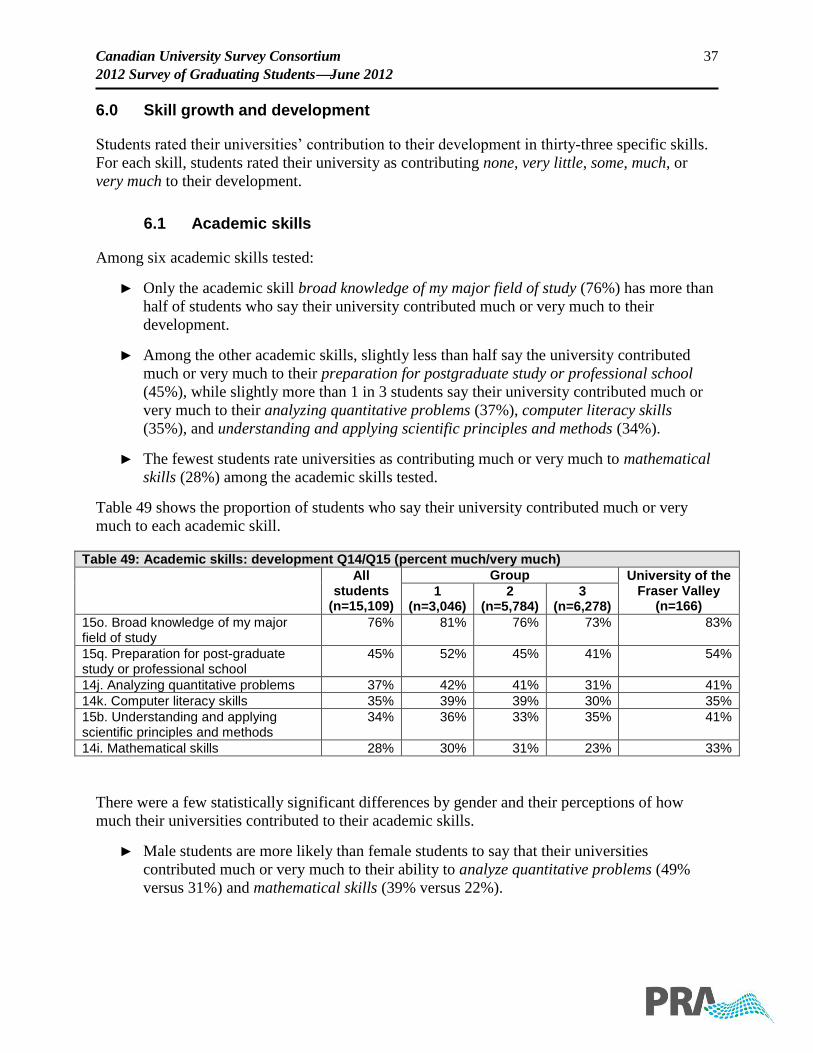
Canadian University Survey Consortium 37
2012 Survey of Graduating StudentsJune 2012
6.0 Skill growth and development
Students rated their universities’ contribution to their development in thirty-three specific skills.
For each skill, students rated their university as contributing none, very little, some, much, or
very much to their development.
6.1 Academic skills
Among six academic skills tested:
► Only the academic skill broad knowledge of my major field of study (76%) has more than
half of students who say their university contributed much or very much to their
development.
► Among the other academic skills, slightly less than half say the university contributed
much or very much to their preparation for postgraduate study or professional school
(45%), while slightly more than 1 in 3 students say their university contributed much or
very much to their analyzing quantitative problems (37%), computer literacy skills
(35%), and understanding and applying scientific principles and methods (34%).
► The fewest students rate universities as contributing much or very much to mathematical
skills (28%) among the academic skills tested.
Table 49 shows the proportion of students who say their university contributed much or very
much to each academic skill.
Table 49: Academic skills: development Q14/Q15 (percent much/very much)
All
students (n=15,109)
Group University of the Fraser Valley
(n=166) 1
(n=3,046) 2
(n=5,784) 3
(n=6,278)
15o. Broad knowledge of my major field of study
76% 81% 76% 73% 83%
15q. Preparation for post-graduate study or professional school
45% 52% 45% 41% 54%
14j. Analyzing quantitative problems 37% 42% 41% 31% 41%
14k. Computer literacy skills 35% 39% 39% 30% 35%
15b. Understanding and applying scientific principles and methods
34% 36% 33% 35% 41%
14i. Mathematical skills 28% 30% 31% 23% 33%
There were a few statistically significant differences by gender and their perceptions of how
much their universities contributed to their academic skills.
► Male students are more likely than female students to say that their universities
contributed much or very much to their ability to analyze quantitative problems (49%
versus 31%) and mathematical skills (39% versus 22%).
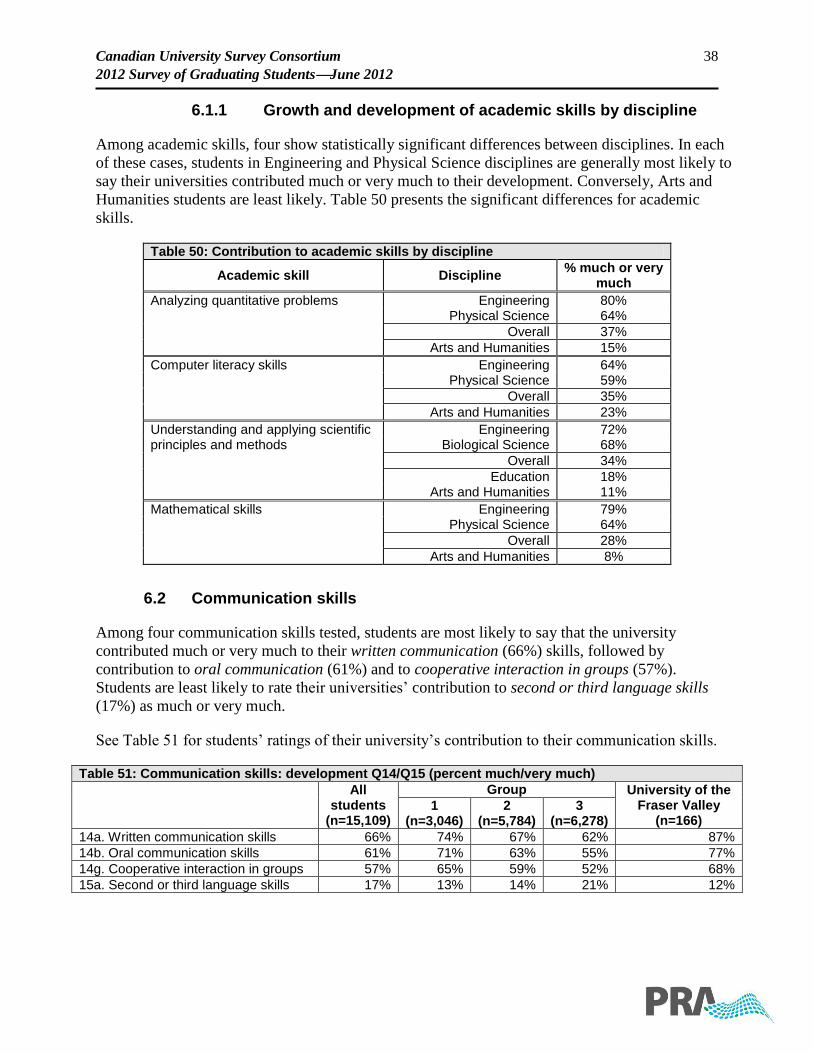
Canadian University Survey Consortium 38
2012 Survey of Graduating StudentsJune 2012
6.1.1 Growth and development of academic skills by discipline
Among academic skills, four show statistically significant differences between disciplines. In each
of these cases, students in Engineering and Physical Science disciplines are generally most likely to
say their universities contributed much or very much to their development. Conversely, Arts and
Humanities students are least likely. Table 50 presents the significant differences for academic
skills.
Table 50: Contribution to academic skills by discipline
Academic skill Discipline % much or very
much
Analyzing quantitative problems Engineering 80% Physical Science 64%
Overall 37%
Arts and Humanities 15%
Computer literacy skills Engineering 64% Physical Science 59%
Overall 35%
Arts and Humanities 23%
Understanding and applying scientific principles and methods
Engineering 72% Biological Science 68%
Overall 34%
Education 18% Arts and Humanities 11%
Mathematical skills Engineering 79% Physical Science 64%
Overall 28%
Arts and Humanities 8%
6.2 Communication skills
Among four communication skills tested, students are most likely to say that the university
contributed much or very much to their written communication (66%) skills, followed by
contribution to oral communication (61%) and to cooperative interaction in groups (57%).
Students are least likely to rate their universities’ contribution to second or third language skills
(17%) as much or very much.
See Table 51 for students’ ratings of their university’s contribution to their communication skills.
Table 51: Communication skills: development Q14/Q15 (percent much/very much)
All
students (n=15,109)
Group University of the Fraser Valley
(n=166) 1
(n=3,046) 2
(n=5,784) 3
(n=6,278)
14a. Written communication skills 66% 74% 67% 62% 87%
14b. Oral communication skills 61% 71% 63% 55% 77%
14g. Cooperative interaction in groups 57% 65% 59% 52% 68%
15a. Second or third language skills 17% 13% 14% 21% 12%
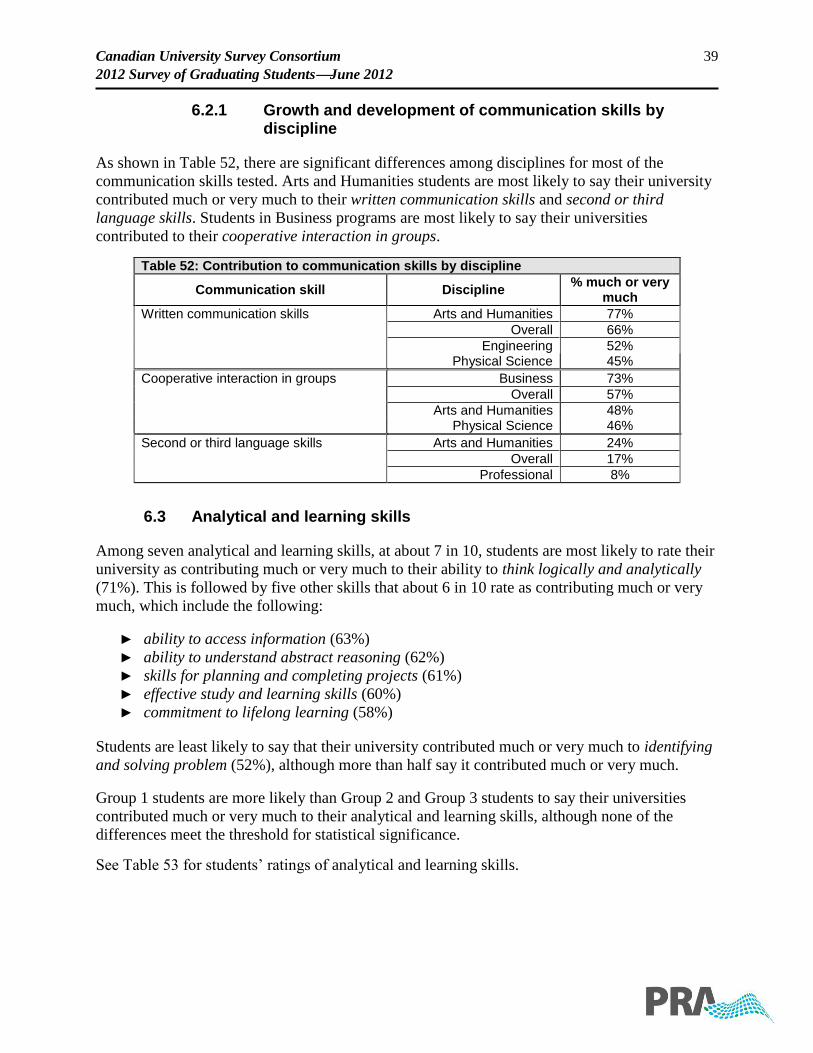
Canadian University Survey Consortium 39
2012 Survey of Graduating StudentsJune 2012
6.2.1 Growth and development of communication skills by discipline
As shown in Table 52, there are significant differences among disciplines for most of the
communication skills tested. Arts and Humanities students are most likely to say their university
contributed much or very much to their written communication skills and second or third
language skills. Students in Business programs are most likely to say their universities
contributed to their cooperative interaction in groups.
Table 52: Contribution to communication skills by discipline
Communication skill Discipline % much or very
much
Written communication skills Arts and Humanities 77%
Overall 66%
Engineering 52% Physical Science 45%
Cooperative interaction in groups Business 73%
Overall 57%
Arts and Humanities 48% Physical Science 46%
Second or third language skills Arts and Humanities 24%
Overall 17%
Professional 8%
6.3 Analytical and learning skills
Among seven analytical and learning skills, at about 7 in 10, students are most likely to rate their
university as contributing much or very much to their ability to think logically and analytically
(71%). This is followed by five other skills that about 6 in 10 rate as contributing much or very
much, which include the following:
► ability to access information (63%)
► ability to understand abstract reasoning (62%)
► skills for planning and completing projects (61%)
► effective study and learning skills (60%)
► commitment to lifelong learning (58%)
Students are least likely to say that their university contributed much or very much to identifying
and solving problem (52%), although more than half say it contributed much or very much.
Group 1 students are more likely than Group 2 and Group 3 students to say their universities
contributed much or very much to their analytical and learning skills, although none of the
differences meet the threshold for statistical significance.
See Table 53 for students’ ratings of analytical and learning skills.
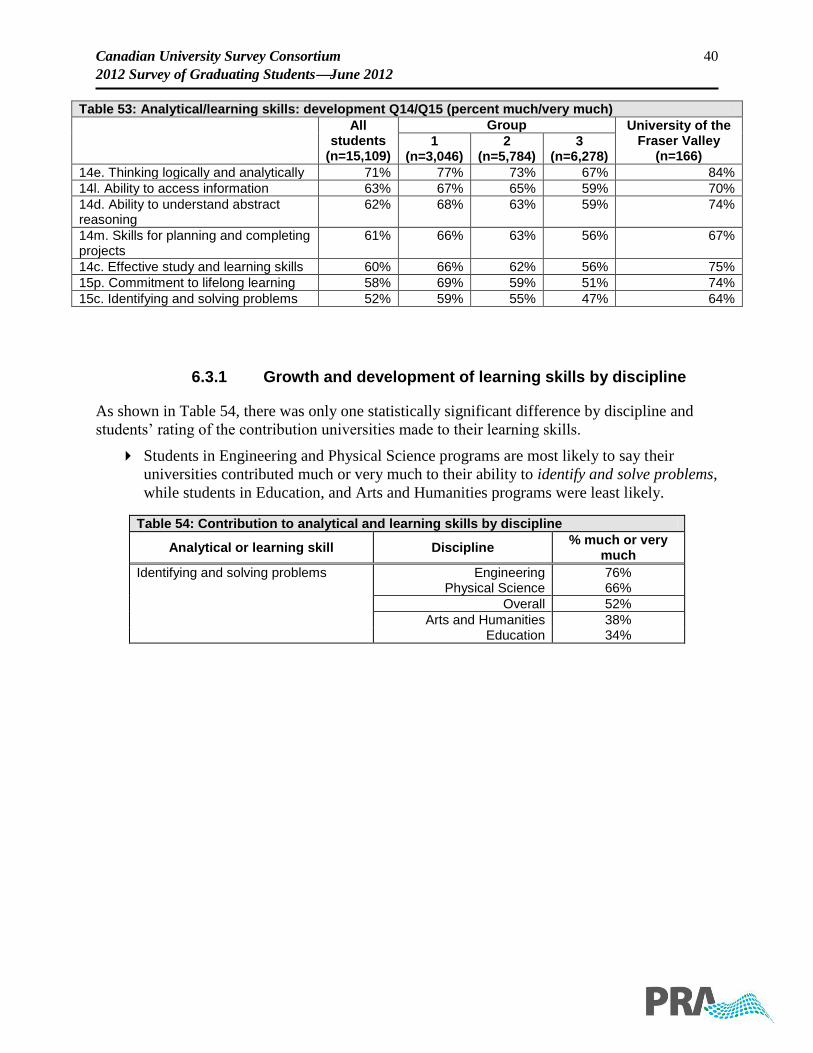
Canadian University Survey Consortium 40
2012 Survey of Graduating StudentsJune 2012
Table 53: Analytical/learning skills: development Q14/Q15 (percent much/very much)
All
students (n=15,109)
Group University of the Fraser Valley
(n=166) 1
(n=3,046) 2
(n=5,784) 3
(n=6,278)
14e. Thinking logically and analytically 71% 77% 73% 67% 84%
14l. Ability to access information 63% 67% 65% 59% 70%
14d. Ability to understand abstract reasoning
62% 68% 63% 59% 74%
14m. Skills for planning and completing projects
61% 66% 63% 56% 67%
14c. Effective study and learning skills 60% 66% 62% 56% 75%
15p. Commitment to lifelong learning 58% 69% 59% 51% 74%
15c. Identifying and solving problems 52% 59% 55% 47% 64%
6.3.1 Growth and development of learning skills by discipline
As shown in Table 54, there was only one statistically significant difference by discipline and
students’ rating of the contribution universities made to their learning skills.
Students in Engineering and Physical Science programs are most likely to say their
universities contributed much or very much to their ability to identify and solve problems,
while students in Education, and Arts and Humanities programs were least likely.
Table 54: Contribution to analytical and learning skills by discipline
Analytical or learning skill Discipline % much or very
much
Identifying and solving problems Engineering 76% Physical Science 66%
Overall 52%
Arts and Humanities 38% Education 34%
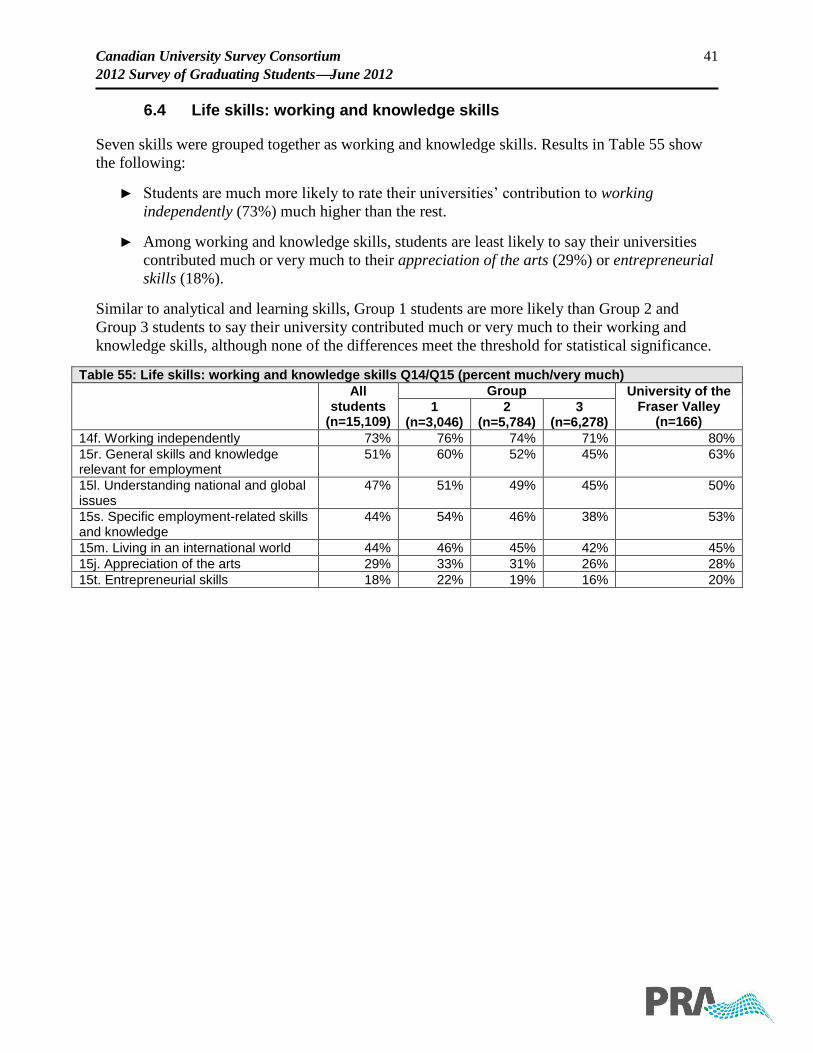
Canadian University Survey Consortium 41
2012 Survey of Graduating StudentsJune 2012
6.4 Life skills: working and knowledge skills
Seven skills were grouped together as working and knowledge skills. Results in Table 55 show
the following:
► Students are much more likely to rate their universities’ contribution to working
independently (73%) much higher than the rest.
► Among working and knowledge skills, students are least likely to say their universities
contributed much or very much to their appreciation of the arts (29%) or entrepreneurial
skills (18%).
Similar to analytical and learning skills, Group 1 students are more likely than Group 2 and
Group 3 students to say their university contributed much or very much to their working and
knowledge skills, although none of the differences meet the threshold for statistical significance.
Table 55: Life skills: working and knowledge skills Q14/Q15 (percent much/very much)
All
students (n=15,109)
Group University of the Fraser Valley
(n=166) 1
(n=3,046) 2
(n=5,784) 3
(n=6,278)
14f. Working independently 73% 76% 74% 71% 80%
15r. General skills and knowledge relevant for employment
51% 60% 52% 45% 63%
15l. Understanding national and global issues
47% 51% 49% 45% 50%
15s. Specific employment-related skills and knowledge
44% 54% 46% 38% 53%
15m. Living in an international world 44% 46% 45% 42% 45%
15j. Appreciation of the arts 29% 33% 31% 26% 28%
15t. Entrepreneurial skills 18% 22% 19% 16% 20%
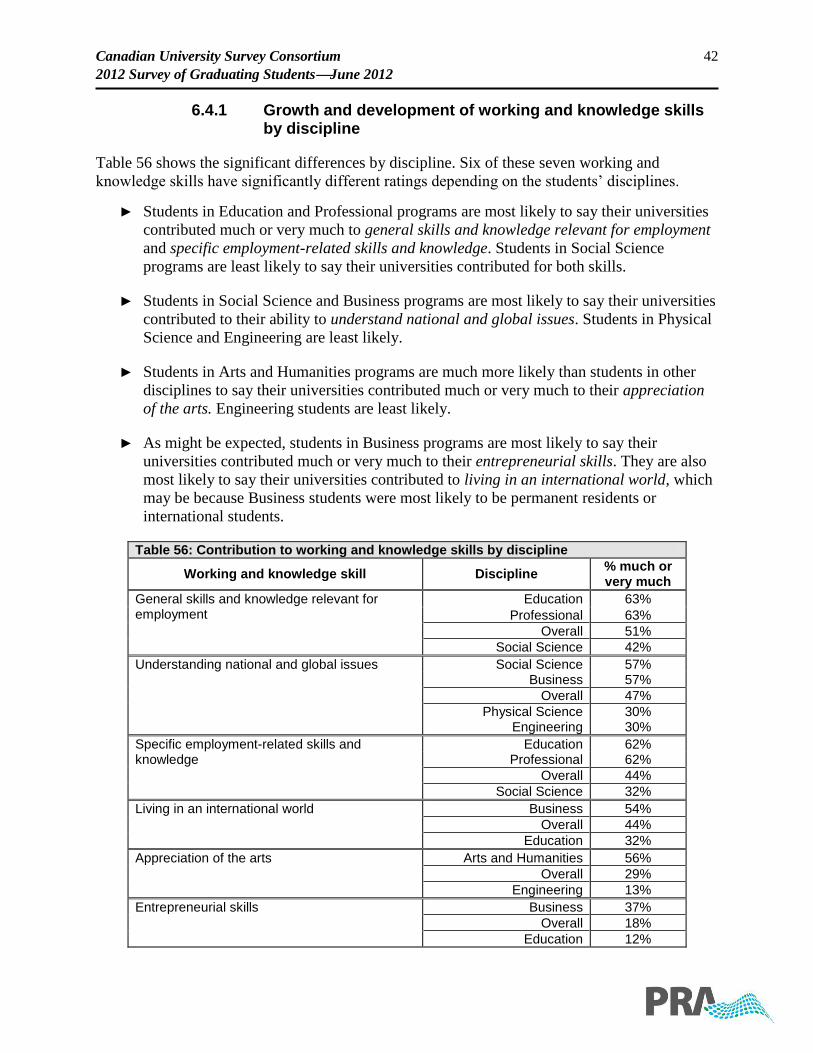
Canadian University Survey Consortium 42
2012 Survey of Graduating StudentsJune 2012
6.4.1 Growth and development of working and knowledge skills by discipline
Table 56 shows the significant differences by discipline. Six of these seven working and
knowledge skills have significantly different ratings depending on the students’ disciplines.
► Students in Education and Professional programs are most likely to say their universities
contributed much or very much to general skills and knowledge relevant for employment
and specific employment-related skills and knowledge. Students in Social Science
programs are least likely to say their universities contributed for both skills.
► Students in Social Science and Business programs are most likely to say their universities
contributed to their ability to understand national and global issues. Students in Physical
Science and Engineering are least likely.
► Students in Arts and Humanities programs are much more likely than students in other
disciplines to say their universities contributed much or very much to their appreciation
of the arts. Engineering students are least likely.
► As might be expected, students in Business programs are most likely to say their
universities contributed much or very much to their entrepreneurial skills. They are also
most likely to say their universities contributed to living in an international world, which
may be because Business students were most likely to be permanent residents or
international students.
Table 56: Contribution to working and knowledge skills by discipline
Working and knowledge skill Discipline % much or very much
General skills and knowledge relevant for employment
Education 63%
Professional 63%
Overall 51%
Social Science 42%
Understanding national and global issues Social Science 57% Business 57%
Overall 47%
Physical Science 30% Engineering 30%
Specific employment-related skills and knowledge
Education 62% Professional 62%
Overall 44%
Social Science 32%
Living in an international world Business 54%
Overall 44%
Education 32%
Appreciation of the arts Arts and Humanities 56%
Overall 29%
Engineering 13%
Entrepreneurial skills Business 37%
Overall 18%
Education 12%
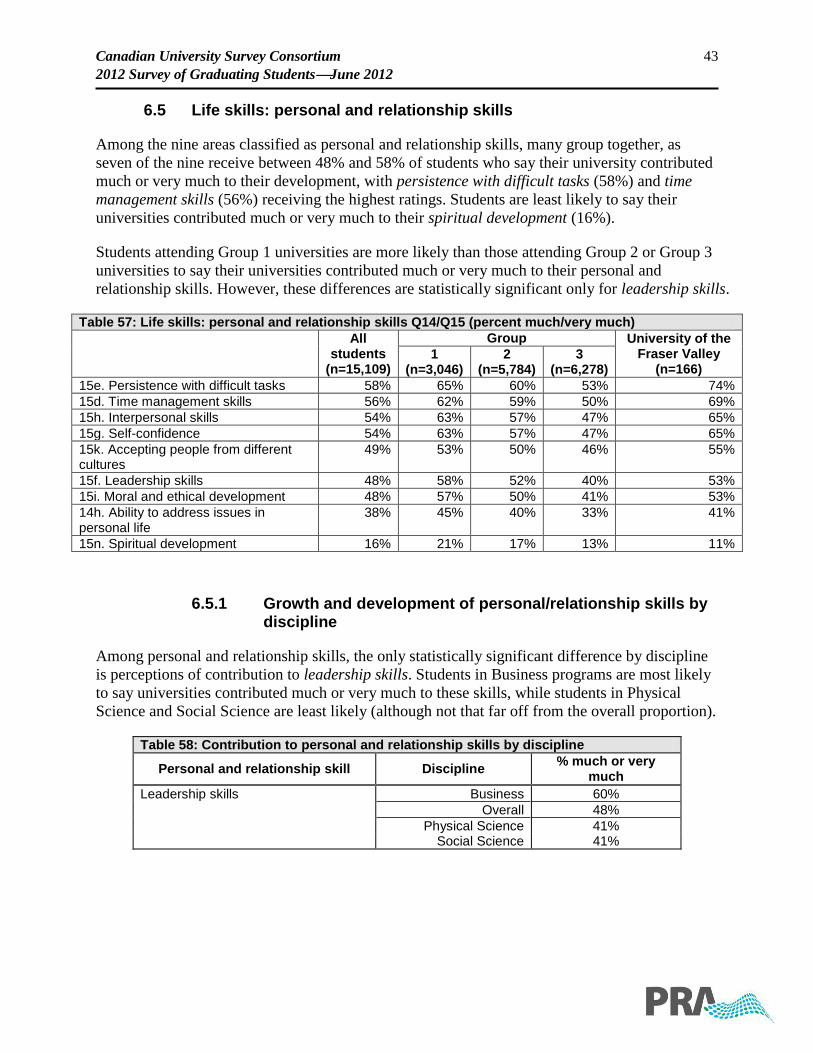
Canadian University Survey Consortium 43
2012 Survey of Graduating StudentsJune 2012
6.5 Life skills: personal and relationship skills
Among the nine areas classified as personal and relationship skills, many group together, as
seven of the nine receive between 48% and 58% of students who say their university contributed
much or very much to their development, with persistence with difficult tasks (58%) and time
management skills (56%) receiving the highest ratings. Students are least likely to say their
universities contributed much or very much to their spiritual development (16%).
Students attending Group 1 universities are more likely than those attending Group 2 or Group 3
universities to say their universities contributed much or very much to their personal and
relationship skills. However, these differences are statistically significant only for leadership skills.
Table 57: Life skills: personal and relationship skills Q14/Q15 (percent much/very much)
All
students (n=15,109)
Group University of the Fraser Valley
(n=166) 1
(n=3,046) 2
(n=5,784) 3
(n=6,278)
15e. Persistence with difficult tasks 58% 65% 60% 53% 74%
15d. Time management skills 56% 62% 59% 50% 69%
15h. Interpersonal skills 54% 63% 57% 47% 65%
15g. Self-confidence 54% 63% 57% 47% 65%
15k. Accepting people from different cultures
49% 53% 50% 46% 55%
15f. Leadership skills 48% 58% 52% 40% 53%
15i. Moral and ethical development 48% 57% 50% 41% 53%
14h. Ability to address issues in personal life
38% 45% 40% 33% 41%
15n. Spiritual development 16% 21% 17% 13% 11%
6.5.1 Growth and development of personal/relationship skills by discipline
Among personal and relationship skills, the only statistically significant difference by discipline
is perceptions of contribution to leadership skills. Students in Business programs are most likely
to say universities contributed much or very much to these skills, while students in Physical
Science and Social Science are least likely (although not that far off from the overall proportion).
Table 58: Contribution to personal and relationship skills by discipline
Personal and relationship skill Discipline % much or very
much
Leadership skills Business 60%
Overall 48%
Physical Science 41% Social Science 41%
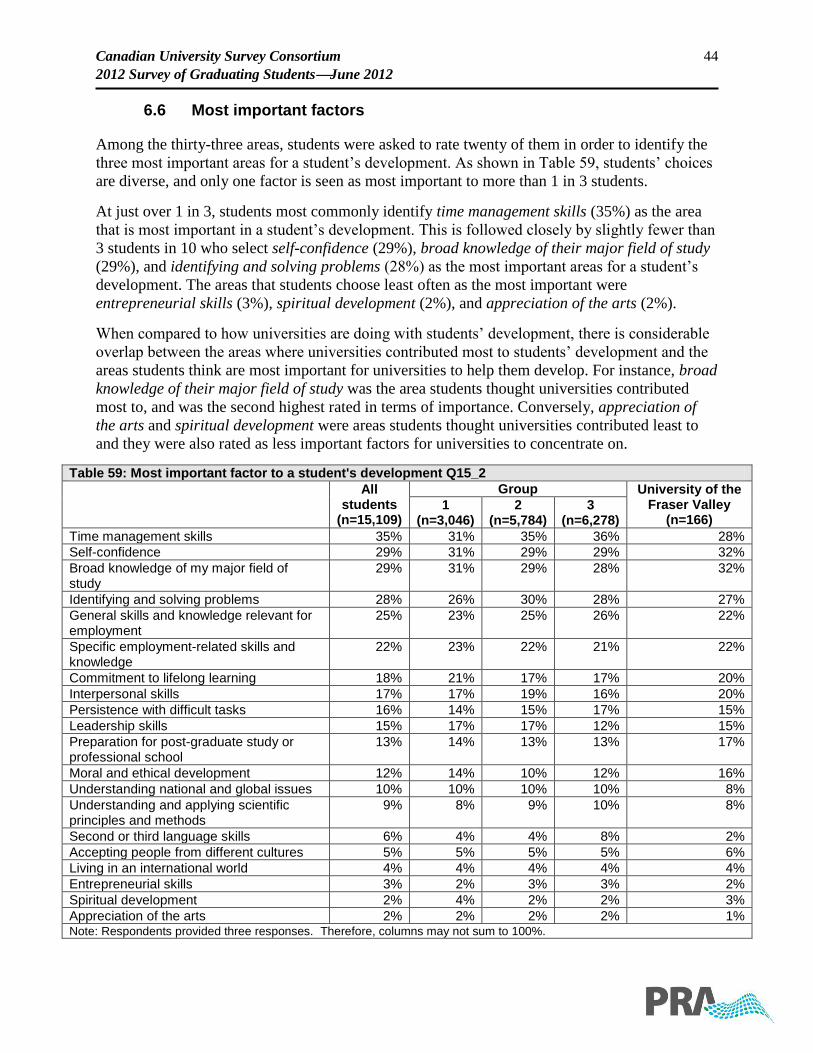
Canadian University Survey Consortium 44
2012 Survey of Graduating StudentsJune 2012
6.6 Most important factors
Among the thirty-three areas, students were asked to rate twenty of them in order to identify the
three most important areas for a student’s development. As shown in Table 59, students’ choices
are diverse, and only one factor is seen as most important to more than 1 in 3 students.
At just over 1 in 3, students most commonly identify time management skills (35%) as the area
that is most important in a student’s development. This is followed closely by slightly fewer than
3 students in 10 who select self-confidence (29%), broad knowledge of their major field of study
(29%), and identifying and solving problems (28%) as the most important areas for a student’s
development. The areas that students choose least often as the most important were
entrepreneurial skills (3%), spiritual development (2%), and appreciation of the arts (2%).
When compared to how universities are doing with students’ development, there is considerable
overlap between the areas where universities contributed most to students’ development and the
areas students think are most important for universities to help them develop. For instance, broad
knowledge of their major field of study was the area students thought universities contributed
most to, and was the second highest rated in terms of importance. Conversely, appreciation of
the arts and spiritual development were areas students thought universities contributed least to
and they were also rated as less important factors for universities to concentrate on.
Table 59: Most important factor to a student's development Q15_2
All
students (n=15,109)
Group University of the Fraser Valley
(n=166) 1
(n=3,046) 2
(n=5,784) 3
(n=6,278)
Time management skills 35% 31% 35% 36% 28%
Self-confidence 29% 31% 29% 29% 32%
Broad knowledge of my major field of study
29% 31% 29% 28% 32%
Identifying and solving problems 28% 26% 30% 28% 27%
General skills and knowledge relevant for employment
25% 23% 25% 26% 22%
Specific employment-related skills and knowledge
22% 23% 22% 21% 22%
Commitment to lifelong learning 18% 21% 17% 17% 20%
Interpersonal skills 17% 17% 19% 16% 20%
Persistence with difficult tasks 16% 14% 15% 17% 15%
Leadership skills 15% 17% 17% 12% 15%
Preparation for post-graduate study or professional school
13% 14% 13% 13% 17%
Moral and ethical development 12% 14% 10% 12% 16%
Understanding national and global issues 10% 10% 10% 10% 8%
Understanding and applying scientific principles and methods
9% 8% 9% 10% 8%
Second or third language skills 6% 4% 4% 8% 2%
Accepting people from different cultures 5% 5% 5% 5% 6%
Living in an international world 4% 4% 4% 4% 4%
Entrepreneurial skills 3% 2% 3% 3% 2%
Spiritual development 2% 4% 2% 2% 3%
Appreciation of the arts 2% 2% 2% 2% 1% Note: Respondents provided three responses. Therefore, columns may not sum to 100%.
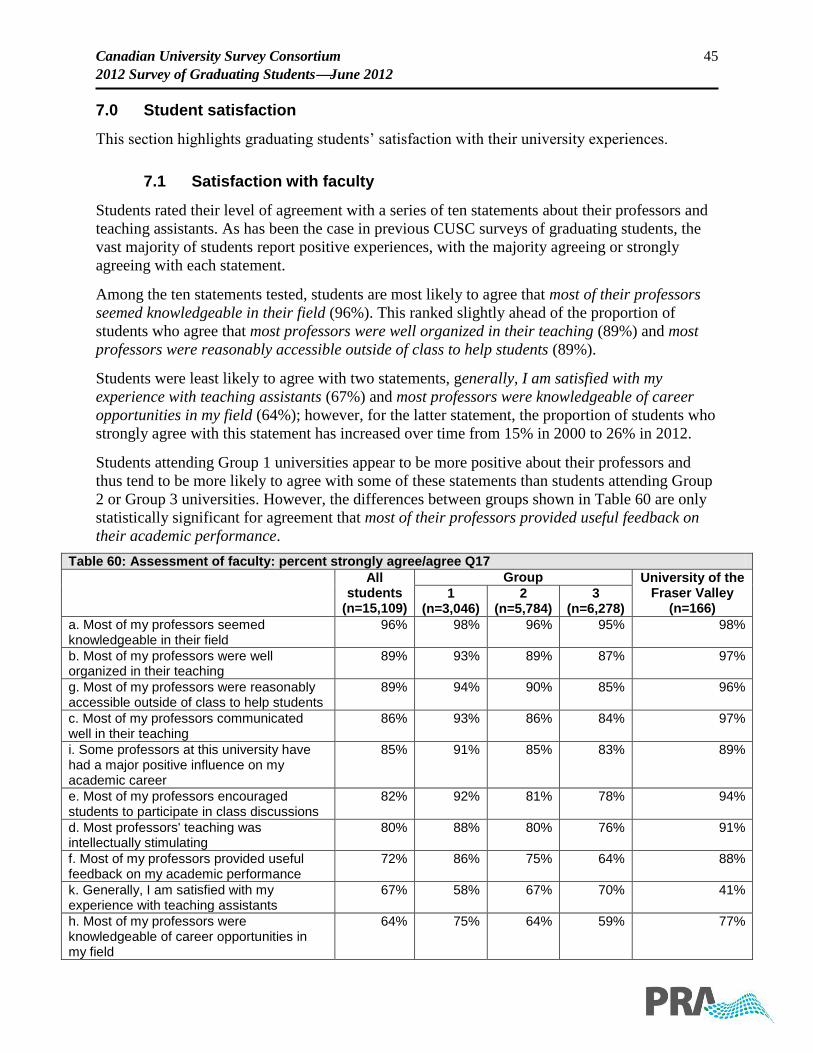
Canadian University Survey Consortium 45
2012 Survey of Graduating StudentsJune 2012
7.0 Student satisfaction
This section highlights graduating students’ satisfaction with their university experiences.
7.1 Satisfaction with faculty
Students rated their level of agreement with a series of ten statements about their professors and
teaching assistants. As has been the case in previous CUSC surveys of graduating students, the
vast majority of students report positive experiences, with the majority agreeing or strongly
agreeing with each statement.
Among the ten statements tested, students are most likely to agree that most of their professors
seemed knowledgeable in their field (96%). This ranked slightly ahead of the proportion of
students who agree that most professors were well organized in their teaching (89%) and most
professors were reasonably accessible outside of class to help students (89%).
Students were least likely to agree with two statements, generally, I am satisfied with my
experience with teaching assistants (67%) and most professors were knowledgeable of career
opportunities in my field (64%); however, for the latter statement, the proportion of students who
strongly agree with this statement has increased over time from 15% in 2000 to 26% in 2012.
Students attending Group 1 universities appear to be more positive about their professors and
thus tend to be more likely to agree with some of these statements than students attending Group
2 or Group 3 universities. However, the differences between groups shown in Table 60 are only
statistically significant for agreement that most of their professors provided useful feedback on
their academic performance.
Table 60: Assessment of faculty: percent strongly agree/agree Q17
All
students (n=15,109)
Group University of the Fraser Valley
(n=166) 1
(n=3,046) 2
(n=5,784) 3
(n=6,278)
a. Most of my professors seemed knowledgeable in their field
96% 98% 96% 95% 98%
b. Most of my professors were well organized in their teaching
89% 93% 89% 87% 97%
g. Most of my professors were reasonably accessible outside of class to help students
89% 94% 90% 85% 96%
c. Most of my professors communicated well in their teaching
86% 93% 86% 84% 97%
i. Some professors at this university have had a major positive influence on my academic career
85% 91% 85% 83% 89%
e. Most of my professors encouraged students to participate in class discussions
82% 92% 81% 78% 94%
d. Most professors' teaching was intellectually stimulating
80% 88% 80% 76% 91%
f. Most of my professors provided useful feedback on my academic performance
72% 86% 75% 64% 88%
k. Generally, I am satisfied with my experience with teaching assistants
67% 58% 67% 70% 41%
h. Most of my professors were knowledgeable of career opportunities in my field
64% 75% 64% 59% 77%
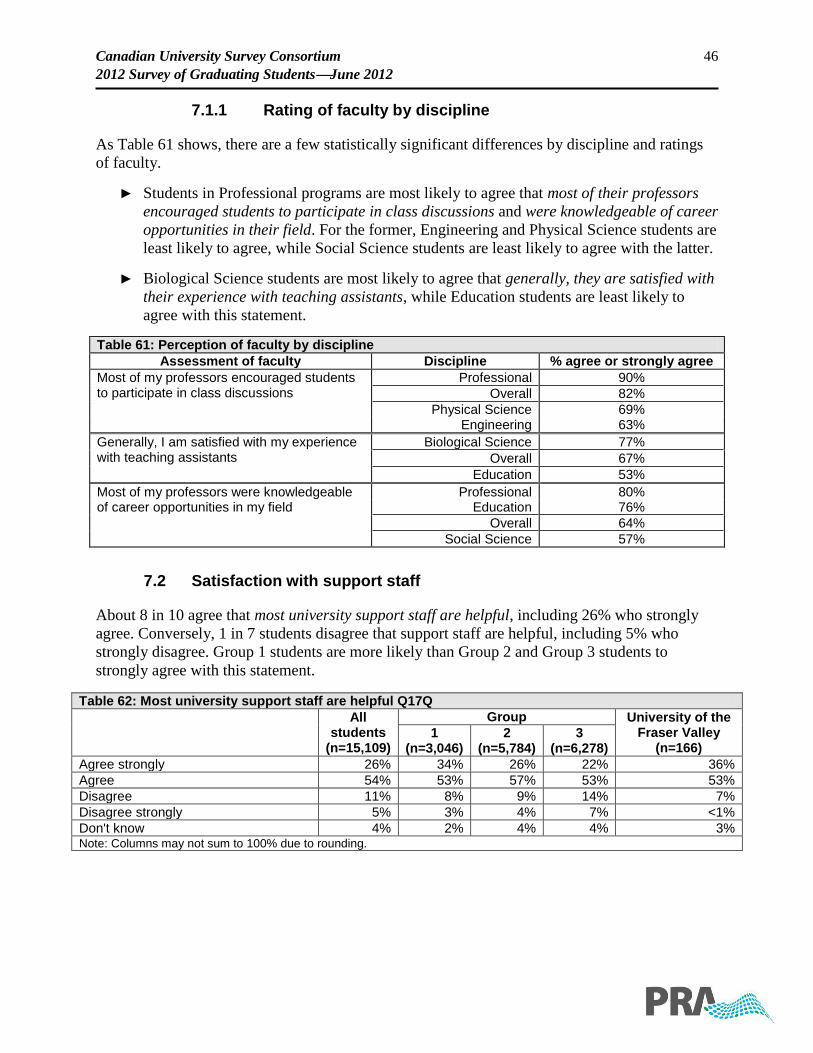
Canadian University Survey Consortium 46
2012 Survey of Graduating StudentsJune 2012
7.1.1 Rating of faculty by discipline
As Table 61 shows, there are a few statistically significant differences by discipline and ratings
of faculty.
► Students in Professional programs are most likely to agree that most of their professors
encouraged students to participate in class discussions and were knowledgeable of career
opportunities in their field. For the former, Engineering and Physical Science students are
least likely to agree, while Social Science students are least likely to agree with the latter.
► Biological Science students are most likely to agree that generally, they are satisfied with
their experience with teaching assistants, while Education students are least likely to
agree with this statement.
Table 61: Perception of faculty by discipline
Assessment of faculty Discipline % agree or strongly agree
Most of my professors encouraged students to participate in class discussions
Professional 90%
Overall 82%
Physical Science 69% Engineering 63%
Generally, I am satisfied with my experience with teaching assistants
Biological Science 77%
Overall 67%
Education 53%
Most of my professors were knowledgeable of career opportunities in my field
Professional 80% Education 76%
Overall 64%
Social Science 57%
7.2 Satisfaction with support staff
About 8 in 10 agree that most university support staff are helpful, including 26% who strongly
agree. Conversely, 1 in 7 students disagree that support staff are helpful, including 5% who
strongly disagree. Group 1 students are more likely than Group 2 and Group 3 students to
strongly agree with this statement.
Table 62: Most university support staff are helpful Q17Q
All
students (n=15,109)
Group University of the Fraser Valley
(n=166) 1
(n=3,046) 2
(n=5,784) 3
(n=6,278)
Agree strongly 26% 34% 26% 22% 36%
Agree 54% 53% 57% 53% 53%
Disagree 11% 8% 9% 14% 7%
Disagree strongly 5% 3% 4% 7% <1%
Don't know 4% 2% 4% 4% 3% Note: Columns may not sum to 100% due to rounding.
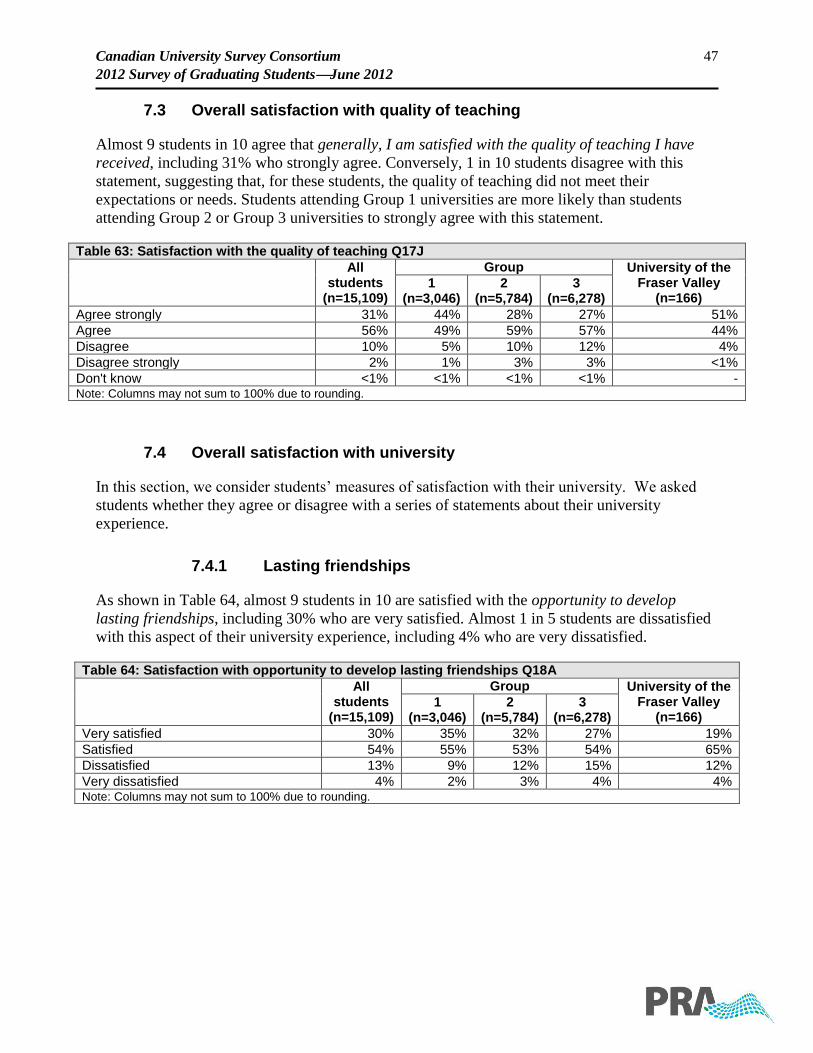
Canadian University Survey Consortium 47
2012 Survey of Graduating StudentsJune 2012
7.3 Overall satisfaction with quality of teaching
Almost 9 students in 10 agree that generally, I am satisfied with the quality of teaching I have
received, including 31% who strongly agree. Conversely, 1 in 10 students disagree with this
statement, suggesting that, for these students, the quality of teaching did not meet their
expectations or needs. Students attending Group 1 universities are more likely than students
attending Group 2 or Group 3 universities to strongly agree with this statement.
Table 63: Satisfaction with the quality of teaching Q17J
All
students (n=15,109)
Group University of the Fraser Valley
(n=166) 1
(n=3,046) 2
(n=5,784) 3
(n=6,278)
Agree strongly 31% 44% 28% 27% 51%
Agree 56% 49% 59% 57% 44%
Disagree 10% 5% 10% 12% 4%
Disagree strongly 2% 1% 3% 3% <1%
Don't know <1% <1% <1% <1% - Note: Columns may not sum to 100% due to rounding.
7.4 Overall satisfaction with university
In this section, we consider students’ measures of satisfaction with their university. We asked
students whether they agree or disagree with a series of statements about their university
experience.
7.4.1 Lasting friendships
As shown in Table 64, almost 9 students in 10 are satisfied with the opportunity to develop
lasting friendships, including 30% who are very satisfied. Almost 1 in 5 students are dissatisfied
with this aspect of their university experience, including 4% who are very dissatisfied.
Table 64: Satisfaction with opportunity to develop lasting friendships Q18A
All
students (n=15,109)
Group University of the Fraser Valley
(n=166) 1
(n=3,046) 2
(n=5,784) 3
(n=6,278)
Very satisfied 30% 35% 32% 27% 19%
Satisfied 54% 55% 53% 54% 65%
Dissatisfied 13% 9% 12% 15% 12%
Very dissatisfied 4% 2% 3% 4% 4% Note: Columns may not sum to 100% due to rounding.

Canadian University Survey Consortium 48
2012 Survey of Graduating StudentsJune 2012
7.4.2 Personal safety on campus
Overall, almost 9 students in 10 are satisfied with their personal safety on campus, including
28% who are very satisfied. About 1 in 7 students are dissatisfied with their safety on campus,
including 5% who are very dissatisfied. Students attending smaller, Group 1 universities are
more likely to be very satisfied with their personal safety on campus than Group 2 or Group 3
students.
Table 65: Satisfaction with personal safety on campus Q18F
All
students (n=15,109)
Group University of the Fraser Valley
(n=166) 1
(n=3,046) 2
(n=5,784) 3
(n=6,278)
Very satisfied 28% 37% 27% 25% 37%
Satisfied 58% 57% 63% 54% 61%
Dissatisfied 9% 5% 8% 12% 2%
Very dissatisfied 5% 2% 2% 9% <1% Note: Columns may not sum to 100% due to rounding.
7.4.3 Commitment to the environment
About 8 students in 10 are satisfied with their university’s commitment to environmental
sustainability, including 15% who are very satisfied. About 1 in 5 students are dissatisfied with
their university’s commitment, including 4% who are very dissatisfied. Group 1 students are
about twice as likely as Group 2 and Group 3 students to be very satisfied with their university’s
commitment to environmental sustainability.
Table 66: Satisfaction with university's commitment to environmental sustainability Q18G
All
students (n=15,109)
Group University of the Fraser Valley
(n=166) 1
(n=3,046) 2
(n=5,784) 3
(n=6,278)
Very satisfied 15% 26% 12% 14% 17%
Satisfied 65% 62% 66% 64% 67%
Dissatisfied 16% 10% 17% 19% 14%
Very dissatisfied 4% 2% 5% 3% 2% Note: Columns may not sum to 100% due to rounding.
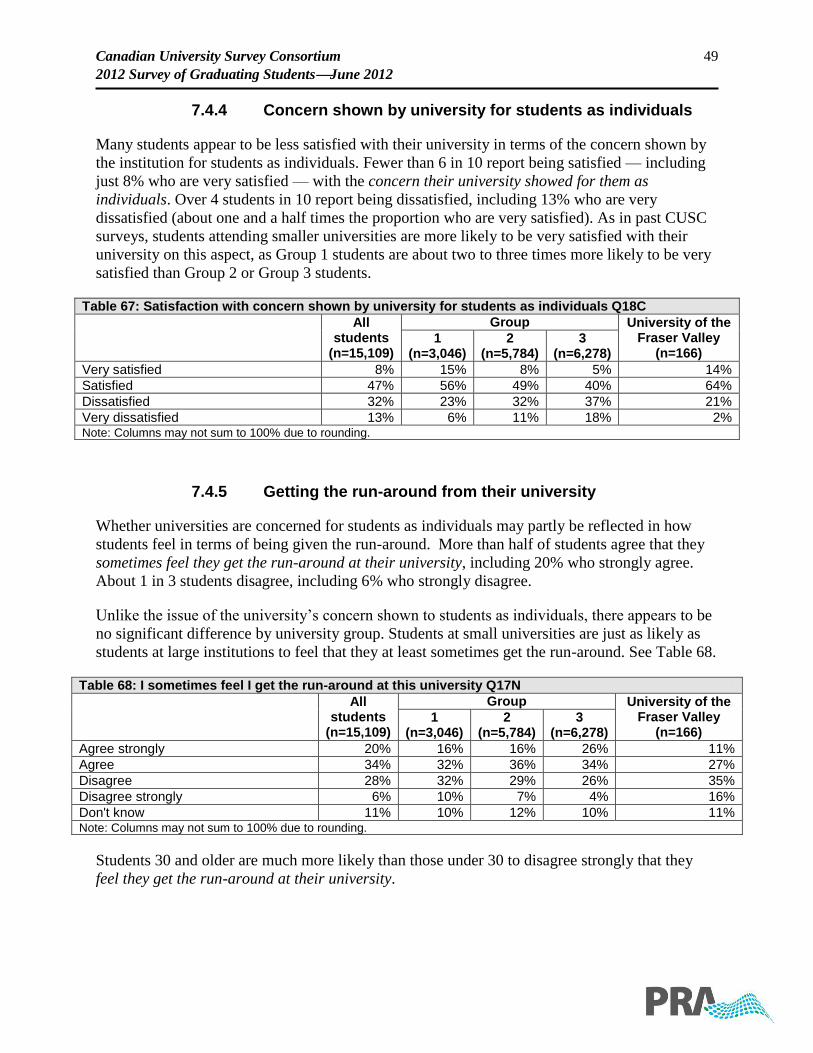
Canadian University Survey Consortium 49
2012 Survey of Graduating StudentsJune 2012
7.4.4 Concern shown by university for students as individuals
Many students appear to be less satisfied with their university in terms of the concern shown by
the institution for students as individuals. Fewer than 6 in 10 report being satisfied — including
just 8% who are very satisfied — with the concern their university showed for them as
individuals. Over 4 students in 10 report being dissatisfied, including 13% who are very
dissatisfied (about one and a half times the proportion who are very satisfied). As in past CUSC
surveys, students attending smaller universities are more likely to be very satisfied with their
university on this aspect, as Group 1 students are about two to three times more likely to be very
satisfied than Group 2 or Group 3 students.
Table 67: Satisfaction with concern shown by university for students as individuals Q18C
All
students (n=15,109)
Group University of the Fraser Valley
(n=166) 1
(n=3,046) 2
(n=5,784) 3
(n=6,278)
Very satisfied 8% 15% 8% 5% 14%
Satisfied 47% 56% 49% 40% 64%
Dissatisfied 32% 23% 32% 37% 21%
Very dissatisfied 13% 6% 11% 18% 2% Note: Columns may not sum to 100% due to rounding.
7.4.5 Getting the run-around from their university
Whether universities are concerned for students as individuals may partly be reflected in how
students feel in terms of being given the run-around. More than half of students agree that they
sometimes feel they get the run-around at their university, including 20% who strongly agree.
About 1 in 3 students disagree, including 6% who strongly disagree.
Unlike the issue of the university’s concern shown to students as individuals, there appears to be
no significant difference by university group. Students at small universities are just as likely as
students at large institutions to feel that they at least sometimes get the run-around. See Table 68.
Table 68: I sometimes feel I get the run-around at this university Q17N
All students
(n=15,109)
Group University of the Fraser Valley
(n=166) 1
(n=3,046) 2
(n=5,784) 3
(n=6,278)
Agree strongly 20% 16% 16% 26% 11%
Agree 34% 32% 36% 34% 27%
Disagree 28% 32% 29% 26% 35%
Disagree strongly 6% 10% 7% 4% 16%
Don't know 11% 10% 12% 10% 11% Note: Columns may not sum to 100% due to rounding.
Students 30 and older are much more likely than those under 30 to disagree strongly that they
feel they get the run-around at their university.
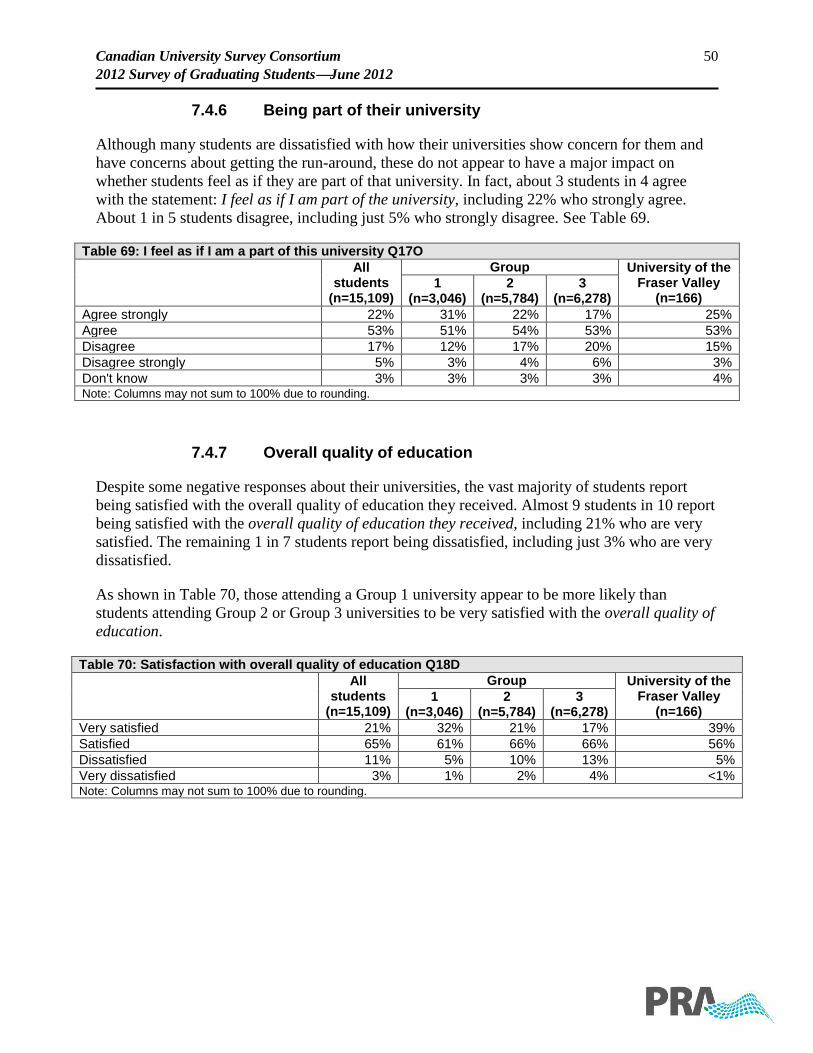
Canadian University Survey Consortium 50
2012 Survey of Graduating StudentsJune 2012
7.4.6 Being part of their university
Although many students are dissatisfied with how their universities show concern for them and
have concerns about getting the run-around, these do not appear to have a major impact on
whether students feel as if they are part of that university. In fact, about 3 students in 4 agree
with the statement: I feel as if I am part of the university, including 22% who strongly agree.
About 1 in 5 students disagree, including just 5% who strongly disagree. See Table 69.
Table 69: I feel as if I am a part of this university Q17O
All
students (n=15,109)
Group University of the Fraser Valley
(n=166) 1
(n=3,046) 2
(n=5,784) 3
(n=6,278)
Agree strongly 22% 31% 22% 17% 25%
Agree 53% 51% 54% 53% 53%
Disagree 17% 12% 17% 20% 15%
Disagree strongly 5% 3% 4% 6% 3%
Don't know 3% 3% 3% 3% 4% Note: Columns may not sum to 100% due to rounding.
7.4.7 Overall quality of education
Despite some negative responses about their universities, the vast majority of students report
being satisfied with the overall quality of education they received. Almost 9 students in 10 report
being satisfied with the overall quality of education they received, including 21% who are very
satisfied. The remaining 1 in 7 students report being dissatisfied, including just 3% who are very
dissatisfied.
As shown in Table 70, those attending a Group 1 university appear to be more likely than
students attending Group 2 or Group 3 universities to be very satisfied with the overall quality of
education.
Table 70: Satisfaction with overall quality of education Q18D
All
students (n=15,109)
Group University of the Fraser Valley
(n=166) 1
(n=3,046) 2
(n=5,784) 3
(n=6,278)
Very satisfied 21% 32% 21% 17% 39%
Satisfied 65% 61% 66% 66% 56%
Dissatisfied 11% 5% 10% 13% 5%
Very dissatisfied 3% 1% 2% 4% <1% Note: Columns may not sum to 100% due to rounding.
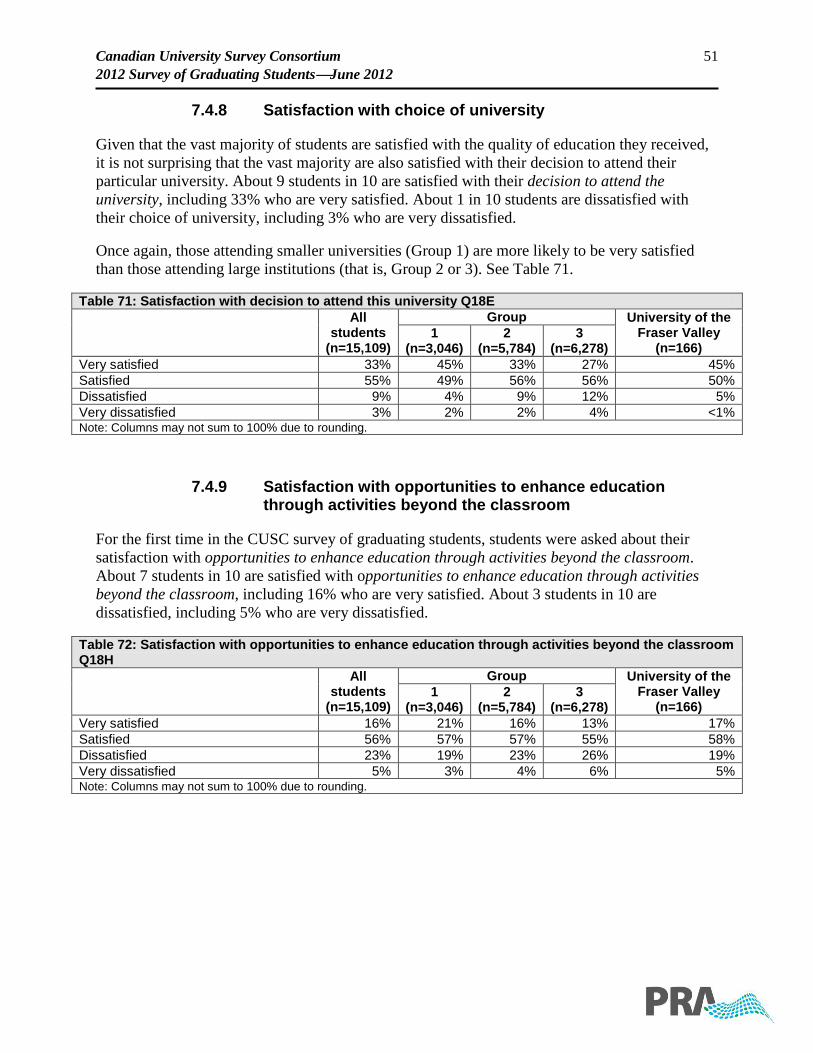
Canadian University Survey Consortium 51
2012 Survey of Graduating StudentsJune 2012
7.4.8 Satisfaction with choice of university
Given that the vast majority of students are satisfied with the quality of education they received,
it is not surprising that the vast majority are also satisfied with their decision to attend their
particular university. About 9 students in 10 are satisfied with their decision to attend the
university, including 33% who are very satisfied. About 1 in 10 students are dissatisfied with
their choice of university, including 3% who are very dissatisfied.
Once again, those attending smaller universities (Group 1) are more likely to be very satisfied
than those attending large institutions (that is, Group 2 or 3). See Table 71.
Table 71: Satisfaction with decision to attend this university Q18E
All
students (n=15,109)
Group University of the Fraser Valley
(n=166) 1
(n=3,046) 2
(n=5,784) 3
(n=6,278)
Very satisfied 33% 45% 33% 27% 45%
Satisfied 55% 49% 56% 56% 50%
Dissatisfied 9% 4% 9% 12% 5%
Very dissatisfied 3% 2% 2% 4% <1% Note: Columns may not sum to 100% due to rounding.
7.4.9 Satisfaction with opportunities to enhance education through activities beyond the classroom
For the first time in the CUSC survey of graduating students, students were asked about their
satisfaction with opportunities to enhance education through activities beyond the classroom.
About 7 students in 10 are satisfied with opportunities to enhance education through activities
beyond the classroom, including 16% who are very satisfied. About 3 students in 10 are
dissatisfied, including 5% who are very dissatisfied.
Table 72: Satisfaction with opportunities to enhance education through activities beyond the classroom Q18H
All
students (n=15,109)
Group University of the Fraser Valley
(n=166) 1
(n=3,046) 2
(n=5,784) 3
(n=6,278)
Very satisfied 16% 21% 16% 13% 17%
Satisfied 56% 57% 57% 55% 58%
Dissatisfied 23% 19% 23% 26% 19%
Very dissatisfied 5% 3% 4% 6% 5% Note: Columns may not sum to 100% due to rounding.
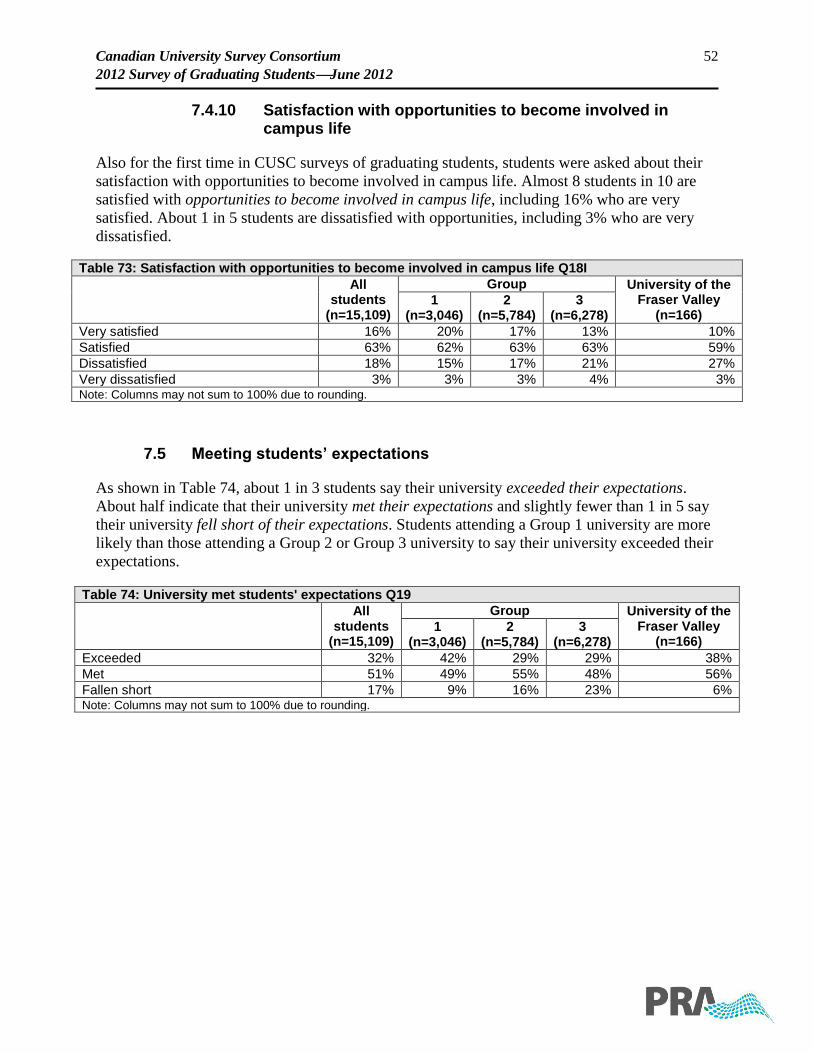
Canadian University Survey Consortium 52
2012 Survey of Graduating StudentsJune 2012
7.4.10 Satisfaction with opportunities to become involved in campus life
Also for the first time in CUSC surveys of graduating students, students were asked about their
satisfaction with opportunities to become involved in campus life. Almost 8 students in 10 are
satisfied with opportunities to become involved in campus life, including 16% who are very
satisfied. About 1 in 5 students are dissatisfied with opportunities, including 3% who are very
dissatisfied.
Table 73: Satisfaction with opportunities to become involved in campus life Q18I
All
students (n=15,109)
Group University of the Fraser Valley
(n=166) 1
(n=3,046) 2
(n=5,784) 3
(n=6,278)
Very satisfied 16% 20% 17% 13% 10%
Satisfied 63% 62% 63% 63% 59%
Dissatisfied 18% 15% 17% 21% 27%
Very dissatisfied 3% 3% 3% 4% 3% Note: Columns may not sum to 100% due to rounding.
7.5 Meeting students’ expectations
As shown in Table 74, about 1 in 3 students say their university exceeded their expectations.
About half indicate that their university met their expectations and slightly fewer than 1 in 5 say
their university fell short of their expectations. Students attending a Group 1 university are more
likely than those attending a Group 2 or Group 3 university to say their university exceeded their
expectations.
Table 74: University met students' expectations Q19
All
students (n=15,109)
Group University of the Fraser Valley
(n=166) 1
(n=3,046) 2
(n=5,784) 3
(n=6,278)
Exceeded 32% 42% 29% 29% 38%
Met 51% 49% 55% 48% 56%
Fallen short 17% 9% 16% 23% 6% Note: Columns may not sum to 100% due to rounding.
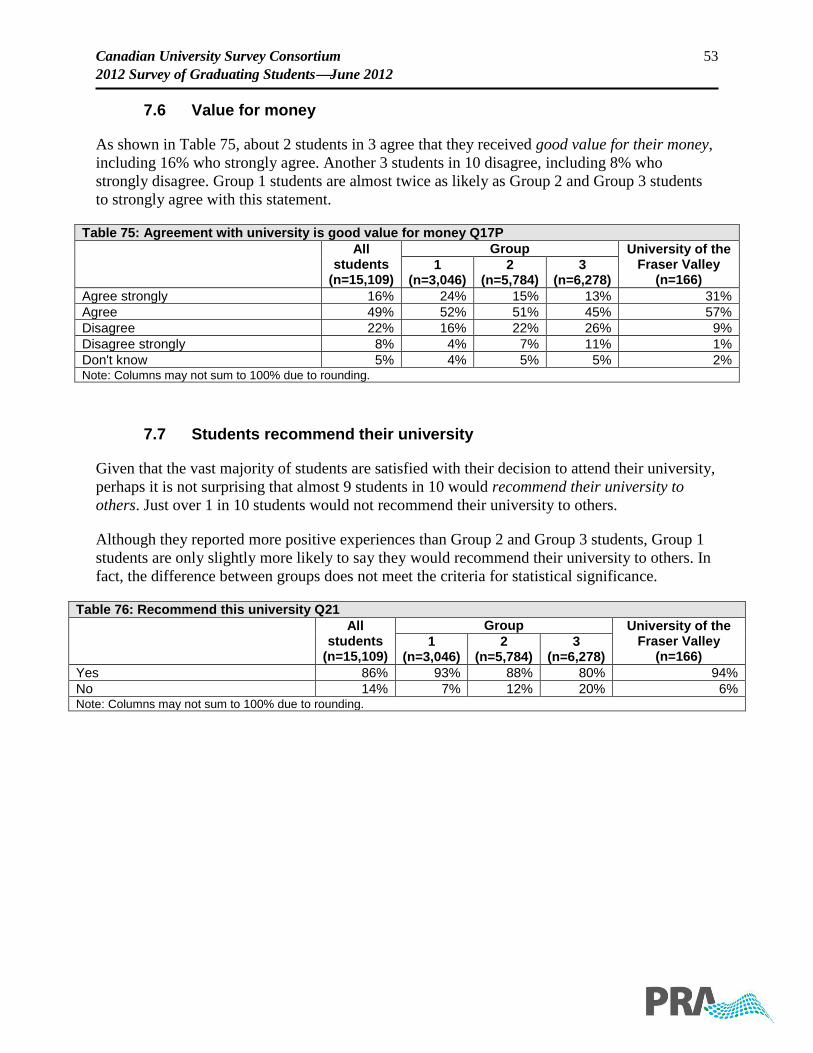
Canadian University Survey Consortium 53
2012 Survey of Graduating StudentsJune 2012
7.6 Value for money
As shown in Table 75, about 2 students in 3 agree that they received good value for their money,
including 16% who strongly agree. Another 3 students in 10 disagree, including 8% who
strongly disagree. Group 1 students are almost twice as likely as Group 2 and Group 3 students
to strongly agree with this statement.
Table 75: Agreement with university is good value for money Q17P
All
students (n=15,109)
Group University of the Fraser Valley
(n=166) 1
(n=3,046) 2
(n=5,784) 3
(n=6,278)
Agree strongly 16% 24% 15% 13% 31%
Agree 49% 52% 51% 45% 57%
Disagree 22% 16% 22% 26% 9%
Disagree strongly 8% 4% 7% 11% 1%
Don't know 5% 4% 5% 5% 2% Note: Columns may not sum to 100% due to rounding.
7.7 Students recommend their university
Given that the vast majority of students are satisfied with their decision to attend their university,
perhaps it is not surprising that almost 9 students in 10 would recommend their university to
others. Just over 1 in 10 students would not recommend their university to others.
Although they reported more positive experiences than Group 2 and Group 3 students, Group 1
students are only slightly more likely to say they would recommend their university to others. In
fact, the difference between groups does not meet the criteria for statistical significance.
Table 76: Recommend this university Q21
All
students (n=15,109)
Group University of the Fraser Valley
(n=166) 1
(n=3,046) 2
(n=5,784) 3
(n=6,278)
Yes 86% 93% 88% 80% 94%
No 14% 7% 12% 20% 6% Note: Columns may not sum to 100% due to rounding.
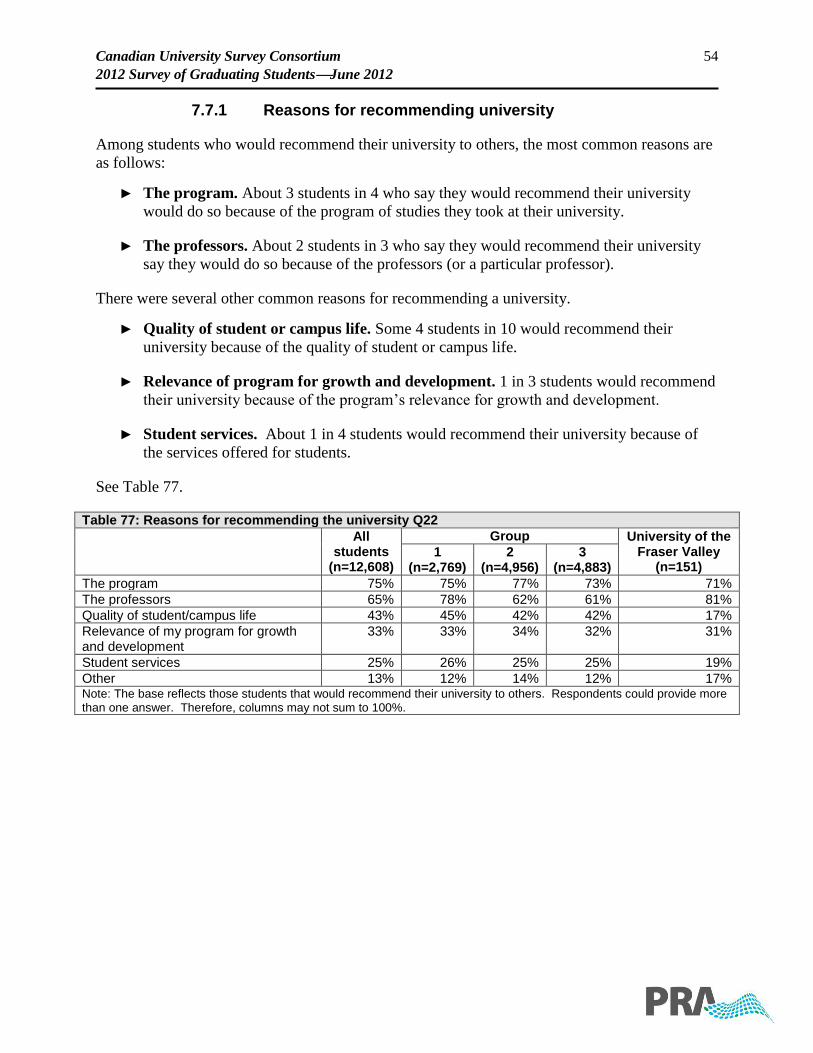
Canadian University Survey Consortium 54
2012 Survey of Graduating StudentsJune 2012
7.7.1 Reasons for recommending university
Among students who would recommend their university to others, the most common reasons are
as follows:
► The program. About 3 students in 4 who say they would recommend their university
would do so because of the program of studies they took at their university.
► The professors. About 2 students in 3 who say they would recommend their university
say they would do so because of the professors (or a particular professor).
There were several other common reasons for recommending a university.
► Quality of student or campus life. Some 4 students in 10 would recommend their
university because of the quality of student or campus life.
► Relevance of program for growth and development. 1 in 3 students would recommend
their university because of the program’s relevance for growth and development.
► Student services. About 1 in 4 students would recommend their university because of
the services offered for students.
See Table 77.
Table 77: Reasons for recommending the university Q22
All
students (n=12,608)
Group University of the Fraser Valley
(n=151) 1
(n=2,769) 2
(n=4,956) 3
(n=4,883)
The program 75% 75% 77% 73% 71%
The professors 65% 78% 62% 61% 81%
Quality of student/campus life 43% 45% 42% 42% 17%
Relevance of my program for growth and development
33% 33% 34% 32% 31%
Student services 25% 26% 25% 25% 19%
Other 13% 12% 14% 12% 17% Note: The base reflects those students that would recommend their university to others. Respondents could provide more than one answer. Therefore, columns may not sum to 100%.
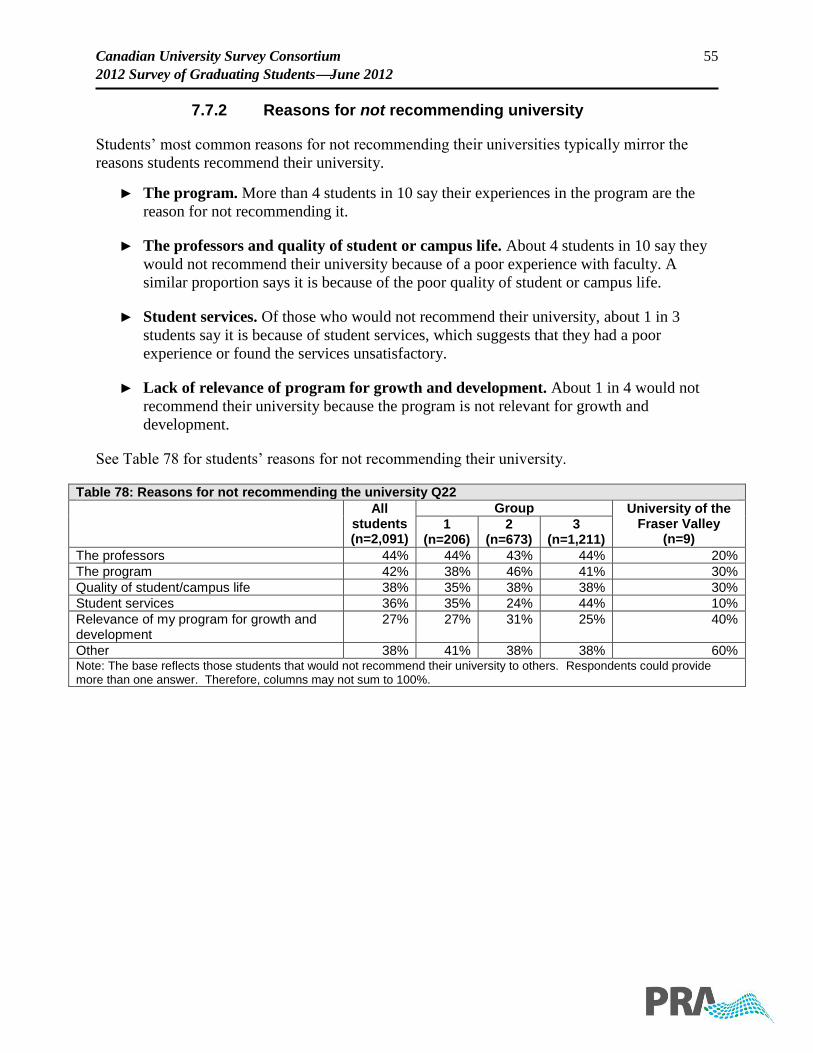
Canadian University Survey Consortium 55
2012 Survey of Graduating StudentsJune 2012
7.7.2 Reasons for not recommending university
Students’ most common reasons for not recommending their universities typically mirror the
reasons students recommend their university.
► The program. More than 4 students in 10 say their experiences in the program are the
reason for not recommending it.
► The professors and quality of student or campus life. About 4 students in 10 say they
would not recommend their university because of a poor experience with faculty. A
similar proportion says it is because of the poor quality of student or campus life.
► Student services. Of those who would not recommend their university, about 1 in 3
students say it is because of student services, which suggests that they had a poor
experience or found the services unsatisfactory.
► Lack of relevance of program for growth and development. About 1 in 4 would not
recommend their university because the program is not relevant for growth and
development.
See Table 78 for students’ reasons for not recommending their university.
Table 78: Reasons for not recommending the university Q22
All
students (n=2,091)
Group University of the Fraser Valley
(n=9) 1
(n=206) 2
(n=673) 3
(n=1,211)
The professors 44% 44% 43% 44% 20%
The program 42% 38% 46% 41% 30%
Quality of student/campus life 38% 35% 38% 38% 30%
Student services 36% 35% 24% 44% 10%
Relevance of my program for growth and development
27% 27% 31% 25% 40%
Other 38% 41% 38% 38% 60% Note: The base reflects those students that would not recommend their university to others. Respondents could provide more than one answer. Therefore, columns may not sum to 100%.
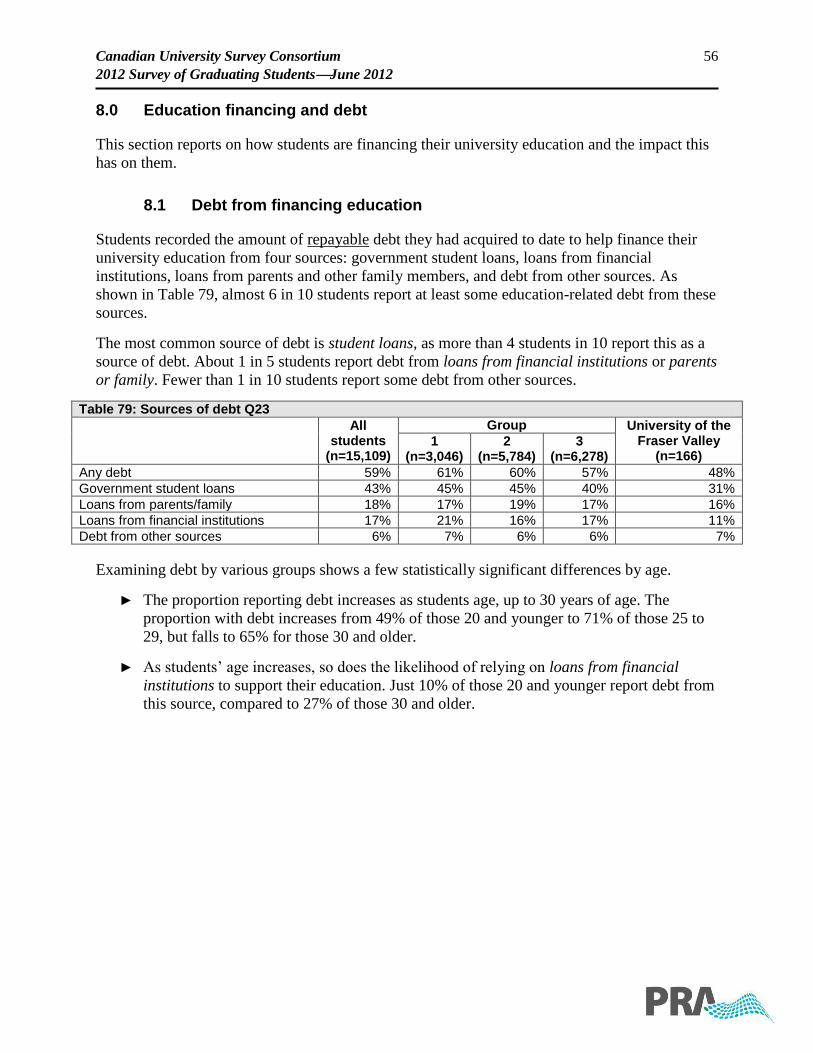
Canadian University Survey Consortium 56
2012 Survey of Graduating StudentsJune 2012
8.0 Education financing and debt
This section reports on how students are financing their university education and the impact this
has on them.
8.1 Debt from financing education
Students recorded the amount of repayable debt they had acquired to date to help finance their
university education from four sources: government student loans, loans from financial
institutions, loans from parents and other family members, and debt from other sources. As
shown in Table 79, almost 6 in 10 students report at least some education-related debt from these
sources.
The most common source of debt is student loans, as more than 4 students in 10 report this as a
source of debt. About 1 in 5 students report debt from loans from financial institutions or parents
or family. Fewer than 1 in 10 students report some debt from other sources.
Table 79: Sources of debt Q23
All students
(n=15,109)
Group University of the Fraser Valley
(n=166) 1
(n=3,046) 2
(n=5,784) 3
(n=6,278)
Any debt 59% 61% 60% 57% 48%
Government student loans 43% 45% 45% 40% 31%
Loans from parents/family 18% 17% 19% 17% 16%
Loans from financial institutions 17% 21% 16% 17% 11%
Debt from other sources 6% 7% 6% 6% 7%
Examining debt by various groups shows a few statistically significant differences by age.
► The proportion reporting debt increases as students age, up to 30 years of age. The
proportion with debt increases from 49% of those 20 and younger to 71% of those 25 to
29, but falls to 65% for those 30 and older.
► As students’ age increases, so does the likelihood of relying on loans from financial
institutions to support their education. Just 10% of those 20 and younger report debt from
this source, compared to 27% of those 30 and older.
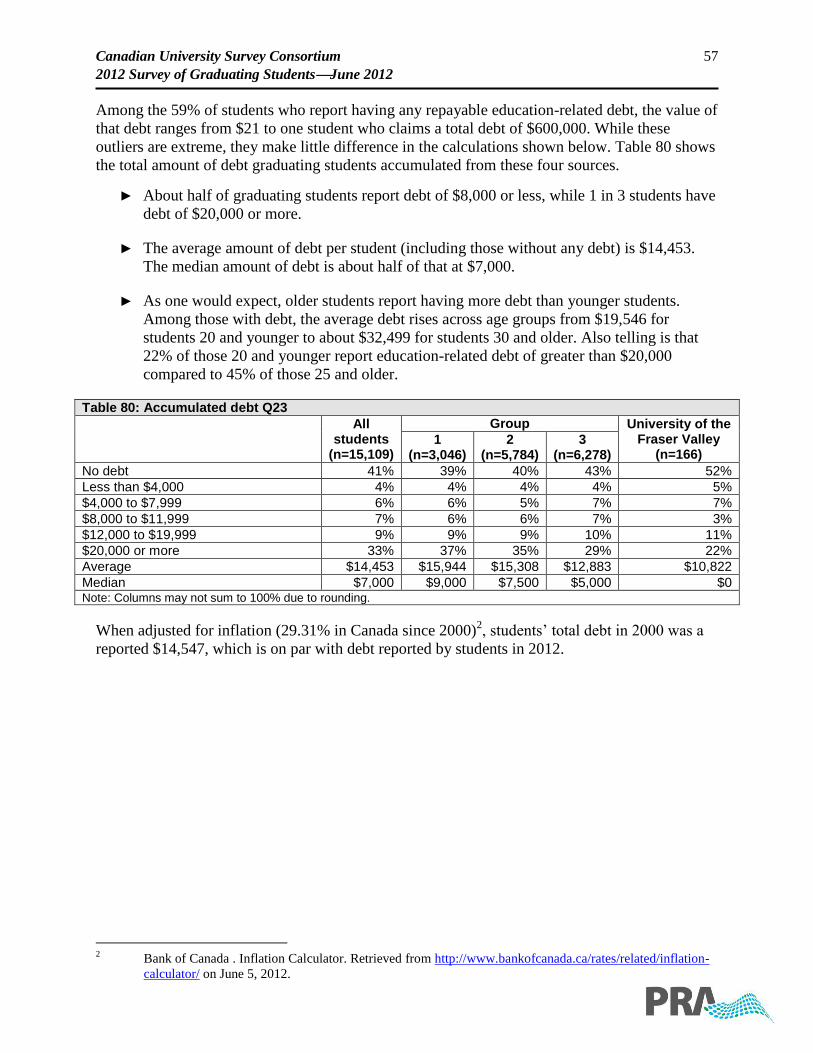
Canadian University Survey Consortium 57
2012 Survey of Graduating StudentsJune 2012
Among the 59% of students who report having any repayable education-related debt, the value of
that debt ranges from $21 to one student who claims a total debt of $600,000. While these
outliers are extreme, they make little difference in the calculations shown below. Table 80 shows
the total amount of debt graduating students accumulated from these four sources.
► About half of graduating students report debt of $8,000 or less, while 1 in 3 students have
debt of $20,000 or more.
► The average amount of debt per student (including those without any debt) is $14,453.
The median amount of debt is about half of that at $7,000.
► As one would expect, older students report having more debt than younger students.
Among those with debt, the average debt rises across age groups from $19,546 for
students 20 and younger to about $32,499 for students 30 and older. Also telling is that
22% of those 20 and younger report education-related debt of greater than $20,000
compared to 45% of those 25 and older.
Table 80: Accumulated debt Q23
All students
(n=15,109)
Group University of the Fraser Valley
(n=166) 1
(n=3,046) 2
(n=5,784) 3
(n=6,278)
No debt 41% 39% 40% 43% 52%
Less than $4,000 4% 4% 4% 4% 5%
$4,000 to $7,999 6% 6% 5% 7% 7%
$8,000 to $11,999 7% 6% 6% 7% 3%
$12,000 to $19,999 9% 9% 9% 10% 11%
$20,000 or more 33% 37% 35% 29% 22%
Average $14,453 $15,944 $15,308 $12,883 $10,822
Median $7,000 $9,000 $7,500 $5,000 $0 Note: Columns may not sum to 100% due to rounding.
When adjusted for inflation (29.31% in Canada since 2000)2, students’ total debt in 2000 was a
reported $14,547, which is on par with debt reported by students in 2012.
2 Bank of Canada . Inflation Calculator. Retrieved from http://www.bankofcanada.ca/rates/related/inflation-
calculator/ on June 5, 2012.

Canadian University Survey Consortium 58
2012 Survey of Graduating StudentsJune 2012
8.2 Average debt by source
The source of much of this debt appears to be student loans (see Table 81). Among all students,
government student loans account for the bulk of the debt at $9,138. Loans from financial
institutions ($2,521) and loans from parents or other family members ($2,376) are about one-
quarter the size of the average government student loan debt.
Table 81: Average debt by source (all respondents) Q23
All
students (n=15,109)
Group University of the Fraser Valley
(n=166) 1
(n=3,046) 2
(n=5,784) 3
(n=6,278)
Total average debt $14,453 $15,944 $15,308 $12,883 $10,822
- Government student loans $9,138 $10,309 $9,594 $8,109 $7,614
- Loans from financial institutions $2,521 $3,087 $2,402 $2,347 $1,225
- Loans from parents/family $2,376 $2,067 $2,845 $2,087 $1,664
- Debt from other sources $419 $480 $467 $342 $320
Results for students reporting debt show the following:
► The average total debt among these graduating students reporting debt is approximately
$24,579. The median value of total debt is only slightly lower at $20,000.
► On average, government student loans account for approximately 62% of all debt.
Among those with this type of debt, the average is $21,278. The median value is slightly
lower at $20,000.
► Loans from financial institutions account for about 17% of the total. Among those with
this type of debt, the average amount owing is $14,482. The median value of the debt is
lower at $10,000.
► Loans from parents or other family members account for about 18% of the total. Among
those with debt owed to family, the average amount owing is $13,442. However, the
median value is lower at $8,000.
► Other sources account for about 3% of the total. Those with debt from other sources
report that it averages $7,028. Again, the median value of this debt is considerably lower
at just under $4,000.
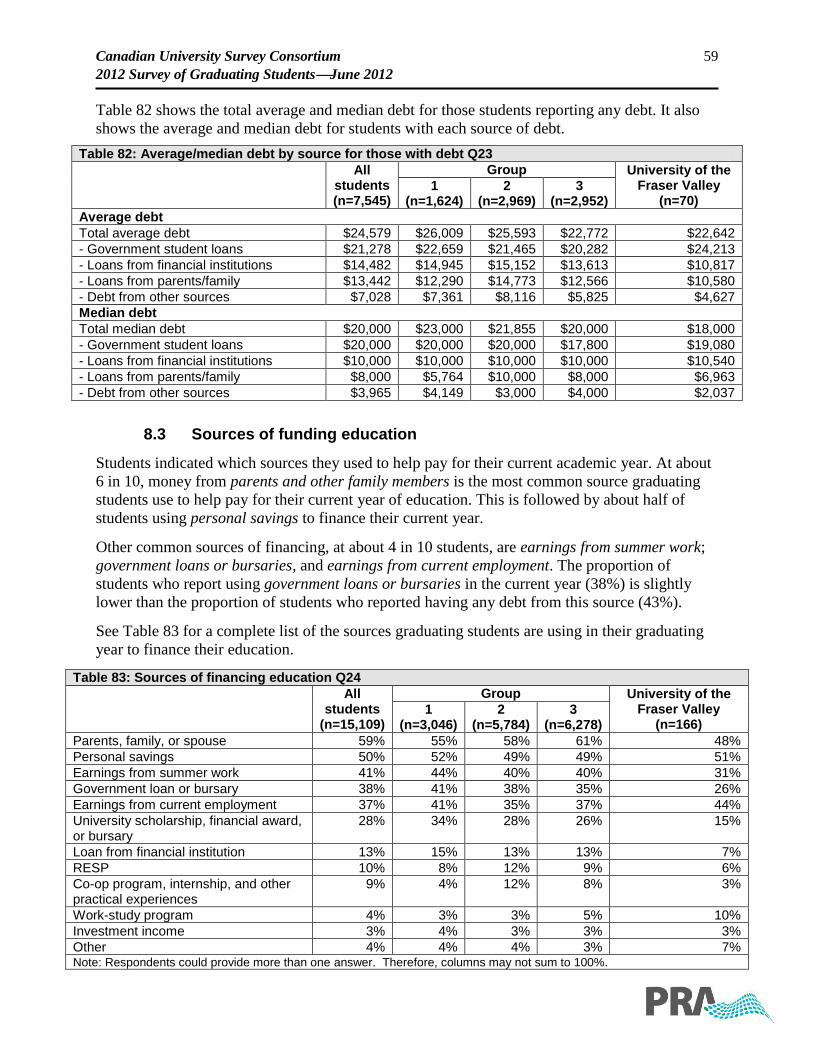
Canadian University Survey Consortium 59
2012 Survey of Graduating StudentsJune 2012
Table 82 shows the total average and median debt for those students reporting any debt. It also
shows the average and median debt for students with each source of debt.
Table 82: Average/median debt by source for those with debt Q23
All
students (n=7,545)
Group University of the Fraser Valley
(n=70) 1
(n=1,624) 2
(n=2,969) 3
(n=2,952)
Average debt
Total average debt $24,579 $26,009 $25,593 $22,772 $22,642
- Government student loans $21,278 $22,659 $21,465 $20,282 $24,213
- Loans from financial institutions $14,482 $14,945 $15,152 $13,613 $10,817
- Loans from parents/family $13,442 $12,290 $14,773 $12,566 $10,580
- Debt from other sources $7,028 $7,361 $8,116 $5,825 $4,627
Median debt
Total median debt $20,000 $23,000 $21,855 $20,000 $18,000
- Government student loans $20,000 $20,000 $20,000 $17,800 $19,080
- Loans from financial institutions $10,000 $10,000 $10,000 $10,000 $10,540
- Loans from parents/family $8,000 $5,764 $10,000 $8,000 $6,963
- Debt from other sources $3,965 $4,149 $3,000 $4,000 $2,037
8.3 Sources of funding education
Students indicated which sources they used to help pay for their current academic year. At about
6 in 10, money from parents and other family members is the most common source graduating
students use to help pay for their current year of education. This is followed by about half of
students using personal savings to finance their current year.
Other common sources of financing, at about 4 in 10 students, are earnings from summer work;
government loans or bursaries, and earnings from current employment. The proportion of
students who report using government loans or bursaries in the current year (38%) is slightly
lower than the proportion of students who reported having any debt from this source (43%).
See Table 83 for a complete list of the sources graduating students are using in their graduating
year to finance their education.
Table 83: Sources of financing education Q24
All
students (n=15,109)
Group University of the Fraser Valley
(n=166) 1
(n=3,046) 2
(n=5,784) 3
(n=6,278)
Parents, family, or spouse 59% 55% 58% 61% 48%
Personal savings 50% 52% 49% 49% 51%
Earnings from summer work 41% 44% 40% 40% 31%
Government loan or bursary 38% 41% 38% 35% 26%
Earnings from current employment 37% 41% 35% 37% 44%
University scholarship, financial award, or bursary
28% 34% 28% 26% 15%
Loan from financial institution 13% 15% 13% 13% 7%
RESP 10% 8% 12% 9% 6%
Co-op program, internship, and other practical experiences
9% 4% 12% 8% 3%
Work-study program 4% 3% 3% 5% 10%
Investment income 3% 4% 3% 3% 3%
Other 4% 4% 4% 3% 7% Note: Respondents could provide more than one answer. Therefore, columns may not sum to 100%.
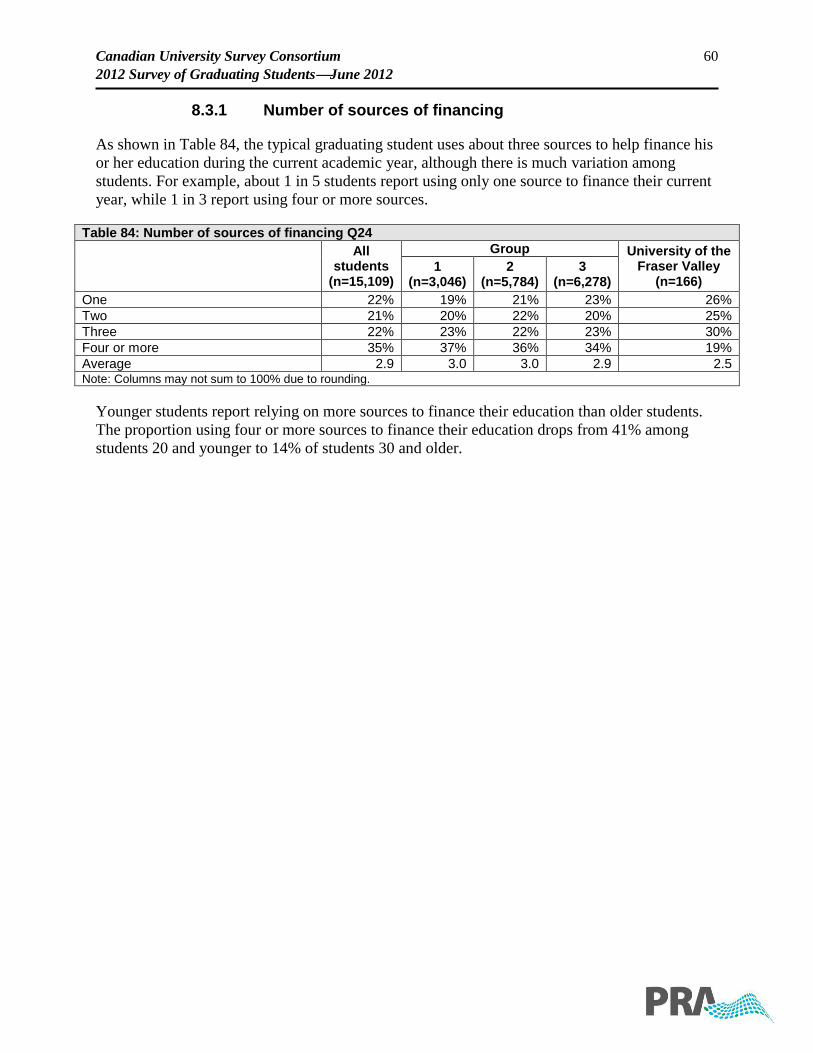
Canadian University Survey Consortium 60
2012 Survey of Graduating StudentsJune 2012
8.3.1 Number of sources of financing
As shown in Table 84, the typical graduating student uses about three sources to help finance his
or her education during the current academic year, although there is much variation among
students. For example, about 1 in 5 students report using only one source to finance their current
year, while 1 in 3 report using four or more sources.
Table 84: Number of sources of financing Q24
All
students (n=15,109)
Group University of the Fraser Valley
(n=166) 1
(n=3,046) 2
(n=5,784) 3
(n=6,278)
One 22% 19% 21% 23% 26%
Two 21% 20% 22% 20% 25%
Three 22% 23% 22% 23% 30%
Four or more 35% 37% 36% 34% 19%
Average 2.9 3.0 3.0 2.9 2.5 Note: Columns may not sum to 100% due to rounding.
Younger students report relying on more sources to finance their education than older students.
The proportion using four or more sources to finance their education drops from 41% among
students 20 and younger to 14% of students 30 and older.
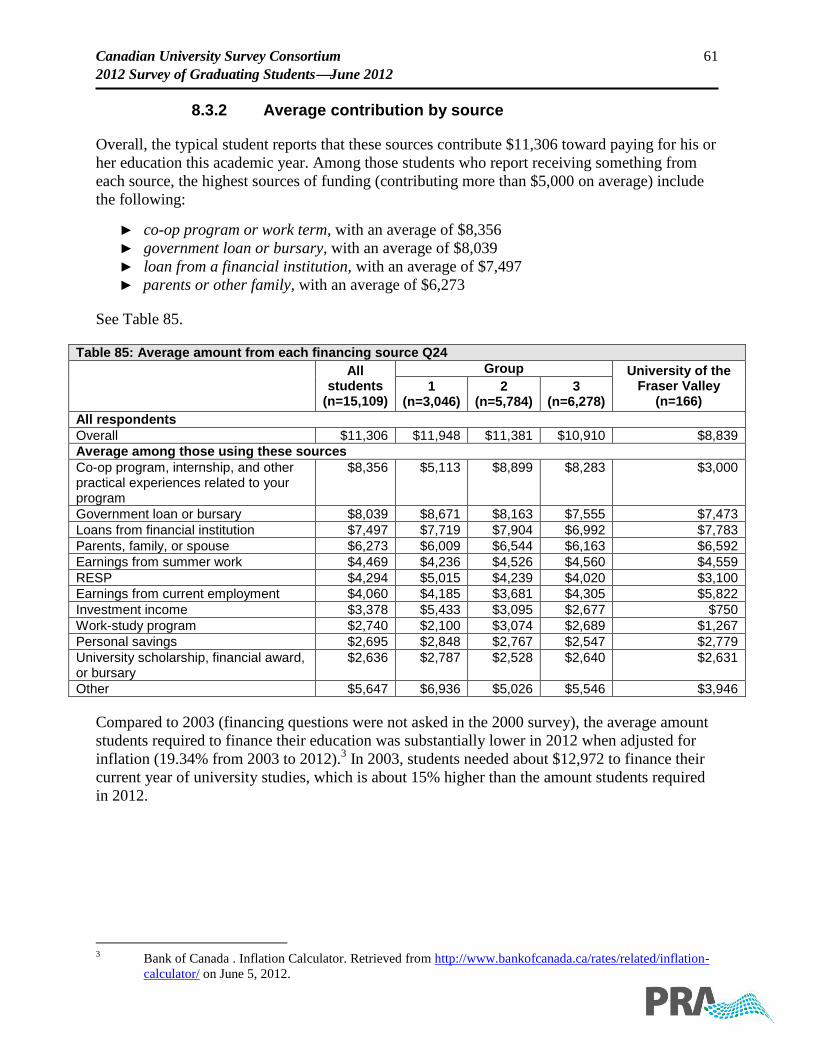
Canadian University Survey Consortium 61
2012 Survey of Graduating StudentsJune 2012
8.3.2 Average contribution by source
Overall, the typical student reports that these sources contribute $11,306 toward paying for his or
her education this academic year. Among those students who report receiving something from
each source, the highest sources of funding (contributing more than $5,000 on average) include
the following:
► co-op program or work term, with an average of $8,356
► government loan or bursary, with an average of $8,039
► loan from a financial institution, with an average of $7,497
► parents or other family, with an average of $6,273
See Table 85.
Table 85: Average amount from each financing source Q24
All
students (n=15,109)
Group University of the Fraser Valley
(n=166) 1
(n=3,046) 2
(n=5,784) 3
(n=6,278)
All respondents
Overall $11,306 $11,948 $11,381 $10,910 $8,839
Average among those using these sources
Co-op program, internship, and other practical experiences related to your program
$8,356 $5,113 $8,899 $8,283 $3,000
Government loan or bursary $8,039 $8,671 $8,163 $7,555 $7,473
Loans from financial institution $7,497 $7,719 $7,904 $6,992 $7,783
Parents, family, or spouse $6,273 $6,009 $6,544 $6,163 $6,592
Earnings from summer work $4,469 $4,236 $4,526 $4,560 $4,559
RESP $4,294 $5,015 $4,239 $4,020 $3,100
Earnings from current employment $4,060 $4,185 $3,681 $4,305 $5,822
Investment income $3,378 $5,433 $3,095 $2,677 $750
Work-study program $2,740 $2,100 $3,074 $2,689 $1,267
Personal savings $2,695 $2,848 $2,767 $2,547 $2,779
University scholarship, financial award, or bursary
$2,636 $2,787 $2,528 $2,640 $2,631
Other $5,647 $6,936 $5,026 $5,546 $3,946
Compared to 2003 (financing questions were not asked in the 2000 survey), the average amount
students required to finance their education was substantially lower in 2012 when adjusted for
inflation (19.34% from 2003 to 2012).3 In 2003, students needed about $12,972 to finance their
current year of university studies, which is about 15% higher than the amount students required
in 2012.
3 Bank of Canada . Inflation Calculator. Retrieved from http://www.bankofcanada.ca/rates/related/inflation-
calculator/ on June 5, 2012.

Canadian University Survey Consortium 62
2012 Survey of Graduating StudentsJune 2012
Table 86 shows the median amounts for the same sources of financing presented in the previous
table.
Table 86: Median amount from each financing source Q24
All
students (n=15,109)
Group University of the Fraser Valley
(n=166) 1
(n=3,046) 2
(n=5,784) 3
(n=6,278)
All respondents
Overall $8,452 $9,000 $8,000 $8,000 $6,000
Median among those using these sources
Government loan or bursary $7,000 $7,193 $7,000 $6,000 $5,993
Co-op program, internship, and other practical experiences related to your program
$6,747 $3,599 $7,000 $8,000 $3,080
Loan from financial institution $5,000 $6,000 $5,000 $5,000 $8,620
Parents, family, or spouse $4,000 $4,000 $4,093 $4,000 $4,037
RESP $3,000 $3,581 $3,000 $3,000 $3,250
Earnings from summer work $3,000 $3,000 $3,000 $3,000 $4,008
Earnings from current employment $2,000 $2,000 $2,000 $2,000 $3,037
Personal savings $2,000 $2,000 $2,000 $1,800 $1,982
Work-study program $2,000 $1,524 $2,000 $2,000 $1,250
University scholarship, financial award, or bursary
$1,800 $1,500 $1,500 $2,000 $1,270
Investment income $1,000 $1,189 $1,000 $732 $770
Other $3,000 $4,000 $3,000 $3,437 $2,365
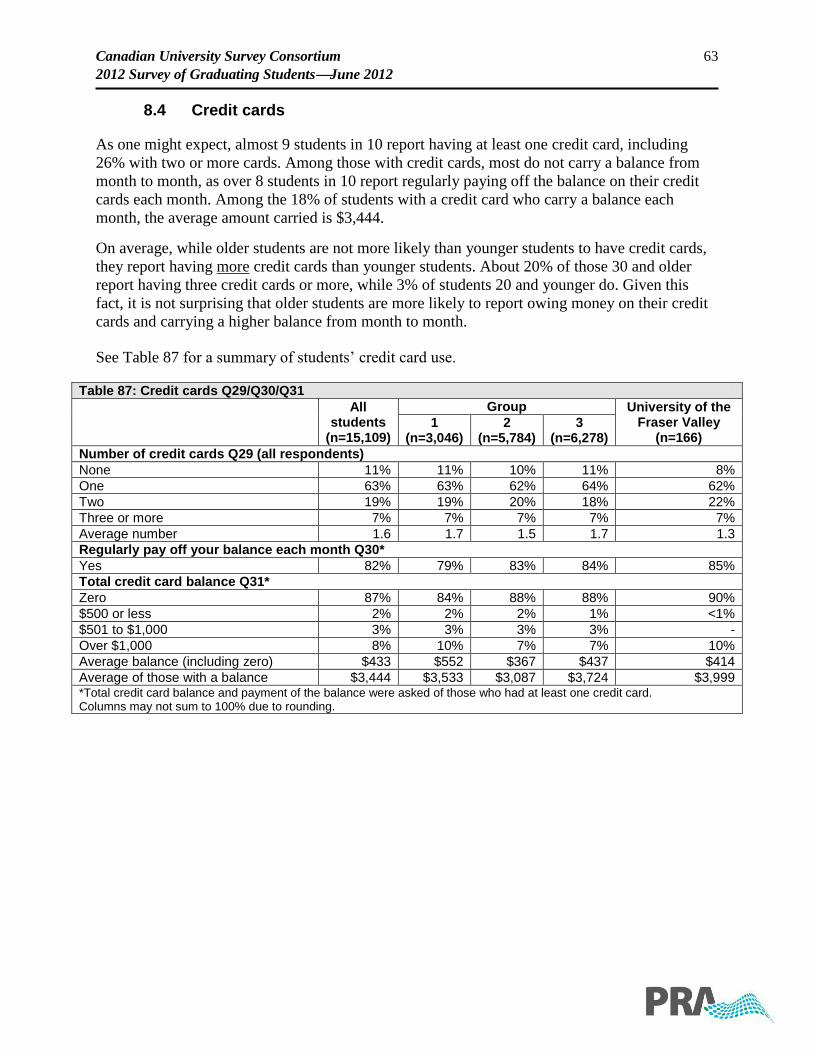
Canadian University Survey Consortium 63
2012 Survey of Graduating StudentsJune 2012
8.4 Credit cards
As one might expect, almost 9 students in 10 report having at least one credit card, including
26% with two or more cards. Among those with credit cards, most do not carry a balance from
month to month, as over 8 students in 10 report regularly paying off the balance on their credit
cards each month. Among the 18% of students with a credit card who carry a balance each
month, the average amount carried is $3,444.
On average, while older students are not more likely than younger students to have credit cards,
they report having more credit cards than younger students. About 20% of those 30 and older
report having three credit cards or more, while 3% of students 20 and younger do. Given this
fact, it is not surprising that older students are more likely to report owing money on their credit
cards and carrying a higher balance from month to month.
See Table 87 for a summary of students’ credit card use.
Table 87: Credit cards Q29/Q30/Q31
All
students (n=15,109)
Group University of the Fraser Valley
(n=166) 1
(n=3,046) 2
(n=5,784) 3
(n=6,278)
Number of credit cards Q29 (all respondents)
None 11% 11% 10% 11% 8%
One 63% 63% 62% 64% 62%
Two 19% 19% 20% 18% 22%
Three or more 7% 7% 7% 7% 7%
Average number 1.6 1.7 1.5 1.7 1.3
Regularly pay off your balance each month Q30*
Yes 82% 79% 83% 84% 85%
Total credit card balance Q31*
Zero 87% 84% 88% 88% 90%
$500 or less 2% 2% 2% 1% <1%
$501 to $1,000 3% 3% 3% 3% -
Over $1,000 8% 10% 7% 7% 10%
Average balance (including zero) $433 $552 $367 $437 $414
Average of those with a balance $3,444 $3,533 $3,087 $3,724 $3,999 *Total credit card balance and payment of the balance were asked of those who had at least one credit card. Columns may not sum to 100% due to rounding.
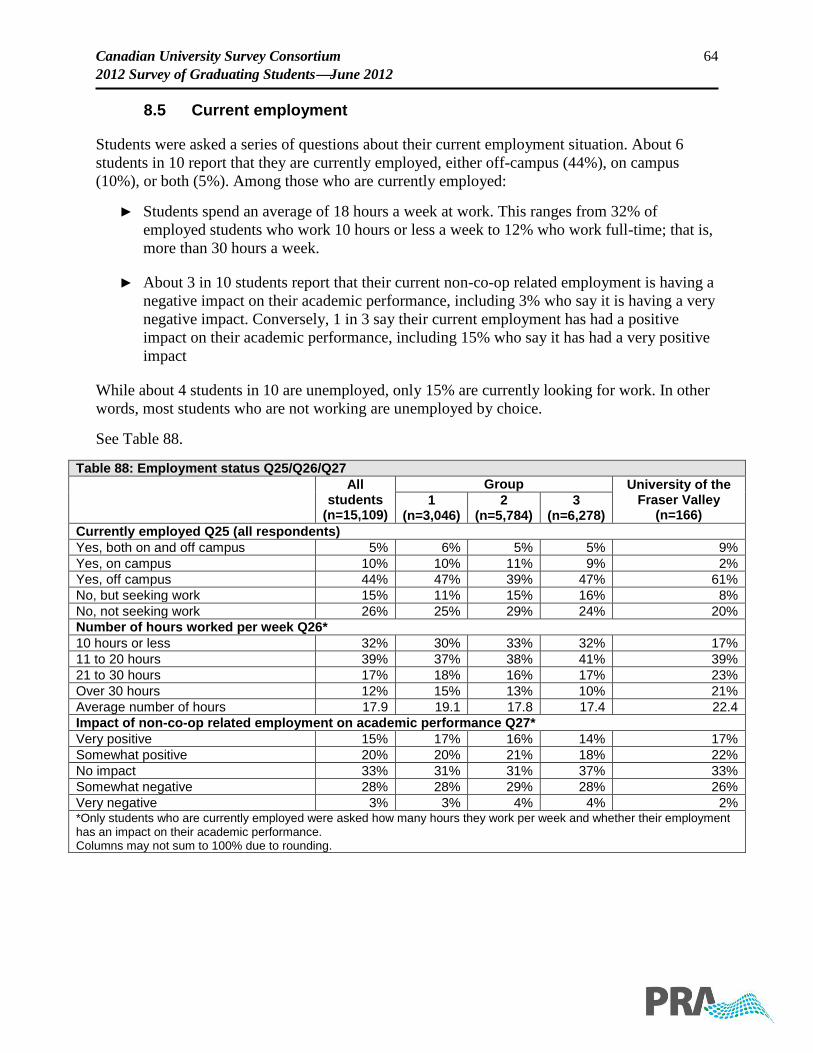
Canadian University Survey Consortium 64
2012 Survey of Graduating StudentsJune 2012
8.5 Current employment
Students were asked a series of questions about their current employment situation. About 6
students in 10 report that they are currently employed, either off-campus (44%), on campus
(10%), or both (5%). Among those who are currently employed:
► Students spend an average of 18 hours a week at work. This ranges from 32% of
employed students who work 10 hours or less a week to 12% who work full-time; that is,
more than 30 hours a week.
► About 3 in 10 students report that their current non-co-op related employment is having a
negative impact on their academic performance, including 3% who say it is having a very
negative impact. Conversely, 1 in 3 say their current employment has had a positive
impact on their academic performance, including 15% who say it has had a very positive
impact
While about 4 students in 10 are unemployed, only 15% are currently looking for work. In other
words, most students who are not working are unemployed by choice.
See Table 88.
Table 88: Employment status Q25/Q26/Q27
All
students (n=15,109)
Group University of the Fraser Valley
(n=166) 1
(n=3,046) 2
(n=5,784) 3
(n=6,278)
Currently employed Q25 (all respondents)
Yes, both on and off campus 5% 6% 5% 5% 9%
Yes, on campus 10% 10% 11% 9% 2%
Yes, off campus 44% 47% 39% 47% 61%
No, but seeking work 15% 11% 15% 16% 8%
No, not seeking work 26% 25% 29% 24% 20%
Number of hours worked per week Q26*
10 hours or less 32% 30% 33% 32% 17%
11 to 20 hours 39% 37% 38% 41% 39%
21 to 30 hours 17% 18% 16% 17% 23%
Over 30 hours 12% 15% 13% 10% 21%
Average number of hours 17.9 19.1 17.8 17.4 22.4
Impact of non-co-op related employment on academic performance Q27*
Very positive 15% 17% 16% 14% 17%
Somewhat positive 20% 20% 21% 18% 22%
No impact 33% 31% 31% 37% 33%
Somewhat negative 28% 28% 29% 28% 26%
Very negative 3% 3% 4% 4% 2% *Only students who are currently employed were asked how many hours they work per week and whether their employment has an impact on their academic performance. Columns may not sum to 100% due to rounding.
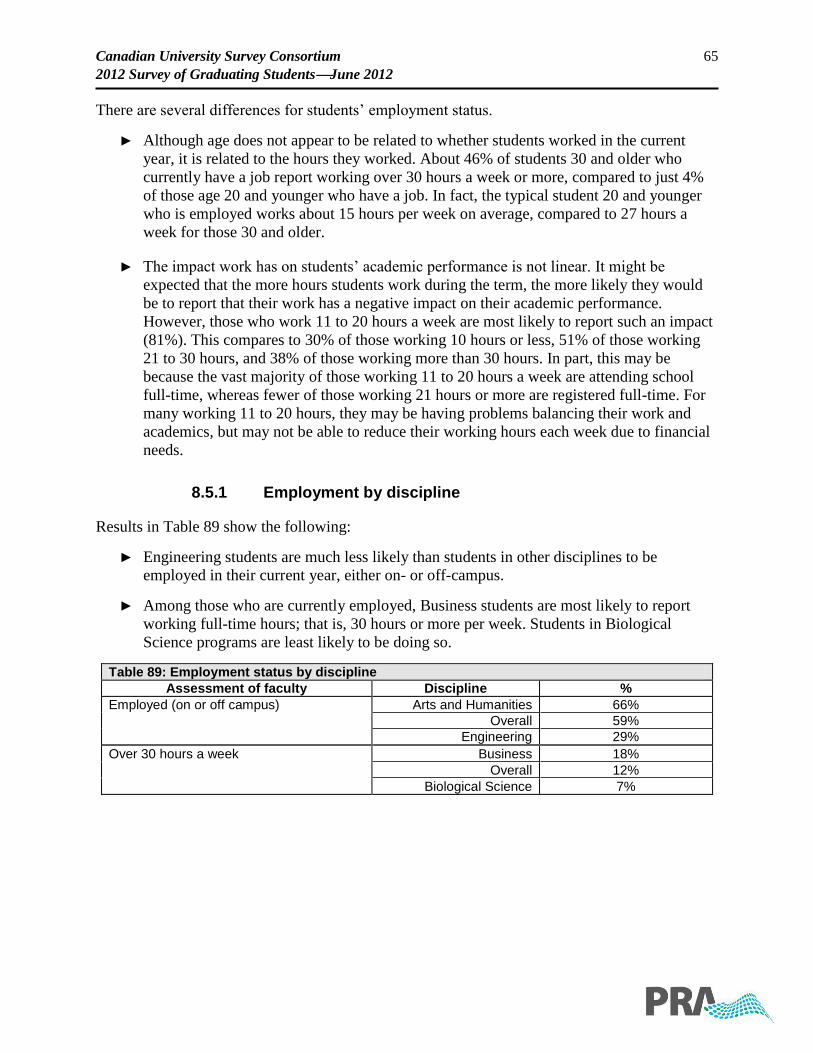
Canadian University Survey Consortium 65
2012 Survey of Graduating StudentsJune 2012
There are several differences for students’ employment status.
► Although age does not appear to be related to whether students worked in the current
year, it is related to the hours they worked. About 46% of students 30 and older who
currently have a job report working over 30 hours a week or more, compared to just 4%
of those age 20 and younger who have a job. In fact, the typical student 20 and younger
who is employed works about 15 hours per week on average, compared to 27 hours a
week for those 30 and older.
► The impact work has on students’ academic performance is not linear. It might be
expected that the more hours students work during the term, the more likely they would
be to report that their work has a negative impact on their academic performance.
However, those who work 11 to 20 hours a week are most likely to report such an impact
(81%). This compares to 30% of those working 10 hours or less, 51% of those working
21 to 30 hours, and 38% of those working more than 30 hours. In part, this may be
because the vast majority of those working 11 to 20 hours a week are attending school
full-time, whereas fewer of those working 21 hours or more are registered full-time. For
many working 11 to 20 hours, they may be having problems balancing their work and
academics, but may not be able to reduce their working hours each week due to financial
needs.
8.5.1 Employment by discipline
Results in Table 89 show the following:
► Engineering students are much less likely than students in other disciplines to be
employed in their current year, either on- or off-campus.
► Among those who are currently employed, Business students are most likely to report
working full-time hours; that is, 30 hours or more per week. Students in Biological
Science programs are least likely to be doing so.
Table 89: Employment status by discipline
Assessment of faculty Discipline %
Employed (on or off campus) Arts and Humanities 66%
Overall 59%
Engineering 29%
Over 30 hours a week Business 18%
Overall 12%
Biological Science 7%
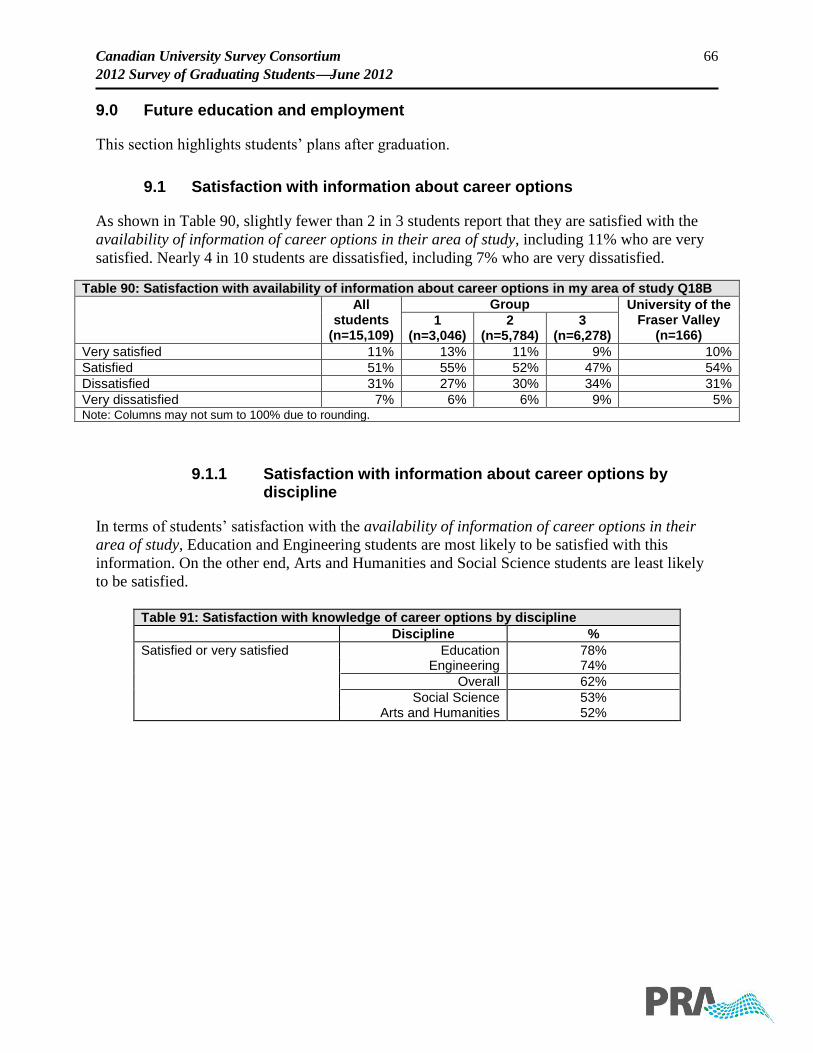
Canadian University Survey Consortium 66
2012 Survey of Graduating StudentsJune 2012
9.0 Future education and employment
This section highlights students’ plans after graduation.
9.1 Satisfaction with information about career options
As shown in Table 90, slightly fewer than 2 in 3 students report that they are satisfied with the
availability of information of career options in their area of study, including 11% who are very
satisfied. Nearly 4 in 10 students are dissatisfied, including 7% who are very dissatisfied.
Table 90: Satisfaction with availability of information about career options in my area of study Q18B
All
students (n=15,109)
Group University of the Fraser Valley
(n=166) 1
(n=3,046) 2
(n=5,784) 3
(n=6,278)
Very satisfied 11% 13% 11% 9% 10%
Satisfied 51% 55% 52% 47% 54%
Dissatisfied 31% 27% 30% 34% 31%
Very dissatisfied 7% 6% 6% 9% 5% Note: Columns may not sum to 100% due to rounding.
9.1.1 Satisfaction with information about career options by discipline
In terms of students’ satisfaction with the availability of information of career options in their
area of study, Education and Engineering students are most likely to be satisfied with this
information. On the other end, Arts and Humanities and Social Science students are least likely
to be satisfied.
Table 91: Satisfaction with knowledge of career options by discipline
Discipline %
Satisfied or very satisfied Education 78% Engineering 74%
Overall 62%
Social Science 53% Arts and Humanities 52%
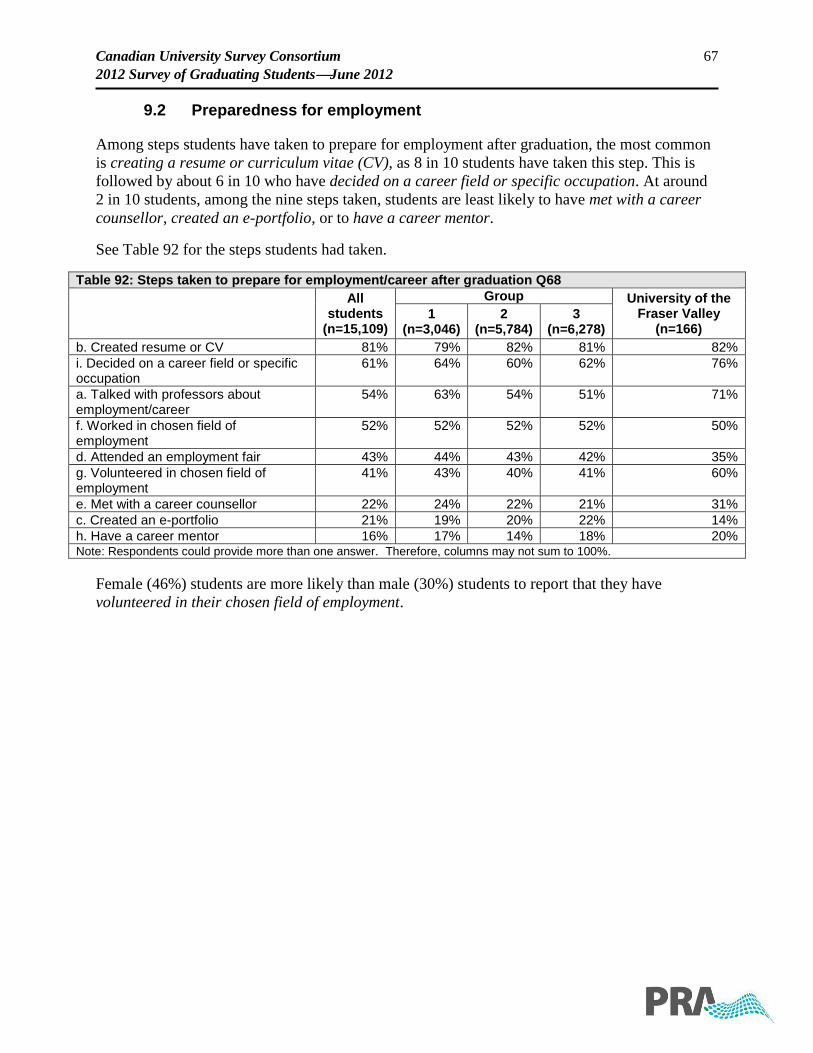
Canadian University Survey Consortium 67
2012 Survey of Graduating StudentsJune 2012
9.2 Preparedness for employment
Among steps students have taken to prepare for employment after graduation, the most common
is creating a resume or curriculum vitae (CV), as 8 in 10 students have taken this step. This is
followed by about 6 in 10 who have decided on a career field or specific occupation. At around
2 in 10 students, among the nine steps taken, students are least likely to have met with a career
counsellor, created an e-portfolio, or to have a career mentor.
See Table 92 for the steps students had taken.
Table 92: Steps taken to prepare for employment/career after graduation Q68
All
students (n=15,109)
Group University of the Fraser Valley
(n=166) 1
(n=3,046) 2
(n=5,784) 3
(n=6,278)
b. Created resume or CV 81% 79% 82% 81% 82%
i. Decided on a career field or specific occupation
61% 64% 60% 62% 76%
a. Talked with professors about employment/career
54% 63% 54% 51% 71%
f. Worked in chosen field of employment
52% 52% 52% 52% 50%
d. Attended an employment fair 43% 44% 43% 42% 35%
g. Volunteered in chosen field of employment
41% 43% 40% 41% 60%
e. Met with a career counsellor 22% 24% 22% 21% 31%
c. Created an e-portfolio 21% 19% 20% 22% 14%
h. Have a career mentor 16% 17% 14% 18% 20% Note: Respondents could provide more than one answer. Therefore, columns may not sum to 100%.
Female (46%) students are more likely than male (30%) students to report that they have
volunteered in their chosen field of employment.
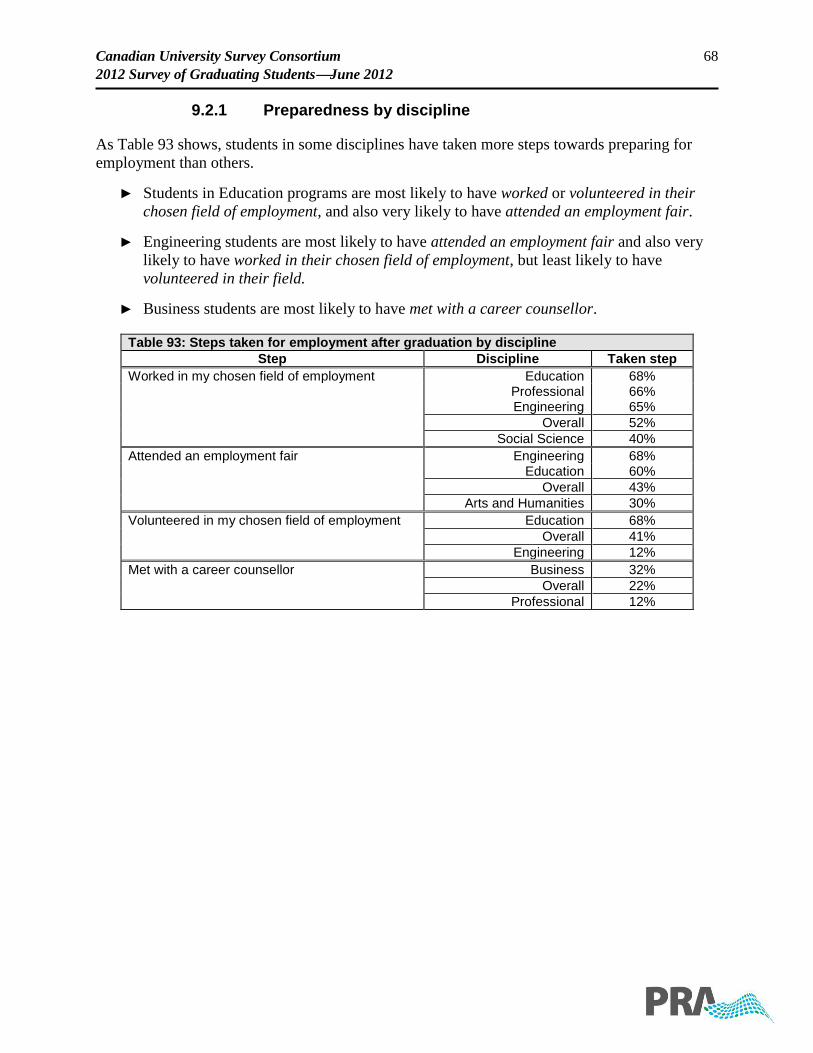
Canadian University Survey Consortium 68
2012 Survey of Graduating StudentsJune 2012
9.2.1 Preparedness by discipline
As Table 93 shows, students in some disciplines have taken more steps towards preparing for
employment than others.
► Students in Education programs are most likely to have worked or volunteered in their
chosen field of employment, and also very likely to have attended an employment fair.
► Engineering students are most likely to have attended an employment fair and also very
likely to have worked in their chosen field of employment, but least likely to have
volunteered in their field.
► Business students are most likely to have met with a career counsellor.
Table 93: Steps taken for employment after graduation by discipline
Step Discipline Taken step
Worked in my chosen field of employment Education 68% Professional 66% Engineering 65%
Overall 52%
Social Science 40%
Attended an employment fair Engineering 68% Education 60%
Overall 43%
Arts and Humanities 30%
Volunteered in my chosen field of employment Education 68%
Overall 41%
Engineering 12%
Met with a career counsellor Business 32%
Overall 22%
Professional 12%
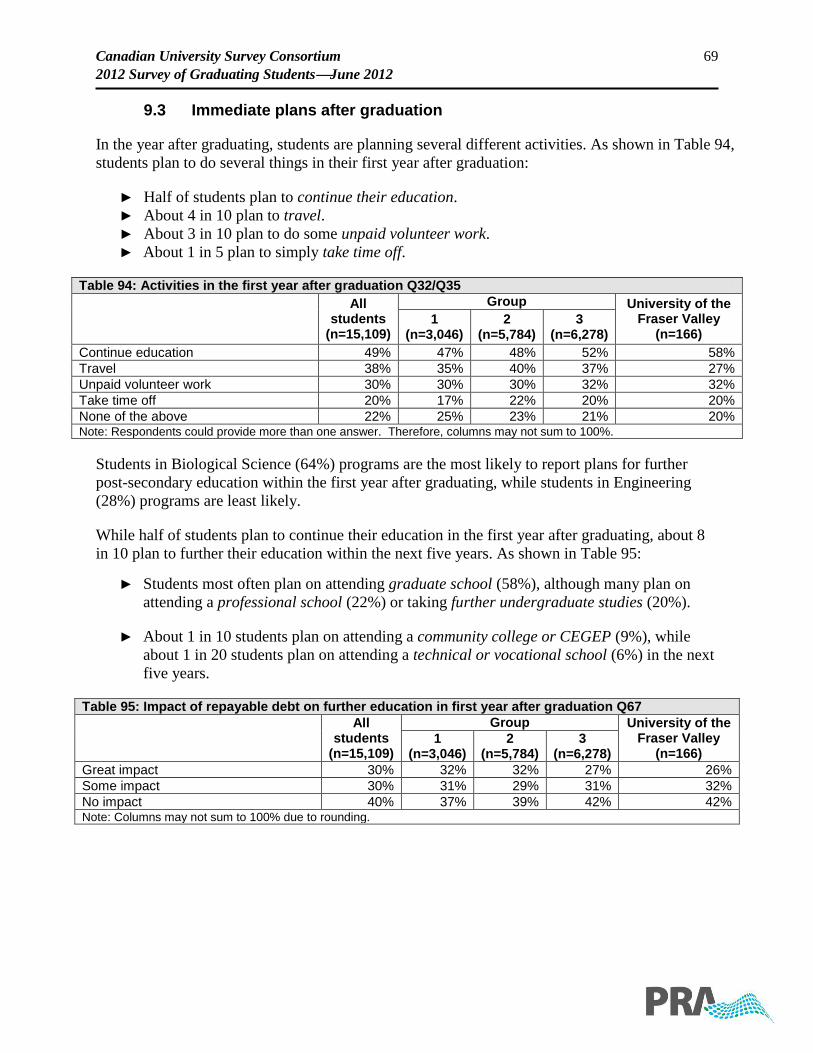
Canadian University Survey Consortium 69
2012 Survey of Graduating StudentsJune 2012
9.3 Immediate plans after graduation
In the year after graduating, students are planning several different activities. As shown in Table 94,
students plan to do several things in their first year after graduation:
► Half of students plan to continue their education.
► About 4 in 10 plan to travel.
► About 3 in 10 plan to do some unpaid volunteer work.
► About 1 in 5 plan to simply take time off.
Table 94: Activities in the first year after graduation Q32/Q35
All
students (n=15,109)
Group University of the Fraser Valley
(n=166) 1
(n=3,046) 2
(n=5,784) 3
(n=6,278)
Continue education 49% 47% 48% 52% 58%
Travel 38% 35% 40% 37% 27%
Unpaid volunteer work 30% 30% 30% 32% 32%
Take time off 20% 17% 22% 20% 20%
None of the above 22% 25% 23% 21% 20% Note: Respondents could provide more than one answer. Therefore, columns may not sum to 100%.
Students in Biological Science (64%) programs are the most likely to report plans for further
post-secondary education within the first year after graduating, while students in Engineering
(28%) programs are least likely.
While half of students plan to continue their education in the first year after graduating, about 8
in 10 plan to further their education within the next five years. As shown in Table 95:
► Students most often plan on attending graduate school (58%), although many plan on
attending a professional school (22%) or taking further undergraduate studies (20%).
► About 1 in 10 students plan on attending a community college or CEGEP (9%), while
about 1 in 20 students plan on attending a technical or vocational school (6%) in the next
five years.
Table 95: Impact of repayable debt on further education in first year after graduation Q67
All
students (n=15,109)
Group University of the Fraser Valley
(n=166) 1
(n=3,046) 2
(n=5,784) 3
(n=6,278)
Great impact 30% 32% 32% 27% 26%
Some impact 30% 31% 29% 31% 32%
No impact 40% 37% 39% 42% 42% Note: Columns may not sum to 100% due to rounding.
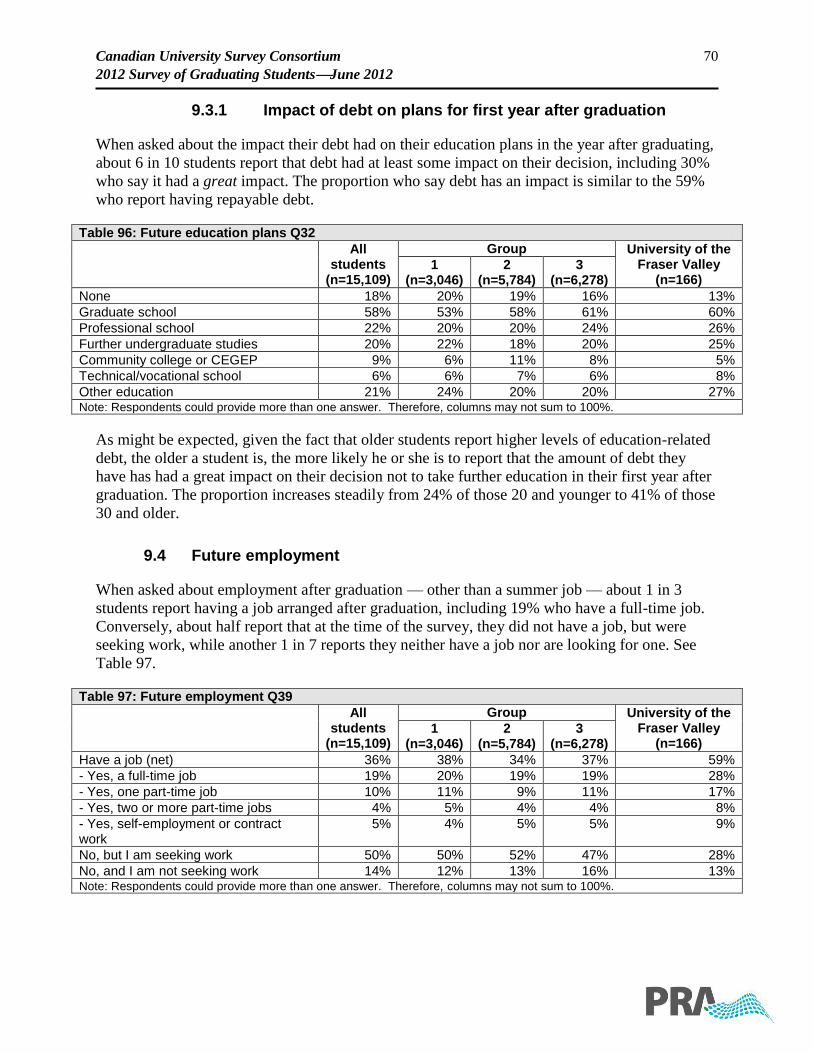
Canadian University Survey Consortium 70
2012 Survey of Graduating StudentsJune 2012
9.3.1 Impact of debt on plans for first year after graduation
When asked about the impact their debt had on their education plans in the year after graduating,
about 6 in 10 students report that debt had at least some impact on their decision, including 30%
who say it had a great impact. The proportion who say debt has an impact is similar to the 59%
who report having repayable debt.
Table 96: Future education plans Q32
All students
(n=15,109)
Group University of the Fraser Valley
(n=166) 1
(n=3,046) 2
(n=5,784) 3
(n=6,278)
None 18% 20% 19% 16% 13%
Graduate school 58% 53% 58% 61% 60%
Professional school 22% 20% 20% 24% 26%
Further undergraduate studies 20% 22% 18% 20% 25%
Community college or CEGEP 9% 6% 11% 8% 5%
Technical/vocational school 6% 6% 7% 6% 8%
Other education 21% 24% 20% 20% 27% Note: Respondents could provide more than one answer. Therefore, columns may not sum to 100%.
As might be expected, given the fact that older students report higher levels of education-related
debt, the older a student is, the more likely he or she is to report that the amount of debt they
have has had a great impact on their decision not to take further education in their first year after
graduation. The proportion increases steadily from 24% of those 20 and younger to 41% of those
30 and older.
9.4 Future employment
When asked about employment after graduation — other than a summer job — about 1 in 3
students report having a job arranged after graduation, including 19% who have a full-time job.
Conversely, about half report that at the time of the survey, they did not have a job, but were
seeking work, while another 1 in 7 reports they neither have a job nor are looking for one. See
Table 97.
Table 97: Future employment Q39
All
students (n=15,109)
Group University of the Fraser Valley
(n=166) 1
(n=3,046) 2
(n=5,784) 3
(n=6,278)
Have a job (net) 36% 38% 34% 37% 59%
- Yes, a full-time job 19% 20% 19% 19% 28%
- Yes, one part-time job 10% 11% 9% 11% 17%
- Yes, two or more part-time jobs 4% 5% 4% 4% 8%
- Yes, self-employment or contract work
5% 4% 5% 5% 9%
No, but I am seeking work 50% 50% 52% 47% 28%
No, and I am not seeking work 14% 12% 13% 16% 13% Note: Respondents could provide more than one answer. Therefore, columns may not sum to 100%.
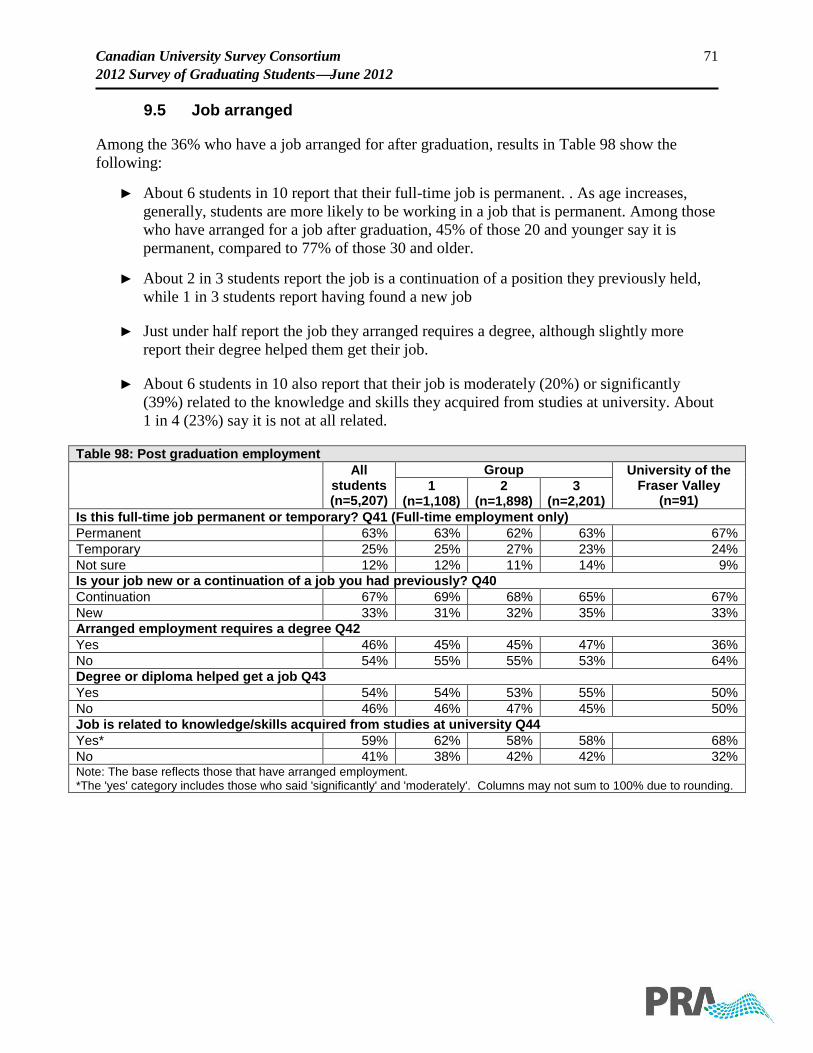
Canadian University Survey Consortium 71
2012 Survey of Graduating StudentsJune 2012
9.5 Job arranged
Among the 36% who have a job arranged for after graduation, results in Table 98 show the
following:
► About 6 students in 10 report that their full-time job is permanent. . As age increases,
generally, students are more likely to be working in a job that is permanent. Among those
who have arranged for a job after graduation, 45% of those 20 and younger say it is
permanent, compared to 77% of those 30 and older.
► About 2 in 3 students report the job is a continuation of a position they previously held,
while 1 in 3 students report having found a new job
► Just under half report the job they arranged requires a degree, although slightly more
report their degree helped them get their job.
► About 6 students in 10 also report that their job is moderately (20%) or significantly
(39%) related to the knowledge and skills they acquired from studies at university. About
1 in 4 (23%) say it is not at all related.
Table 98: Post graduation employment
All
students (n=5,207)
Group University of the Fraser Valley
(n=91) 1
(n=1,108) 2
(n=1,898) 3
(n=2,201)
Is this full-time job permanent or temporary? Q41 (Full-time employment only)
Permanent 63% 63% 62% 63% 67%
Temporary 25% 25% 27% 23% 24%
Not sure 12% 12% 11% 14% 9%
Is your job new or a continuation of a job you had previously? Q40
Continuation 67% 69% 68% 65% 67%
New 33% 31% 32% 35% 33%
Arranged employment requires a degree Q42
Yes 46% 45% 45% 47% 36%
No 54% 55% 55% 53% 64%
Degree or diploma helped get a job Q43
Yes 54% 54% 53% 55% 50%
No 46% 46% 47% 45% 50%
Job is related to knowledge/skills acquired from studies at university Q44
Yes* 59% 62% 58% 58% 68%
No 41% 38% 42% 42% 32% Note: The base reflects those that have arranged employment. *The 'yes' category includes those who said 'significantly' and 'moderately'. Columns may not sum to 100% due to rounding.
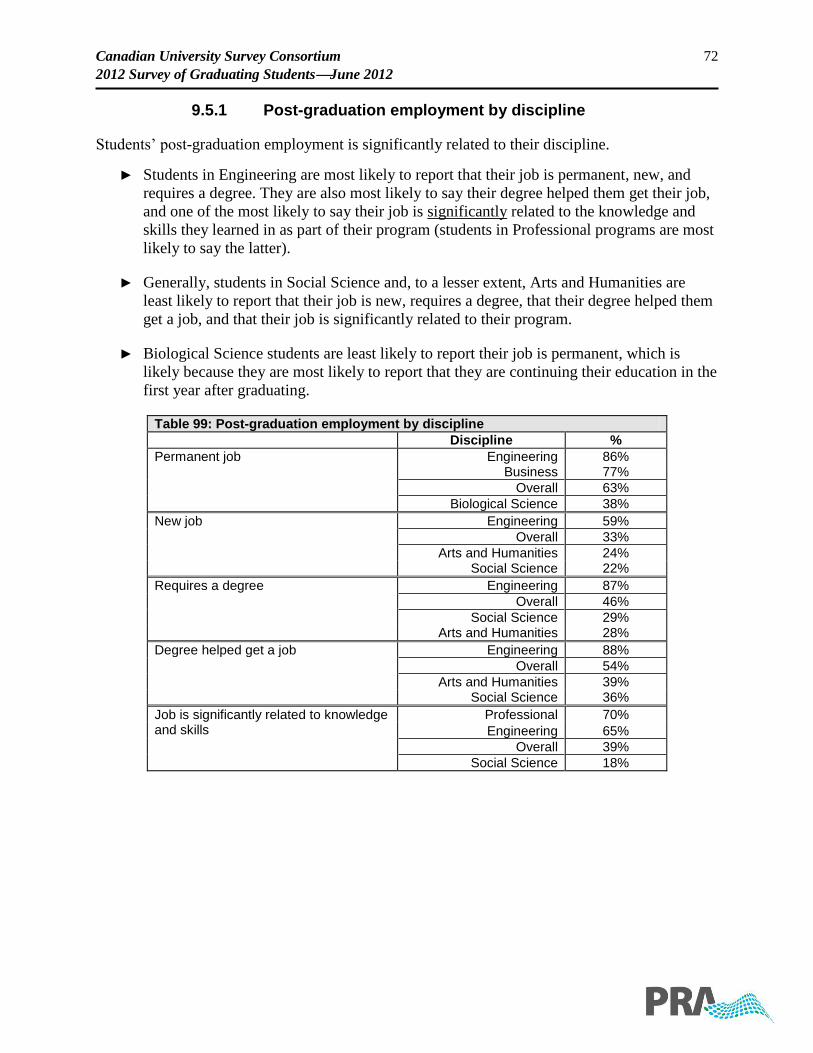
Canadian University Survey Consortium 72
2012 Survey of Graduating StudentsJune 2012
9.5.1 Post-graduation employment by discipline
Students’ post-graduation employment is significantly related to their discipline.
► Students in Engineering are most likely to report that their job is permanent, new, and
requires a degree. They are also most likely to say their degree helped them get their job,
and one of the most likely to say their job is significantly related to the knowledge and
skills they learned in as part of their program (students in Professional programs are most
likely to say the latter).
► Generally, students in Social Science and, to a lesser extent, Arts and Humanities are
least likely to report that their job is new, requires a degree, that their degree helped them
get a job, and that their job is significantly related to their program.
► Biological Science students are least likely to report their job is permanent, which is
likely because they are most likely to report that they are continuing their education in the
first year after graduating.
Table 99: Post-graduation employment by discipline
Discipline %
Permanent job Engineering 86% Business 77%
Overall 63%
Biological Science 38%
New job Engineering 59%
Overall 33%
Arts and Humanities 24% Social Science 22%
Requires a degree Engineering 87%
Overall 46%
Social Science 29% Arts and Humanities 28%
Degree helped get a job Engineering 88%
Overall 54%
Arts and Humanities 39% Social Science 36%
Job is significantly related to knowledge and skills
Professional 70%
Engineering 65%
Overall 39%
Social Science 18%
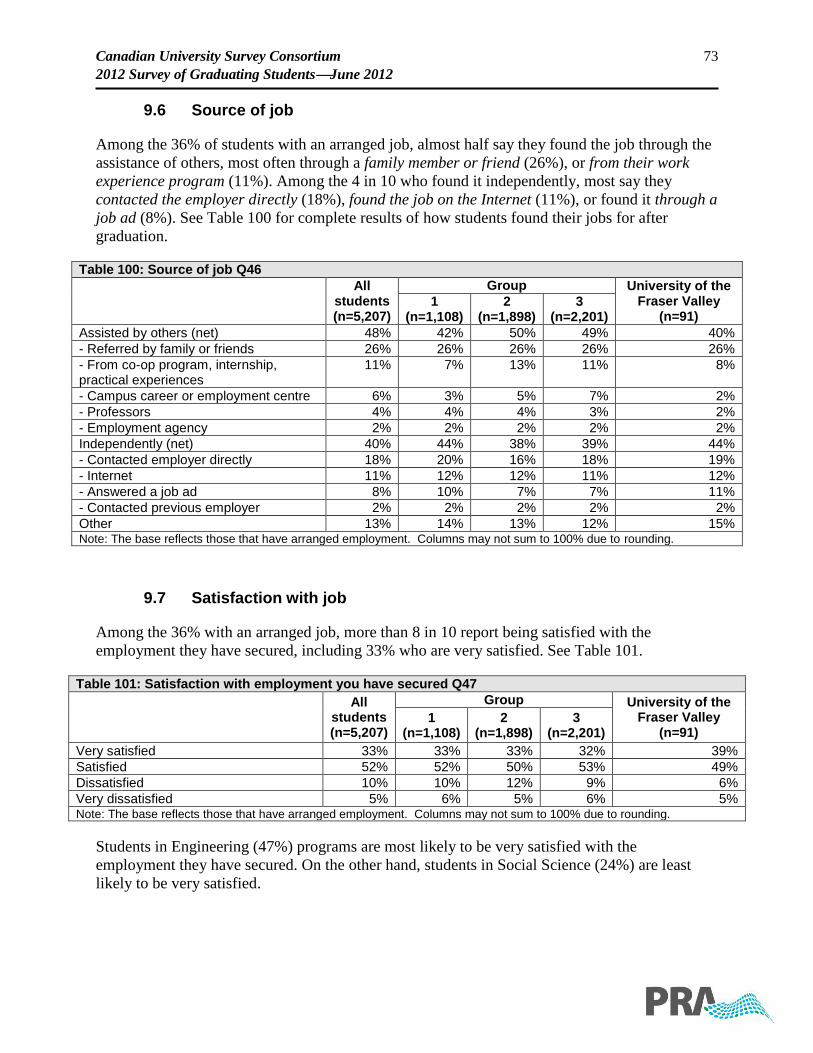
Canadian University Survey Consortium 73
2012 Survey of Graduating StudentsJune 2012
9.6 Source of job
Among the 36% of students with an arranged job, almost half say they found the job through the
assistance of others, most often through a family member or friend (26%), or from their work
experience program (11%). Among the 4 in 10 who found it independently, most say they
contacted the employer directly (18%), found the job on the Internet (11%), or found it through a
job ad (8%). See Table 100 for complete results of how students found their jobs for after
graduation.
Table 100: Source of job Q46
All
students (n=5,207)
Group University of the Fraser Valley
(n=91) 1
(n=1,108) 2
(n=1,898) 3
(n=2,201)
Assisted by others (net) 48% 42% 50% 49% 40%
- Referred by family or friends 26% 26% 26% 26% 26%
- From co-op program, internship, practical experiences
11% 7% 13% 11% 8%
- Campus career or employment centre 6% 3% 5% 7% 2%
- Professors 4% 4% 4% 3% 2%
- Employment agency 2% 2% 2% 2% 2%
Independently (net) 40% 44% 38% 39% 44%
- Contacted employer directly 18% 20% 16% 18% 19%
- Internet 11% 12% 12% 11% 12%
- Answered a job ad 8% 10% 7% 7% 11%
- Contacted previous employer 2% 2% 2% 2% 2%
Other 13% 14% 13% 12% 15% Note: The base reflects those that have arranged employment. Columns may not sum to 100% due to rounding.
9.7 Satisfaction with job
Among the 36% with an arranged job, more than 8 in 10 report being satisfied with the
employment they have secured, including 33% who are very satisfied. See Table 101.
Table 101: Satisfaction with employment you have secured Q47
All
students (n=5,207)
Group University of the Fraser Valley
(n=91) 1
(n=1,108) 2
(n=1,898) 3
(n=2,201)
Very satisfied 33% 33% 33% 32% 39%
Satisfied 52% 52% 50% 53% 49%
Dissatisfied 10% 10% 12% 9% 6%
Very dissatisfied 5% 6% 5% 6% 5% Note: The base reflects those that have arranged employment. Columns may not sum to 100% due to rounding.
Students in Engineering (47%) programs are most likely to be very satisfied with the
employment they have secured. On the other hand, students in Social Science (24%) are least
likely to be very satisfied.
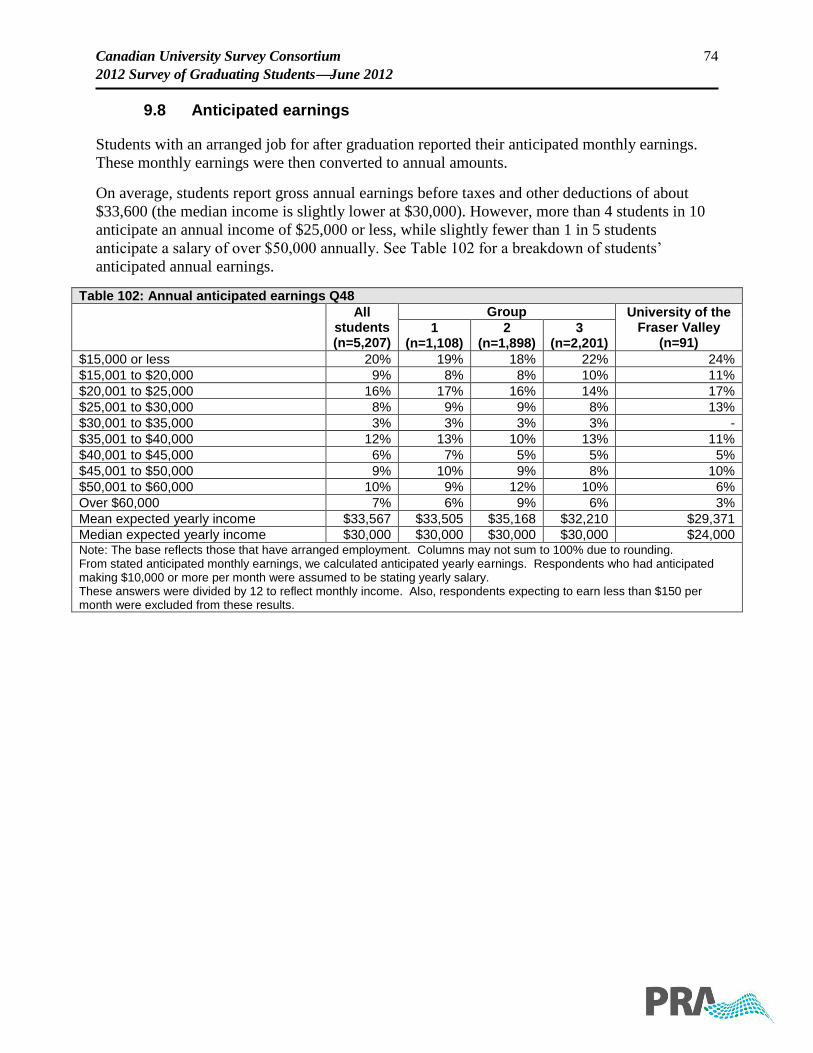
Canadian University Survey Consortium 74
2012 Survey of Graduating StudentsJune 2012
9.8 Anticipated earnings
Students with an arranged job for after graduation reported their anticipated monthly earnings.
These monthly earnings were then converted to annual amounts.
On average, students report gross annual earnings before taxes and other deductions of about
$33,600 (the median income is slightly lower at $30,000). However, more than 4 students in 10
anticipate an annual income of $25,000 or less, while slightly fewer than 1 in 5 students
anticipate a salary of over $50,000 annually. See Table 102 for a breakdown of students’
anticipated annual earnings.
Table 102: Annual anticipated earnings Q48
All
students (n=5,207)
Group University of the Fraser Valley
(n=91) 1
(n=1,108) 2
(n=1,898) 3
(n=2,201)
$15,000 or less 20% 19% 18% 22% 24%
$15,001 to $20,000 9% 8% 8% 10% 11%
$20,001 to $25,000 16% 17% 16% 14% 17%
$25,001 to $30,000 8% 9% 9% 8% 13%
$30,001 to $35,000 3% 3% 3% 3% -
$35,001 to $40,000 12% 13% 10% 13% 11%
$40,001 to $45,000 6% 7% 5% 5% 5%
$45,001 to $50,000 9% 10% 9% 8% 10%
$50,001 to $60,000 10% 9% 12% 10% 6%
Over $60,000 7% 6% 9% 6% 3%
Mean expected yearly income $33,567 $33,505 $35,168 $32,210 $29,371
Median expected yearly income $30,000 $30,000 $30,000 $30,000 $24,000 Note: The base reflects those that have arranged employment. Columns may not sum to 100% due to rounding. From stated anticipated monthly earnings, we calculated anticipated yearly earnings. Respondents who had anticipated making $10,000 or more per month were assumed to be stating yearly salary. These answers were divided by 12 to reflect monthly income. Also, respondents expecting to earn less than $150 per month were excluded from these results.
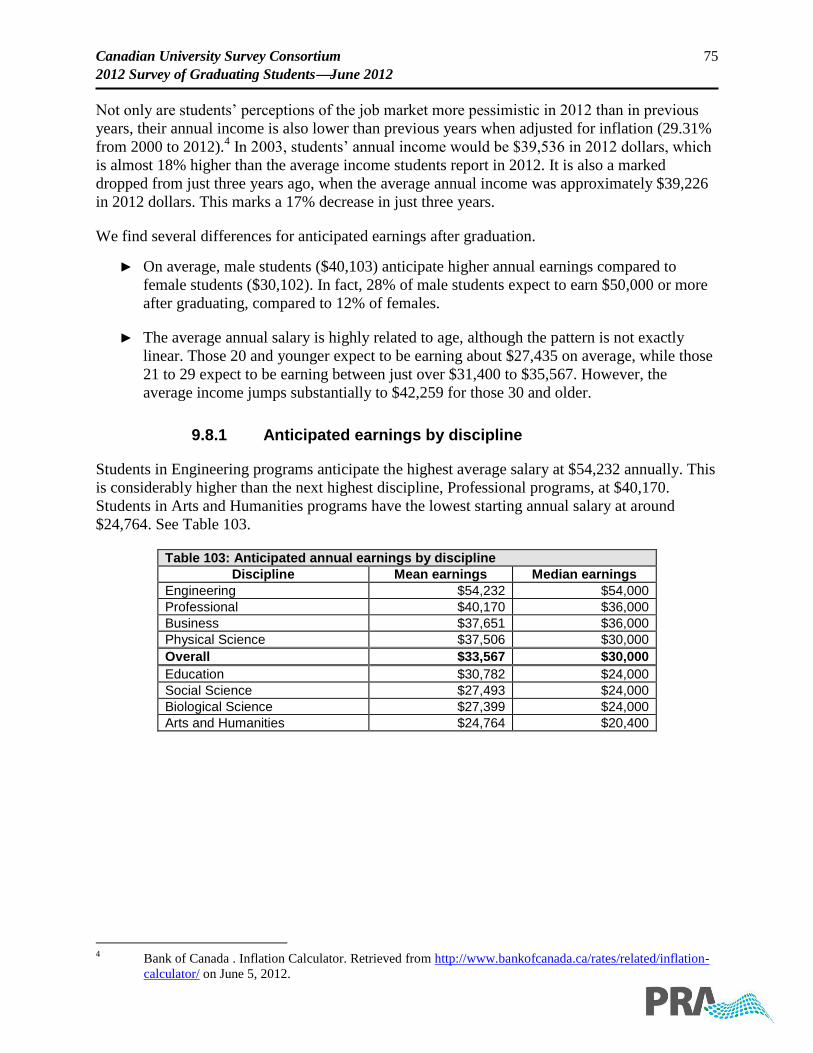
Canadian University Survey Consortium 75
2012 Survey of Graduating StudentsJune 2012
Not only are students’ perceptions of the job market more pessimistic in 2012 than in previous
years, their annual income is also lower than previous years when adjusted for inflation (29.31%
from 2000 to 2012).4 In 2003, students’ annual income would be $39,536 in 2012 dollars, which
is almost 18% higher than the average income students report in 2012. It is also a marked
dropped from just three years ago, when the average annual income was approximately $39,226
in 2012 dollars. This marks a 17% decrease in just three years.
We find several differences for anticipated earnings after graduation.
► On average, male students ($40,103) anticipate higher annual earnings compared to
female students ($30,102). In fact, 28% of male students expect to earn $50,000 or more
after graduating, compared to 12% of females.
► The average annual salary is highly related to age, although the pattern is not exactly
linear. Those 20 and younger expect to be earning about $27,435 on average, while those
21 to 29 expect to be earning between just over $31,400 to $35,567. However, the
average income jumps substantially to $42,259 for those 30 and older.
9.8.1 Anticipated earnings by discipline
Students in Engineering programs anticipate the highest average salary at $54,232 annually. This
is considerably higher than the next highest discipline, Professional programs, at $40,170.
Students in Arts and Humanities programs have the lowest starting annual salary at around
$24,764. See Table 103.
Table 103: Anticipated annual earnings by discipline
Discipline Mean earnings Median earnings
Engineering $54,232 $54,000
Professional $40,170 $36,000
Business $37,651 $36,000
Physical Science $37,506 $30,000
Overall $33,567 $30,000
Education $30,782 $24,000
Social Science $27,493 $24,000
Biological Science $27,399 $24,000
Arts and Humanities $24,764 $20,400
4 Bank of Canada . Inflation Calculator. Retrieved from http://www.bankofcanada.ca/rates/related/inflation-
calculator/ on June 5, 2012.
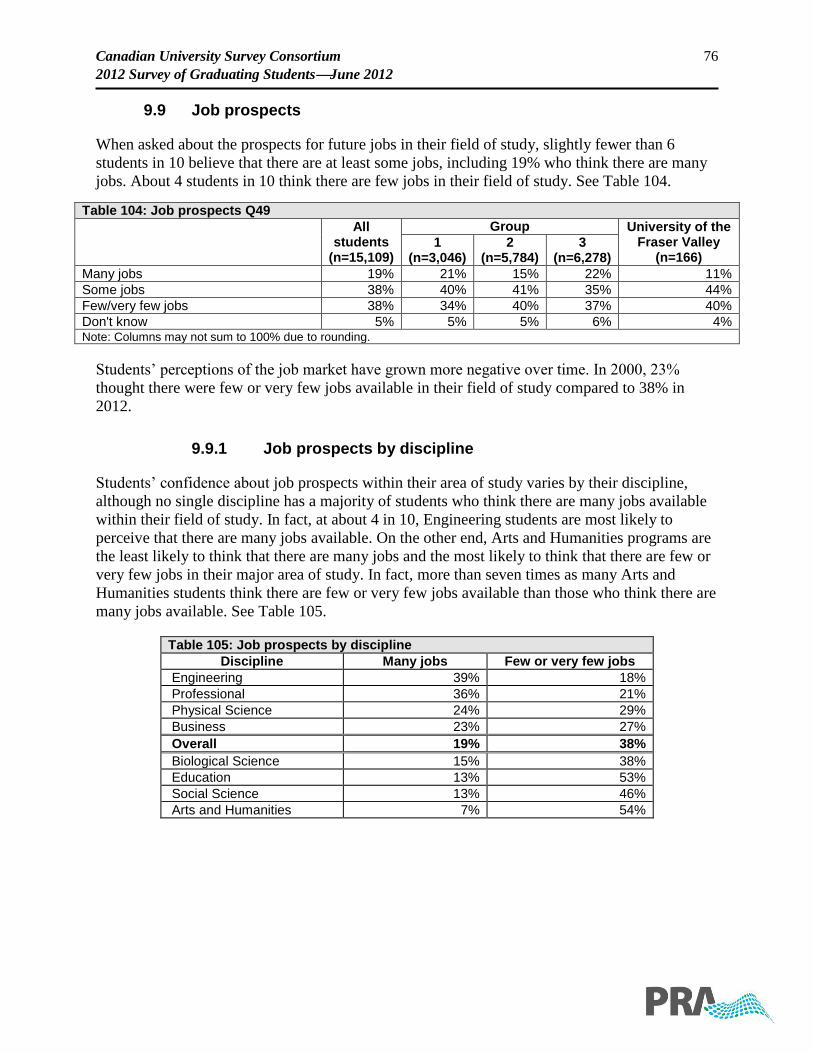
Canadian University Survey Consortium 76
2012 Survey of Graduating StudentsJune 2012
9.9 Job prospects
When asked about the prospects for future jobs in their field of study, slightly fewer than 6
students in 10 believe that there are at least some jobs, including 19% who think there are many
jobs. About 4 students in 10 think there are few jobs in their field of study. See Table 104.
Table 104: Job prospects Q49
All students
(n=15,109)
Group University of the Fraser Valley
(n=166) 1
(n=3,046) 2
(n=5,784) 3
(n=6,278)
Many jobs 19% 21% 15% 22% 11%
Some jobs 38% 40% 41% 35% 44%
Few/very few jobs 38% 34% 40% 37% 40%
Don't know 5% 5% 5% 6% 4% Note: Columns may not sum to 100% due to rounding.
Students’ perceptions of the job market have grown more negative over time. In 2000, 23%
thought there were few or very few jobs available in their field of study compared to 38% in
2012.
9.9.1 Job prospects by discipline
Students’ confidence about job prospects within their area of study varies by their discipline,
although no single discipline has a majority of students who think there are many jobs available
within their field of study. In fact, at about 4 in 10, Engineering students are most likely to
perceive that there are many jobs available. On the other end, Arts and Humanities programs are
the least likely to think that there are many jobs and the most likely to think that there are few or
very few jobs in their major area of study. In fact, more than seven times as many Arts and
Humanities students think there are few or very few jobs available than those who think there are
many jobs available. See Table 105.
Table 105: Job prospects by discipline
Discipline Many jobs Few or very few jobs
Engineering 39% 18%
Professional 36% 21%
Physical Science 24% 29%
Business 23% 27%
Overall 19% 38%
Biological Science 15% 38%
Education 13% 53%
Social Science 13% 46%
Arts and Humanities 7% 54%
Canadian University Survey Consortium 77
2012 Survey of Graduating StudentsJune 2012
10.0 Conclusion
As has been found in previous CUSC Surveys of Graduating Students, students are generally
very positive about their university experiences. They view institutions has contributing very
much to their growth and development in a number of academic, learning, and personal areas.
Even with changes to survey methodology and the addition of weighting, overall results are very
similar to previous surveys and trends that have been established over time were generally still
apparent in the current survey.
As previously stated, this report is not meant to be an exhaustive examination of the results.
Indeed, with over 15,000 students participating in this survey, which collects over 200 pieces of
information, there are many lines of research that can be followed with this data.
Among the multitude of results summarized in this report, a few key results are most
informative.
► Although working while attending university has positive and negative impacts on
students’ academic performance, students that tend to be most negatively affected are
those attending full-time and working between 11 and 20 hours per week. It may be of
interest to analyze those who are most negatively affected by their work to identify their
other sources of financing, debt situation, and characteristics.
► Student debt appeared to be on par with previous years and students required less to
finance their education than they had in previous years (when adjusted for inflation).
► Students tend to be most negative about their universities and faculty having information
about career aspects while at university. When coupled with the fact that students are less
optimistic about jobs available in their field of study in 2012 than in previous years, it
demonstrates a need for universities and faculty to help students identify career options
and prepare for employment post-graduation. Indeed, students have taken few steps to
prepare for graduation beyond creating a resume.
► Students’ average income for jobs obtained post-graduation is much lower in 2012 than
they were in previous years. In part, this may be due to recessionary factors, such as the
availability of jobs, but may speak to the fact that students in some disciplines do not
believe there are many jobs available in their field of study. Perhaps rather than searching
out jobs that might be available, they are accepting lower paying jobs in retail and service
industries in order to make ends meet and repay any debt they may have accumulated.