canada’s oil and gas workforce: distribution, … · gas production resulted in 23% growth in the...
TRANSCRIPT

AUGUST 2018
CANADA’SOIL AND GAS WORKFORCE:
DISTRIBUTION, WORK PATTERNS AND INCOME

CANADA’S OIL AND GAS WORKFORCE: DISTRIBUTION, WORK PATTERNS AND INCOME 2 AUGUST 2018
Table of ContentsIntroduction ....................................................................................................... 3Distribution......................................................................................................... 4
Sectoral: Industry’s sub-sectors diverge ..............................................................4Occupational: Broad range of skills required ........................................................6Geographical: Western Canada home to 85% of workers ....................................... 9
Worker mobility ................................................................................................ 12Work patterns ................................................................................................... 14Income ............................................................................................................ 15Conclusion ....................................................................................................... 16Appendix A: Research notes & definitions ............................................................. 17Appendix B: Data tables ...................................................................................... 18Acknowledgements ........................................................................................... 21

CANADA’S OIL AND GAS WORKFORCE: DISTRIBUTION, WORK PATTERNS AND INCOME 3 AUGUST 2018
INTRODUCTION
The workforce, also known as the labour force, refers to all persons who are either employed, or unemployed and actively seeking work.1Sectors such as oil and gas engineering and construction, manufacturing, construction, etc. are excluded from the oil and gas industry analysis and form part of the other trade-intensive industries analyzed in this report.
2
THE REPORT CONTAINS:
● Analysis of the oil and gas industry’s workforce distribution across sub-sectors, occupations and regions in Canada
● Quantitative and graphical descriptions of worker mobility, work patterns and income, including comparisons to Canada’s total workforce and other comparable trade-intensive industries in Canada
● Spotlights providing additional information related to the industry’s workforce concentration and the oil sands
The protracted oil price slump began in late 2014 and triggered a structural shift in Canada’s oil and gas industry. There have been significant job losses and changes to the workforce.
This report draws on data from Statistics Canada’s 2016 Census, the 2011 National Household Survey (NHS) and 2006 Census releases to provide a profile of the oil and gas industry’s workforce1 as of 2016. It overviews the sectoral, occupational and geographic distribution of the workforce,
as well as worker commuting trends, work patterns and earnings. Where possible, the report examines changes in these variables over a five- or 10-year period.
Workforce data focuses on the oil and gas industry and its sub-sectors: exploration and production (E&P) (including oil sands), oil and gas services, and pipeline.2 Where possible, comparisons are also made with Canada’s total workforce and other comparable trade-intensive industries in Canada.
Between 2010 and 2014, Canada’s oil and gas industry benefited from rapid and sustained growth. As oil prices surged, so too did industry spending, production and employment. Oil and gas companies and service providers alike experienced labour and skill shortages for many occupations and operating regions. Companies intensified their attraction and retention strategies and tactics, escalated their labour costs and found alternative worker arrangements to cope with worker shortages.

CANADA’S OIL AND GAS WORKFORCE: DISTRIBUTION, WORK PATTERNS AND INCOME 4 AUGUST 2018
DISTRIBUTION
Figure 1: Canada’s oil and gas labour force, by year and sub-sector
The industry’s sub-sectors experienced divergent trends in workforce growth during the 10-year period. Rising oil and gas production resulted in 23% growth in the exploration and production (E&P) sub-sector’s workforce, from 72,500 workers in 2006 to 88,900 in 2016. The pipeline sub-sector experienced even stronger growth as its workforce nearly doubled, increasing 95% from 4,300 workers to 8,400 during the period. Meanwhile, the number of oil and gas service workers grew by just 5%, from 88,000 to 92,300, in part due to downturns3 during the period that affected this sector more than others. The recent economic downturn resulted in capped expansion that also constrained growth in the oil and gas services sub-sector.
Beyond these economic trends, technological and process improvements impacted workforce growth in the industry. Companies were focused on efficiency-enhancing technologies as part of a strategy to manage labour costs and improve productivity. Notably, the number of workers required to produce and transport 10,000 barrels of oil equivalent per day (BOE/d) was nearly 20% lower in 2016 compared to 2010.4
While oil and gas services remained the largest sub-sector employer, its share of the total oil and gas workforce declined from 53% in 2006 to 49% in 2016. Growth in pipelines and in unconventional resources, including oil sands, shifted the industry’s workforce towards the E&P and pipeline sub-sectors.
Canada’s direct oil and gas workforce grew 15% in 10 years, from 165,000 in 2006 to nearly 190,000 in 2016 (Figure 1). This occurred despite employment declines during downturns.
Note: Sub-sector sums may differ from total industry workforce data due to rounding.
The services sub-sector’s workforce tends to be more strongly affected by industry cyclicality, which can lead to volatility in workforce trends. Beginning in late 2016, improvements in oil prices and industry activity resulted in reported hiring difficulties for some oil and gas service companies.
3
PetroLMI Labour Productivity in Canada’s Oil and Gas Industry: A Discussion of Historical Trends and Future Implications. September 2017.4
Sectoral: Industry’s sub-sectors diverge
2006 2007 2008 2009 2010 2011 2012 2013 2014 2015 2016 2017
4,300
72,500
88,000
7,100
82,400
88,500
8,400
88,900
92,300
Oil and gas servicesExploration and production (includes oil sands) Pipeline Oil and gas (total)
164,800 178,000 189,500

CANADA’S OIL AND GAS WORKFORCE: DISTRIBUTION, WORK PATTERNS AND INCOME 5 AUGUST 2018
SPOTLIGHT: Significant growth in oil sands workforce
Wood Buffalo-Cold Lake, an economic region in northeastern Alberta, is home to significant oil sands on-site operations and a number of roles and occupations related to head office work. Although Statistics Canada does not collect workforce data specifically for oil sands operations, workforce data for the region’s oil and gas industry, particularly the exploration and production (E&P) sub-sector, can be a useful proxy.
A total of 17,700 total oil and gas workers were living in Wood Buffalo-Cold Lake in 2016. Over 75%, or 13,400, of these workers were employed in the E&P sub-sector. The number of E&P workers in Wood Buffalo-Cold Lake increased by 46% from 2006 to 2016, an indication of the growth that occurred within the oil sands workforce during this period. However, the recent downturn in the industry and challenges related to market access have inhibited further growth in the sub-sector.

CANADA’S OIL AND GAS WORKFORCE: DISTRIBUTION, WORK PATTERNS AND INCOME 6 AUGUST 2018
Figure 2: Occupational distribution by job family across Canada and in oil and gas in 2016
Canada’s oil and gas industry employed a diverse set of skills and occupational groups.
In 2016, the oil and gas industry employed workers with expertise across a broad range of skill types (Figure 2). The most commonly represented job family in the industry was trades, transport and equipment operators, who play a crucial role in day-to-day industry operations and accounted for roughly one in five oil and gas workers. Significant portions of the industry’s workforce were also employed in occupations related to natural and applied sciences (18%) and natural resources (19%)5, the latter of which
includes workers in oil and gas drilling, servicing and testing. Workers in business, finance and administration, those typically employed in office-based positions, accounted for 18% of the workforce. Managerial or supervisory roles accounted for 10% of workers, a slightly lower proportion than in Canada’s total workforce (11%). With respect to occupational groups, the oil and gas workforce was more balanced than Canada’s total workforce.
Occupational: Broad range of skills required
Statistics Canada’s definitions of these job families can be found at:http://www23.statcan.gc.ca/imdb/p3VD.pl?Function=getVD&TVD=314243&CVD=314244&CLV=0&MLV=4&D=1
5
2%11%
16%
45%
15%
4%
7%
19%9%
18%
18%
21%
5%
10%
All industries Oil and gas
n = 18,270,000 n = 189,500
Manufacturing and utilities
Management
Business, finance andadministration
Natural and applied sciences
Other
Trades, transport andequipment operators
Natural resources

CANADA’S OIL AND GAS WORKFORCE: DISTRIBUTION, WORK PATTERNS AND INCOME 7 AUGUST 2018
Figure 3: Occupational distribution by workforce share in oil and gas sub-sectors in 2016
JOB FAMILY EXPLORATION AND PRODUCTION
OIL AND GAS SERVICES
PIPELINE
All occupations (total) 88,900 (100%) 92,300 (100%) 8,400 (100%)
Management 9,200 (10%) 8,200 (9%) 990 (12%)
Business, finance and administration 18,200 (20%) 12,600 (14%) 2,200 (26%)
Natural and applied sciences 20,800 (23%) 11,700 (13%) 2,300 (27%)
Trades, transport and equipment operators 15,900 (18%) 23,400 (25%) 1,200 (14%)
Natural resources 8,600 (10%) 26,200 (28%) 200 (2%)
Manufacturing and utilities 11,900 (13%) 5,000 (5%) 900 (11%)
Other 4,300 (5%) 5,100 (5%) 600 (7%)
The top 10 occupations accounted for one-third of the industry’s total workforce.
In 2016, the occupations with the greatest share of the oil and gas industry were:
1. Contractors and supervisors, oil and gas drilling and services (9,845; 5.3% share of workforce)2. Petroleum, gas and chemical process operators (no steam ticket required) (9,720; 5.2%)3. Oil and gas well drillers, servicers, testers and related workers (7,620; 4.1%)4. Heavy equipment operators (6,815; 3.6%)5. Truck drivers (6,090; 3.3%)6. Oil and gas drilling, servicing and related labourers (6,035; 3.2%)7. Oil and gas well drilling and related workers and services operators (5,310; 2.8%)8. Financial auditors and accountants (5,255; 2.8%)9. Petroleum engineers (5,050; 2.7%)10. Managers in natural resources production, drilling and well servicing (4,980; 2.7%)
Collectively, 67,000 workers were employed in these 10 occupations, accounting for 35% of the workforce in the upstream and midstream sectors of the industry.
Each of the three oil and gas sub-sectors had a distinct occupational composition suited to its role within the industry (Figure 3). In 2016, 53% of workers in oil and gas services were employed in positions related to trades, transport and equipment operation, or natural resources, reflecting the sub-sector’s focus on fieldwork, and specifically oil and gas drilling, servicing and testing. In contrast, 54% of workers in the
pipeline sub-sector were employed in positions related to business, finance and administration, or natural and applied sciences. E&P had a more balanced job family profile, similar to the industry as a whole. Notably, the proportion of workers in managerial or supervisory roles was higher in pipeline, at 12%, than in the other sub-sectors.
Note: Job family sums may differ from total sub-sector workforce data due to rounding.

CANADA’S OIL AND GAS WORKFORCE: DISTRIBUTION, WORK PATTERNS AND INCOME 8 AUGUST 2018
Occupational composition
Figure 4: Top occupations by change in workforce share in oil and gas, 2011-2016
The most recent downturn prevented new investment and expansion activity in Canada’s oil and gas industry, while production continued to rise. These divergent trends had a visible impact on the industry’s occupational composition, illustrated through changes in occupational workforce shares. Figure 4 lists the occupations with the largest increases and decreases in workforce share from 2011 to 2016. This analysis was limited to occupations with a minimum of 2,000 workers in 2016.
Slow growth in oil and gas services contributed to large declines in workforce share for occupations related to oil and gas drilling,
testing and servicing. Occupations prominent in E&P and pipeline, including mechanical and power engineers, increased due to rising production levels.
The lower oil price environment also contributed to a greater emphasis on improving productivity, resulting in both rising merger and acquisition activity and organizational restructuring efforts to reduce costs of production during the period. These activities likely contributed to increased demand for engineering-related skills and declines in office and administration jobs.
LARGEST INCREASE LARGEST DECREASE
1. Mechanical engineers (+55%) 1. Geological and mineral technologists and technicians (-40%)
2. Industrial electricians (+41%) 2. Oil and gas well drillers, servicers, testers and related workers (-30%)
3. Supervisors, petroleum, gas and chemical processing and utilities (+37%)
3. Oil and gas drilling, servicing and related labourers (-26%)
4. Power engineers and power systems operators (+36%) 4. Underground production and development miners (-25%)
5. Construction trades helpers and labourers (+29%) 5. Oil and gas well drilling and related workers and service operators (-24%)
6. Welders and related machine operators (+25%) 6. Administrative assistants (-23%)
7. Petroleum, gas and chemical process operators (no steam ticket required) (+14%)
7. Petroleum engineers (-18%)
8. Administrative officers (+13%) 8. Geoscientists (-16%)
9. Inspectors in public and environmental health and occupational health and safety (+11%)
9. Financial auditors and accountants (-10%)
10. Senior managers - construction, transportation, production and utilities (+8%)
10. Purchasing agents and officers (-9%)

CANADA’S OIL AND GAS WORKFORCE: DISTRIBUTION, WORK PATTERNS AND INCOME 9 AUGUST 2018
While this discussion focuses on direct employment, the oil and gas industry is also responsible for creating indirect and induced jobs across Canada.6
Oil and gas workforce distribution by province and economic region
Geographical: Western Canada home to 85% of workers
Although Central and Atlantic Canada saw little change in their share of the national oil and gas workforce from 2011 to 2016, both regions experienced strong growth during the period (Figure 5). The number of oil and gas workers living in Central Canada grew by 9%, from 16,200 to 17,700. Growth was even more prominent in Atlantic Canada, where the number of oil and gas workers rose by 22%, from 9,400 to 11,500. Workforce growth in both regions
exceeded the national growth rate of 7%. In Western Canada, British Columbia also saw significant growth in its oil and gas workforce, from 12,600 to 14,400, a 14% increase. Alberta was relatively on par with the national average at 6%. Notably, Saskatchewan was the only region that saw its oil and gas workforce decline, from 12,300 in 2011 to 11,700 in 2016 (5% decrease).
Canada’s oil and gas workforce has traditionally been centralized in Western Canada, mainly in Alberta. British Columbia, Alberta and Saskatchewan were home to about 85% of the industry’s workers in 20166. The remaining 15% of oil and gas workers lived in either Central (Manitoba, Ontario, Quebec) or Atlantic Canada (New Brunswick, Nova Scotia, Newfoundland and Labrador and Prince Edward Island).
BC(8%)
Wood Buffalo-Cold Lake 9%
Edmonton13%Calgary29%
0.01% to 0.5%0.5% to 1.0%
1.0% to 3.0%3.0% to 7.0%
7.0% to 15%>15%
Note: Workforce data for the territories are excluded from this analysis.
AB(71%)
SK(6%)
CENTRALCANADA
(9%)ATLANTICCANADA
(6%)
Figure 5: Geographic distribution of workforce in oil and gas, 2011-2016
2011 2016 CHANGE IN WORKFORCE
Canada 177,900 (100%) 189,500 (100%) 11,600 (+7%)
British Columbia 12,600 (7%) 14,400 (8%) 1,700 (+14%)
Alberta 126,600 (71%) 133,700 (71%) 7,200 (+6%)
Saskatchewan 12,300 (7%) 11,700 (6%) 600 (-5%)
Central Canada 16,200 (9%) 17,700 (9%) 1,500 (+9%)
Atlantic Canada 9,400 (5%) 11,500 (6%) 2,100 (+22%)
Note: Provincial sums may differ from total Canadian workforce data due to rounding and the exclusion of the territories from this analysis.

CANADA’S OIL AND GAS WORKFORCE: DISTRIBUTION, WORK PATTERNS AND INCOME 10 AUGUST 2018
Most oil and gas workers are located in economic regions7 near major industry operations, primarily in Alberta. In 2016, the economic regions with the greatest share of the oil and gas workforce were:
1. Calgary, AB (53,930; 28.8%)2. Edmonton, AB (23,645; 12.6%)3. Wood Buffalo-Cold Lake, AB (17,690; 9.4%)4. Athabasca-Grande Prairie-Peace River, AB (12,575; 6.7%)5. Red Deer, AB (8,270; 4.4%)6. Camrose-Drumheller, AB (7,570; 4.0%)7. Lethbridge-Medicine Hat, AB (5,210; 2.8%)8. Regina-Moose Mountain, SK (4,080; 2.2%)9. Avalon Peninsula, NL (3,630; 1.9%)10. Northeast Region, BC (3,575; 1.9%)
The top seven regions, all located in Alberta, accounted for 69% of the industry’s total workforce. Furthermore, 51% of the workforce resided in the top three regions (Calgary, Edmonton, Wood Buffalo-Cold Lake) alone. Many oil and gas workers also resided in regions in the rest of Western Canada. Notably, Avalon Peninsula, in Newfoundland and Labrador, was home to just over 3,600 oil and gas workers.
An economic region is defined by Statistics Canada as a grouping of complete census divisions created as a standard geographic unit for analysis of regional economic activity.
7

CANADA’S OIL AND GAS WORKFORCE: DISTRIBUTION, WORK PATTERNS AND INCOME 11 AUGUST 2018
SPOTLIGHT: High concentration of workers in Wood Buffalo region
Workforce concentration is a key metric for identifying regions with significant industry presence. Concentration is defined here as the number of oil and gas workers residing in a region as a share of the total regional workforce. In 2016, the economic regions with the highest concentration of oil and gas workers were:
1. Wood Buffalo-Cold Lake, AB (22.5% share of total regional workforce)2. Northeast Region, BC (9.7%)3. Athabasca-Grande Prairie-Peace River, AB (9.1%)4. Banff-Jasper-Rocky Mountain House, AB (7.4%)5. Red Deer, AB (7.4%)6. Camrose-Drumheller, AB (7.3%)7. Calgary, AB (6.5%)8. Lethbridge-Medicine Hat, AB (3.7%)9. Abitibi-Témiscamingue, QC (3.5%)10. Edmonton, AB (3.2%)
Although Calgary and Edmonton were home to more oil and gas workers than any other region, their larger populations mean they each had a relatively lower concentration of workers. Instead, the top spots were occupied by regions with smaller populations centred around oil and gas industry operations. More than one in five workers who lived in Wood Buffalo-Cold Lake were employed in oil and gas in 2016. That figure was one in 10 in the Northeast Region of British Columbia, which includes the cities of Dawson Creek and Fort St. John as well as a number of Indigenous Peoples communities. Additionally, many workers in Wood Buffalo-Cold Lake who were employed in sectors outside oil and gas (e.g., construction) were likely supporting oil sands development and other industry operations.

CANADA’S OIL AND GAS WORKFORCE: DISTRIBUTION, WORK PATTERNS AND INCOME 12 AUGUST 2018
Figure 6: Share of workforce with no fixed workplace across Canada, in oil and gas sub-sectors in 2016
WORKER MOBILITYOil and gas workers were nearly twice as likely as the average Canadian worker to have no fixed workplace in 2016.
Over one-fifth, or 22%, of the industry’s employed workers reported they did not go to the same workplace location each day, compared to 12% of Canada’s total employed workforce (Figure 6). Just 3% of oil and gas workers reported they worked from home in 2016, while 2% reported working at a location outside of Canada. The share of employed workers with no fixed workplace was significantly larger in oil and gas services than the industry’s other sub-sectors in 2016. Nearly one-third, or 30%, of workers in the services sub-sector had no regular place of work, compared to 15% in E&P and 9% in pipeline. However, the gap between the sub-sectors narrowed from 2006 when 36% of oil and gas services workers reported having no fixed workplace.
Oil and gas workers were also six times more likely to commute to a different province than the average Canadian worker in 2016.8 These workers filled job openings through temporary relocations, also known as fly-in fly-out (FIFO) employment. FIFO employment is particularly useful in remote areas with smaller local labour pools from which to hire. For example, 23,200 oil and gas workers listed Wood Buffalo-Cold Lake, in northeastern Alberta, as their place of work in 2016 (Figure 7). Only 60% of workers also listed the region as their place of residence, with an additional 24% living somewhere else in Alberta. Just under 9% of workers resided in the rest of Western Canada, while the remaining workers lived in either Atlantic (5%) or Central Canada (2%). One quarter, or 25%, of the region’s oil and gas services workers lived outside Alberta, compared to just 13% of E&P workers, reinforcing the notion of higher worker mobility among the oil and gas services sub-sector.
Figure 7: Wood Buffalo-Cold Lake oil and gas workforceby residence in 2016
See data table on commuting destination in Appendix B.8
Alberta
British Columbia
Atlantic Canada
Central Canada
Saskatchewan
84%
6%
1 in 6oil and gas workersfrom outside Alberta
oil and gas workers from Central & Atlantic Canada
1 in 14
5%
2%
2%
Allindustries
Oil and gas(total)
Exploration and production
Oil and gasservices
Pipeline
30%
15%
22%
12%9%
Percentages have been rounded and may not add up to 100%.

CANADA’S OIL AND GAS WORKFORCE: DISTRIBUTION, WORK PATTERNS AND INCOME 13 AUGUST 2018
Longer commutes were more prevalent within the oil and gas industry than in the total Canadian workforce in 2016. Oil and gas workers were twice as likely as the average worker to travel one hour or more for work (Figure 8). They were also somewhat more likely to have commutes of 30 to 59 minutes. Longer commutes in the industry were primarily a result of industry operations that are often situated in remote locations with limited travel options.
Figure 8: Labour force distribution by commuting duration across Canada and in oil and gas in 2016
Less than 30 minutes 30 to 59 minutes 60 minutes and over
Oil and gasAll industries
61%
44%
29%36%
10%
20%

CANADA’S OIL AND GAS WORKFORCE: DISTRIBUTION, WORK PATTERNS AND INCOME 14 AUGUST 2018
WORK PATTERNSThe frequency of part-time and temporary positions within an industry reflects both its stability and the nature of the work. Nearly half, or 44%, of oil and gas workers worked part of the year (i.e., fewer than 49 weeks) and/or part-time (i.e., fewer than 30 hours per week) in 2016 (Figure 9). This share was lower than that of Canada’s total workforce, which was 46%. In contrast, 55% of the industry’s workforce held full-year, full-time (FY/FT) positions, compared to 52% in Canada’s total workforce. The remaining 1% listed themselves as not having worked, compared to 3% in Canada’s total workforce. Part-time and temporary positions were more common in the industry in 2016 than in 2006, when 41% of oil and gas workers were employed in these positions9. The increasing frequency of these positions is an illustration of the shift towards a “gig economy,” as companies attempted to manage uncertainty in the industry.
Due to the frequency of seasonal employment within the services sub-sector, over half, or 51%, of its workforce worked part-year and/or part-time in 2016 (Figure 10). These positions were significantly less common in both E&P and pipeline, at 38% and 30%, respectively. All the industry’s sub-sectors experienced an increasing trend with respect to part-time and temporary positions during the 2006 to 2016 period10.
Figure 9: Labour force distribution by work activityacross Canada in oil and gas in 2016
Figure 10: Labour force distribution by work activity in oil and gas sub-sectors in 2016
See data table on work activity in Appendix B for 2006 data.9See data table on work activity in Appendix B for 2006 data.10
Oil and gasAll industries
Full-year, full-time Part-year and/or part-time Did not work
52% 55%46% 44%
3% 1%
Full-year, full-time Part-year and/or part-time Did not work
61%
48%38%
51%
1% 1%
69%
30%
1%
Exploration and production Oil and gas services Pipeline

CANADA’S OIL AND GAS WORKFORCE: DISTRIBUTION, WORK PATTERNS AND INCOME 15 AUGUST 2018
INCOME
Increase in average employment incomes among oil and gas workers aligns with increase in educational attainment.11
Average employment income among oil and gas workers in Canada surpassed $125,000 in 2016 (Figure 11). Incomes ranged from $96,000 in oil and gas services to over $153,000 in E&P. Overall, average employment income in oil and gas was 24% higher in 2016 than in 2011. Average earnings across Canada’s total workforce grew 17% during the same period. Pipeline workers earned 35% more in 2016 than in 2011, a much larger increase than among workers in E&P (24%) or oil and gas services (20%).
Oil and gas workers in Alberta had the highest earnings of any province or region, likely a result of the large concentration of head office roles (Figure 12). Their average employment income of $136,000 was nearly 10% greater than the national average. In contrast, employment income was 25% below the national average for workers residing in Saskatchewan ($94,000) and 28% below the national average in Central Canada ($91,000). Income differences were driven in part by the type of workers in each province or region. A higher share of oil and gas workers residing in Saskatchewan or Central Canada were employed in the lower-paying services sub-sector. About 63% of the total oil and gas workforce in Saskatchewan and 73% in Central Canada were employed in the services sub-sector; no other province had a rate higher than 58%.
Figure 11: Average employment income in oil and gas sub-sectors, by census year
Figure 12: Average employment income in oil and gasin 2016, by province
PetroLMI Diversifying Canada’s Oil and Gas Workforce: A Decade in Review. June 2018.11
2011 2016
Oil and gas (total) Exploration andproduction
Oil and gas services Pipeline
$107,800
$145,100$125,300
$101,200$123,800
$153,600
$79,500$95,700
BritishColumbia
Alberta Saskatchewan CentralCanada
AtlanticCanada
$108,100
$135,600
$94,400 $90,700$112,600

CANADA’S OIL AND GAS WORKFORCE: DISTRIBUTION, WORK PATTERNS AND INCOME 16 AUGUST 2018
To compare oil and gas with other trade-intensive industries, average annualized earnings in 2016 were $57,000 for manufacturing and $63,000 for construction (Figure 13). Workers in the utilities sector fared better, earning just over $90,000 on average in 2016.
Figure 13: Average employment income across Canada, in oil and gas and other trade-intensive industries in 2016
All industries Oil and gas Utilities Construction Manufacturing
$50,900
$125,300
$90,400
$63,300 $56,600
CONCLUSION
Canada’s oil and gas industry has undergone a significant transformation in the past decade. As the industry has adjusted to the ups and downs of the economy, there were corresponding shifts in the distribution of the industry’s workforce and the daily experiences of those workers.
While the industry saw a 15% increase in the size of its workforce from 2006 to 2016, sub-sector analysis shows the growth was mostly concentrated in E&P. The industry’s transformation was also illustrated through changes to its occupational composition between 2011 and 2016, as positions in engineering and applied sciences became more prominent and occupations related to drilling, servicing and testing were negatively impacted. The analysis also highlights the increasing number of oil and gas workers residing outside Western Canada, particularly in the Atlantic provinces. This trend reflected the growing importance of temporary relocations as a hiring strategy for remote industry operations.
In 2016, oil and gas workers’ daily experiences were characterized by longer commutes, often over an hour, and a greater likelihood than the average Canadian worker to have no fixed workplace. The industry’s workforce also shifted toward more part-time and temporary positions by 2016 as a response to uncertainty in the industry. These changes were compounded by demographic shifts in the workforce12. However, the nature of the industry’s work did not change. Oil and gas workers were well-compensated compared with other trade-intensive industries in 2016.
Looking ahead, it is expected that the industry will continue to transform as a result of the implementation of automation, regulations and a shift from oil and gas expansion to production optimization13. PetroLMI will continue to monitor these trends and reflect workforce shifts and changes in forthcoming reports.
PetroLMI Diversifying Canada’s Oil and Gas Workforce: A Decade in Review. June 2018.12
PetroLMI A Workforce in Transition: Oil and Gas Skills of the Future. June 2018.13

CANADA’S OIL AND GAS WORKFORCE: DISTRIBUTION, WORK PATTERNS AND INCOME 17 AUGUST 2018
APPENDIX A: RESEARCH NOTES & DEFINITIONSData for this report were primarily collected from Statistics Canada’s 2006 Census, the 2011 National Household Survey (NHS) and 2016 Census releases and customized based on the North American Industry Classification System (NAICS) at the two- and three-digit level. Additional data were collected from Statistics Canada’s Labour Force Survey (LFS) and the Survey of Employment, Payroll and Hours (SEPH). In some cases, data from 2006 Census or the 2011 NHS were unavailable for specific variables. The census year in question was omitted from the analysis in these cases. For example, changes in workforce share by occupation were calculated using 2011 NHS and 2016 Census data as 2006 Census data were unavailable.
The three sub-sectors that compose the oil and gas industry are: oil and gas extraction (NAICS 211), support activities for mining and oil and gas extraction (NAICS 213) and pipeline transportation (NAICS 486). In this report, they are referred to as exploration and production, oil and gas services and pipeline, respectively. All workforce estimates related to NAICS 213 were reduced by 15% in order to capture only the support activities for the oil and gas industry.
The workforce, also known as the labour force, refers to all persons who are either employed, or unemployed and actively seeking work. The terms “proportion” and “share” are used interchangeably in this report to refer to the number of individuals in the workforce belonging to a specific group as a percentage of the overall workforce. For example, in 2016, 133,700 of the 189,500 total oil and gas workers lived in Alberta. Thus, the proportion or share of the oil and gas workforce who lived in Alberta is 133,700 divided by 189,500, or 71%.
Direct employment refers to jobs created directly by the oil and gas industry’s activities. Indirect employment refers to jobs created in other industries that provide goods and services to oil and gas. Induced employment refers to jobs created due to consumer spending by direct and indirect workers.
An economic region is defined by Statistics Canada as a grouping of complete census divisions created as a standard geographic unit for analysis of regional economic activity. There are 76 economic regions across Canada.
Full-year, full-time (FY/FT) workers are defined as persons aged 15 years and over who work 49 to 52 weeks per year (i.e., full-year) and mostly work for 30 hours or more per week (i.e., full-time) either for pay or in self-employment. Responses are based on the respondent’s work activity in the year prior to the census.
Workers who reported having no fixed workplace refers to those who do not go from home to the same workplace location at the beginning of each shift. Other response categories include persons with a usual workplace address, persons who work at home and persons who work outside Canada. Responses are based on the respondent’s place of work in the year prior to the census.
The Income section uses two different data sources. Average employment income includes all income received as wages, salaries and commissions from paid employment and net self-employment income. Data on average employment income were collected from the 2016 Census and 2011 NHS data releases for the three oil and gas sub-sectors and the average across all industries. Average annualized earnings include gross payroll earnings before deductions. Data on average earnings were collected from SEPH for all non-oil and gas industries. Weekly earnings were annualized based on a 52-week work year.

CANADA’S OIL AND GAS WORKFORCE: DISTRIBUTION, WORK PATTERNS AND INCOME 18 AUGUST 2018
APPENDIX B: DATA TABLESThe values referenced throughout this report are rounded to the nearest hundred for readability purposes. The values in the data tables below are presented by Statistics Canada for the exploration and production, oil and gas services and pipeline sub-sectors, as well as the all industries total. Data related to the oil and gas services sub-sector are rounded to a base of 5. The oil and gas (total) column in each table refers to the sum of the counts in each sub-sector. The total values for the same industry or sub-sector and census year are not identical across data tables due to rounding of estimates and differences in response rates between census questions.
PROVINCE ALL INDUSTRIES OIL AND GAS(TOTAL)
EXPLORATION AND PRODUCTION
OIL AND GAS SERVICES
PIPELINE
2016
Canada 18,268,125 (100%) 189,550 (100%) 88,895 (100%) 92,275 (100%) 8,375 (100%)
Newfoundland and Labrador
251,800 (1%) 5,930 (3%) 2,315 (3%) 3,600 (4%) 15 (<1%)
Prince Edward Island
76,645 (<1%) 305 (<1%) 80 (<1%) 225 (<1%) 0 (N/A)
Nova Scotia 465,330 (3%) 2,805 (1%) 1,185 (1%) 1,585 (2%) 35 (<1%)
New Brunswick 374,470 (2%) 2,430 (1%) 1,120 (1%) 1,290 (1%) 20 (<1%)
Quebec 4,154,015 (23%) 5,195 (3%) 500 (1%) 4,635 (5%) 60 (1%)
Ontario 6,970,625 (38%) 10,550 (6%) 2,880 (3%) 7,040 (8%) 630 (8%)
Manitoba 649,530 (4%) 1,975 (1%) 590 (1%) 1,295 (1%) 90 (1%)
Saskatchewan 575,310 (3%) 11,680 (6%) 3,860 (4%) 7,390 (8%) 430 (5%)
Alberta 2,262,935 (12%) 133,725 (71%) 70,560 (79%) 56,400 (61%) 6,765 (81%)
British Columbia 2,427,860 (13%) 14,370 (8%) 5,710 (6%) 8,350 (9%) 310 (4%)
2011
Canada 17,587,615 (100%) 177,935 (100%) 82,360 (100%) 88,510 (100%) 7,065 (100%)
Newfoundland and Labrador
250,780 (1%) 4,855 (3%) 1,910 (2%) 2,945 (3%) 0 (N/A)
Prince Edward Island
76,950 (<1%) 365 (<1%) 170 (<1%) 195 (<1%) 0 (N/A)
Nova Scotia 474,650 (3%) 2,295 (1%) 1,035 (1%) 1,260 (1%) 0 (N/A)
New Brunswick 389,070 (2%) 1,895 (1%) 885 (1%) 1,010 (1%) 0 (N/A)
Quebec 4,085,125 (23%) 4,925 (3%) 435 (1%) 4,395 (5%) 95 (1%)
Ontario 6,680,245 (38%) 9,345 (5%) 2,140 (3%) 6,730 (8%) 475 (7%)
Manitoba 625,805 (4%) 1,960 (1%) 435 (1%) 1,460 (2%) 65 (1%)
Saskatchewan 554,715 (3%) 12,315 (7%) 3,405 (4%) 8,385 (9%) 525 (7%)
Alberta 2,088,150 (12%) 126,550 (71%) 68,400 (83%) 52,610 (59%) 5,540 (78%)
British Columbia 2,305,315 (13%) 12,640 (7%) 3,435 (4%) 8,880 (10%) 325 (5%)

CANADA’S OIL AND GAS WORKFORCE: DISTRIBUTION, WORK PATTERNS AND INCOME 19 AUGUST 2018
PLACE OF WORK ALL INDUSTRIES OIL AND GAS(TOTAL)
EXPLORATION AND PRODUCTION
OIL AND GAS SERVICES
PIPELINE
2016
Total 17,230,040 (100%) 160,180 (100%) 78,900 (100%) 73,570 (100%) 7,710 (100%)
Worked at home 1,272,280 (7%) 5,475 (3%) 1,795 (3%) 3,615 (5%) 65 (1%)
Worked outside Canada 78,815 (<1%) 2,430 (2%) 885 (1%) 1,530 (2%) 15 (<1%)
No fixed workplace 1,987,265 (12%) 34,695 (22%) 11,900 (15%) 22,120 (30%) 675 (9%)
Usual place of work 13,891,680 (81%) 117,580 (73%) 64,320 (82%) 46,305 (63%) 6,955 (90%)
2006
Total 16,021,175 (100%) 153,275 (100%) 69,265 (100%) 79,780 (100%) 4,230 (100%)
Worked at home 1,230,350 (8%) 6,560 (4%) 1,980 (3%) 4,510 (6%) 70 (2%)
Worked outside Canada 76,570 (<1%) 2,540 (2%) 1,145 (2%) 1,370 (2%) 25 (1%)
No fixed workplace 1,644,360 (10%) 40,680 (27%) 11,055 (16%) 29,115 (36%) 510 (12%)
Usual place of work 13,069,895 (82%) 103,500 (68%) 55,085 (80%) 44,790 (56%) 3,625 (86%)
COMMUTING DESTINATION
ALL INDUSTRIES OIL AND GAS(TOTAL)
EXPLORATION AND PRODUCTION
OIL AND GAS SERVICES
PIPELINE
2016
Total 15,933,570 (100%) 139,260 (100%) 72,950 (100%) 58,840 (100%) 7,470(100%)
Commute within Census subdivision
9,838,500 (62%) 81,645 (59%) 47,160 (65%) 29,225 (50%) 5,260 (70%)
Commute withinCensus division
3,058,425 (19%) 31,915 (23%) 12,360 (17%) 17,845 (30%) 1,710 (23%)
Commute within province
2,860,175 (18%) 17,110 (12%) 8,995 (12%) 7,695 (13%) 420 (6%)
Commute to differentprovince
176,470 (1%) 8,585 (6%) 4,435 (6%) 4,070 (7%) 80 (1%)
CANADA’S OIL AND GAS WORKFORCE: DISTRIBUTION, WORK PATTERNS AND INCOME 20 AUGUST 2018
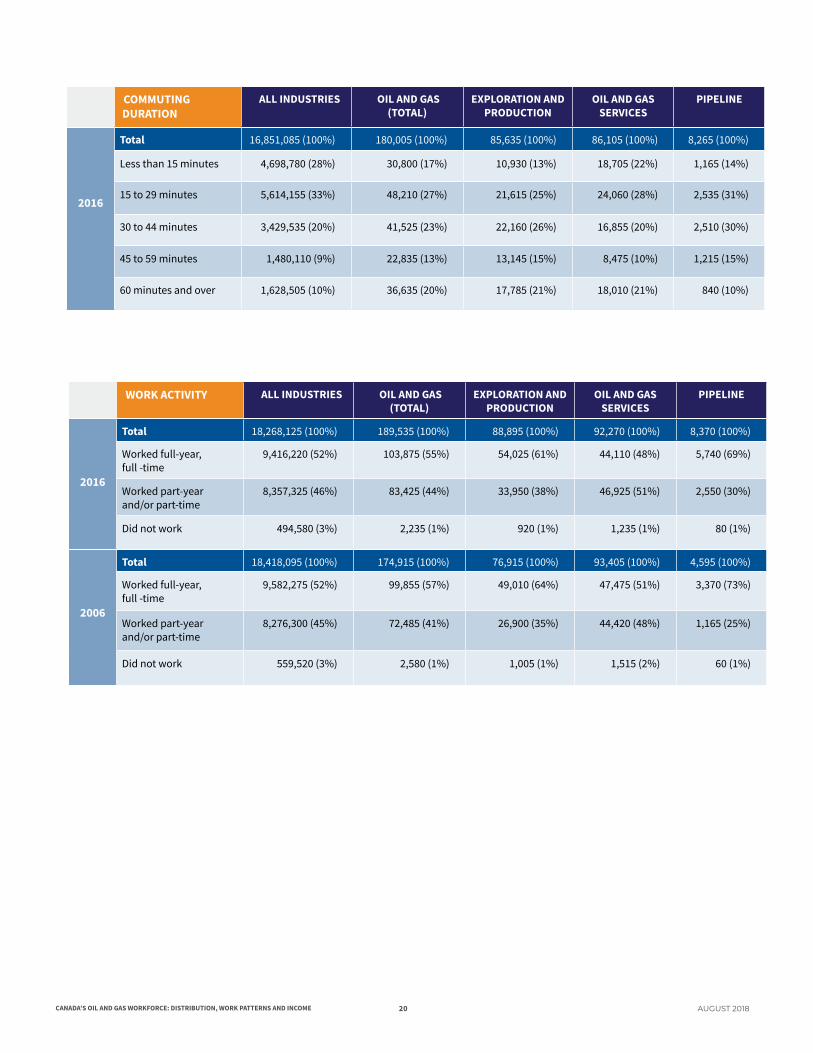
COMMUTING DURATION
ALL INDUSTRIES OIL AND GAS(TOTAL)
EXPLORATION AND PRODUCTION
OIL AND GAS SERVICES
PIPELINE
2016
Total 16,851,085 (100%) 180,005 (100%) 85,635 (100%) 86,105 (100%) 8,265 (100%)
Less than 15 minutes 4,698,780 (28%) 30,800 (17%) 10,930 (13%) 18,705 (22%) 1,165 (14%)
15 to 29 minutes 5,614,155 (33%) 48,210 (27%) 21,615 (25%) 24,060 (28%) 2,535 (31%)
30 to 44 minutes 3,429,535 (20%) 41,525 (23%) 22,160 (26%) 16,855 (20%) 2,510 (30%)
45 to 59 minutes 1,480,110 (9%) 22,835 (13%) 13,145 (15%) 8,475 (10%) 1,215 (15%)
60 minutes and over 1,628,505 (10%) 36,635 (20%) 17,785 (21%) 18,010 (21%) 840 (10%)
WORK ACTIVITY ALL INDUSTRIES OIL AND GAS(TOTAL)
EXPLORATION AND PRODUCTION
OIL AND GAS SERVICES
PIPELINE
2016
Total 18,268,125 (100%) 189,535 (100%) 88,895 (100%) 92,270 (100%) 8,370 (100%)
Worked full-year,full -time
9,416,220 (52%) 103,875 (55%) 54,025 (61%) 44,110 (48%) 5,740 (69%)
Worked part-year and/or part-time
8,357,325 (46%) 83,425 (44%) 33,950 (38%) 46,925 (51%) 2,550 (30%)
Did not work 494,580 (3%) 2,235 (1%) 920 (1%) 1,235 (1%) 80 (1%)
2006
Total 18,418,095 (100%) 174,915 (100%) 76,915 (100%) 93,405 (100%) 4,595 (100%)
Worked full-year,full -time
9,582,275 (52%) 99,855 (57%) 49,010 (64%) 47,475 (51%) 3,370 (73%)
Worked part-year and/or part-time
8,276,300 (45%) 72,485 (41%) 26,900 (35%) 44,420 (48%) 1,165 (25%)
Did not work 559,520 (3%) 2,580 (1%) 1,005 (1%) 1,515 (2%) 60 (1%)

CANADA’S OIL AND GAS WORKFORCE: DISTRIBUTION, WORK PATTERNS AND INCOME 21 AUGUST 2018
Acknowledgements
The Petroleum Labour Market Information (PetroLMI) Divison of Energy Safety Canada gratefully acknowledges the Government of Canada’s department of Employment and Social Development Canada for the funding to undertake and complete this study.
PetroLMI also acknowledges the contributions of Prism Economics
and Analysis, and Ryan Isojima Design for assisting in the study
and production of this report.
Disclaimer
This project is funded by the Government of Canada’s Sectoral Initiatives Program.
All rights reserved.
The reader of this report has permission to use “limited labour market information (or LMI) content” for general reference or educational purposes in the reader’s analysis or research reports. “Limited LMI Content” is defined as not exceeding 400 words or a maximum of two data tables or graphs per document. Where Limited LMI Content is used, the reader must cite the source of the Limited LMI Content as follows: Source (or “adapted from”): PetroLMI, name or product, catalogue, volume and issue numbers, reference period and page(s).
The reader of this report cannot:
• Market, distribute, export, translate, transmit, merge, modify, transfer, adapt, loan, rent, lease, assign, share, sub-license or make available to another person or entity, this report in any way, in whole or in part
• Use this report and its contents to develop or derive any other information product or information service for commercial distribution or sale
• Use this report and its contents in any manner deemed competitive with any other product or service sold by PetroLMI
The information and projections contained herein have been prepared with information sources PetroLMI has deemed to be reliable. PetroLMI makes no representations or warranties that this report is error free and therefore shall not be liable for any financial or other losses or damages of any nature whatsoever arising from or otherwise relating to any use of this document. The opinions and interpretations in this publication are those of PetroLMI and do not necessarily reflect those of the Government of Canada.
For more information, contact:Petroleum Labour Market Information(PetroLMI) Phone: 403-516-8100Email: [email protected]
Copyright © PetroLMI 2018Published August 2018

Photos courtesy of: Cenovus Energy Inc., ConocoPhillips, Nexen, Syncrude Canada Ltd., TransCanada Corporation
PetroLMI OverviewThe Petroleum Labour Market Information (PetroLMI) Division of Energy Safety Canada is a leading resource for labour market information and trends regarding Canada’s oil and gas industry. PetroLMI specializes in providing petroleum labour market data, analysis and insights, as well as occupation profiles and other resources.
Careers in Oil + Gas is a PetroLMI initiative and is Canada’s leading website for petroleum labour market information and insights, as well as occupational tools and other resources for career and workforce planning.
[email protected] or toll free 1-866-537-12305055 11 Street NE, Calgary, AB T2E 8N4CareersinOilandGas.com