can you see it? two novel eye-tracking-based measures …staab/research/publications/2013/... ·...
TRANSCRIPT
Can you see it? Two Novel Eye-Tracking-BasedMeasures for Assigning Tags to Image Regions
Tina Walber1, Ansgar Scherp1,2, and Steffen Staab1
1Institute for Web Science and Technology, University of Koblenz-Landau, Germanyhttp://west.uni-koblenz.de
2Research Group On Data and Web Science, University of Mannheim, Germanyhttp://dws.informatik.uni-mannheim.de
{walber,scherp,staab}@uni-koblenz.de
Abstract. Eye tracking information can be used to assign given tags toimage regions in order to describe the depicted scene more detailed. Weintroduce and compare two novel eye-tracking-based measures for con-ducting such assignments: The segmentation measure uses automaticallycomputed image segments and selects the one segment the users fixatelongest. The heat map measure is based on traditional gaze heat mapsand sums up the users’ fixation durations per pixel. Both measures areapplied on gaze data obtained for a set of social media images, whichhave manually labeled objects as ground truth. We have determined amaximum average precision of 65% at which the segmentation measurepoints to the correct region in the image. The best coverage of the seg-ments is obtained for the segmentation measure with a F-measure of35%. Overall, both newly introduced gaze-based measures deliver bet-ter results than baseline measures that selects a segment based on thegolden ratio of photography or the center position in the image. Theeye-tracking-based segmentation measure significantly outperforms thebaselines for precision and F-measure.
Keywords: Fixation measures, automatic segmentation, heat maps
1 Introduction
The understanding of image content is still a challenge in automatic image pro-cessing. Often, tags are used to manually describe images. Another approach isto analyze the text surrounding an image, e.g., on web pages, to draw conclu-sions about the depicted scene. A better understanding of the objects depictedon an image can improve the handling of images in many ways, e.g., by allowingsimilarity search based on regions [8] or by serving as ground truth for computervision algorithms [11]. It is intuitive for humans to identify objects depictedon an image. The human perception system can compensate perspective dis-tortions, occlusions and can also identify objects with an unusual appearance.These adaptions of the perception system are hard tasks for algorithms and haveyet not been solved.
The idea of our work is to benefit from human abilities to perceive visualinformation in order to obtain a better understanding of depicted scenes. Wenotice a rapid development of sensor hardware (cameras) in devices like laptopsand a decreasing of cost for hardware. Extrapolating this development into thefuture, eye tracking will be more widely available and can be performed usingstandard sensors like web cameras [12]. In this work, we investigate two neweye-tracking-based measures with regard to their capability of assigning a giventag to a region in an image such that a depicted object is correctly labeled.For this purpose, we have investigated how efficient measures applied on eyefixations may serve the region labeling task. Fixations are the phases in the gazetrajectories when the eyes are fixating a single location. The first measure isthe eye-tracking-based segmentation measure. It is based on a standard imagesegmentation algorithm [2] and selects the image segment as most relevant forthe given tag which the user fixates on for the longest time interval. The secondmeasure is the eye-tracking-based heat map measure. It is based on a traditionalheat map and sums up the duration of the fixations.
We compare the two new eye-tracking-based measures with two baseline mea-sures. The baselines also make use of automatically computed segments, but notof additional information. The eye tracking data for our investigations is takenfrom a controlled experiment conducted with 30 subjects each viewing 51 socialmedia images with given tags. The experiment is presented in [14]. First, thesubjects where shown a specific tag. Subsequently, we have recorded their gazepath while they viewed the image and while they had to decide whether an ob-ject referring to that tag was depicted or not. The social media images have asground truth manually labeled objects. We have used this experimental data totackle the following core research questions:
• To which extent may the two new eye-tracking-based measures identify thecorrect position in the image for a given tag (maximum precision)?• To which extent does the area determined by the two new measures cover
the actual object depicted in the image (maximum F-measure)?
We show that the segmentation measure performs better for both questions,although the difference to the heat map measure is not significant. The segmen-tation measure delivers significantly better results for precision and F-measurethan the baseline approaches.
In the subsequent section, we discuss the related work. In Section 3, we de-scribe our two novel eye-tracking-based measures and the baselines. In Section 4,the experiment is described from which we have obtained the eye tracking data.The examination of the best parameters determined on a subset of the imagesis presented in Section 5 followed by the results obtained from our experimentsin Section 6. We discuss the results in Section ??, before we conclude.
2 Related Work
Yarbus [15] has already shown in 1967 that image content strongly influences eyemovements. The tendency of humans to fixate faces on images is well known and
also the identification of parts of the faces from gaze paths can be performed [4].Klami [9] investigates which parts of images are relevant for a user in a giventask. In his work, relevance is calculated only from the gaze information and itis represented in a Gaussian mixture model, which resembles heat maps. Thework reveals that the visual attention depends on the task given to the subjectbefore viewing an image. The work of Ramanathan et al. [10] aims at localizingaffective objects and actions in images by using gaze information. Areas thatare affecting the users’ attention are identified and correlated with given con-cepts from an affection model. The affective image regions are identified usingsegmentation and recursive clustering of the gaze fixations. General identifica-tion of image regions showing specific objects like it is aimed in this work isnot conducted. In a previous work [14], we have investigated the possibilities toassign tags to image regions, where these regions were manually labeled withhand-drawn polygons. Gaze paths of users looking at the images were analyzedby 13 different fixation measures to calculate the assignment. A tag was assignedto a correct image region for 63% of the image-tag-pairs. Essig [6] takes user-relevance feedback, gained from gaze information, into account to improve thecontent-based image search. The feedback is calculated on the basis of image re-gions. He showed that the retrieval results of his approach received significantlyhigher similarity values than those of the standard approach, which is based onlyon automatically derived image features. Bartelma [3] investigated the combi-nation of gaze control and image segmentation. He has implemented a systemthat is controlled by gaze to manually segment images. The gaze is exclusivelyused as a mouse replacement. The subjects were instructed to outline a givenobject with their gaze. Santella et al. [13] present a method for semi-automaticimage cropping using gaze information in combination with image segmentation.Goal is to find the most important image region, independent of the objects inthe image. Their work shows that the image cropping approach based on gazeinformation is preferred by the users to fully automatic cropping in 58.4%.
The related work shows that eye tracking information is exact enough to beused on the level of image regions and that this information can be of value inseveral use cases. To the best of our knowledge, no work is done like ours thataims at assigning given tags to image regions by using gaze information withouta given ground truth segmentation.
3 Identifying Objects in Images
We suggest two methods for assigning tags to image regions, thus identifyingobjects that correspond to a predefined tag. Both methods, as well as the baselinemethods, proceed using the following input:
• An image I is a set of pixels P (x, y), 0 ≤ x < width, 0 ≤ y < height
• A tag t, describing an object depicted in I
• A set of users U that have viewed the images during the experiment
• Set of gaze paths Gt provided by users u ∈ U , to which the tag t was shownand who had to decide whether an object described by t can be seen on theimage or not
Gaze paths consist of fixations and saccades. Fixations F are short stopsthat constitute the phases of the highest visual perception, while saccades arequick movements between the fixations. Every gaze path Gt consists of a set offixations F , provided by user u ∈ U . Every fixation f = (xf , yf , d) is describedby a fixated point on the image (xf , yf ) and a duration d. To measure the humanvisual attention, the fixations are analyzed by so called fixation measures. Fromthese measures, a value ν is calculated for given regions R of an image I. Exampleeye tracking measures are the fixationCount, a standard measure which counts thenumber of fixations on an region and the lastFixationDuration, which sums up theduration of the last fixation on an image region. We have compared 13 fixationmeasures with respect to their ability to identify a concrete image region for atag t given to the users [14]. Derived from the results of this work, we use themeasure lastFixationDuration, which has delivered the best results.
Subsequently, we present the two novel eye-tracking-based measures and thebaseline measures; we also describe the method for evaluating the proposed eye-tracking-based measures.
Eyetracking-based Segmentation Measure: The idea of this approachis to calculate ν for the fixation measure lastFixationDuration for all regions r ∈ Rgained from an automatically segmented algorithm. ν(r, u) is calculated for everyuser u ∈ U viewing the image. The values ν are summed up for every regionover all users and the favorite region rfav is determined by the highest value:
rfav = arg maxr∈R,u∈U
∑ν(r, u) (1)
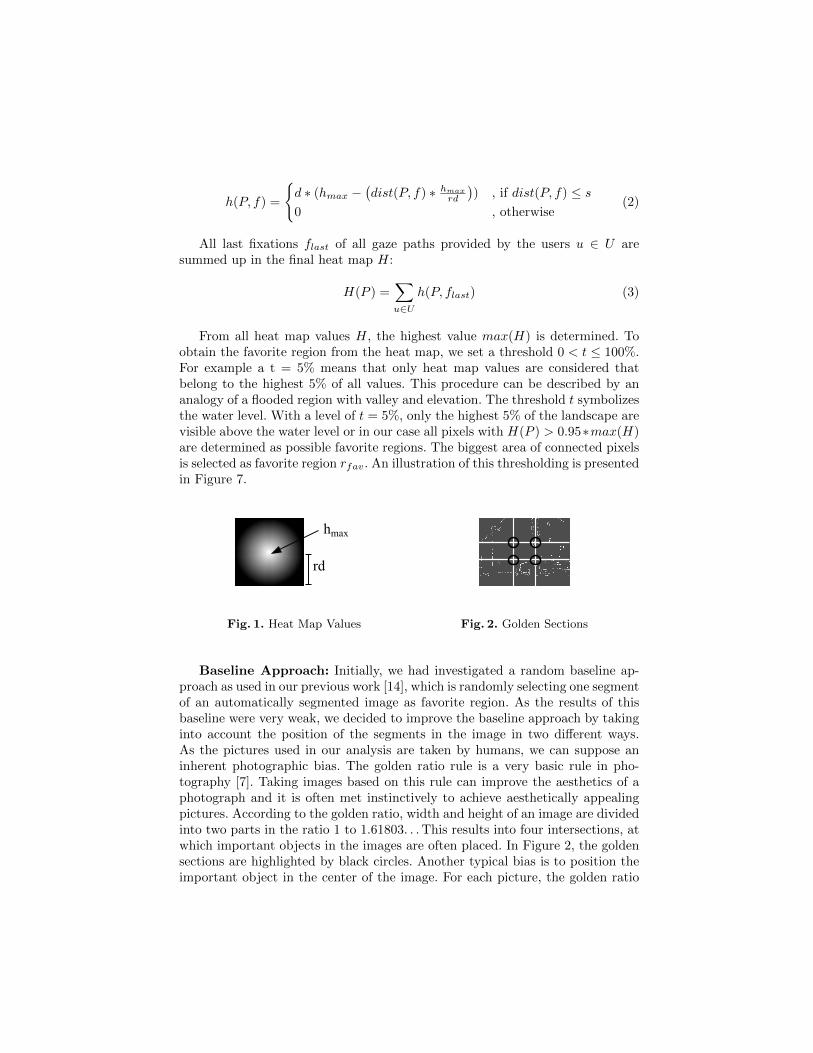
Eyetracking-based Heat Map Approach: Heat maps are two-dimensionalgraphical representations of a number of gaze information. They visualize thefrequency of fixations for every pixel P = (x, y) on an image. Different colorssymbolize how many times or how long a pixel was fixated. The advantage ofheat maps is that they can summarize a large quantity of data and are easy tocomprehend by humans. Thus, they are often used in usability experiments tovisualize users’ attention. Different kinds of heat maps can be created based ondifferent measures, e.g., a fixationCount or a absoluteDuration heat map [5]. As thelast lastFixationDuration was the best measurement for the region identification inour previous work [14], we use this measure as basis for our approach. A radiusrd has to be defined for the creation of a heat map. We use a default valueof 50 pixels, taken from Tobii Studio [1]. A maximum value of hmax = 100 isassigned to the pixel fixated by a fixation f = (xf , yf , d). Outgoing from thispoint, values are added to the pixel in the surrounding of the fixation, basedon a linear interpolation between hmax and 0. The result is multiplied by thefixation duration d. An example is visualized in Figure 1. For a single fixation,we calculate the heat map values h of all pixels P = (x, y) in the surrounding ofthe fixation:
h(P, f) =
{d ∗ (hmax −
(dist(P, f) ∗ hmax
rd
)) , if dist(P, f) ≤ s
0 , otherwise(2)
All last fixations flast of all gaze paths provided by the users u ∈ U aresummed up in the final heat map H:
H(P ) =∑u∈U
h(P, flast) (3)
From all heat map values H, the highest value max(H) is determined. Toobtain the favorite region from the heat map, we set a threshold 0 < t ≤ 100%.For example a t = 5% means that only heat map values are considered thatbelong to the highest 5% of all values. This procedure can be described by ananalogy of a flooded region with valley and elevation. The threshold t symbolizesthe water level. With a level of t = 5%, only the highest 5% of the landscape arevisible above the water level or in our case all pixels with H(P ) > 0.95∗max(H)are determined as possible favorite regions. The biggest area of connected pixelsis selected as favorite region rfav. An illustration of this thresholding is presentedin Figure 7.
Fig. 1. Heat Map Values Fig. 2. Golden Sections
Baseline Approach: Initially, we had investigated a random baseline ap-proach as used in our previous work [14], which is randomly selecting one segmentof an automatically segmented image as favorite region. As the results of thisbaseline were very weak, we decided to improve the baseline approach by takinginto account the position of the segments in the image in two different ways.As the pictures used in our analysis are taken by humans, we can suppose aninherent photographic bias. The golden ratio rule is a very basic rule in pho-tography [7]. Taking images based on this rule can improve the aesthetics of aphotograph and it is often met instinctively to achieve aesthetically appealingpictures. According to the golden ratio, width and height of an image are dividedinto two parts in the ratio 1 to 1.61803. . . This results into four intersections, atwhich important objects in the images are often placed. In Figure 2, the goldensections are highlighted by black circles. Another typical bias is to position theimportant object in the center of the image. For each picture, the golden ratio
and the center baselines are calculated. The segment placed at the golden sectionrespectively the center point is selected as favorite region rfav.
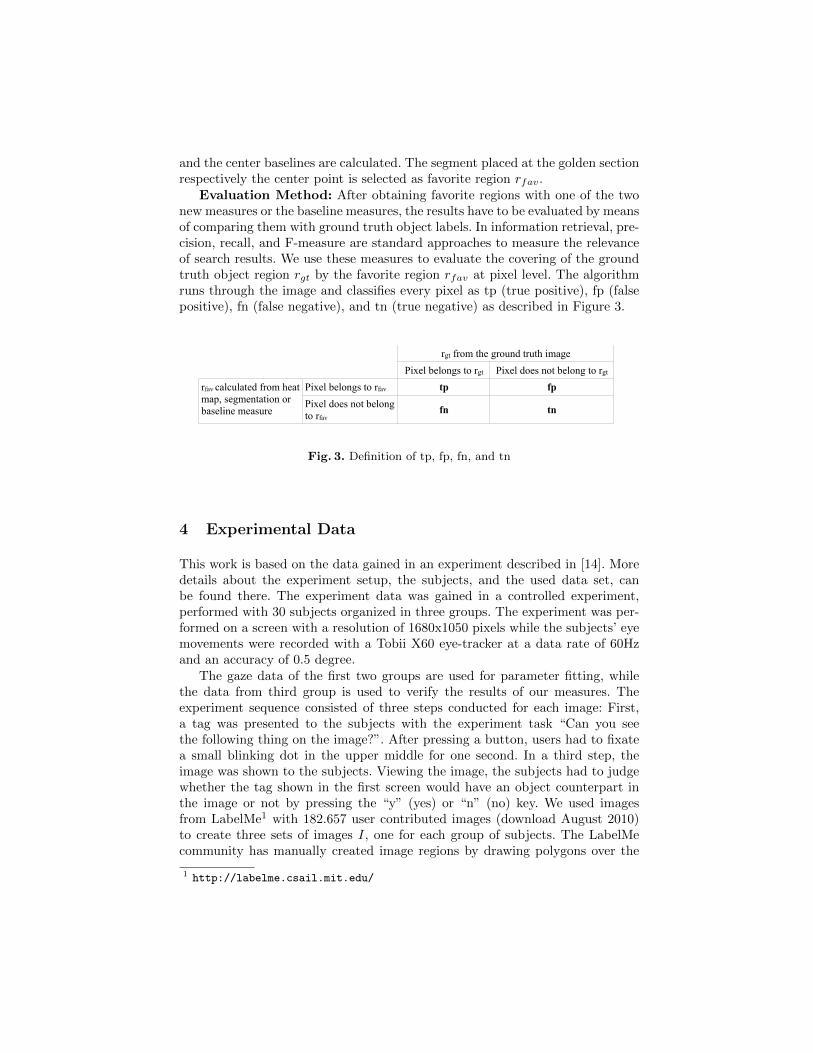
Evaluation Method: After obtaining favorite regions with one of the twonew measures or the baseline measures, the results have to be evaluated by meansof comparing them with ground truth object labels. In information retrieval, pre-cision, recall, and F-measure are standard approaches to measure the relevanceof search results. We use these measures to evaluate the covering of the groundtruth object region rgt by the favorite region rfav at pixel level. The algorithmruns through the image and classifies every pixel as tp (true positive), fp (falsepositive), fn (false negative), and tn (true negative) as described in Figure 3.
rgt from the ground truth image
Pixel belongs to rgt Pixel does not belong to rgt
rfav calculated from heat map, segmentation or baseline measure
Pixel belongs to rfav tp fp
Pixel does not belong to rfav
fn tn
Fig. 3. Definition of tp, fp, fn, and tn
4 Experimental Data
This work is based on the data gained in an experiment described in [14]. Moredetails about the experiment setup, the subjects, and the used data set, canbe found there. The experiment data was gained in a controlled experiment,performed with 30 subjects organized in three groups. The experiment was per-formed on a screen with a resolution of 1680x1050 pixels while the subjects’ eyemovements were recorded with a Tobii X60 eye-tracker at a data rate of 60Hzand an accuracy of 0.5 degree.
The gaze data of the first two groups are used for parameter fitting, whilethe data from third group is used to verify the results of our measures. Theexperiment sequence consisted of three steps conducted for each image: First,a tag was presented to the subjects with the experiment task “Can you seethe following thing on the image?”. After pressing a button, users had to fixatea small blinking dot in the upper middle for one second. In a third step, theimage was shown to the subjects. Viewing the image, the subjects had to judgewhether the tag shown in the first screen would have an object counterpart inthe image or not by pressing the “y” (yes) or “n” (no) key. We used imagesfrom LabelMe1 with 182.657 user contributed images (download August 2010)to create three sets of images I, one for each group of subjects. The LabelMecommunity has manually created image regions by drawing polygons over the
1 http://labelme.csail.mit.edu/
images and tagging them. The labels were used as tags t and the polygons asground truth image segmentation. For every image selected, we randomly chosea “true” (describing an object on the image) or “false” tag. About 50% of thegiven tags corresponded to an object displayed in the image (“true” tag), whilethe other half did not. In our analysis of the gaze data, we consider only databelonging to images with a given “true” tag and a correct answer by the user.
5 Determining Best Parameter Settings
The data set is split into two subsets: a training set for the parameter fitting (56images-tag-pairs each viewed by 10 users) and a test set for the evaluation ofthe approaches (29 images-tag-pairs each viewed by 10 users). In this section, weinvestigate different parameters for our approaches and identify the parametersleading to the best results. The outcome is applied to the test data set and usedto compare the different measures from Section 6.
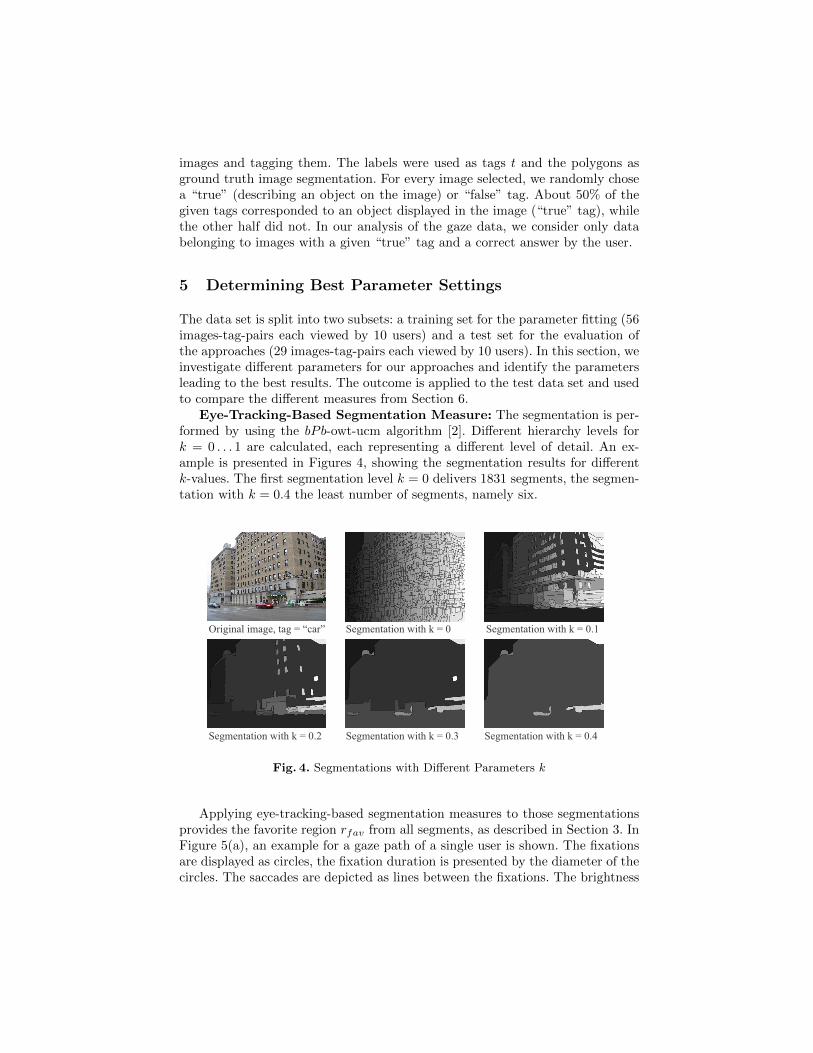
Eye-Tracking-Based Segmentation Measure: The segmentation is per-formed by using the bPb-owt-ucm algorithm [2]. Different hierarchy levels fork = 0 . . . 1 are calculated, each representing a different level of detail. An ex-ample is presented in Figures 4, showing the segmentation results for differentk-values. The first segmentation level k = 0 delivers 1831 segments, the segmen-tation with k = 0.4 the least number of segments, namely six.
Fig. 4. Segmentations with Different Parameters k
Applying eye-tracking-based segmentation measures to those segmentationsprovides the favorite region rfav from all segments, as described in Section 3. InFigure 5(a), an example for a gaze path of a single user is shown. The fixationsare displayed as circles, the fixation duration is presented by the diameter of thecircles. The saccades are depicted as lines between the fixations. The brightness
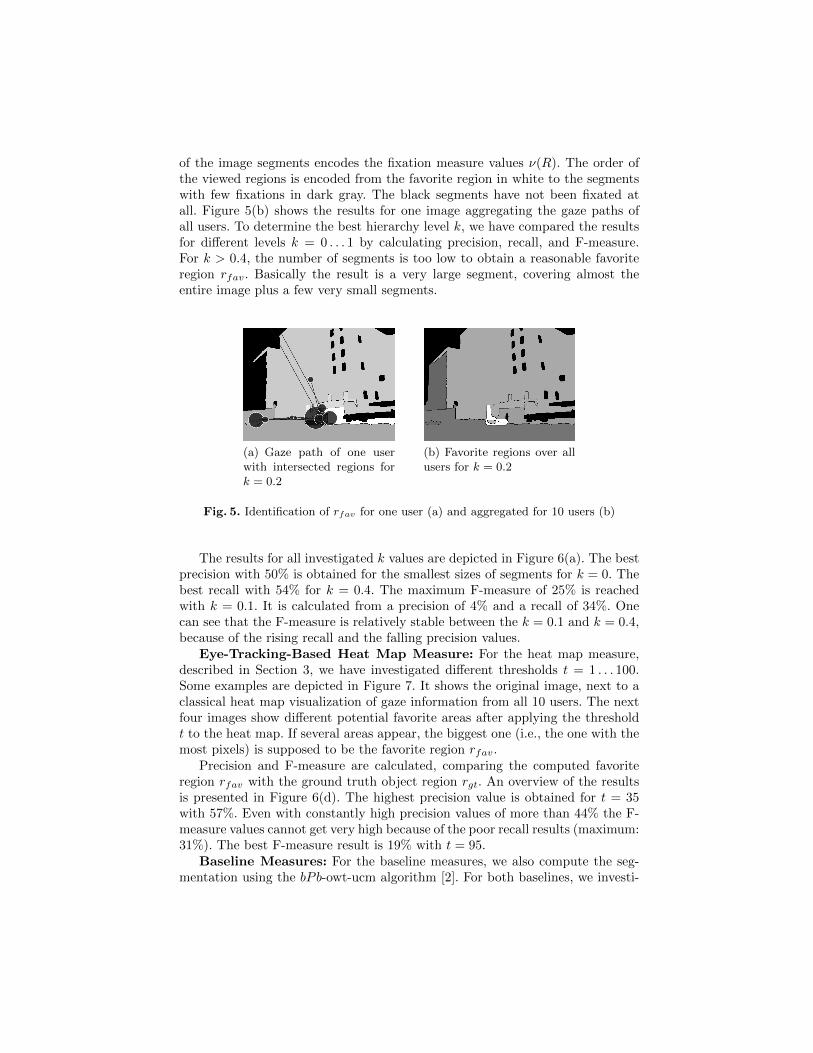
of the image segments encodes the fixation measure values ν(R). The order ofthe viewed regions is encoded from the favorite region in white to the segmentswith few fixations in dark gray. The black segments have not been fixated atall. Figure 5(b) shows the results for one image aggregating the gaze paths ofall users. To determine the best hierarchy level k, we have compared the resultsfor different levels k = 0 . . . 1 by calculating precision, recall, and F-measure.For k > 0.4, the number of segments is too low to obtain a reasonable favoriteregion rfav. Basically the result is a very large segment, covering almost theentire image plus a few very small segments.
(a) Gaze path of one userwith intersected regions fork = 0.2
(b) Favorite regions over allusers for k = 0.2
Fig. 5. Identification of rfav for one user (a) and aggregated for 10 users (b)
The results for all investigated k values are depicted in Figure 6(a). The bestprecision with 50% is obtained for the smallest sizes of segments for k = 0. Thebest recall with 54% for k = 0.4. The maximum F-measure of 25% is reachedwith k = 0.1. It is calculated from a precision of 4% and a recall of 34%. Onecan see that the F-measure is relatively stable between the k = 0.1 and k = 0.4,because of the rising recall and the falling precision values.
Eye-Tracking-Based Heat Map Measure: For the heat map measure,described in Section 3, we have investigated different thresholds t = 1 . . . 100.Some examples are depicted in Figure 7. It shows the original image, next to aclassical heat map visualization of gaze information from all 10 users. The nextfour images show different potential favorite areas after applying the thresholdt to the heat map. If several areas appear, the biggest one (i.e., the one with themost pixels) is supposed to be the favorite region rfav.
Precision and F-measure are calculated, comparing the computed favoriteregion rfav with the ground truth object region rgt. An overview of the resultsis presented in Figure 6(d). The highest precision value is obtained for t = 35with 57%. Even with constantly high precision values of more than 44% the F-measure values cannot get very high because of the poor recall results (maximum:31%). The best F-measure result is 19% with t = 95.
Baseline Measures: For the baseline measures, we also compute the seg-mentation using the bPb-owt-ucm algorithm [2]. For both baselines, we investi-
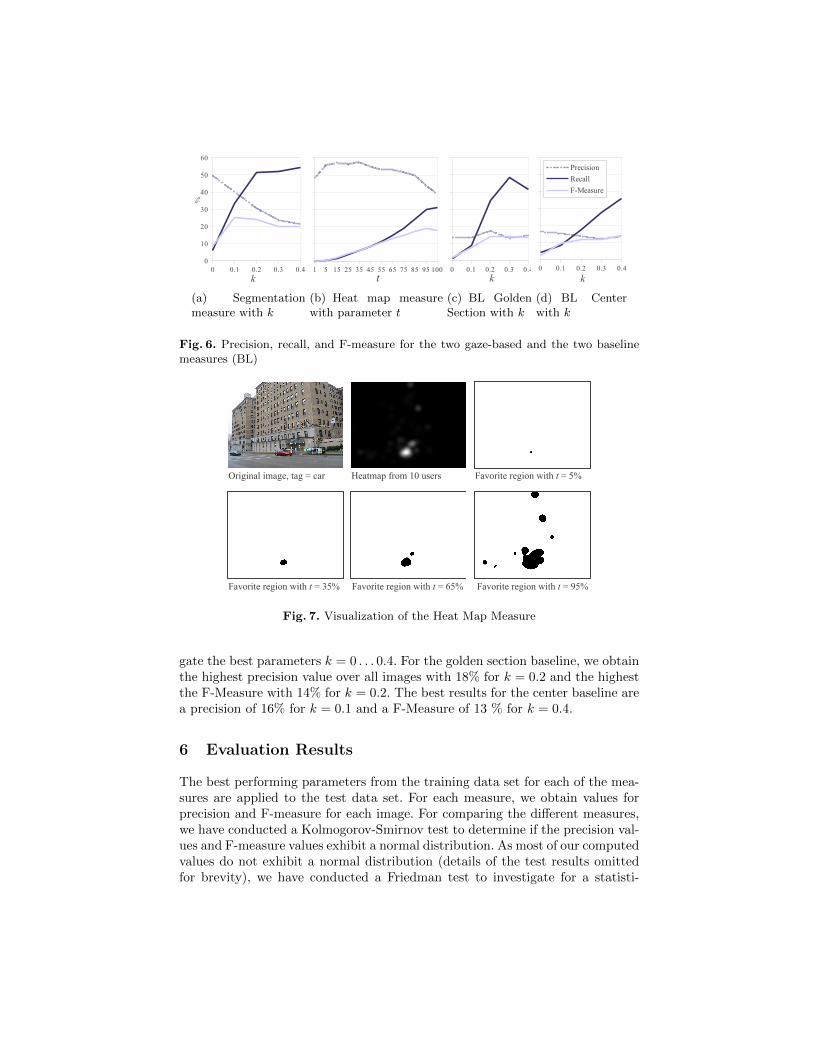
(a) Segmentationmeasure with k
(b) Heat map measurewith parameter t
(c) BL GoldenSection with k
(d) BL Centerwith k
Fig. 6. Precision, recall, and F-measure for the two gaze-based and the two baselinemeasures (BL)
Fig. 7. Visualization of the Heat Map Measure
gate the best parameters k = 0 . . . 0.4. For the golden section baseline, we obtainthe highest precision value over all images with 18% for k = 0.2 and the highestthe F-Measure with 14% for k = 0.2. The best results for the center baseline area precision of 16% for k = 0.1 and a F-Measure of 13 % for k = 0.4.
6 Evaluation Results
The best performing parameters from the training data set for each of the mea-sures are applied to the test data set. For each measure, we obtain values forprecision and F-measure for each image. For comparing the different measures,we have conducted a Kolmogorov-Smirnov test to determine if the precision val-ues and F-measure values exhibit a normal distribution. As most of our computedvalues do not exhibit a normal distribution (details of the test results omittedfor brevity), we have conducted a Friedman test to investigate for a statisti-
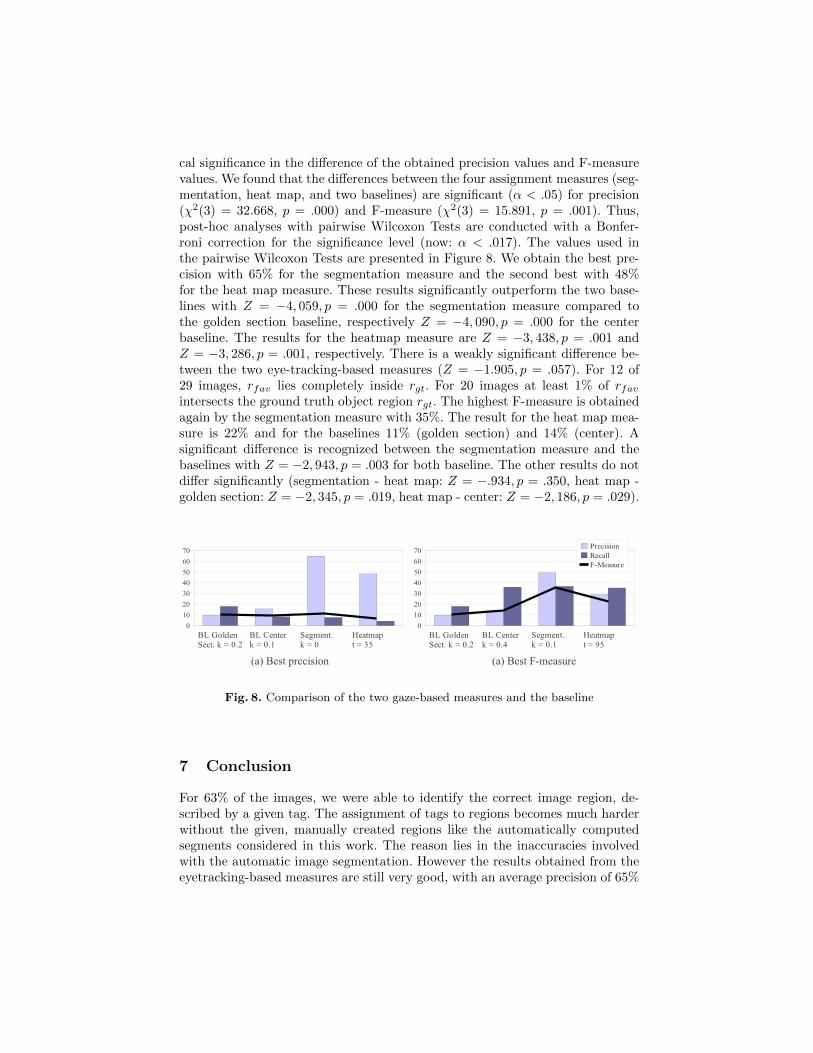
cal significance in the difference of the obtained precision values and F-measurevalues. We found that the differences between the four assignment measures (seg-mentation, heat map, and two baselines) are significant (α < .05) for precision(χ2(3) = 32.668, p = .000) and F-measure (χ2(3) = 15.891, p = .001). Thus,post-hoc analyses with pairwise Wilcoxon Tests are conducted with a Bonfer-roni correction for the significance level (now: α < .017). The values used inthe pairwise Wilcoxon Tests are presented in Figure 8. We obtain the best pre-cision with 65% for the segmentation measure and the second best with 48%for the heat map measure. These results significantly outperform the two base-lines with Z = −4, 059, p = .000 for the segmentation measure compared tothe golden section baseline, respectively Z = −4, 090, p = .000 for the centerbaseline. The results for the heatmap measure are Z = −3, 438, p = .001 andZ = −3, 286, p = .001, respectively. There is a weakly significant difference be-tween the two eye-tracking-based measures (Z = −1.905, p = .057). For 12 of29 images, rfav lies completely inside rgt. For 20 images at least 1% of rfavintersects the ground truth object region rgt. The highest F-measure is obtainedagain by the segmentation measure with 35%. The result for the heat map mea-sure is 22% and for the baselines 11% (golden section) and 14% (center). Asignificant difference is recognized between the segmentation measure and thebaselines with Z = −2, 943, p = .003 for both baseline. The other results do notdiffer significantly (segmentation - heat map: Z = −.934, p = .350, heat map -golden section: Z = −2, 345, p = .019, heat map - center: Z = −2, 186, p = .029).
Fig. 8. Comparison of the two gaze-based measures and the baseline
7 Conclusion
For 63% of the images, we were able to identify the correct image region, de-scribed by a given tag. The assignment of tags to regions becomes much harderwithout the given, manually created regions like the automatically computedsegments considered in this work. The reason lies in the inaccuracies involvedwith the automatic image segmentation. However the results obtained from theeyetracking-based measures are still very good, with an average precision of 65%
over all images for the segmentation-based measure and 48% for the heat-map-based measure. The eyetracking data in this work was gained in a controlledexperiment where users had to identify regions for predefined, given tags (seeSection 4). To relax this constrain, we will conduct in a next step an experimentwith users tagging images using an application in the style of a real online imageannotation tool like Flickr. We have introduced a segmentation measure andheat map measure that both use gaze information as source of information. Theresults show that the new measures perform better in the assignment of tags toimage regions than a baseline approach without gaze information. The segmen-tation measure performs best for both evaluations: precision and F-measure. Thesegmentation measure significantly outperforms the baseline. The segmentationmeasure can easily be adapted to different needs by modifying the parameter kto maximize the precision or F-measure.
References
1. Tobii studio 2.x - user manual, 2010. http://www.tobii.com.2. P. Arbelaez, M. Maire, C. Fowlkes, and J. Malik. Contour detection and hierar-
chical image segmentation. IEEE TPAMI, 33(5):898–916, May 2011.3. J.M. Bartelma. Flycatcher: Fusion of gaze with hierarchical image segmentation for
robust object detection. PhD thesis, Massachusetts Institute of Technology, 2004.4. W.V. Belle, B. Laeng, T. Brennen, et al. Anchoring gaze when categorizing faces’
sex: Evidence from eye-tracking data. Vision research, 49(23):2870–2880, 2009.5. A. Bojko. Informative or misleading? heatmaps deconstructed. Human-Computer
Interaction. New Trends, pages 30–39, 2009.6. K. Essig. Vision-Based Image Retrieval (VBIR)-A New Approach for Natural and
Intuitive Image Retrieval. PhD thesis, 2008.7. M. Freeman. The Photographer’s Eye: Composition and Design for Better Digital
Photos. Focal Press, 2007.8. D.H. Kim and S.H. Yu. A new region filtering and region weighting approach
to relevance feedback in content-based image retrieval. Journal of Systems andSoftware, 81(9):1525–1538, 2008.
9. A. Klami. Inferring task-relevant image regions from gaze data. In Workshop onMachine Learning for Signal Processing. IEEE, 2010.
10. S. Ramanathan, H. Katti, R. Huang, T. Chua, and M. Kankanhalli. Automatedlocalization of affective objects and actions in images via caption text-cum-eye gazeanalysis. In Multimedia, New York, New York, USA, 2009. ACM.
11. B. C Russell, A. Torralba, K. P Murphy, and W. T Freeman. LabelMe: a databaseand web-based tool for image annotation. J. of Comp. Vision, 77(1):157–173, 2008.
12. J. San Agustin, H. Skovsgaard, J.P. Hansen, and D.W. Hansen. Low-cost gazeinteraction: ready to deliver the promises. In CHI, pages 4453–4458. ACM, 2009.
13. A. Santella, M. Agrawala, D. DeCarlo, D. Salesin, and M. Cohen. Gaze-basedinteraction for semi-automatic photo cropping. In CHI, page 780. ACM, 2006.
14. T. Walber, A. Scherp, and S. Staab. Identifying objects in images from analyzingthe users’ gaze movements for provided tags. Advances in Multimedia Modeling,pages 138–148, 2012.
15. A.L. Yarbus. Eye movements and vision. Plenum, 1967.