can two-stage instead of one-stage anaerobic digestion really increase energy recovery from biomass?
TRANSCRIPT
Applied Energy 124 (2014) 335–342
Contents lists available at ScienceDirect
Applied Energy
journal homepage: www.elsevier .com/locate /apenergy
Can two-stage instead of one-stage anaerobic digestion really increaseenergy recovery from biomass?
http://dx.doi.org/10.1016/j.apenergy.2014.03.0240306-2619/� 2014 Elsevier Ltd. All rights reserved.
⇑ Corresponding author. Tel.: +39 0250316543.E-mail address: [email protected] (A. Schievano).
A. Schievano ⇑, A. Tenca, S. Lonati, E. Manzini, F. AdaniGruppo Ricicla – Department of Agricultural Environmental Science (DISAA), Università degli Studi di Milano, Via Celoria, 2, 20133 Milano, Italy
h i g h l i g h t s
� Two-stage anaerobic digestion should be more productive than traditional process.� Energy recoveries (H2 + CH4 vs CH4) were compared through a new method.� Four different substrates at nine different experimental conditions were tested.� Two-stage recovered 8%–43% more energy than one-stage and never significantly less.� Deeper research should be addressed to prove the convenience of two-stage approach.
a r t i c l e i n f o
Article history:Received 25 November 2013Received in revised form 17 February 2014Accepted 14 March 2014
Keywords:Two-stage anaerobic digestionBio-hydrogenBio-methaneBiomassBioenergy
a b s t r a c t
The supremacy of two-stage on traditional one-stage anaerobic digestion (AD), in terms of overall energyrecovery (ER) from biomass has often been proved. However, the process conditions ensuring this result,as well as the reasons for higher efficiency, have always been unclear. In this work, a new standardizedapproach is proposed: optimization at lab-scale of both hydrogen and methane generation processesallowed comparing the maximum potential ER of both two-stage (as H2 + CH4) and one-stage AD(as CH4). Relatively high bio-hydrogen yields were obtained testing four different organic substrates(ER of 1–1.6 MJ kg�1
VS-added). Biomethane generation resulted in ER in the range of 9–19 MJ kg�1VS-added.,
similarly for two-stage and one-stage systems. The overall ER resulted in significantly higher (8%–43%)for the two-stage in the large majority of experimental conditions and never significantly lower. Thesepreliminary results should drive further research to better understand the conditions that can drive thetwo-stage AD to higher performance.
� 2014 Elsevier Ltd. All rights reserved.
1. Introduction
The two-stage anaerobic digestion (AD) process has often beenreported as a viable way to produce bio-hydrogen and bio-meth-ane from a wide range of organic materials [1,2]. In the last decade,several studies were published on this topic and many authorsreported different applications of the two-stage AD, with differentorganic substrates and different process designs [3–5].
Generally, the phase separation of hydrolysis/fermentationfrom methanogenesis in different reaction environments has beenproposed as a strategy to increase overall process performances,in terms of stability, degradation efficiencies in both fermentationand methanogenesis phases and thereby in terms of overallenergy recovery (ER) from biomass [6]. A controlled acidogenic
fermentation, that allow efficient bio-hydrogen production, hasbeen considered the best pathway to pretreat raw biomass andenhance methanogenic process.
According to various authors, efficient bio-hydrogen productionand volatile fatty acids (VFA) liberation in the liquid during acido-genic phase would at the same time ensure energy recovery as H2
and favor CH4 production from VFA in the methanogenic reactor[7]. This with relatively negligible variation of plant structureand cost, as soon as the first stage is normally a small additionaldigester (10 times shorter retention time compared to the secondstage) [7].
On the other hand, literature has seldom given general andexhaustive explanations to this thesis, often limiting efforts on par-ticular case studies, with particular substrate types and operationalconditions.
In particular, few studies took into account the overall potentialER of two-stage AD, compared to single-stage AD, focusing on the

336 A. Schievano et al. / Applied Energy 124 (2014) 335–342
reasons and the conditions for actual enhancement of ER by phaseseparation. The most important contributions to this topic camefrom Liu et al. [8], Pakarinen et al. [9] and Luo et al. [6], that dem-onstrated the supremacy (from 20% to 60% higher ER) of two-stageAD at both thermophilic and mesophilic conditions. The reasonsfor success of two-stage system were associated, generally, to pro-cess advantages, as higher efficiency in converting VFAs into meth-ane in the second stage [8]. Pakarinen et al. [9] obtained highadvantage from two-stage AD and found significantly higherhydrolysis efficiency after the hydrogen production step, with in-creased soluble organic matter and VFA production through fer-mentation, allowing higher productivity in the methanogenicphase. Luo et al. [6] were more precise and associated the higherER of the two-stage to higher performances in the second-stage(methanogenesis) in degradation kinetics and to the effect of min-imizing the loss of relatively ‘‘fresh feed’’ out of the reactor due to‘‘short-circuiting’’, occurring in single-stage fully mixed reactors.
More recently, Schievano et al. [10] observed two-stage vs sin-gle-stage AD in thermophilic continuously stirred tank reactors(CSTR) fed with a mix of fruit/vegetable waste and swine manure,focusing on the overall ER and on biological process efficiencies. Inthis case, equal ER resulted from the two AD systems, even if themethanogenic reactor in the two-stage system showed residualun-degraded organic compounds (VFA were 10 times higher thanin the single-stage reactor) and thereby an unexpressed potential[10]. This means that, in this case, if the methanogenesis in thetwo-stage was not slightly inhibited, the two-stage would haveshown higher ER, as compared to the single-stage. This might beobtained simply by a slight increase of the retention times and/or by improving the methanogenic activity in the second stage.
In this work, a new approach in investigating this topic is pro-posed. Both bio-hydrogen and bio-methane productions shouldbe always optimized to compare the two AD systems. For this rea-son, optimization of bio-hydrogen production process was carriedout for four different organic mixtures and the biochemical meth-ane potential (BMP) standard tests were used to obtain optimizedER from methanogenesis.
2. Materials and methods
To verify the energy recovery, two-stage and single-stage ADwere simulated in lab-scale fermenters. The test was run on fourdifferent organic mixtures of biomass, diluted with liquid swinemanure (SM) to the desired organic matter concentration, mea-sured as volatile solids (VS) per g of wet weight (ww). Indeed,SM is a very common liquid material used in biogas plants and pro-vides both nutrients and buffer capacity to AD environments. Inprevious studies dealing with optimization of anaerobic darkfermentation, SM was already used as co-substrate to efficientlyproduce bio-hydrogen [11]. The feeding substrates were 4 organicmaterials, usually available in full-scale agricultural AD facilities:(a) maize silage (MS), (b) waste rice flour (RF), (c) olive pomace(OP) and (d) waste fruit/vegetable (FV).
The first-stage was run (as reported by Tenca et al. [11]) insemi-continuous reactors, fed twice a day; the optimized H2 pro-duction were selected by varying the feeding conditions in twovariables: (i) organic matter concentration (OMC) and (ii) hydraulicretention time (HRT). The pre-digested materials, produced in opti-mized conditions, underwent the methanogenic phase (2nd stage),i.e. incubated in batch reactors optimized for methanogenesis. Thesingle-stage AD was run in parallel in batch reactors fed with theuntreated organic mixtures. The energy recovered from thedouble-stage (H2 + CH4) and the single-stage (CH4) AD systemswere compared to look for possible increase in productivity inthe double-stage concept. All tests were run in triplicate.
2.1. Hydrogenic process optimization (1st stage)
The hydrogenic phase of two-stage AD system was run in semi-continuously operated reactors of 500 mL capacity, fed 2-times aday, in thermophilic conditions (55 ± 1 �C), as reported in detailin a recent work by Tenca et al. [11]. A Box–Wilson centralcomposite design (CCD) [12] was applied to study the effect oftwo operating parameters (the controllable factors: OMC andHRT) on biohydrogen production (the experimental response),and therefore to find the optimal region in which to operate thefermentation.
In a CCD, the experimental values of each controllable factor aredefined to be uniformly distributed around a centerpoint, accord-ing to factorial design levels coded from �1 to +1. These levelsare then augmented with star points that, in a two-factor CCD,are axially placed at a coded distance of �p2 and +
p2 from the
center of the design. As a result, OMC and HRT were investigatedat five levels, coded as (�p2,�1, 0, +1, +
p2). The level code reflects
the step change in the actual value chosen for the two operatingparameters.
All the evaluated levels were arranged in nine different treat-ments, hereafter called experimental conditions (EC), correspond-ing to nine combinations of OMC with HRT values. Eachtreatment consisted of three replicated assays. All biogas produc-tion and ER data and all chemical characterization data werereported as mean and standard deviation of the three replicates.
For all substrates, except for FV, the selected ranges for factorswere 25–65 gVS kg�1
ww and 1–4 d for OMC and HRT, respectively,with a design centerpoint of (45 gVS kg�1
ww; 2.5 d). The resultinginvestigated range for OLR was from 8.9 to 45 gVS L�1
dig. d�1. Accord-ing to results of experiments conducted in previous work with asimilar substrate [11], for FV the selected factors ranges were27–72 gVS kg�1
ww and 1–3 d for OMC and HRT, respectively, center-point of the design being (50 gVS kg�1
ww; 2 d). The correspondingrange for the organic loading rate is approximately from 12.4 to52.8 gVS L�1 d�1. All the coded levels and corresponding values ofoperating variables considered in the experimental design aresummarized in Table 1.
All reactors were initially inoculated with a digested materialcollected in a 10 L laboratory-scale reactor, digesting a mixture ofthe four organic substrates used in this study. The digester hadbeen continuously operating under thermophilic conditions(55 �C) for approximately 20 days, prior to the beginning of thisstudy, showing a stable production of biohydrogen. The TS andVS concentrations and the pH of the inoculum resulted in36.1 ± 4.3 g kg�1
ww, 29.4 ± 3.6 g kg�1ww and 5.65 ± 0.23, respectively.
The test was prolonged for almost 10–15 days, till the produc-tion of biogas conditions was stable. The last 5 days of steady-statestable production were taken into account for data elaboration, forsampling the pre-digested materials and for analyses. This in orderto avoid the start-up phase and any unstable/transitory condition.Biohydrogen production was calculated from volume measure-ments of gas accumulated in sample bags and by measuring itshydrogen content.
2.2. Methanogenic process (2nd stage and single-stage)
Optimized methanogenic process was applied to raw materials(simulating one-stage process) and to treated materials (simulat-ing the second stage process). Only the most productive EC werechosen, i.e. those reaching hydrogen yield (Sdm3H2 kg�1
VS) above30% of the most productive EC for each biomass type. Treated mate-rials were sampled 4 different times from the hydrogenic reactors atsteady state and mixed together in one single sample. Methanogenicassays were performed in triplicate for each EC.

Table 1Experimental design of the first stage (hydrogenic) loading in two variables (OMC vsHRT) and theoretical organic loading rates (OLR) for the organic mixtures studied.
Sample EC OMC (gVS kg�1ww) HRT (d) OLR (gVS L�1 d�1)
MS + SM 1 0 45.0 �p2 1 45.02 �1 31.0 �1 1.5 20.73 1 59.0 �1 1.5 39.34 �p2 25.2 0 2.5 10.15 0 45.0 0 2.5 18.06
p2 64.8 0 2.5 25.9
7 �1 31.0 1 3.5 8.98 1 59.0 1 3.5 16.99 0 45.0
p2 4 11.3
RF + SM 1 0 45.0 �p2 1 45.02 �1 31.0 �1 1.5 20.73 1 59.0 �1 1.5 39.34 �p2 25.2 0 2.5 10.15 0 45.0 0 2.5 18.06
p2 64.8 0 2.5 25.9
7 �1 31.0 1 3.5 8.98 1 59.0 1 3.5 16.99 0 45.0
p2 4 11.3
OP + SM 1 0 45.0 �p2 1 45.02 �1 31.0 �1 1.5 20.73 1 59.0 �1 1.5 39.34 �p2 25.2 0 2.5 10.15 0 45.0 0 2.5 18.06
p2 64.8 0 2.5 25.9
7 �1 31.0 1 3.5 8.98 1 59.0 1 3.5 16.99 0 45.0
p2 4 11.3
FV + SM 1 0 50.0 �p2 1 50.02 �1 34.0 �1 1.25 27.23 1 66.0 �1 1.25 52.84 �p2 27.4 0 2 13.75 0 50.0 0 2 25.06
p2 72.6 0 2 36.3
7 �1 34.0 1 2.75 12.48 1 66.0 1 2.75 24.09 0 50.0
p2 3 16.7
A. Schievano et al. / Applied Energy 124 (2014) 335–342 337
The optimized methanogenic process was performed in batchthermophilic reactors of 500 mL capacity. This test was adaptedfrom standard procedures of bio-chemical methane potential(BMP) [13], which ensures optimized conditions for methanogenicactivity. In brief, 300 mL of operating volume were used, withapproximately 200 mL of headspace in the batch. The samples oftreated (for double-stage AD) or raw (for single stage AD) substratewere added to inoculum at a ratio of 1:4 (substrate:inoculum) onwet weight base. The samples were homogenized and used fresh(without drying) in the methanogenic test, to avoid VFA evapora-tion. The inoculum was a digested slurry (around 45 gTS kg�1
ww)sampled in a thermophilic AD facility operating in the agriculturalcontext around Milan, Italy. The digestate was filtered through astainless steel sieve (US Mesh No. 10, sieve opening of 2.0 mm)and incubated for 15 days before the beginning of the test. Aftersample addition, the batch reactors were sealed with teflon hermeticcaps, flushed with a N2 atmosphere and monitored for biogasproduction (by withdrawing extra-pressure gas with a tight syringe)till plateau was reached, approximately after 60 days. Bio-methaneproduction was calculated from volume measurements of gas (with-drawn by tight syringe till equilibrium pressure) and by measuringits methane content.
2.3. Measurements and analytical methods
Feeding substrates and treated substrates were characterized interms of TS and VS (only for feeding substrates), chemical oxygendemand (COD), pH, total volatile fatty acids (TVFA) and total
alkalinity (TA) content, according to Standard Methods [14]. Allanalyses were performed on 4 different samples and the valueswere expressed as average and standard deviation.
Biogas composition was determined, considering only H2, CH4
and CO2, with a gas chromatograph (Agilent, Micro GC 3000A)equipped with two thermal conductivity detectors and two differ-ent columns. Hydrogen and methane were analyzed using aMolesieve/5A Plot column, with nitrogen as the carrier gas at aflow rate of 30 mL/min. Carbon dioxide content was analyzed usinga different column (Alltech HP-Plot U), with helium as the carriergas at a flow rate of 30 mL/min. The operational temperature ofthe injection port was 100 �C, while those of Molesieve/5A and PlotU columns were maintained at 100 and 55 �C, respectively.
2.4. Total energy recovery calculation
Biohydrogen production rate was measured daily for each reac-tor, and for clarity, the values were normalized to the fermentationbroth volume and then expressed as Sdm3H2 L�1 d�1.
Biohydrogen yield was calculated as the specific productionper VS mass added in each treatment and then expressed asSdm3H2 kg�1
VS_added. Cumulated bio-methane production measuredon each batch reactor was also expressed on kgVS_added to the ADsystem as a whole, i.e. the kgVS added to the hydrogenic stage pereach kg of untreated substrate loaded, both in the double- and inthe single-stage AD systems.
The biohydrogen and bio-methane yields (as Sdm3H2/CH4 kg�1
VS_added) were transformed into total energy recovery (ER,as MJ kg�1
VS_added), by considering H2 and CH4 superior heat of com-bustion (12.74 MJ/Sm3 and 35.16 MJ/Sm3, respectively). The sum ofthe ER from H2 and CH4 represented the total ER from the two-stageAD system, to be compared to the ER obtained by the sole ER of themethane produced in the single-stage AD. ANOVA (Tukey test) wasused to compare mean values and to assess the significance of thedifferences between mean values.
3. Results
3.1. Biohydrogen productions and yields
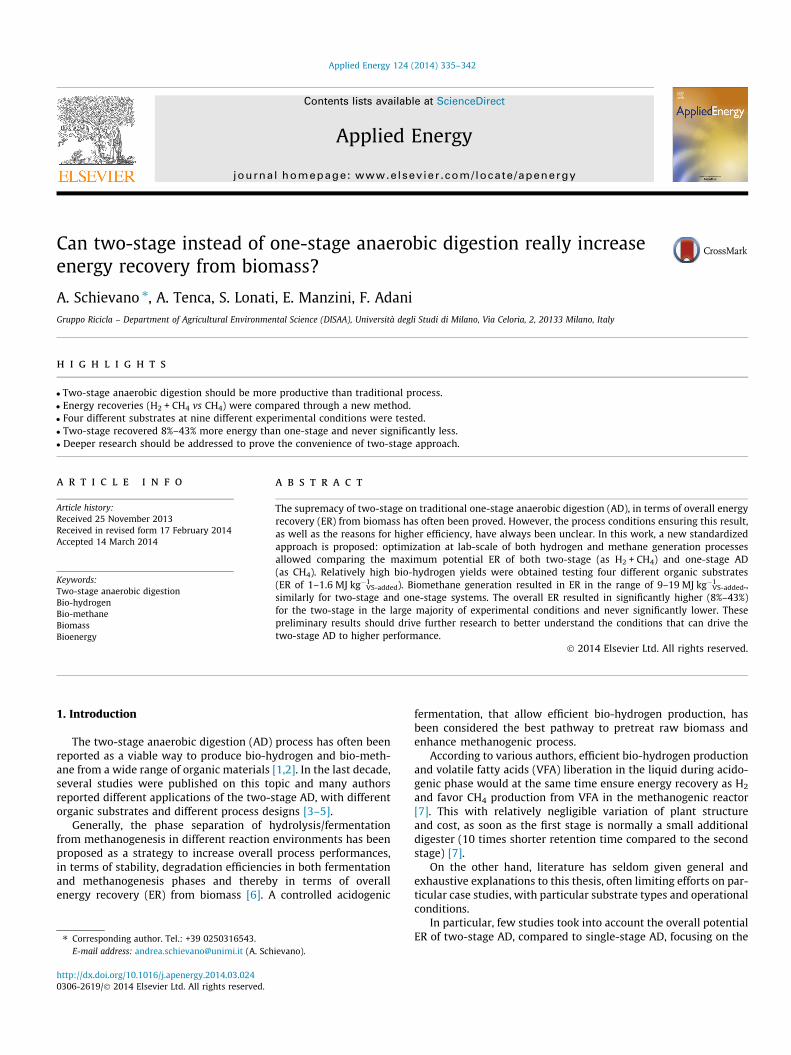
All EC were plotted in a chart (Fig. 1a) to visualize the experi-mental set and the variability (as standard deviation of triple sam-ples) of OMC, during the feeding period. Additionally, the OLRsimposed on the reactors were plotted in Fig. 1b, to observe that,for the same biomass, each different EC corresponds to a differentOLR. Bio-hydrogen productions obtained in all the EC considered inthe study are summarized in Table 2. Bio-hydrogen productionrates (per unit of digester volume) resulted in higher than5 Sdm3 L�1
dig. d�1 for RF, in EC1 and EC3; contrarily, almost no hydro-gen was produced for OP, in every EC. MS and FV reached as best3.66 ± 0.34 and 3.24 ± 0.57 Sdm3 L�1
dig. d�1, respectively. For all sub-strates, low or no bio-hydrogen production was obtained in all theassays fed with a substrate having VS concentration below 30 gVS
kg�1ww (experimental condition 4). Hydrogen concentration in biogas
was in the range of 30–50% v/v for the most productive EC, whilelower concentrations were found for the less productive EC (Table 2).
The best biohydrogen yields (120 ± 6, 128 ± 12 and 124 ±22 Sdm3H2 kg�1
VS-added) were obtained at EC2, EC1 and EC5 for MS,RF and FV, respectively (Table 2). They resulted almost equivalent,even if RF showed similar yields also in many other EC (EC3, EC5,EC8 and EC9), while MS and FV only in two EC (EC7/ EC9 for MSand EC8/EC9 for FV). On the other hand, hydrogen yield did notachieve at least 30% of the maximum value obtained for each bio-mass in EC4/EC6, EC2/EC4/EC7 and EC1/EC2/EC3/EC7 for MS, RFand FV, respectively (Table 2). Interestingly, the best H2 productions
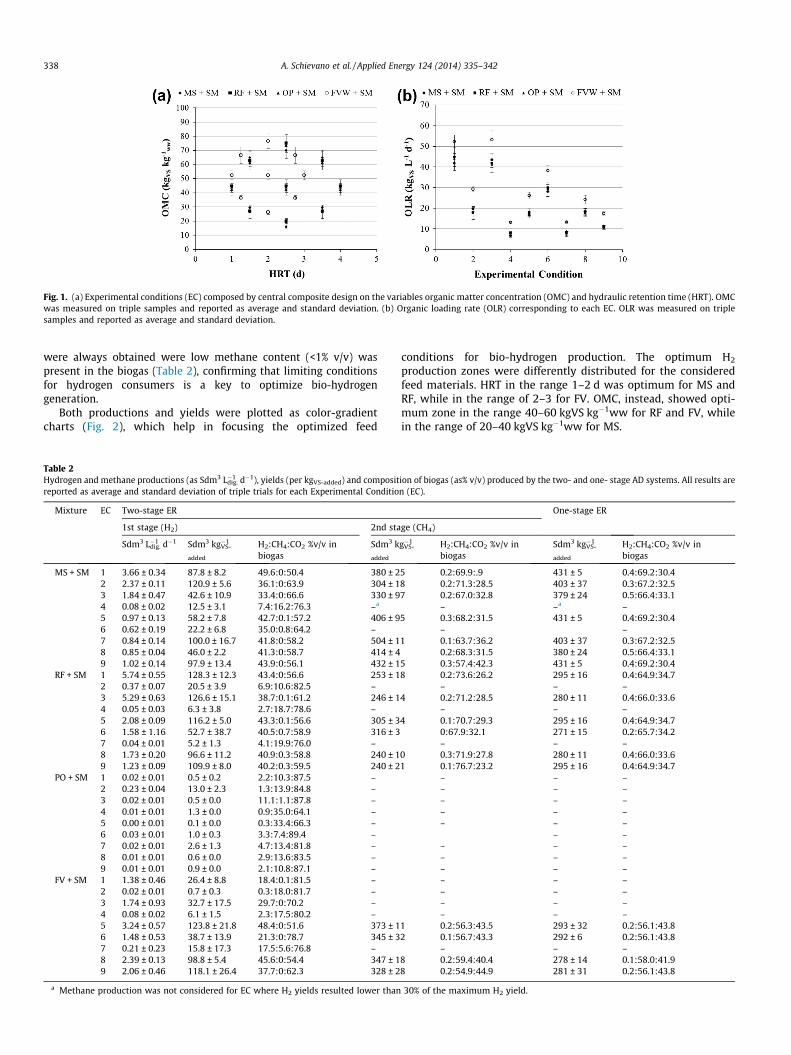
Fig. 1. (a) Experimental conditions (EC) composed by central composite design on the variables organic matter concentration (OMC) and hydraulic retention time (HRT). OMCwas measured on triple samples and reported as average and standard deviation. (b) Organic loading rate (OLR) corresponding to each EC. OLR was measured on triplesamples and reported as average and standard deviation.
338 A. Schievano et al. / Applied Energy 124 (2014) 335–342
were always obtained were low methane content (<1% v/v) waspresent in the biogas (Table 2), confirming that limiting conditionsfor hydrogen consumers is a key to optimize bio-hydrogengeneration.
Both productions and yields were plotted as color-gradientcharts (Fig. 2), which help in focusing the optimized feed
Table 2Hydrogen and methane productions (as Sdm3 L�1
dig. d�1), yields (per kgVS-added) and compositreported as average and standard deviation of triple trials for each Experimental Conditio
Mixture EC Two-stage ER
1st stage (H2) 2nd sta
Sdm3 L�1dig. d�1 Sdm3 kg�1
VS-
added
H2:CH4:CO2 %v/v inbiogas
Sdm3 kadded
MS + SM 1 3.66 ± 0.34 87.8 ± 8.2 49.6:0:50.4 380 ± 22 2.37 ± 0.11 120.9 ± 5.6 36.1:0:63.9 304 ± 13 1.84 ± 0.47 42.6 ± 10.9 33.4:0:66.6 330 ± 94 0.08 ± 0.02 12.5 ± 3.1 7.4:16.2:76.3 –a
5 0.97 ± 0.13 58.2 ± 7.8 42.7:0.1:57.2 406 ± 96 0.62 ± 0.19 22.2 ± 6.8 35.0:0.8:64.2 –7 0.84 ± 0.14 100.0 ± 16.7 41.8:0:58.2 504 ± 18 0.85 ± 0.04 46.0 ± 2.2 41.3:0:58.7 414 ± 49 1.02 ± 0.14 97.9 ± 13.4 43.9:0:56.1 432 ± 1
RF + SM 1 5.74 ± 0.55 128.3 ± 12.3 43.4:0:56.6 253 ± 12 0.37 ± 0.07 20.5 ± 3.9 6.9:10.6:82.5 –3 5.29 ± 0.63 126.6 ± 15.1 38.7:0.1:61.2 246 ± 14 0.05 ± 0.03 6.3 ± 3.8 2.7:18.7:78.6 –5 2.08 ± 0.09 116.2 ± 5.0 43.3:0.1:56.6 305 ± 36 1.58 ± 1.16 52.7 ± 38.7 40.5:0.7:58.9 316 ± 37 0.04 ± 0.01 5.2 ± 1.3 4.1:19.9:76.0 –8 1.73 ± 0.20 96.6 ± 11.2 40.9:0.3:58.8 240 ± 19 1.23 ± 0.09 109.9 ± 8.0 40.2:0.3:59.5 240 ± 2
PO + SM 1 0.02 ± 0.01 0.5 ± 0.2 2.2:10.3:87.5 –2 0.23 ± 0.04 13.0 ± 2.3 1.3:13.9:84.8 –3 0.02 ± 0.01 0.5 ± 0.0 11.1:1.1:87.8 –4 0.01 ± 0.01 1.3 ± 0.0 0.9:35.0:64.1 –5 0.00 ± 0.01 0.1 ± 0.0 0.3:33.4:66.3 –6 0.03 ± 0.01 1.0 ± 0.3 3.3:7.4:89.4 –7 0.02 ± 0.01 2.6 ± 1.3 4.7:13.4:81.8 –8 0.01 ± 0.01 0.6 ± 0.0 2.9:13.6:83.5 –9 0.01 ± 0.01 0.9 ± 0.0 2.1:10.8:87.1 –
FV + SM 1 1.38 ± 0.46 26.4 ± 8.8 18.4:0.1:81.5 –2 0.02 ± 0.01 0.7 ± 0.3 0.3:18.0:81.7 –3 1.74 ± 0.93 32.7 ± 17.5 29.7:0:70.2 –4 0.08 ± 0.02 6.1 ± 1.5 2.3:17.5:80.2 –5 3.24 ± 0.57 123.8 ± 21.8 48.4:0:51.6 373 ± 16 1.48 ± 0.53 38.7 ± 13.9 21.3:0:78.7 345 ± 37 0.21 ± 0.23 15.8 ± 17.3 17.5:5.6:76.8 –8 2.39 ± 0.13 98.8 ± 5.4 45.6:0:54.4 347 ± 19 2.06 ± 0.46 118.1 ± 26.4 37.7:0:62.3 328 ± 2
a Methane production was not considered for EC where H2 yields resulted lower than
conditions for bio-hydrogen production. The optimum H2
production zones were differently distributed for the consideredfeed materials. HRT in the range 1–2 d was optimum for MS andRF, while in the range of 2–3 for FV. OMC, instead, showed opti-mum zone in the range 40–60 kgVS kg�1ww for RF and FV, whilein the range of 20–40 kgVS kg�1ww for MS.
ion of biogas (as% v/v) produced by the two- and one- stage AD systems. All results aren (EC).
One-stage ER
ge (CH4)
g�1VS- H2:CH4:CO2 %v/v in
biogasSdm3 kg�1
VS-
added
H2:CH4:CO2 %v/v inbiogas
5 0.2:69.9:.9 431 ± 5 0.4:69.2:30.48 0.2:71.3:28.5 403 ± 37 0.3:67.2:32.57 0.2:67.0:32.8 379 ± 24 0.5:66.4:33.1
– –a –5 0.3:68.2:31.5 431 ± 5 0.4:69.2:30.4
– –1 0.1:63.7:36.2 403 ± 37 0.3:67.2:32.5
0.2:68.3:31.5 380 ± 24 0.5:66.4:33.15 0.3:57.4:42.3 431 ± 5 0.4:69.2:30.48 0.2:73.6:26.2 295 ± 16 0.4:64.9:34.7
– – –4 0.2:71.2:28.5 280 ± 11 0.4:66.0:33.6
– – –4 0.1:70.7:29.3 295 ± 16 0.4:64.9:34.7
0:67.9:32.1 271 ± 15 0.2:65.7:34.2– – –
0 0.3:71.9:27.8 280 ± 11 0.4:66.0:33.61 0.1:76.7:23.2 295 ± 16 0.4:64.9:34.7
– – –– – –– – –– – –– – –
– –– – –– – –– – –– – –– – –– – –– – –
1 0.2:56.3:43.5 293 ± 32 0.2:56.1:43.82 0.1:56.7:43.3 292 ± 6 0.2:56.1:43.8
– – –8 0.2:59.4:40.4 278 ± 14 0.1:58.0:41.98 0.2:54.9:44.9 281 ± 31 0.2:56.1:43.8
30% of the maximum H2 yield.

Fig. 2. Interpolation (color-gradient) of H2 yield within the considered areas of EC. (For interpretation of the references to colour in this figure legend, the reader is referred tothe web version of this article.)
A. Schievano et al. / Applied Energy 124 (2014) 335–342 339
3.2. Chemical characterization of raw and treated materials
The chemical characterization (TS, VS, COD, pH, VFA and TA) ofthe considered substrates is reported in Table 3, regarding all EC.MS and FV showed higher VFA concentrations compared to RFand OP. FV showed also lower TA and thereby higher VFA/TA ratios(Table 3). Generally, slight differences in pH were proportional tothe dilution of the biomass with SM, depending on the EC.
More interestingly, Table 4 reports the characterization of thetreated materials. Generally, a slight reduction of COD wasobserved, as expected, after fermentation process in all EC. pHdiminished in the range of 4.5–5.3 for those EC that showed highH2 productivities (Table 4). When pH in the digester was higherthan 5.3, H2 productivity dropped below 20 Sdm3H2 kg�1
VS-added
(Table 4). In parallel, VFA/TA ratio in the range of 1–2.2 correspondedto high H2 yields, while for low productive EC, VFA/TA ratio wasalways found in the range of 0.3–1.3 (Table 4). Contrarily, VFA con-centration alone was not clearly related to productive EC. In manylow-productive EC, high VFA concentrations were measured (up to12 gacetate kg�1
ww, Table 4), as well as in some highly yielding EC,VFAs were found below 6 gacetate kg�1
ww (Table 4). This means thatprobably acid fermentations took place in any case, but only partic-ular conditions led to the right metabolic pathways that optimize H2
generation. However, OP showed relatively low VFAs concentrationsafter fermentation in all EC (Table 4), indicating that the cause of thelow hydrogen productivity, in this case, was probably linked to a lackof easily fermentable organic substances in the biomass.
3.3. Methanogenic process yields
Optimized methane production was measured in batch reactorsfor raw (single-stage) and treated materials (2nd stage), excluding
those EC that produced less H2 than 30% of the best performing EC,in terms of H2-yield (Sdm3H2 kg�1
VS-added). OP was completely ex-cluded from the test, as soon as the fermentation stage gave nearlynull H2 production, in all EC.
Methane yields resulted in the range of 380–500Sdm3CH4 kg�1
VS-added for MS, 240–320 Sdm3CH4 kg�1VS-added for RF
and 280–370 Sdm3CH4 kg�1VS-added for FV (Table 2). Average methane
concentrations in the biogas were always relatively high for bothsecond-stage and single-stage processes (Table 2). FV showed lowerCH4 contents, as compared to the other two substrates (55–59% v/v),while for MS and RF, methane concentrations ranges were 57–71%and 65–77% v/v, respectively (Table 2). Negligible differences inCH4 concentrations were observed between second-stage and sin-gle-stage methanogenic production, for the same biomass (Table 2).
3.4. Energy recovery
Hydrogen and methane produced by the two-stage AD process(only the selected EC) were compared to the methane produced bythe single-stage process, in terms of total energy recovered (Table5). H2 productions in the 1st-stage ranged from 0.5 to 1.6 MJkg�1
VS-added, corresponding to 4%–16% of the whole two-stage AD sys-tem production (Table 5). The 2nd stage produced energy in theranges of 10–18, 8–11 and 11–14 MJ kg�1
VS-added for MS, RF and FV,respectively. The one-stage process generally produced a similaramount of energy, as compared to the 2nd stage. For this reason,when both 1st and 2nd stage were considered as sum (H2 + CH4)for the total ER of the two-stage system, in the majority of the cases,the two-stage resulted as more productive than the one-stage(Table 5).
ANOVA was performed on two-stage ER vs one-stage ER, to lookfor the significant differences (p < 0.05, n = 3). The only case that
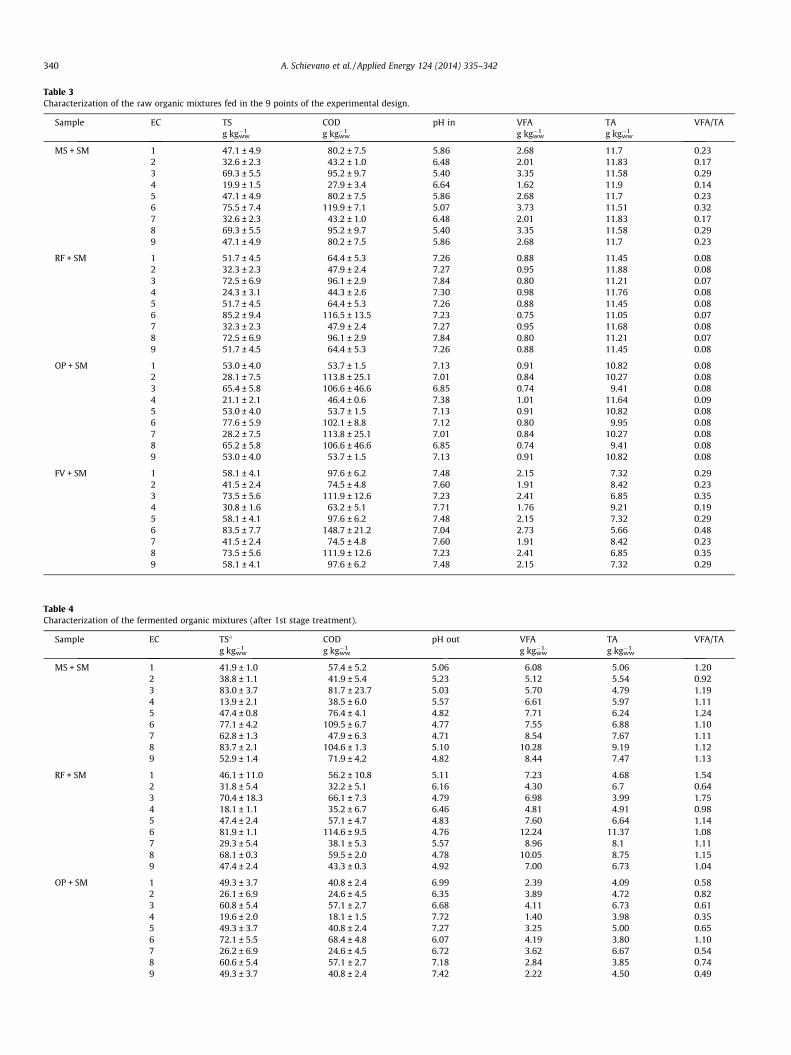
Table 3Characterization of the raw organic mixtures fed in the 9 points of the experimental design.
Sample EC TS COD pH in VFA TA VFA/TAg kg�1
ww g kg�1ww g kg�1
ww g kg�1ww
MS + SM 1 47.1 ± 4.9 80.2 ± 7.5 5.86 2.68 11.7 0.232 32.6 ± 2.3 43.2 ± 1.0 6.48 2.01 11.83 0.173 69.3 ± 5.5 95.2 ± 9.7 5.40 3.35 11.58 0.294 19.9 ± 1.5 27.9 ± 3.4 6.64 1.62 11.9 0.145 47.1 ± 4.9 80.2 ± 7.5 5.86 2.68 11.7 0.236 75.5 ± 7.4 119.9 ± 7.1 5.07 3.73 11.51 0.327 32.6 ± 2.3 43.2 ± 1.0 6.48 2.01 11.83 0.178 69.3 ± 5.5 95.2 ± 9.7 5.40 3.35 11.58 0.299 47.1 ± 4.9 80.2 ± 7.5 5.86 2.68 11.7 0.23
RF + SM 1 51.7 ± 4.5 64.4 ± 5.3 7.26 0.88 11.45 0.082 32.3 ± 2.3 47.9 ± 2.4 7.27 0.95 11.88 0.083 72.5 ± 6.9 96.1 ± 2.9 7.84 0.80 11.21 0.074 24.3 ± 3.1 44.3 ± 2.6 7.30 0.98 11.76 0.085 51.7 ± 4.5 64.4 ± 5.3 7.26 0.88 11.45 0.086 85.2 ± 9.4 116.5 ± 13.5 7.23 0.75 11.05 0.077 32.3 ± 2.3 47.9 ± 2.4 7.27 0.95 11.68 0.088 72.5 ± 6.9 96.1 ± 2.9 7.84 0.80 11.21 0.079 51.7 ± 4.5 64.4 ± 5.3 7.26 0.88 11.45 0.08
OP + SM 1 53.0 ± 4.0 53.7 ± 1.5 7.13 0.91 10.82 0.082 28.1 ± 7.5 113.8 ± 25.1 7.01 0.84 10.27 0.083 65.4 ± 5.8 106.6 ± 46.6 6.85 0.74 9.41 0.084 21.1 ± 2.1 46.4 ± 0.6 7.38 1.01 11.64 0.095 53.0 ± 4.0 53.7 ± 1.5 7.13 0.91 10.82 0.086 77.6 ± 5.9 102.1 ± 8.8 7.12 0.80 9.95 0.087 28.2 ± 7.5 113.8 ± 25.1 7.01 0.84 10.27 0.088 65.2 ± 5.8 106.6 ± 46.6 6.85 0.74 9.41 0.089 53.0 ± 4.0 53.7 ± 1.5 7.13 0.91 10.82 0.08
FV + SM 1 58.1 ± 4.1 97.6 ± 6.2 7.48 2.15 7.32 0.292 41.5 ± 2.4 74.5 ± 4.8 7.60 1.91 8.42 0.233 73.5 ± 5.6 111.9 ± 12.6 7.23 2.41 6.85 0.354 30.8 ± 1.6 63.2 ± 5.1 7.71 1.76 9.21 0.195 58.1 ± 4.1 97.6 ± 6.2 7.48 2.15 7.32 0.296 83.5 ± 7.7 148.7 ± 21.2 7.04 2.73 5.66 0.487 41.5 ± 2.4 74.5 ± 4.8 7.60 1.91 8.42 0.238 73.5 ± 5.6 111.9 ± 12.6 7.23 2.41 6.85 0.359 58.1 ± 4.1 97.6 ± 6.2 7.48 2.15 7.32 0.29
Table 4Characterization of the fermented organic mixtures (after 1st stage treatment).
Sample EC TSa COD pH out VFA TA VFA/TAg kg�1
ww g kg�1ww g kg�1
ww g kg�1ww
MS + SM 1 41.9 ± 1.0 57.4 ± 5.2 5.06 6.08 5.06 1.202 38.8 ± 1.1 41.9 ± 5.4 5.23 5.12 5.54 0.923 83.0 ± 3.7 81.7 ± 23.7 5.03 5.70 4.79 1.194 13.9 ± 2.1 38.5 ± 6.0 5.57 6.61 5.97 1.115 47.4 ± 0.8 76.4 ± 4.1 4.82 7.71 6.24 1.246 77.1 ± 4.2 109.5 ± 6.7 4.77 7.55 6.88 1.107 62.8 ± 1.3 47.9 ± 6.3 4.71 8.54 7.67 1.118 83.7 ± 2.1 104.6 ± 1.3 5.10 10.28 9.19 1.129 52.9 ± 1.4 71.9 ± 4.2 4.82 8.44 7.47 1.13
RF + SM 1 46.1 ± 11.0 56.2 ± 10.8 5.11 7.23 4.68 1.542 31.8 ± 5.4 32.2 ± 5.1 6.16 4.30 6.7 0.643 70.4 ± 18.3 66.1 ± 7.3 4.79 6.98 3.99 1.754 18.1 ± 1.1 35.2 ± 6.7 6.46 4.81 4.91 0.985 47.4 ± 2.4 57.1 ± 4.7 4.83 7.60 6.64 1.146 81.9 ± 1.1 114.6 ± 9.5 4.76 12.24 11.37 1.087 29.3 ± 5.4 38.1 ± 5.3 5.57 8.96 8.1 1.118 68.1 ± 0.3 59.5 ± 2.0 4.78 10.05 8.75 1.159 47.4 ± 2.4 43.3 ± 0.3 4.92 7.00 6.73 1.04
OP + SM 1 49.3 ± 3.7 40.8 ± 2.4 6.99 2.39 4.09 0.582 26.1 ± 6.9 24.6 ± 4.5 6.35 3.89 4.72 0.823 60.8 ± 5.4 57.1 ± 2.7 6.68 4.11 6.73 0.614 19.6 ± 2.0 18.1 ± 1.5 7.72 1.40 3.98 0.355 49.3 ± 3.7 40.8 ± 2.4 7.27 3.25 5.00 0.656 72.1 ± 5.5 68.4 ± 4.8 6.07 4.19 3.80 1.107 26.2 ± 6.9 24.6 ± 4.5 6.72 3.62 6.67 0.548 60.6 ± 5.4 57.1 ± 2.7 7.18 2.84 3.85 0.749 49.3 ± 3.7 40.8 ± 2.4 7.42 2.22 4.50 0.49
340 A. Schievano et al. / Applied Energy 124 (2014) 335–342

Table 4 (continued)
Sample EC TSa COD pH out VFA TA VFA/TAg kg�1
ww g kg�1ww g kg�1
ww g kg�1ww
FV + SM 1 52.0 ± 2.7 59.8 ± 3.5 5.07 8.54 6.98 1.222 29.2 ± 0.6 44.6 ± 7.2 5.63 10.50 9.14 1.153 66.6 ± 3.1 81.7 ± 6.6 4.43 8.36 7.12 1.174 28.4 ± 1.5 43.4 ± 3.7 5.64 11.23 8.29 1.355 50.8 ± 5.4 66.3 ± 7.9 4.88 12.26 5.93 2.076 56.4 ± 2.1 113.9 ± 38.6 4.57 11.27 6.54 1.727 29.2 ± 3.1 61.7 ± 9.0 5.40 11.46 8.44 1.368 57.2 ± 1.9 96.3 ± 20.9 4.34 11.87 7.29 1.639 43.9 ± 3.3 75.5 ± 6.1 4.74 12.93 8.21 1.57
a OMC was not measured as VS, because consistent part of the VS of fermented materials are evaporated during drying.
Table 5Energy recovery (ER) per kgVS-added to the two-stage and one-stage AD systems.
Mixture EC Two-stage ER One-stage ER Increase of ER in two-stage
1st stage (H2) 2nd stage (CH4) Total two-stage CH4 % (MJ/MJ)
MJ kg�1VS-added % of total two-stage MJ kg�1
VS-added % of total two-stage MJ kg�1VS-added MJ kg�1
VS-added
MS + SM 1 1.12 ± 0.10 7.7% 13.35 ± 0.88 92.3% 14.5 ± 1.0 15.17 ± 0.16 �4.6% bb
2 1.54 ± 0.07 12.6% 10.67 ± 0.62 87.4% 12.2 ± 0.7 14.17 ± 1.32 �13.8% b3 0.54 ± 0.14 4.5% 11.61 ± 3.40 95.5% 12.2 ± 3.5 13.34 ± 0.84 �8.9% b4 0.16 ± 0.04 –a –a –a –a –a –a
5 0.74 ± 0.10 4.9% 14.28 ± 3.36 95.1% 15.0 ± 3.5 15.17 ± 0.16 �1.0% b6 0.28 ± 0.09 – – – – –7 1.27 ± 0.21 6.7% 17.71 ± 0.37 93.3% 19.0 ± 0.6 14.17 ± 1.32 34.0% a8 0.59 ± 0.03 3.9% 14.56 ± 0.13 96.1% 15.1 ± 0.2 13.36 ± 0.84 13.3% a9 1.25 ± 0.17 7.6% 15.19 ± 0.53 92.4% 16.4 ± 0.7 15.17 ± 0.16 8.4% a
RF + SM 1 1.63 ± 0.16 15.5% 8.88 ± 0.62 84.5% 10.5 ± 0.8 10.38 ± 0.55 1.3% b2 0.26 ± 0.05 – – – – –3 1.61 ± 0.19 15.7% 8.65 ± 0.48 84.3% 10.3 ± 0.7 9.84 ± 0.40 4.2% b4 0.08 ± 0.05 – – – – –5 1.48 ± 0.06 12.1% 10.74 ± 1.19 87.9% 12.2 ± 1.3 10.38 ± 0.55 17.8% a6 0.67 ± 0.49 5.7% 11.12 ± 0.10 94.3% 11.8 ± 0.6 9.52 ± 0.53 23.9% a7 0.07 ± 0.02 – – – – –8 1.23 ± 0.14 12.7% 8.44 ± 0.34 87.3% 9.7 ± 0.5 9.84 ± 0.40 �1.7% b9 1.40 ± 0.10 14.2% 8.45 ± 0.73 85.8% 9.9 ± 0.8 10.38 ± 0.55 �5.1% b
PO + SM 1 0.01 ± 0.01 – – – – –2 0.17 ± 0.03 – – – – –3 0.01 ± 0.01 – – – – –4 0.02 ± 0.01 – – – – –5 0.01 ± 0.01 – – – – –6 0.01 ± 0.01 – – – – –7 0.03 ± 0.02 – – – – –8 0.01 ± 0.01 – – – – –9 0.01 ± 0.01 – – – – –
FV + SM 1 0.34 ± 0.11 – – – – –2 0.01 ± 0.00 – – – – –3 0.42 ± 0.22 – – – – –4 0.08 ± 0.02 – – – – –5 1.58 ± 0.28 10.7% 13.12 ± 0.39 89.3% 14.7 ± 0.7 10.30 ± 1.14 42.7% a6 0.49 ± 0.18 3.9% 12.13 ± 1.14 96.1% 12.6 ± 1.3 10.27 ± 0.21 22.9% a7 0.20 ± 0.22 – – – – –8 1.26 ± 0.07 9.3% 12.22 ± 0.65 90.7% 13.5 ± 0.7 9.78 ± 0.48 37.8% a9 1.50 ± 0.34 11.6% 11.52 ± 0.97 88.4% 13.0 ± 1.3 9.88 ± 1.09 31.8% a
a Methane production was not considered for EC where H2 yields resulted lower than 30% of the maximum H2 yield.b Letter a indicates significant (ANOVA, Tukey test for n = 3. p < 0.05) increase/decrease in ER for the two-stage AD, while letter b indicates non-significant differences.
A. Schievano et al. / Applied Energy 124 (2014) 335–342 341
showed significantly lower ER in the two-stage system was MS inEC2, while for all other EC, ER was never significantly higher in theone-stage (Table 5). On the other hand, nine EC showedsignificantly higher ER in the two-stage system, with the highestincrease of 42.7% for FV in EC5 (Table 5).
4. Discussion
Relatively high bio-hydrogen yields were reached through theoptimized first-stage approach. MS produced up to 120 Sdm3H2 -
kg�1VS-added, similarly to that found by previous authors [15,16]. The
same authors [16], reported also bio-hydrogen yields for variouskinds of food waste in the range of 60–130 Sdm3H2 kg�1
VS-added andthe results of the present work were also coherent with previousexperience by Tenca et al., obtained with the same substrate(FV + SM) [11]. The low productivity of OP was not a surprise. Otherauthors have worked on the same substrate and found similarbio-hydrogen yields (<10 Sdm3 kg�1
VS-added) [17,18].Different optimum zones for MS, RF and FV resulted from the
obtained interpolations. HRTs, OMCs and OLR for optimum
342 A. Schievano et al. / Applied Energy 124 (2014) 335–342
bio-hydrogen generation did not correspond for MS, RF and FVprobably because different chemical composition of the organicmatter influenced the equilibrium in the fermentation. The type,concentrations and retention times of the organic molecules andthe way they enter the metabolic pathways of acid fermentationsare thought to strongly influence the fermentation environmentitself and thereby H2 yields. For example, in the case of MS, theinitial concentrations of VFA were found higher, compared to othersubstrates (Table 3) and this was probably was the cause of aslightly more acidic initial conditions (see pH, Table 3). The con-centration and retention time of the resulting metabolites mustalso count in inducing changes in the fermentation environmentand the whole efficiency of the fermentation, as already reportedby Tenca et al. [11]. Here, VFA formation and TA were taken intoaccount as descriptive parameters and, generally, efficient H2 pro-ductions corresponded to higher VFA/TA. On the other hand, tobetter explain the reasons for the differences in the optimum zoneamong different biomass types, a deeper look into the chemicalcomposition of the organic matter and, also, into the speciationof the soluble/volatile metabolites (VFAs, phenols, amines, etc.)should be done in the future, as recently suggested by Schievanoet al. [10]).
The same approach would help also in further understandingthe methanogenic process. Differences in chemical compositionof the biomass are likely to have induced the differences observedin CH4 concentrations of biogas measured both in the 2nd and inthe single stage. It is well known that AD of fat-rich and/or VFA-rich substrates produces higher CH4 concentrations, as comparedto protein-rich or carbohydrate-rich substrates [6,15].
The obtained data give a robust contribution to demonstrate thegeneral supremacy of the two-stage AD system, as compared to theone-stage approach. The method chosen in this work, i.e. to opti-mize both hydrogenesis and methanogenesis, allowed overcominginhibition/inefficiencies that could hide a general result, ashappened in previous experiences [10]. In that paper, two- andone-stage gave the same ER, even if a clear partial inhibition ofthe two-stage was observed [10]. In this work, with the samesubstrate (FV + SM) used by Schievano et al. [10], the two-stagewas demonstrated to be potentially (i.e. when both processes areoptimized) more productive than the one-stage.
Generally, higher ER in the two-stage system did not corre-spond to higher H2 yields and, in any case, relatively high increasesin ER (15–30%) were found even if H2 accounted for only 5–10% ofthe total ER. This confirms the hypothesis drawn by Luo et al. [6],according to which the real advantage created by the two-stage ap-proach should be linked to more efficient methanogenesis, helpedby pre-fermentation optimized in the first stage. Additionally, theextraction of hydrogen gas from the liquid phase and its directuse as energy source helps in increasing this advantage. In fact,to our knowledge, in a traditional one-stage process, comparableamounts of hydrogen are produced, while simultaneouslyconverted into methane by hydrogenotrophic communities bythe following reaction (12H2 + 4CO2 ? CH4 + 8H2O). This reaction,as all microbial process, require a fraction of energy for microbialmethabolism and, as all microbial process, could sometimes andsomehow be inefficient, depending on many factors. In the two-stage, instead, all energy contained in H2 is recovered, thanks tophysical separation of the fuel from the liquid phase.
This could be confirmed only by performing deeper character-ization of the organic matter before and after the first-stage
treatment, such as soluble carbon on total carbon, biodegradabilitytests and metabolite speciation.
5. Conclusions
This study was a first attempt to create a new methodology forcomprehensively demonstrate the potentialities of the two-stageAD system. This method demonstrated that two-stage AD canincrease ER from biomass, when compared to one-stage AD. Infuture, this approach should be completed with a larger varietyof biomass types and by deeper analytical procedures regardingboth chemical and microbiological aspects.
References
[1] Martinez-Perez N, Cherrymanb SJ, Premier GC, Dinsdale RM, Hawkes DL,Hawkes FR, et al. The potential for hydrogen-enriched biogas production fromcrops: scenarios in the UK. Biomass Bioenergy 2007;31:95–104.
[2] Cavinato C, Bolzonella D, Fatone F, Giuliano A, Pavan P. Two-phasethermophilic anaerobic digestion process for biohythane production treatingbiowaste: preliminary results. Water Sci Technol 2012;37:11549–55.
[3] Gavala HN, Skiadas IV, Ahring BK. Biological hydrogen production insuspended and attached growth anaerobic reactor systems. Int J HydrogenEnergy 2006;31:1164–75.
[4] Antonopoulou G, Gavala HN, Skiadas IV, Angelopoulos K, Lyberatos G. Biofuelsgeneration from sweet sorghum: fermentative hydrogen production andanaerobic digestion of the remaining biomass. Bioresource Technol2008;99:110–9.
[5] Park MJ, Jo HJ, Park D, Lee DS, Park JM. Comprehensive study on a two-stageanaerobic digestion process for the sequential production of hydrogen andmethane from cost-effective molasses. Int J Hydrogen Energy2010;35:6194–202.
[6] Luo G, Xie L, Zhou Q, Angelidaki I. Enhancement of bioenergy production fromorganic wastes by two-stage anaerobic hydrogen and methane productionprocess. Bioresour Technol 2011;102:8700–6.
[7] Fox P, Pohland FG. Anaerobic treatment applications and fundamentals:substrate specificity during phase separation. Water Environ Res1994;66:716–24.
[8] Liu D, Zeng RJ, Angelidaki I. Hydrogen and methane production fromhousehold solid waste in the two-stage fermentation process. Water Res2006;40:2230–6.
[9] Pakarinen OM, Tahti HP, Rintala JA. One-stage H2 and CH4 and two-stage H2 + CH4 production from grass silage and from solid and liquidfractions of NaOH pre-treated grass silage. Biomass Bioenergy 2009;33:1419–27.
[10] Schievano A, Tenca A, Scaglia B, Merlino G, Rizzi A, Daffonchio D, et al. Two-stage vs single-stage thermophilic anaerobic digestion: comparison of energyproduction and biodegradation efficiencies. Environ Sci Technol 2012;46:8502–10.
[11] Tenca A, Schievano A, Perazzolo F, Adani F, Oberti R. Biohydrogen fromthermophilic co-fermentation of swine manure with fruit and vegetablewaste: maximizing stable production without pH control. Bioresour Technol2011;102:8582–8.
[12] NIST/SEMATECH e-Handbook of Statistical Methods. <http://www.itl.nist.gov/div898/handbook/>, [accessed 12.03.13].
[13] Schievano A, Scaglia B, D’Imporzano G, Malagutti L, Gozzi A, Adani F. Predictionof biogas potentials using quick laboratory analyses: upgrading previousmodels for application to heterogeneous organic matrices. Bioresour Technol2009;100:5777–82.
[14] APHA – American Public Health Association. Standard methods for theexamination of water and wastewater, 20th ed., APHA, Washington, DC, 1998.
[15] Li YC, Nissila ME, Wua SY, Lin CY, Puhakka JA. Silage as source of bacteria andelectrons for dark fermentative hydrogen production. Int J Hydrogen Energy2012;37:15518–24.
[16] Guo XM, Trably E, Latrille E, Carrere H, Steyer JF. Hydrogen production fromagricultural waste by dark fermentation: a review. Int J Hydrogen Energy2010;35:10660–73.
[17] Kontrouli EC, Gavala HN, Skiadas IV, Lyberatos G. Mesophilic biohydrogenproduction from olive pulp. Process Saf Environ 2006;84:285–9.
[18] Koutrouli EC, Kalfas H, Gavala HN, Skiadas IV, Stamatelatou K, Lyberatos G.Hydrogen and methane production through two-stage mesophilic anaerobicdigestion of olive pulp. Bioresour Technol 2009;100:3718–23.