can machine learning techniques predict customer ... machine learning techniques predict customer...
TRANSCRIPT
http://air.sciedupress.com Artificial Intelligence Research 2017, Vol. 6, No. 1
ORIGINAL RESEARCH
Can machine learning techniques predict customerdissatisfaction? A feasibility study for the automotiveindustry
Stefan Meinzer∗1, Ulf Jensen1, Alexander Thamm2, Joachim Hornegger3, Björn M. Eskofier1
1Digital Sports Group, Pattern Recognition Lab, Department of Computer Science, Friedrich-Alexander-UniversityErlangen-Nürnberg, Erlangen, Germany2Department of Sales Management and Marketing, Faculty of Business Administration, University of Eichstaett-Ingolstadt,Ingolstadt, Germany3Pattern Recognition Lab, Department of Computer Science, Friedrich-Alexander-University Erlangen-Nürnberg, Erlangen,Germany
Received: November 6, 2016 Accepted: December 4, 2016 Online Published: December 26, 2016DOI: 10.5430/air.v6n1p80 URL: http://dx.doi.org/10.5430/air.v6n1p80
ABSTRACT
The automotive industry is in the strongest competition ever, as this sector gets disrupted by new arising competitors. Providingservices to maximum customer satisfaction will be one of the most crucial competitive advantages in the future. Around 1Terabyte of objective data is created every hour today. This volume will significantly grow in the future by the increasing numberof connected services within the automotive industry. However, customer satisfaction determination is solely based on subjectivequestionnaires today without taking the vast amount of objective sensor and service process data into account. This work presentsan industrial application that fills this lack of research and thus provides a solution with a high practical impact to survive inthe tough competition of the automotive industry. Therefore, the work addresses these fundamental business questions: 1) Candissatisfied customers be classified based on data that is produced during every service visit? 2) Can the dissatisfaction indicatorsbe derived from service process data? A machine learning problem is set up that compared 5 classifiers and analyzed data from19,008 real service visits from an automotive company. The 105 extracted features were drawn from the most significant availablesources: warranty, diagnostic, dealer system and general vehicle data. The best result for customer dissatisfaction classificationwas 88.8% achieved with the SVM classifier (RBF kernel). Furthermore, the 46 most potential indicators for dissatisfaction wereidentified by the evolutionary feature selection. Our system was capable of classifying customer dissatisfaction solely based onthe objective data that is generated by almost every service visit. As the amount of these data is continuously growing, we expectthat the presented data-driven approach can achieve even better results in the future with a higher amount of data.
Key Words: Customer satisfaction prediction, Classification models, Data consolidation logic, Automotive industry, MonteCarlo sampling, Evolutionary feature selection
1. INTRODUCTION
Every hour, around 1 TB of data is produced by cars anddealers within the automotive industry today, growing to
1 GB in the future created by self-driving cars in every sec-ond.[1] Thus, the automotive industry is looking intensivelyfor methods to handle this vast amount of data and analyze it
∗Correspondence: Stefan Meinzer; Email: [email protected]; Address: Digital Sports Group, Pattern Recognition Lab,Department of Computer Science, Friedrich-Alexander-University Erlangen-Nürnberg, Haberstr. 2, 91058 Erlangen, Germany.
80 ISSN 1927-6974 E-ISSN 1927-6982
http://air.sciedupress.com Artificial Intelligence Research 2017, Vol. 6, No. 1
to secure maximum customer benefit. Increasing perceivedcustomer satisfaction or, respectively, decreasing dissatisfac-tion was identified as the number one management targetwithin the automotive industry.[2, 3] Knowing about dissatis-fied customers is vitally important to create competitive leads,especially in the after-sales sector.[4] For the US service in-dustries, an estimated revenue of 6-8 billion USD is annuallycreated by automotive after-sales services.[5] Consequently,the identification of potentially dissatisfied customers, beforethe service interaction ends, is of great value to enable proac-tive actions before the customer actually gets dissatisfied.A satisfied customer will retain and thus is of great interestfrom a business perspective. This is underlined by literaturethat shows that the costs for new customer acquisition areat least double[6] to 5-6 times higher than maintaining thecustomer.[7] Studies indicate that profits can be increased byalmost 100% only by retaining 5% of the customers.[8]
Traditionally, customer satisfaction with a dealer visit is as-sessed by customer surveys using questionnaires after thecustomer left the dealer.[2, 9–11] The use of questionnairesto measure dissatisfaction has several drawbacks. First, thecustomer is already dissatisfied at this time as the customer-service interaction is already completed. Second, not everycustomer can be assessed as only a little sample of customersreceives a survey. However, for every visit, service and repairdata are produced and can be used for further analysis.[12, 13]
Therefore, the essential question for the automotive indus-tries is: Can dissatisfied customers be classified based ondata that is produced during every service visit?
Beside this customer value, the optimization of processesbased on the knowledge of customer dissatisfaction wouldgenerate huge company benefits. Repair routines could beimproved and potential service failures could be eliminated.In order to realize this company value, a second questionarises: Can the dissatisfaction indicators be derived fromservice process data?
The following literature review aims to identify existing ap-proaches to increase customer satisfaction in the serviceindustry in general. The use of machine learning techniquesto improve the customer relationship was prevalent espe-cially in the telecommunication business. The prediction ofcustomer churn, as a consequence of dissatisfaction, usingmachine learning algorithms was thereby most prominent.Datta et al.[14] developed a prediction model for churningcustomers in mobile phone services using a cascade neuralnetwork model. Customers that will discontinue using thecellular phone services were predicted. To predict the timeof churn was the goal by further research.[15] They com-pared ordinal regression models with survival analysis for
tenure prediction of mobile phone customers whereby theregression models showed most significant results.
Existing resaerch[16] aimed to develop a propensity-to-churnscore for mobile phone subscribers in Taiwan. They com-pared various data mining techniques and identified decisiontrees as most promising to model churning customers. Pre-dicting latent churn customers was also scope of research.[6]
The authors investigated different techniques to predict cus-tomer churn and concluded that support vector machines(SVM) showed the highest accuracy.
In the health care sector, Yarnold et al.[17] were among thefirst who used machine learning techniques to predict overallpatient dissatisfaction. Nonlinear decision trees were used toclassify patient satisfaction based on survey response data ofemergency departments. Sun et al.[18] had the objective toidentify process measures that significantly influence patientsatisfaction in emergency departments. Logistic regressionmodels were applied based on questionnaire data, patientcharacteristics and process measures. Critical features ofsatisfaction, such as explanation of diagnostic results, couldbe identified. Boudreaux et al.[19] investigated the mainpredictors of patient satisfaction in municipal emergencydepartments. Their results were based on telephone inter-view data and sociodemographics of hospital patients thatwere analyzed with logistic regression. The findings revealedthe main indicators for overall patient satisfaction like pa-tients perceptions of care and further features. An extensiveoverview on the determination of perceived patient satisfac-tion in the health care sector can be found in literature.[20]
Within the automotive industry, similar approaches were usedfor customer recommendations, targeted marketing leadsand customer satisfaction. Mavridou et al.[20] aimed toimprove the car configurator. They used association rulesbased on customer choices to create an individualized rec-ommendation system. Chan et al.[21] focused on the productdevelopment process within the automotive industry. Theymapped survey response data from customer studies to de-sign attributes according to customer preferences. Further re-search investigated the possibilities to create marketing leadsfrom customer satisfaction, sociodemographic and account-ing data.[22] They used the techniques of self-organizingmaps and decision trees for an individualized customer seg-mentation. In addition, the goal to make customer prefer-ences more transparent is a research area.[23] The authors ap-plied Bayesian Networks solely on survey response data. Forinstance individualized pricing or region specific marketingconcepts were derived. Various researches focused on model-ing customer satisfaction using vehicle failure data.[12, 24, 25]
They limited their focus on quality and reliability related
Published by Sciedu Press 81
http://air.sciedupress.com Artificial Intelligence Research 2017, Vol. 6, No. 1
satisfaction and extracted features from warranty data.[12]
Bandaru et al.[24, 25] used extracted and calculated featuresfrom service and sales data to model customer satisfaction.
Models that focus on the automotive industry arescarce.[10, 12] Machine learning techniques were not appliedin order to classify overall dissatisfied customers or to iden-tify the most critical indicators based on continuously cre-ated, objective data. Further existing research within thearea of artificial intelligence and machine learning is focus-ing on sensor data in order to improve diagnostic proce-dures[26, 27] or enhancing pedestrians, road and traffic signdetection.[28, 29] Due to the limitations of determining sub-jective customer satisfaction using questionnaires and theoverall customer satisfaction as a fundamental managementtarget in the automotive industry, there is an unmet need fora system to classify dissatisfied customers from objective,technical data.[10] Such an approach has not been presentedso far as the literature review expressed.
Customer satisfaction is one of the most important manage-rial goals in the automotive industry and helps to increasecompetitive advantages. To address this high revenue po-
tential, dissatisfied customers need to be predicted and theindicators for dissatisfaction need to be identified. The largeamount of data that is produced every day by dealers, cus-tomers and cars can be used to achieve this goal.[2, 3]
This work investigates five machine learning approaches fortheir performance in predicting dissatisfied customers andidentifying general indicators for customer dissatisfactionbased on objective data. The presented concept can be trans-ferred to other service industries, such as the health caresector where the customer satisfaction is an important man-agement target and sensor data are continuously produced.
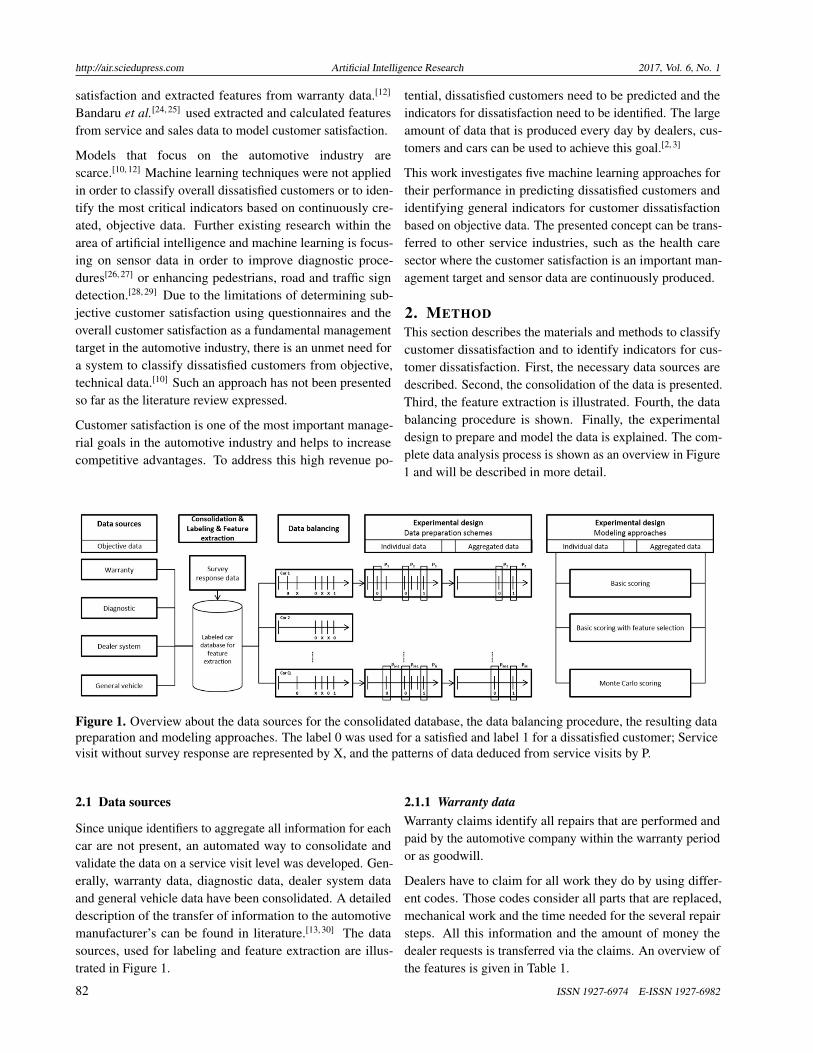
2. METHODThis section describes the materials and methods to classifycustomer dissatisfaction and to identify indicators for cus-tomer dissatisfaction. First, the necessary data sources aredescribed. Second, the consolidation of the data is presented.Third, the feature extraction is illustrated. Fourth, the databalancing procedure is shown. Finally, the experimentaldesign to prepare and model the data is explained. The com-plete data analysis process is shown as an overview in Figure1 and will be described in more detail.
Figure 1. Overview about the data sources for the consolidated database, the data balancing procedure, the resulting datapreparation and modeling approaches. The label 0 was used for a satisfied and label 1 for a dissatisfied customer; Servicevisit without survey response are represented by X, and the patterns of data deduced from service visits by P.
2.1 Data sources
Since unique identifiers to aggregate all information for eachcar are not present, an automated way to consolidate andvalidate the data on a service visit level was developed. Gen-erally, warranty data, diagnostic data, dealer system dataand general vehicle data have been consolidated. A detaileddescription of the transfer of information to the automotivemanufacturer’s can be found in literature.[13, 30] The datasources, used for labeling and feature extraction are illus-trated in Figure 1.
2.1.1 Warranty dataWarranty claims identify all repairs that are performed andpaid by the automotive company within the warranty periodor as goodwill.
Dealers have to claim for all work they do by using differ-ent codes. Those codes consider all parts that are replaced,mechanical work and the time needed for the several repairsteps. All this information and the amount of money thedealer requests is transferred via the claims. An overview ofthe features is given in Table 1.
82 ISSN 1927-6974 E-ISSN 1927-6982
http://air.sciedupress.com Artificial Intelligence Research 2017, Vol. 6, No. 1
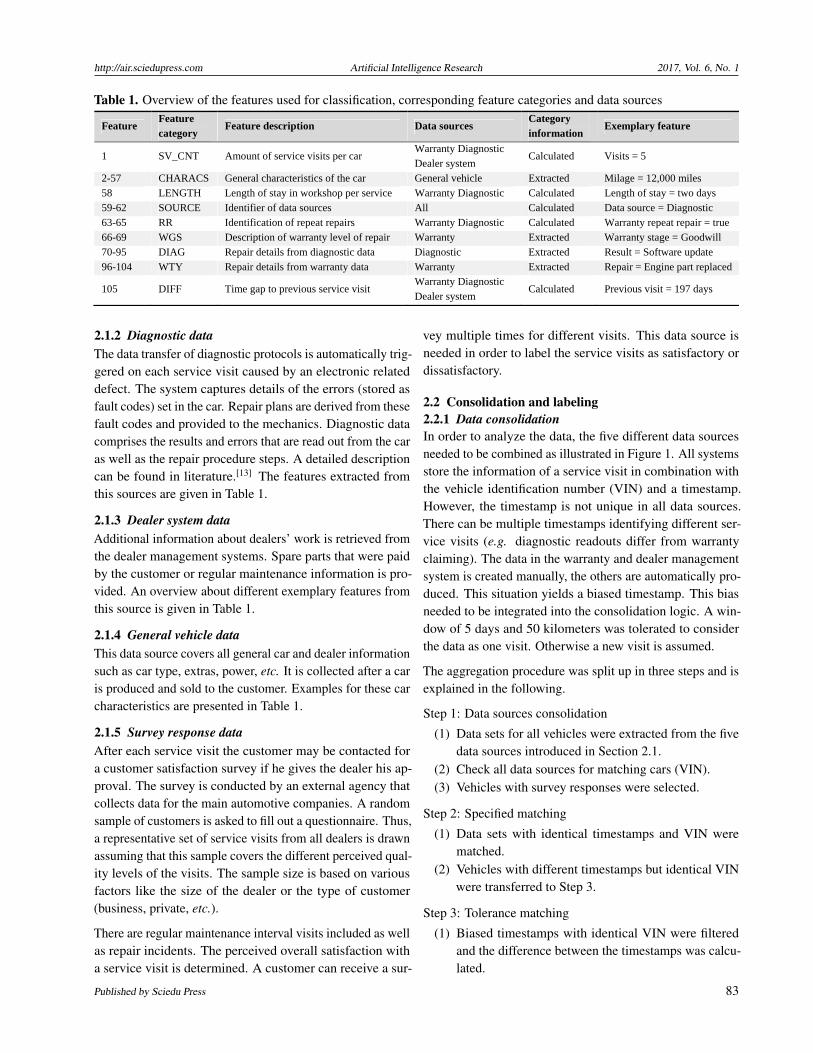
Table 1. Overview of the features used for classification, corresponding feature categories and data sources
Feature Feature category
Feature description Data sources Category information
Exemplary feature
1 SV_CNT Amount of service visits per car Warranty Diagnostic Dealer system
Calculated Visits = 5
2-57 CHARACS General characteristics of the car General vehicle Extracted Milage = 12,000 miles 58 LENGTH Length of stay in workshop per service Warranty Diagnostic Calculated Length of stay = two days 59-62 SOURCE Identifier of data sources All Calculated Data source = Diagnostic 63-65 RR Identification of repeat repairs Warranty Diagnostic Calculated Warranty repeat repair = true66-69 WGS Description of warranty level of repair Warranty Extracted Warranty stage = Goodwill 70-95 DIAG Repair details from diagnostic data Diagnostic Extracted Result = Software update 96-104 WTY Repair details from warranty data Warranty Extracted Repair = Engine part replaced
105 DIFF Time gap to previous service visit Warranty Diagnostic Dealer system
Calculated Previous visit = 197 days
2.1.2 Diagnostic dataThe data transfer of diagnostic protocols is automatically trig-gered on each service visit caused by an electronic relateddefect. The system captures details of the errors (stored asfault codes) set in the car. Repair plans are derived from thesefault codes and provided to the mechanics. Diagnostic datacomprises the results and errors that are read out from the caras well as the repair procedure steps. A detailed descriptioncan be found in literature.[13] The features extracted fromthis sources are given in Table 1.
2.1.3 Dealer system dataAdditional information about dealers’ work is retrieved fromthe dealer management systems. Spare parts that were paidby the customer or regular maintenance information is pro-vided. An overview about different exemplary features fromthis source is given in Table 1.
2.1.4 General vehicle dataThis data source covers all general car and dealer informationsuch as car type, extras, power, etc. It is collected after a caris produced and sold to the customer. Examples for these carcharacteristics are presented in Table 1.
2.1.5 Survey response dataAfter each service visit the customer may be contacted fora customer satisfaction survey if he gives the dealer his ap-proval. The survey is conducted by an external agency thatcollects data for the main automotive companies. A randomsample of customers is asked to fill out a questionnaire. Thus,a representative set of service visits from all dealers is drawnassuming that this sample covers the different perceived qual-ity levels of the visits. The sample size is based on variousfactors like the size of the dealer or the type of customer(business, private, etc.).
There are regular maintenance interval visits included as wellas repair incidents. The perceived overall satisfaction witha service visit is determined. A customer can receive a sur-
vey multiple times for different visits. This data source isneeded in order to label the service visits as satisfactory ordissatisfactory.
2.2 Consolidation and labeling2.2.1 Data consolidationIn order to analyze the data, the five different data sourcesneeded to be combined as illustrated in Figure 1. All systemsstore the information of a service visit in combination withthe vehicle identification number (VIN) and a timestamp.However, the timestamp is not unique in all data sources.There can be multiple timestamps identifying different ser-vice visits (e.g. diagnostic readouts differ from warrantyclaiming). The data in the warranty and dealer managementsystem is created manually, the others are automatically pro-duced. This situation yields a biased timestamp. This biasneeded to be integrated into the consolidation logic. A win-dow of 5 days and 50 kilometers was tolerated to considerthe data as one visit. Otherwise a new visit is assumed.
The aggregation procedure was split up in three steps and isexplained in the following.
Step 1: Data sources consolidation
(1) Data sets for all vehicles were extracted from the fivedata sources introduced in Section 2.1.
(2) Check all data sources for matching cars (VIN).(3) Vehicles with survey responses were selected.
Step 2: Specified matching
(1) Data sets with identical timestamps and VIN werematched.
(2) Vehicles with different timestamps but identical VINwere transferred to Step 3.
Step 3: Tolerance matching
(1) Biased timestamps with identical VIN were filteredand the difference between the timestamps was calcu-lated.
Published by Sciedu Press 83
http://air.sciedupress.com Artificial Intelligence Research 2017, Vol. 6, No. 1
(2) Vehicles with a difference less than 5 days or 50 kilo-meters were consolidated into one service visit.
(3) Vehicles that did not fulfill these criteria were consid-ered as separate service visits.
2.2.2 LabelingEach service visit can be identified with the unique times-tamp of the survey and the VIN. The survey design requiresto send out the questionnaire not later than 30 days aftera service visit. Thus, survey data and service visits usinga tolerance window of 30 days were mapped. The overallsatisfaction of the particular customer was considered to bethe class label. The overall satisfaction rate was measuredusing a likert scale from 1-5 (where 5 is best). In order toguarantee a two-class classification problem, the results ofthis question have been transferred into a binary coding. Ser-vice visits with satisfaction rates of 1 to 3 were identified asdissatisfactory and labeled with 1 whereas 4 and 5 representthe service visits of satisfied customers that were labeled with0. This is a common way of interpretation and presentationin a management manner.[19]
2.3 Feature extractionFeatures were derived from the consolidated and labeled datasources. In order to provide a holistic overview, the featureswere categorized as presented in Table 1. Generally, the fea-tures provide an encompassing view about the service visitsof the car. Technical information such as the repair cause,repair results, affected parts or general vehicle characteristicswere included. Furthermore, features that may potentially be
perceived by the customer were calculated, such as repeatrepairs, the length of stay or the time between actual andprevious visit. In total 105 features were extracted for theanalysis and presented in Table 1.
2.4 Data balancingDissatisfied customers were underrepresented in the dataset.For the analysis, too many patterns about satisfied customerswere included during the learning process. The class imbal-ance challenge has gained attention previously in research onmachine learning.[31] In the dataset, 5,048 events with label1 corresponded to 13,960 service visits with label 0. As theminor group of dissatisfied customers should be classified asgood as possible, strategies to cope with this class imbalancewere needed. Thereby, the probability of False Negatives,meaning dissatisfied customers were classified as satisfied,should be reduced to a minimum. Various machine learningalgorithms that do not take class imbalance into account tendto be biased.[31, 32] In order to increase the performance of theclassification of dissatisfied customers, a random undersam-pling of the satisfied customers was used.[33] Compared toalternative solutions, such as cost functions, that was shownto be an easy and effective procedure.
In order to achieve equal populations of the two classes, aselection probability of roughly 36.1% within the satisfiedcustomer group was needed to achieve a subsample of 5,048observations. Thereby, an optimal population of car ownerswhose satisfaction level changed from satisfied to dissatisfiedwithin a service history has been generated.
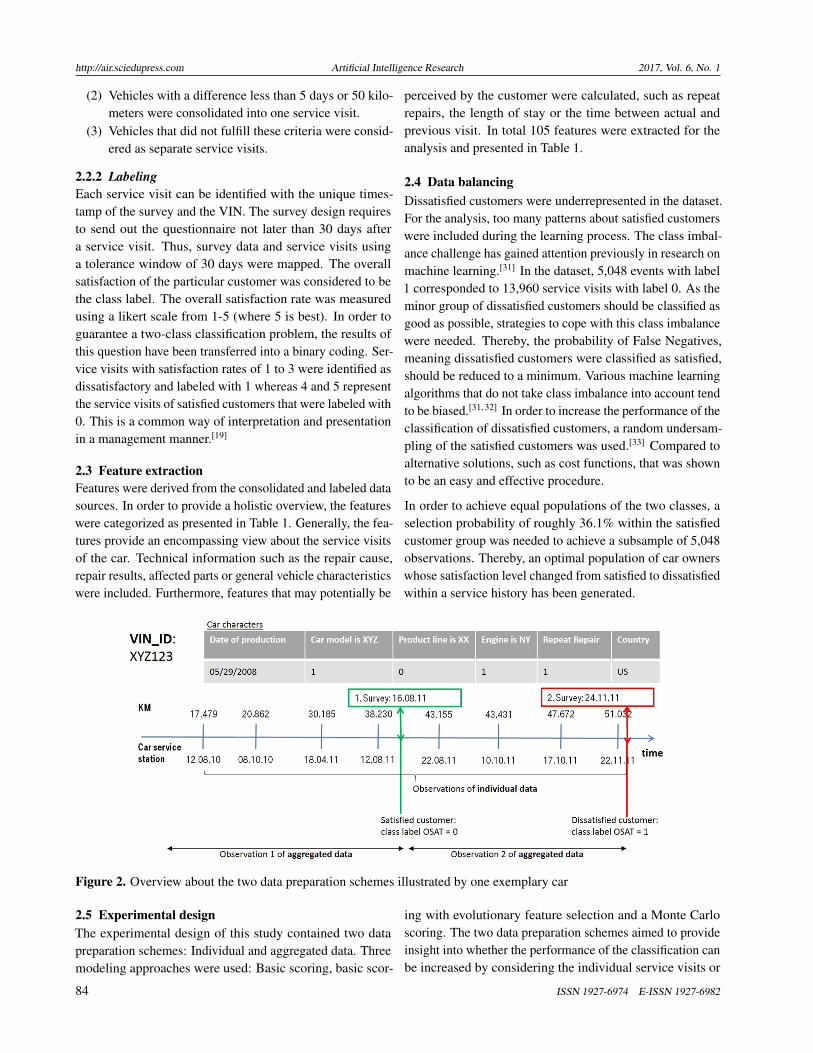
Figure 2. Overview about the two data preparation schemes illustrated by one exemplary car
2.5 Experimental designThe experimental design of this study contained two datapreparation schemes: Individual and aggregated data. Threemodeling approaches were used: Basic scoring, basic scor-
ing with evolutionary feature selection and a Monte Carloscoring. The two data preparation schemes aimed to provideinsight into whether the performance of the classification canbe increased by considering the individual service visits or
84 ISSN 1927-6974 E-ISSN 1927-6982
http://air.sciedupress.com Artificial Intelligence Research 2017, Vol. 6, No. 1
combining them as a history of events. The three modelingapproaches addressed the question about the derivation ofpotential indicators of dissatisfaction. In the experimentaldesign five classifiers were compared using different param-eter settings: AdaBoost, k nearest neighbor (kNN), SVMwith linear and RBF-kernel and Random Forest. These fiveclassifiers were chosen as they were evaluated to be suitedas state-of-the-art classifiers for industrial applications.[34]
2.5.1 Data preparation schemesTwo different data preparation schemes consisting of individ-ual and aggregated data were applied. Individual data meansthat training and scoring was based on the original longitu-dinal data structure of cars and service visits. Consequently,the dataset consisted of multiple dealer visits per car. Thisapproach is typically used today to analyze survey results.
Aggregated data means, that all service visits of one customer(represented by the VIN) that remain the customer as satis-fied were aggregated to one observation. Means were usedfor numeric features and modes for categorical features. Thefollowing, second record identified the visit that is labeled asdissatisfactory if available.
An exemplary overview on one car, its general characteristicsand the corresponding service visits is given in Figure 2. Thefigure illustrates the two data preparation schemes.
2.5.2 Modeling approachesThe three benchmarked modeling approaches were: Basicscoring, basic scoring with evolutionary feature selectionand a Monte Carlo scoring. In general, constant and quasiconstant items, meaning features with very low entropy (forexample high amount of null values), were eliminated. Fur-thermore, features with a correlation coefficient of more than0.95 were removed.
Basic scoring compared different classifiers for their per-formance on customer dissatisfaction classification. Thecomplete feature set was used.
The basic scoring with evolutionary feature selection[35] ex-periment had the main goal to identify the discriminant fea-tures and thus the main indicators for customer dissatisfac-tion. The feature selection must be fast in calculation tosecure a practical implementation. Therefore, it was per-formed using a simple decision stump that uses only onesplit, therefore being fast and avoiding overfitting.[36] Theinitial feature set is randomly generated, whereby each fea-ture set had a feature activation probability of pi = 0.50.During the next maximum 50 iterations a population of 5individual feature sets competed for the best classificationaccuracy using mutation. Mutation means the random acti-vation and deactivation of features with pm = 1/random of
features. Furthermore, features can interchange within theindividual feature sets with the probability of pc = 0.50. Oneof the five feature sets will result in the highest accuracy andremain for the next iteration. If the accuracy of one of thenew feature sets is better than before, the algorithm proceedsto the next iteration. Once there was no improvement over10 iterations, an early stopping rule was applied and the finalsubset of features was reported.
A Monte Carlo resampling approach was conducted in orderto evaluate the classification variances of the applied predic-tions. Thereby, 500 random subsamples, each consisting of1,000 balanced observations (500 satisfied and 500 dissat-isfied customers), were drawn and evaluated using the gridsearch from the basic scoring approach. In each iterationthe respective classification results and parameter sets werestored.
While the two basic scoring approaches generate one observa-tion per parameter set, the Monte Carlo Scoring is generating500 observations as a consequence of the iterations for eachparameter setting Thereby, statistical tests could be appliedto these iterations. In order to investigate if the accuracydistribution of training, test and validation sample are sig-nificantly different, Friedmans’ ANOVA has been appliedfor the 500 observations within the best parameter set foreach classifier of the Monte Carlo Scoring with significancelevel of α= .05.[37] In order to investigate if there are sig-nificant differences between the accuracy distributions ofthe classifiers which is necessary to compare the 5 evalu-ated classifiers, the non-parametric Kruskal-Wallis-Test withsignificance level of α = .05 has been applied for the bestparameter set.[38, 39] Both statistical tests were performed foreach data preparation schema. All experiments were con-ducted using RapidMiner toolbox version 5.3.013 (Rapid-Miner, Cambridge, MA, USA). A PC with 32 cores and 512GB RAM was used for the analysis.
2.5.3 Experimental setup and evaluation
In order to achieve the intended goal of differentiating sat-isfied from dissatisfied customers during a service visit, aspecific selection of machine learning approaches was cho-sen. An overview of the most common machine learn-ing techniques can be found in literature.[40, 41] In thiswork, the focus is on the following five classifiers basedon the above described design. First, the performance of theAdaBoost classifier was investigated with Nit ε [10, 20, · · · ,100] which corresponds to literature findings.[42, 43] Second,the performance of the kNN classifier was investigated withnumber of nearest neighbors [k = 1, 2, · · · , 10]. Third, theperformance of the SVM was investigated using the linearkernel and fourth, using the RBF kernel. Both SVM classi-
Published by Sciedu Press 85
http://air.sciedupress.com Artificial Intelligence Research 2017, Vol. 6, No. 1
fiers were investigated with kernel parameter C in the range[2-5, 2-4, · · · , 25].[44] For the RBF kernel the parameterspace [2-5, 2-4, · · · , 25] was used for γ. Fifth, the perfor-mance of the Random Forest[45] was investigated using 10to 1,000 trees increasing with 10 steps on a quadratic scale[10, 20, 50, · · · , 1,000]. Each set of free parameters wasevaluated.
From the current dataset, a training (0.70), test (0.20) andvalidation (0.10) sample was conducted and the accuracyfor test and validation was reported. For each parameter set,the classification rate of the five classifiers was investigated.For the feature selection approach, the partitioning was per-formed after the evolutionary feature selection has been doneon the full feature set. Within the Monte Carlo Scoring, thepartitioning has been done within each iteration before theclassification models were applied to the feature set resultingfrom the Monte Carlo iteration.
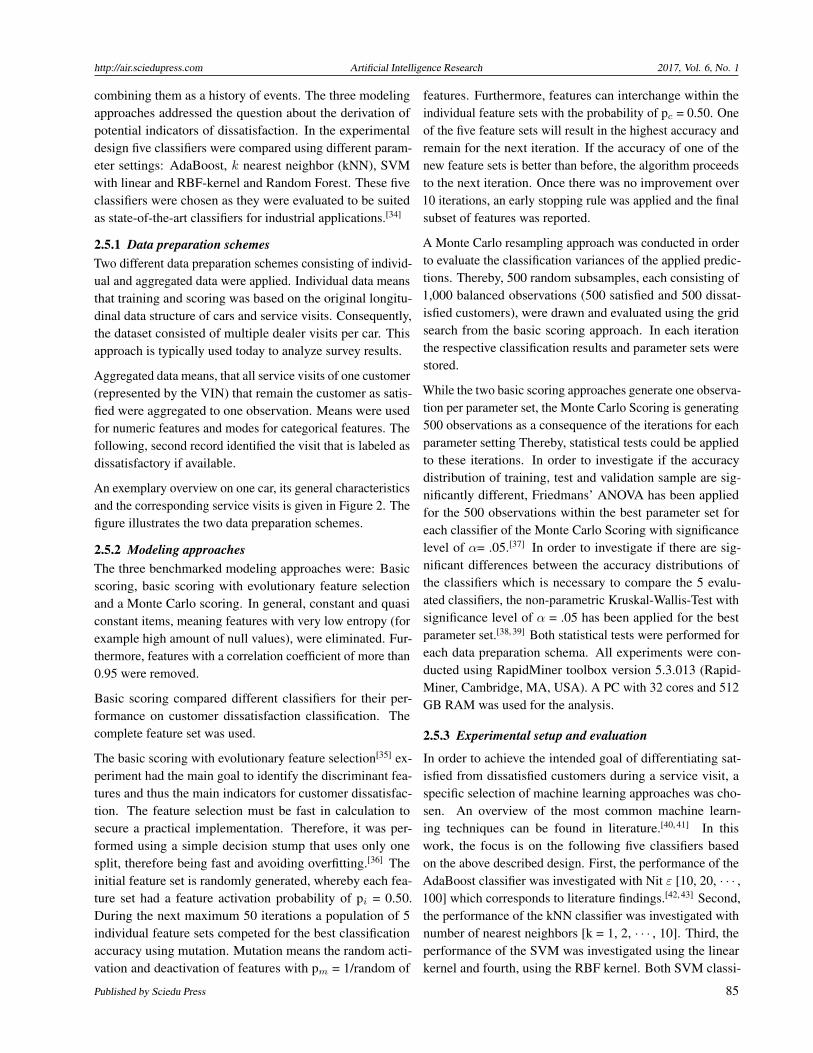
Table 2. Results of basic scoring on individual andaggregated data
Classifier Individual data Aggregated data
Test Validation Test Validation
AdaBoost 50.0 68.8 82.9 82.9 kNN 57.0 58.0 55.1 54.9 SVM (Linear) 72.3 70.8 80.4 81.7 SVM (RBF) 77.2 76.4 88.8 88.8 Random Forest 75.0 74.7 81.5 78.3
3. RESULTSThe results of the experimental design are presented in Ta-bles 2-4. The classifiers in the tables are sorted in alphabeticorder where the classifiers with the highest accuracy in test
and validation partition are marked. For the results of theMonte Carlo scoring in Table 4 the standard deviation σ isgiven in brackets over all iterations.
Table 2 presents the results for the basic scoring. The SVMusing the RBF kernel was the best performing classifierfor the individual as well as for the aggregated data witha test and validation accuracy of 77.2% (76.4%) and 88.8%(88.8%) respectively.
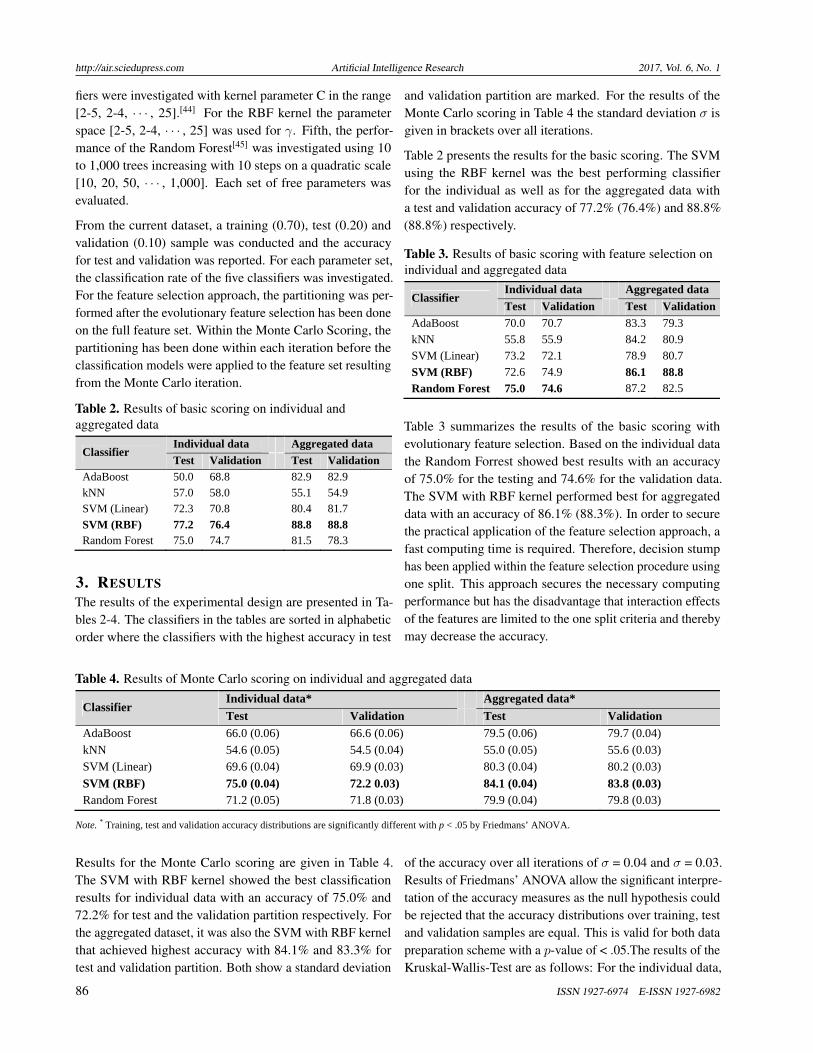
Table 3. Results of basic scoring with feature selection onindividual and aggregated data
Classifier Individual data Aggregated data
Test Validation Test Validation
AdaBoost 70.0 70.7 83.3 79.3 kNN 55.8 55.9 84.2 80.9 SVM (Linear) 73.2 72.1 78.9 80.7 SVM (RBF) 72.6 74.9 86.1 88.8 Random Forest 75.0 74.6 87.2 82.5
Table 3 summarizes the results of the basic scoring withevolutionary feature selection. Based on the individual datathe Random Forrest showed best results with an accuracyof 75.0% for the testing and 74.6% for the validation data.The SVM with RBF kernel performed best for aggregateddata with an accuracy of 86.1% (88.3%). In order to securethe practical application of the feature selection approach, afast computing time is required. Therefore, decision stumphas been applied within the feature selection procedure usingone split. This approach secures the necessary computingperformance but has the disadvantage that interaction effectsof the features are limited to the one split criteria and therebymay decrease the accuracy.
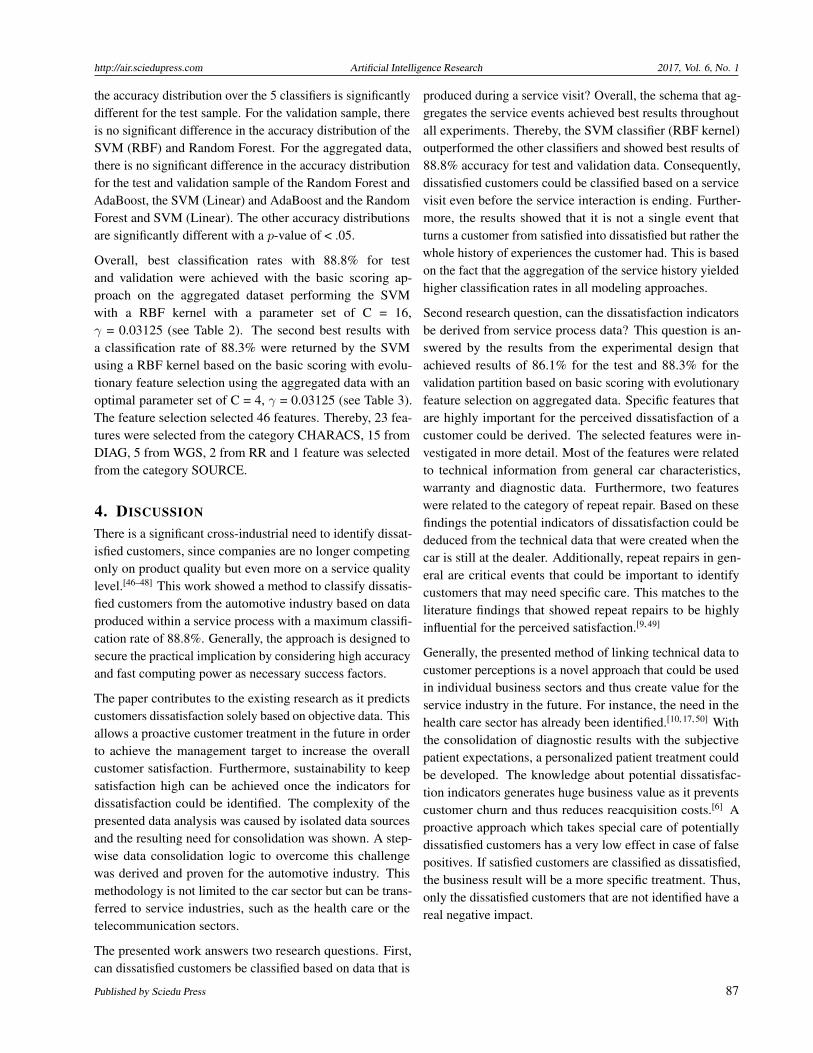
Table 4. Results of Monte Carlo scoring on individual and aggregated data
Classifier Individual data* Aggregated data*
Test Validation Test Validation
AdaBoost 66.0 (0.06) 66.6 (0.06) 79.5 (0.06) 79.7 (0.04) kNN 54.6 (0.05) 54.5 (0.04) 55.0 (0.05) 55.6 (0.03) SVM (Linear) 69.6 (0.04) 69.9 (0.03) 80.3 (0.04) 80.2 (0.03)
SVM (RBF) 75.0 (0.04) 72.2 0.03) 84.1 (0.04) 83.8 (0.03) Random Forest 71.2 (0.05) 71.8 (0.03) 79.9 (0.04) 79.8 (0.03)
Note. * Training, test and validation accuracy distributions are significantly different with p < .05 by Friedmans’ ANOVA.
Results for the Monte Carlo scoring are given in Table 4.The SVM with RBF kernel showed the best classificationresults for individual data with an accuracy of 75.0% and72.2% for test and the validation partition respectively. Forthe aggregated dataset, it was also the SVM with RBF kernelthat achieved highest accuracy with 84.1% and 83.3% fortest and validation partition. Both show a standard deviation
of the accuracy over all iterations of σ = 0.04 and σ = 0.03.Results of Friedmans’ ANOVA allow the significant interpre-tation of the accuracy measures as the null hypothesis couldbe rejected that the accuracy distributions over training, testand validation samples are equal. This is valid for both datapreparation scheme with a p-value of < .05.The results of theKruskal-Wallis-Test are as follows: For the individual data,
86 ISSN 1927-6974 E-ISSN 1927-6982
http://air.sciedupress.com Artificial Intelligence Research 2017, Vol. 6, No. 1
the accuracy distribution over the 5 classifiers is significantlydifferent for the test sample. For the validation sample, thereis no significant difference in the accuracy distribution of theSVM (RBF) and Random Forest. For the aggregated data,there is no significant difference in the accuracy distributionfor the test and validation sample of the Random Forest andAdaBoost, the SVM (Linear) and AdaBoost and the RandomForest and SVM (Linear). The other accuracy distributionsare significantly different with a p-value of < .05.
Overall, best classification rates with 88.8% for testand validation were achieved with the basic scoring ap-proach on the aggregated dataset performing the SVMwith a RBF kernel with a parameter set of C = 16,γ = 0.03125 (see Table 2). The second best results witha classification rate of 88.3% were returned by the SVMusing a RBF kernel based on the basic scoring with evolu-tionary feature selection using the aggregated data with anoptimal parameter set of C = 4, γ = 0.03125 (see Table 3).The feature selection selected 46 features. Thereby, 23 fea-tures were selected from the category CHARACS, 15 fromDIAG, 5 from WGS, 2 from RR and 1 feature was selectedfrom the category SOURCE.
4. DISCUSSION
There is a significant cross-industrial need to identify dissat-isfied customers, since companies are no longer competingonly on product quality but even more on a service qualitylevel.[46–48] This work showed a method to classify dissatis-fied customers from the automotive industry based on dataproduced within a service process with a maximum classifi-cation rate of 88.8%. Generally, the approach is designed tosecure the practical implication by considering high accuracyand fast computing power as necessary success factors.
The paper contributes to the existing research as it predictscustomers dissatisfaction solely based on objective data. Thisallows a proactive customer treatment in the future in orderto achieve the management target to increase the overallcustomer satisfaction. Furthermore, sustainability to keepsatisfaction high can be achieved once the indicators fordissatisfaction could be identified. The complexity of thepresented data analysis was caused by isolated data sourcesand the resulting need for consolidation was shown. A step-wise data consolidation logic to overcome this challengewas derived and proven for the automotive industry. Thismethodology is not limited to the car sector but can be trans-ferred to service industries, such as the health care or thetelecommunication sectors.
The presented work answers two research questions. First,can dissatisfied customers be classified based on data that is
produced during a service visit? Overall, the schema that ag-gregates the service events achieved best results throughoutall experiments. Thereby, the SVM classifier (RBF kernel)outperformed the other classifiers and showed best results of88.8% accuracy for test and validation data. Consequently,dissatisfied customers could be classified based on a servicevisit even before the service interaction is ending. Further-more, the results showed that it is not a single event thatturns a customer from satisfied into dissatisfied but rather thewhole history of experiences the customer had. This is basedon the fact that the aggregation of the service history yieldedhigher classification rates in all modeling approaches.
Second research question, can the dissatisfaction indicatorsbe derived from service process data? This question is an-swered by the results from the experimental design thatachieved results of 86.1% for the test and 88.3% for thevalidation partition based on basic scoring with evolutionaryfeature selection on aggregated data. Specific features thatare highly important for the perceived dissatisfaction of acustomer could be derived. The selected features were in-vestigated in more detail. Most of the features were relatedto technical information from general car characteristics,warranty and diagnostic data. Furthermore, two featureswere related to the category of repeat repair. Based on thesefindings the potential indicators of dissatisfaction could bededuced from the technical data that were created when thecar is still at the dealer. Additionally, repeat repairs in gen-eral are critical events that could be important to identifycustomers that may need specific care. This matches to theliterature findings that showed repeat repairs to be highlyinfluential for the perceived satisfaction.[9, 49]
Generally, the presented method of linking technical data tocustomer perceptions is a novel approach that could be usedin individual business sectors and thus create value for theservice industry in the future. For instance, the need in thehealth care sector has already been identified.[10, 17, 50] Withthe consolidation of diagnostic results with the subjectivepatient expectations, a personalized patient treatment couldbe developed. The knowledge about potential dissatisfac-tion indicators generates huge business value as it preventscustomer churn and thus reduces reacquisition costs.[6] Aproactive approach which takes special care of potentiallydissatisfied customers has a very low effect in case of falsepositives. If satisfied customers are classified as dissatisfied,the business result will be a more specific treatment. Thus,only the dissatisfied customers that are not identified have areal negative impact.
Published by Sciedu Press 87
http://air.sciedupress.com Artificial Intelligence Research 2017, Vol. 6, No. 1
5. SUMMARY AND OUTLOOK
This work provided an approach to answer two importantquestions that help the automotive industry to increase thecustomer satisfaction and thus securing competitive leads.Can dissatisfied customers be classified based on data that isproduced during a service visit? Can the dissatisfaction indi-cators be derived from service process data? In the presenteddata analysis procedure, the challenge of combining technicaldata from various sources with subjective survey responseswas solved with a specific data consolidation logic. An ex-perimental design consisting of three modeling approachescombined with two data preparation schemes was performedto answer the above research questions. The methodologythat classified customer dissatisfaction best was the SVMclassifier with a RBF kernel, which resulted in an accuracyof 88.8%. The indicators for dissatisfaction were identi-fied within the feature selection experiment and the SVMwith a RBF kernel setup achieved the best results. Knowingthese indicators allows a proactive customer treatment asdissatisfied customers can directly be identified before thecustomer-service interaction is completed. Thus, actions toincrease the satisfaction can be implemented immediatelyand secure a competitive advantage.
Furthermore, managerial implications can be derived basedon the dissatisfaction indicators that have been identified bythe evolutionary feature selection. In total, 46 indicatorsthat have a high influence on dissatisfaction were identified.Most of them are related to car characteristics, such as the carmodel. Thereby, individual customer treatment campaignscan be designed according to this information. Additionally,21 indicators were related to technical processes (diagnostics,warranty and data source information). Management can usethis information to optimize the internal technical processesas these have a significant influence on the perceived ser-vice quality. Furthermore, these technical indicators need tobe analyzed in detail in order to avoid service failures. Re-peat repairs can be one of these service failures. They wereidentified as a main dissatisfaction indicator. Managementshould develop campaigns to reduce the rate of repeat repairs,especially the customer perceived ones. Therefore, a trans-parent and detailed explanation of the conducted work by theservice advisors may be one opportunity. In general, the man-agement of the automotive industry can benefit significantly
from the derived indicators for dissatisfaction.
The presented approach is intended to be implemented inbusiness areas of the automotive industry. Therefore, the run-time of the application is of significant importance regardingthe practical use. In order to allow a short runtime, crossvalidation has not been performed for the evaluation of theclassifiers as this would increase the runtime significantlywith the available machine. Therefore, Monte Carlo Scor-ing and the split of all observations into three subsamples(training, test and validation) instead of two (only trainingand test) have been applied. Statistical tests were appliedto the Monte Carlo Scoring in order to investigate the sig-nificant comparison of the accuracy distributions. Furtherresearch should investigate the improvement of the classifi-cation rates by applying n-fold cross validation on a morepowerful hardware environment.
The developed approach allows to identify potentially dissat-isfied customers based on service process data received fromdealers. Thereby, it is possible to classify dissatisfied cus-tomers before the service interaction ends and the customeris leaving the dealer. However, in future service visits at adealer may decrease due to the implementation of remotefeatures in connected cars. Further research should makeuse of online data that will identifiy the status of the carand is transferred online from the cars the the automotivecompanies. Thereby, real time customer services can be es-tablished that react on potential failures in the car and solvethem online based on this received data.
The presented method was designed for the automotive in-dustry and will be of high importance for other service in-dustries. A closely related business where the approachmight be suitable for is the health care sector. Researchshowed that satisfying patient-physician interaction is highlyimportant to survive in the tough competition.[46] Diagnosticdata that were collected during the treatment could be con-solidated with patient satisfaction survey responses. Thus,dissatisfied patients may be classified and indicators for dis-satisfaction may be derived. The adaptation of the methodfor the health care sector and further industries should beinvestigated. Therefore, survey responses from other serviceindustries are needed and should be combined with serviceprocess data using the presented consolidation logic and theexperimental design.
REFERENCES
[1] Mearian L. Self-driving cars could create 1GB of data a second.Computerworld 2013 July Accessed on 09/08/2016. Available from:http://www.forbes.com/sites/bernardmarr/2016/05/24/
big-data-a-game-changer-in-healthcare/3/#633a02d97c0a
[2] Brito EPZ, Aguilar RLB, Brito LAL. Customer choice of a carmaintenance service provider: A model to identify the service
88 ISSN 1927-6974 E-ISSN 1927-6982
http://air.sciedupress.com Artificial Intelligence Research 2017, Vol. 6, No. 1
attributes that determine choice. International Journal of Opera-tions & Production Management. 2007; 27(5): 464-81. https://doi.org/10.1108/01443570710742366
[3] Hünecke P, Gunkel M. The influence of After-Sales service deter-minants on brand loyalty within the premium automotive industry:An empirical comparison of three countries. Service Science. 2012December; 4(4): 365-81. https://doi.org/10.1287/serv.1120.0029
[4] Gebauer H, Krempl R, Fleisch E. Service development in traditionalproduct manufacturing companies. European Journal of InnovationManagement. 2008 May; 11(2): 219-40. https://doi.org/10.1108/14601060810869875
[5] Gaiardelli P, Saccani N, Songini L. Performance measurement ofthe after-sales service network - evidence from the automotive in-dustry. Computers in Industry. 2007 September; 58(7): 698-708.https://doi.org/10.1016/j.compind.2007.05.008
[6] Xia GE, Jin WD. Model of customer churn prediction on supportvector machine. Systems Engineering-Theory & Practice. 2008 Jan-uary; 28(1): 71-7. https://doi.org/10.1016/S1874-8651(09)60003-X
[7] Bhattacharya CB. When customers are members: Customer retentionin paid membership contexts. Journal of the Academy of MarketingScience. 1998 December; 26(1): 31-44. https://doi.org/10.1177/0092070398261004
[8] Reichheld F, Sasser WJ. Zero defections: Quality comes to services.Harvard business review. 1990; 68(5): 105-11. PMid:10107082.
[9] Meinzer S, Prenninger J, Eberl M, et al. Increase customer satisfac-tion and quality management by applying predictive analytics ondiagnostic data. In: Text- and Data Mining for quality analytics inthe Automotive Industry, Heyer G, Luy JF, and Jahn A, eds., Leipzig,Germany; 2010 September. p. 17-27.
[10] Meinzer S, Prenninger J, Vesel P, et al. Translating satisfaction de-termination from health care to the automotive industry. ServiceBusiness. 2016 December; 10(4): 651-85. https://doi.org/10.1007/s11628-015-0284-z
[11] Müller W. Gaining competitive advantage through customer satis-faction. European Management Journal. 1991 June; 9(2): 201-11.https://doi.org/10.1016/0263-2373(91)90085-5
[12] Chougule R, Khare VR, Pattada K. A fuzzy logic based approachfor modeling quality and reliability related customer satisfaction inthe automotive domain. Expert Systems with Applications. 2013February; 40(2): 800-10. https://doi.org/10.1016/j.eswa.2012.08.032
[13] Kohl J, Kotucz A, Prenninger J, et al. Using multivariate split anal-ysis for an improved maintenance of automotive diagnosis func-tions. In: Proceedings of the 15th European Conference on Soft-ware Maintenance and Reengineering (CSMR). Mens T, Kanellopou-los Y, Winter A, eds., Oldenburg, Germany. 2011 March. p. 305-8.https://doi.org/10.1109/csmr.2011.42
[14] Datta P, Masand B, Mani D, et al. Automated cellular model-ing and prediction on a large scale. Artificial Intelligence Review.2000 December; 14(6): 485-502. https://doi.org/10.1023/A:1006643109702
[15] Gopal RK, Meher SK. Customer churn time prediction in mobiletelecommunication industry using ordinal regression. In: Pacific-AsiaConference on Knowledge Discovery and Data Mining, Springer:Lecture Notes in Computer Science. 2008; 5012: 884-9. https://doi.org/10.1007/978-3-540-68125-0_88
[16] Hung SY, Yen DC, Wang HY. Applying data mining to telecomchurn management: Expert Systems with Applications. 2006 Octo-ber; 31(3): 515-24. https://doi.org/10.1016/j.eswa.2005.09.080
[17] Yarnold PR, Michelson EA, Thompson DA, et al. Predicting patientsatisfaction: a study of two emergency departments. Journal of Be-havioral Medicine. 1998 December; 21(6): 545-63. PMid:9891254.https://doi.org/10.1023/A:1018796628917
[18] Sun BC, Adams J, Orav EJ, et al. Determinants of patient satisfactionand willingness to return with emergency care. Annals of EmergencyMedicine. 2000 May; 35(5): 426-34. https://doi.org/10.1016/S0196-0644(00)70003-5
[19] Boudreaux ED, Ary RD, Mandry CV, et al. Determinants of patientsatisfaction in a large, municipal ED: The role of demographic vari-ables, visit characteristics, and patient perceptions. American Journalof Emergency Medicine. 2000 July; 18(4): 394-400. PMid:10919526.https://doi.org/10.1053/ajem.2000.7316
[20] Mavridou E, Kehagias DD, Tzovaras D, et al. Mining affective needsof automotive industry customers for building a mass-customizationrecommender system. Journal of Intelligent Manufacturing. 2013April; 24(2): 251-65. https://doi.org/10.1007/s10845-011-0579-4
[21] Chan KY, Kwong C, Wong T. Modelling customer satisfaction forproduct development using genetic programming: Journal of Engi-neering Design. 2011 June; 22(1): 55-68. https://doi.org/10.1080/09544820902911374
[22] Lee JH, Park SC. Intelligent profitable customers segmentation sys-tem based on business intelligence tools. Expert systems with appli-cations. 2005 July; 29(1): 145-52. https://doi.org/10.1016/j.eswa.2005.01.013
[23] Salini S, Kenett RS. Bayesian networks of customer satisfactionsurvey data. Journal of Applied Statistics. 2009 October; 36(11):1177-89. https://doi.org/10.1080/02664760802587982
[24] Bandaru S, Deb K, Khare V, et al. Quantitative modeling of customerperception from service data using evolutionary optimization. In:Proceedings of the 13th annual conference on Genetic and evolution-ary computation, Krasnogor N, eds., Dublin, Ireland; 2011 July. p.1763-70. https://doi.org/10.1145/2001576.2001813
[25] Bandaru S, Gaur A, Deb K, et al. Development, analysis and appli-cations of a quantitative methodology for assessing customer satis-faction using evolutionary optimization. Applied Soft Computing.2015 May; 30: 265-78. https://doi.org/10.1016/j.asoc.2015.01.014
[26] Console L, Picardi C, Theseider-Dupré D. Temporal decision trees:model-based diagnosis of dynamic systems on-board. Journal ofArtificial Intelligence Research. 2003 July; 19: 469-512.
[27] Struss P, Price C. Model-based systems in the automotive industry.AI magazine. 2003 Winter; 24(4): 17-34.
[28] Broggi A, Berte S. Vision-based road detection in automotive sys-tems: A real-time expectation-driven approach. Journal of ArtificialIntelligence Research. 1995 December; 3: 325-48.
[29] Kehl M, Enzweiler M, Froehlich B, et al. Vision-Based Road SignDetection. In: Proceedings of the 18th International Conference onIntelligent Transportation Systems, Medina JJS, eds., Gran Canaria,Spain; 2015 Sep 15-18. p. 505-10. https://doi.org/10.1109/itsc.2015.89
[30] Prenninger J. Advanced Diagnostics and Predictive Analytics of Ve-hicle Data. In: Proceedings of the IECON 2013 - The 39th AnnualConference of the IEEE Industrial Electronics Society, Taiber J andHuang V, eds., Vienna, Austria; 2013 November 10-13. p. 1-21.
[31] Li Q, Mao Y. A review of boosting methods for imbalanced data clas-sification: Pattern Analysis and Applications. 2014 November; 17(4):679-93. https://doi.org/10.1007/s10044-014-0392-8
[32] Kotsiantis S, Kanellopoulos D, Pintelas P. Handling imbalanceddatasets-A review: GESTS International Transactions on ComputerScience and Engineering. 2006; 30(1): 25-36.
Published by Sciedu Press 89
http://air.sciedupress.com Artificial Intelligence Research 2017, Vol. 6, No. 1
[33] Garcia V, Sanchez J, Mollineda R, et al. The class imbalance problemin pattern classification and learning. In: Proceedings of the PatternAnalysis and Learning Group, Ferrer-Troyano FJ, eds., Castellón dela Plana, Spain; 2007 Summer. p. 283-91.
[34] Reif M, Shafait F, Goldstein M, et al. Automatic classifier selec-tion for non-experts. Pattern Analysis and Applications. 2014 Febru-ary; 17(1): 83-96. https://doi.org/10.1007/s10044-012-0280-z
[35] Wang CM, Huang YF. Evolutionary-based feature selection ap-proaches with new criteria for data mining: A case study of creditapproval data. Expert Systems with Applications. 2009 April; 36(3):5900-8. https://doi.org/10.1016/j.eswa.2008.07.026
[36] Shah M, Marchand M, Corbeil J. Feature selection with conjunctionsof decision stumps and learning from microarray data. IEEE transac-tions on Pattern Analysis and Machine Intelligence. 2012 January;34(1): 174-86. PMid:21576745. https://doi.org/10.1109/TPAMI.2011.82
[37] Rodríguez-Fdez I, Canosa A, Mucientes M, et al. STAC: A webplatform for the comparison of algorithms using statistical tests. In:Proceedings of the 2015 IEEE International Conference on FuzzySystems (FUZZ-IEEE). Yazici A, et al., eds., Istanbul, Turkey; 2015Aug 2-5. p. 1-8. https://doi.org/10.1109/fuzz-ieee.2015.7337889
[38] Kruskal WH, Wallis WA. Use of ranks in one-criterion variance anal-ysis. Journal of the American statistical Association. 1952 December;47(260): 583-621. https://doi.org/10.1080/01621459.1952.10483441
[39] McKight PE, Najab J. Kruskal-Wallis Test. In: The Corsini Ency-clopedia of Psychology, Weiner IB and Craighead WE, eds. 2010,John Wiley & Sons. https://doi.org/10.1002/9780470479216.corpsy0491
[40] Duda RO, Hart PE, Stork DG. Pattern Classification. Second ed.2000, New York, NY, USA: Willey-Interscience.
[41] Hastie T, Tibshirani R, Friedman J. The Elements of Statistical Learn-ing: Data Mining, Inference, and Prediction. Second ed. 2011, NewYork, NY, USA: Springer Series in Statistics.
[42] Polikar R. Bootstrap-inspired techniques in computational intelli-gence. IEEE Signal Processing Magazine. 2007 July; 24(4): 59-72.https://doi.org/10.1109/MSP.2007.4286565
[43] Schapire RE, Freund Y, Bartlett P, et al. Boosting the margin: Anew explanation for the effectiveness of voting methods. Annals ofStatistics. 1998 October; 26(5): 1651-86. https://doi.org/10.1214/aos/1024691352
[44] Wu KP,Wang SD. Choosing the kernel parameters for support vectormachines by the inter-cluster distance in the feature space. PatternRecognition. 2009 May; 42(5): 710-7. https://doi.org/10.1016/j.patcog.2008.08.030
[45] Oshiro TM, Perez PS, Baranauskas JA. How many trees in a randomforest?, In: Machine Learning and Data Mining in Pattern Recogni-tion. Lecture Notes in Computer Science, Vol. 7376, Perner P, eds.2012, Springer. p. 154-68. https://doi.org/10.1007/978-3-642-31537-4_13
[46] Corbin CL, Kelley SW, Schwartz RW. Concepts in service marketingfor healthcare professionals. The American Journal of Surgery. 2001January; 181(1): 1-7. https://doi.org/10.1016/S0002-9610(00)00535-3
[47] Sivakumar K, Li M, Dong B. Service quality: The impact of fre-quency, timing, proximity, and sequence of failures and delights.Journal of Marketing. 2014 January; 78(1): 41-58. https://doi.org/10.1509/jm.12.0527
[48] Yarris LM, Fu R, Frakes B, et al. How accurately can emer-gency department providers estimate patient satisfaction? WesternJournal of Emergency Medicine. 2012 September; 13(4): 351-7.PMid:22942936. https://doi.org/10.5811/westjem.2011.10.6644
[49] Biehal GJ. Consumers’ prior experiences and perceptions in autorepair choice. Journal of Marketing. 1983 Summer; 47(3): 82-91.https://doi.org/10.2307/1251199
[50] Holgers KM, Zöger S, Svedlund K. Predictive factors for devel-opment of severe tinnitus suffering-further characterisation. Inter-national Journal of Audiology. 2005 October; 44(10): 584-92.PMid:16315449. https://doi.org/10.1080/14992020500190235
90 ISSN 1927-6974 E-ISSN 1927-6982