can dynamic risk investing solve the defined-benefit … · standard of living in retirement ......
TRANSCRIPT
Can Dynamic Risk Investing Solve the
Defined-Benefit Conundrum
Tuesday, May 3, 2010
6:30 AM – 7:45 AM
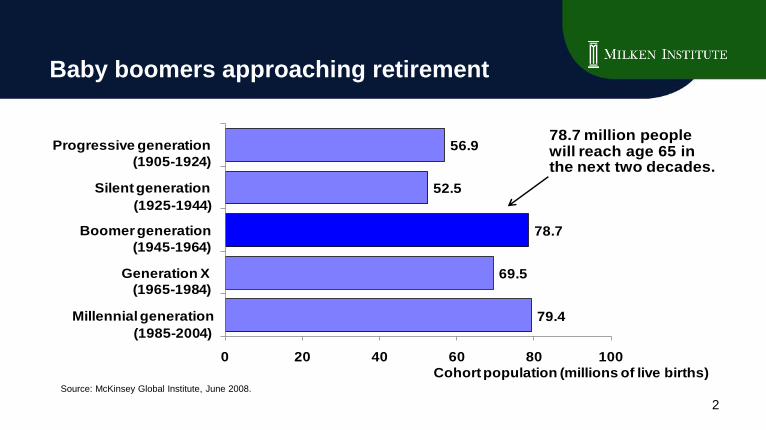
Baby boomers approaching retirement
Source: McKinsey Global Institute, June 2008.
79.4
69.5
78.7
52.5
56.9
0 20 40 60 80 100
Millennial generation
Generation X
Boomer generation
Silent generation
Progressive generation
Cohort population (millions of live births)
(1905-1924)
(1925-1944)
(1945-1964)
(1965-1984)
(1985-2004)
78.7 million people will reach age 65 in the next two decades.
2
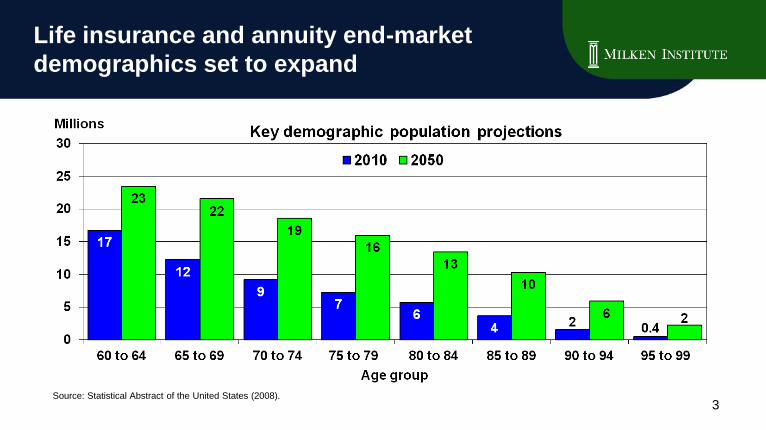
Life insurance and annuity end-market
demographics set to expand
Source: Statistical Abstract of the United States (2008).3
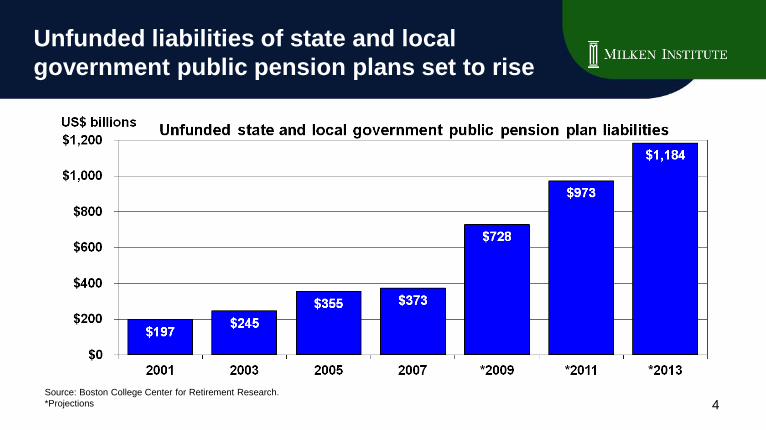
Unfunded liabilities of state and local
government public pension plans set to rise
Source: Boston College Center for Retirement Research.
*Projections 4
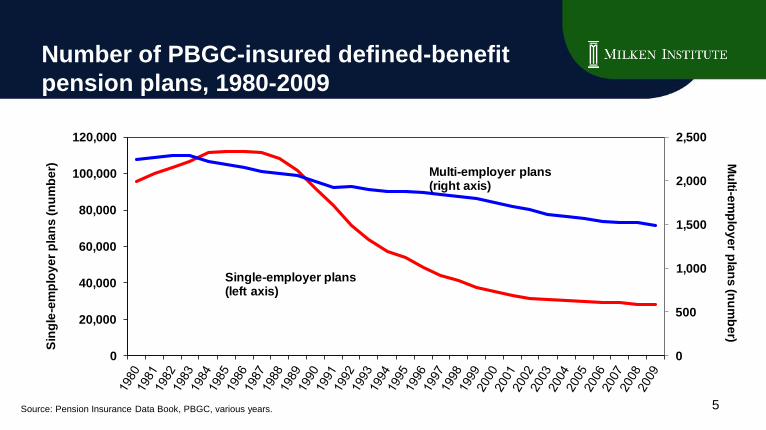
Source: Pension Insurance Data Book, PBGC, various years. 5
Number of PBGC-insured defined-benefit
pension plans, 1980-2009
0
500
1,000
1,500
2,000
2,500
0
20,000
40,000
60,000
80,000
100,000
120,000
Single-employer plans(left axis)
Multi-employer plans(right axis)
Mu
lti-em
plo
ye
r pla
ns
(nu
mb
er)
Sin
gle
-em
plo
ye
r p
lan
s (n
um
be
r)

Note: There are 354 companies in the S&P 500 with DB plans. The data are as of March 1, 2010.
Source: Credit Suisse.6
Distribution of the funded status of
S&P 500 companies’ DB plans
6
10
31 31
15
4 4
0
5
10
15
20
25
30
35
<50% 50-60% 60-70% 70-80% 80-90% 90-100% >100%
Pe
rce
nt o
f co
mp
an
ies
Funded ratio
Underfunded Overfunded
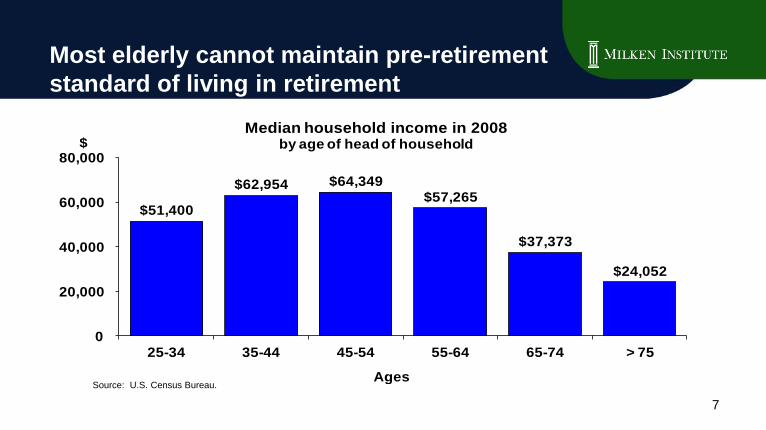
Most elderly cannot maintain pre-retirement
standard of living in retirement
$51,400
$62,954 $64,349 $57,265
$37,373
$24,052
0
20,000
40,000
60,000
80,000
25-34 35-44 45-54 55-64 65-74 > 75
$
Ages
Median household income in 2008by age of head of household
Source: U.S. Census Bureau.
7
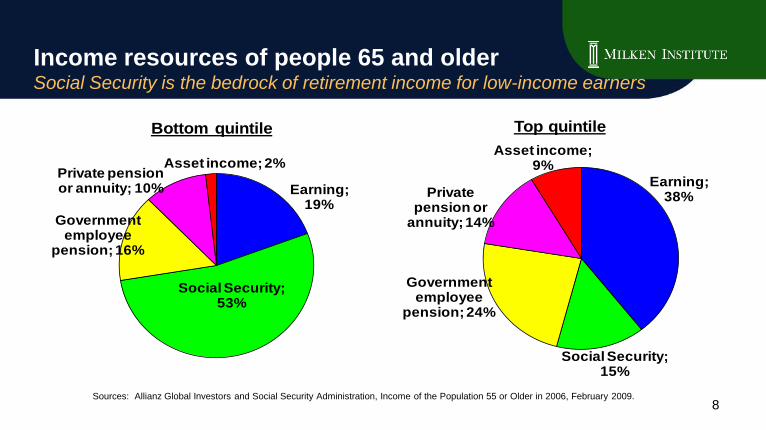
Income resources of people 65 and olderSocial Security is the bedrock of retirement income for low-income earners
Sources: Allianz Global Investors and Social Security Administration, Income of the Population 55 or Older in 2006, February 2009.
Bottom quintile
Social Security; 53%
Private pension or annuity; 10%
Asset income; 2%
Earning; 19%
Government employee
pension; 16%
Top quintile
Social Security; 15%
Private pension or
annuity; 14%
Asset income; 9%
Earning; 38%
Government employee
pension; 24%
8
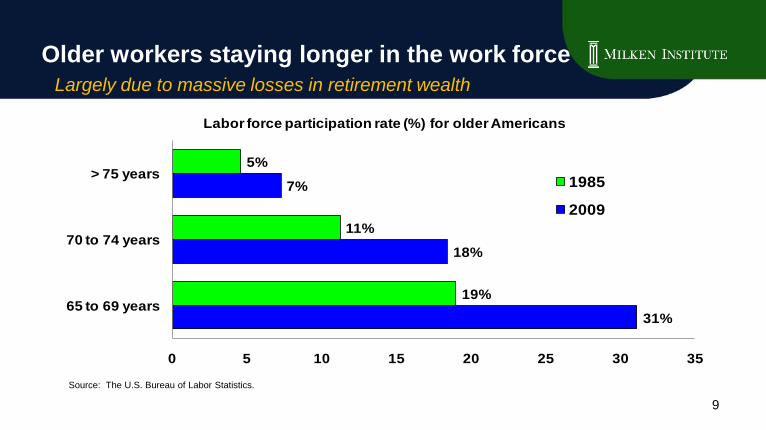
Older workers staying longer in the work force
Largely due to massive losses in retirement wealth
Source: The U.S. Bureau of Labor Statistics.
31%
18%
7%
19%
11%
5%
0 5 10 15 20 25 30 35
65 to 69 years
70 to 74 years
> 75 years
Labor force participation rate (%) for older Americans
1985
2009
9
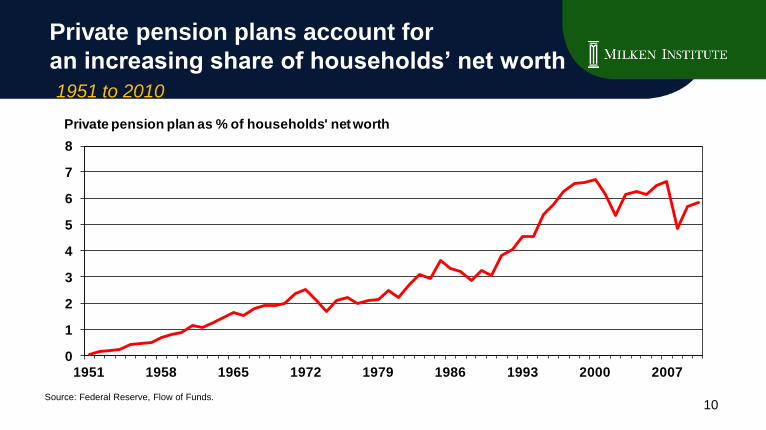
Private pension plans account for
an increasing share of households’ net worth
1951 to 2010
10Source: Federal Reserve, Flow of Funds.
0
1
2
3
4
5
6
7
8
1951 1958 1965 1972 1979 1986 1993 2000 2007
Private pension plan as % of households' net worth
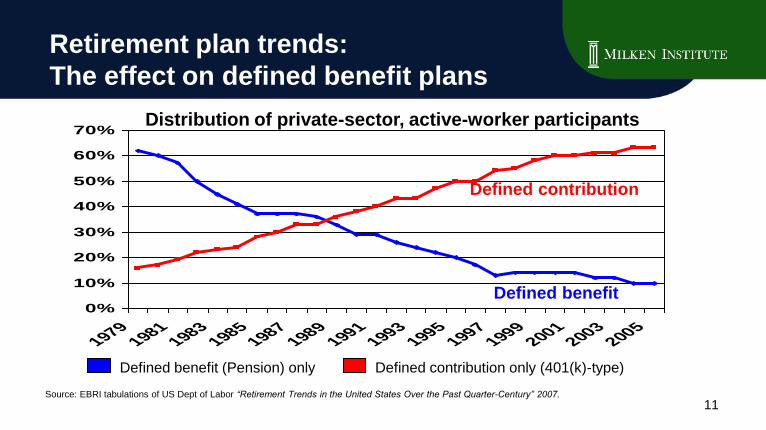
Retirement plan trends:
The effect on defined benefit plans
0%
10%
20%
30%
40%
50%
60%
70%
19791981
19831985
19871989
19911993
19951997
19992001
20032005
Defined benefit (Pension) only Defined contribution only (401(k)-type)
Source: EBRI tabulations of US Dept of Labor “Retirement Trends in the United States Over the Past Quarter-Century” 2007.
Defined benefit
Defined contribution
Distribution of private-sector, active-worker participants
11
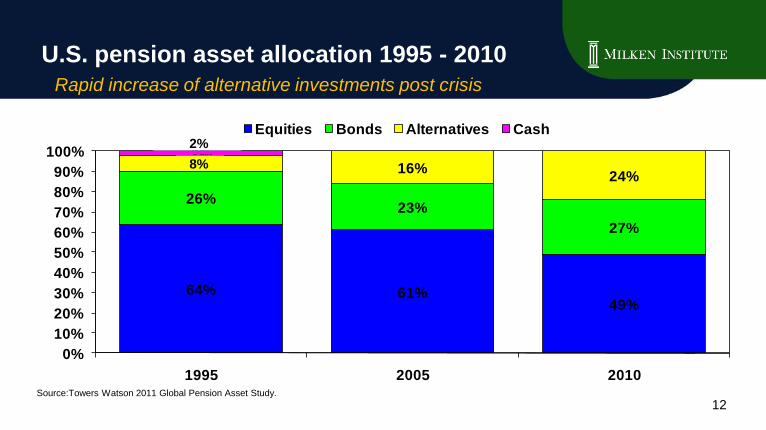
Source:Towers Watson 2011 Global Pension Asset Study.
12
64% 61%49%
26%23%
27%
8% 16%24%
2%
0%
10%
20%
30%
40%
50%
60%
70%
80%
90%
100%
1995 2005 2010
Equities Bonds Alternatives Cash
U.S. pension asset allocation 1995 - 2010
Rapid increase of alternative investments post crisis
8%
2%
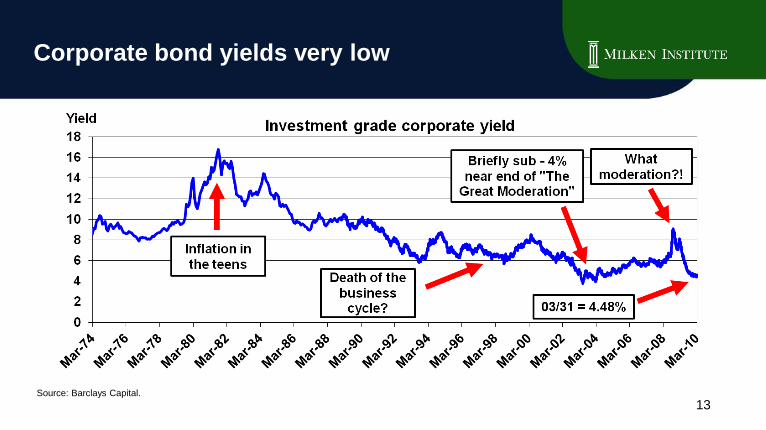
Corporate bond yields very low
Source: Barclays Capital.
13
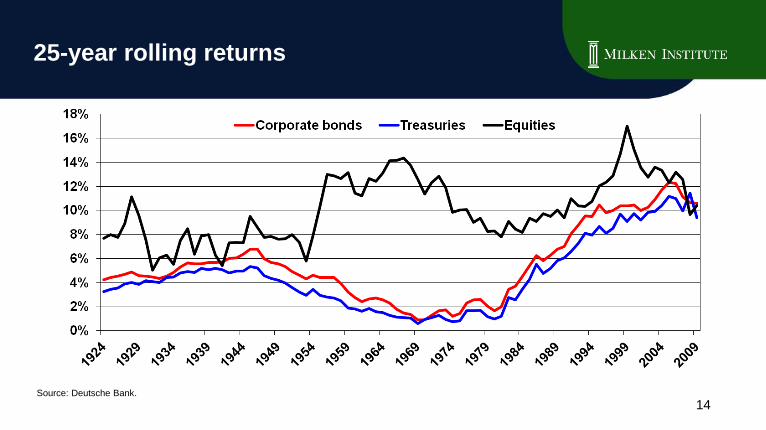
25-year rolling returns
Source: Deutsche Bank.
14
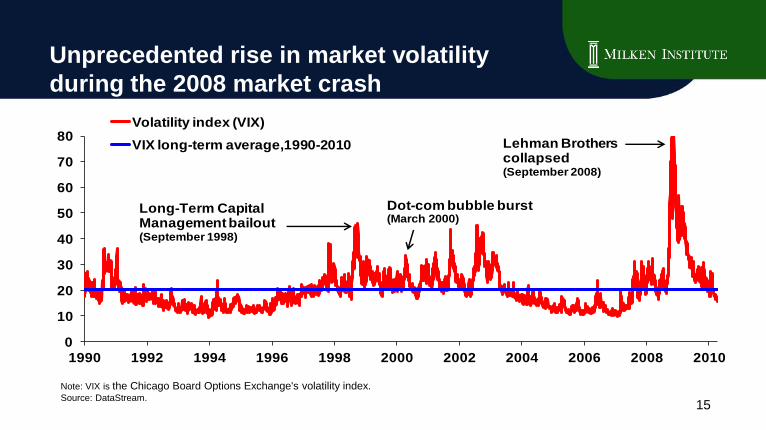
Unprecedented rise in market volatility
during the 2008 market crash
Note: VIX is the Chicago Board Options Exchange's volatility index. Source: DataStream.
0
10
20
30
40
50
60
70
80
1990 1992 1994 1996 1998 2000 2002 2004 2006 2008 2010
Volatility index (VIX)
VIX long-term average,1990-2010 Lehman Brotherscollapsed (September 2008)
Dot-com bubble burst (March 2000)
Long-Term Capital Management bailout (September 1998)
15
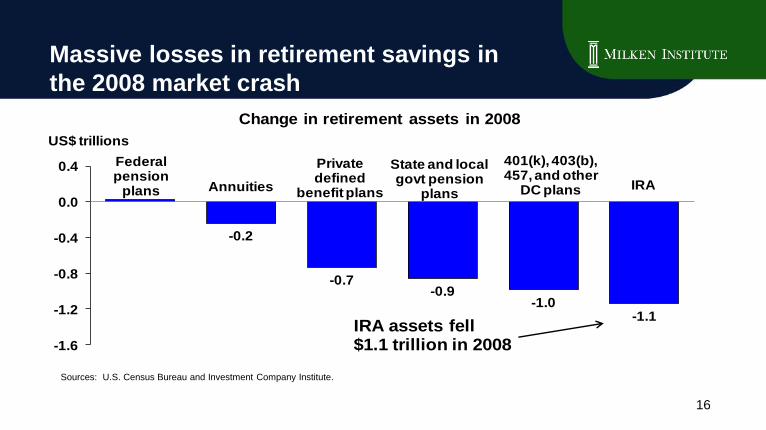
Massive losses in retirement savings in
the 2008 market crash
Sources: U.S. Census Bureau and Investment Company Institute.
-0.2
-0.7-0.9
-1.0-1.1
-1.6
-1.2
-0.8
-0.4
0.0
0.4
US$ trillions
Change in retirement assets in 2008
IRA
401(k), 403(b), 457, and other
DC plans
State and local govt pension
plans
Private defined
benefit plansAnnuities
Federalpension
plans
IRA assets fell $1.1 trillion in 2008
16
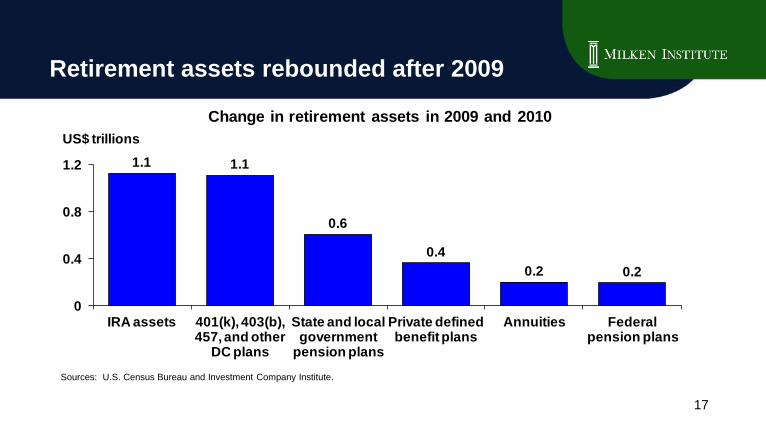
Retirement assets rebounded after 2009
17
Sources: U.S. Census Bureau and Investment Company Institute.
1.1 1.1
0.6
0.4
0.2 0.2
0
0.4
0.8
1.2
IRA assets 401(k), 403(b), 457, and other
DC plans
State and local government
pension plans
Private defined benefit plans
Annuities Federal pension plans
US$ trillions
Change in retirement assets in 2009 and 2010
Milken Conference
May 1, 2011
Dynamic Risk Investing
Kenneth Yip, PhD
Investor Science Group, LLC.
Please note that important information regarding the information and views expressed in this material at the end of this presentation under “Important Legal Information” and is available upon request
Copyright © 2006-2011, Investor Science Group, LLC. All rights reserved.This document, which is protected by copyright and other intellectual property rights, is confidential and has been prepared solely for the information of the person to whom it has been delivered on behalf of Investor Science Group, LLC.
It may not be reproduced, distributed, or used for any other purpose. Your acceptance of this document constitutes your acknowledgement of and agreement to abide by these terms and conditions.
Today’s discussion
I. The failure of conventional thinking
II. Dynamic risk investing: A new paradigm
III. Case study & implementation
19
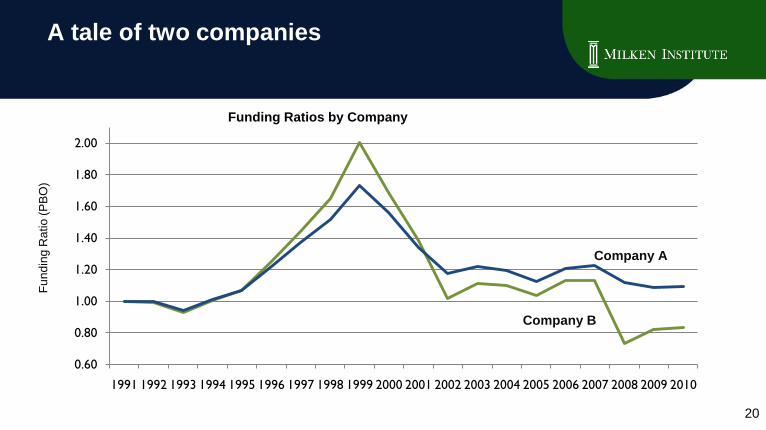
A tale of two companies
20
0.60
0.80
1.00
1.20
1.40
1.60
1.80
2.00
1991 1992 1993 1994 1995 1996 1997 1998 1999 2000 2001 2002 2003 2004 2005 2006 2007 2008 2009 2010
Funding Ratios by Company
Fu
nd
ing
Ratio
(P
BO
)
Company B
Company A
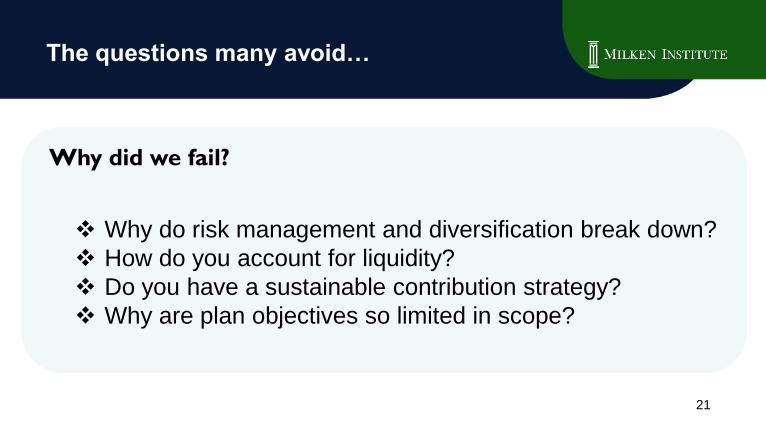
The questions many avoid…
Why did we fail?
Why do risk management and diversification break down?
How do you account for liquidity?
Do you have a sustainable contribution strategy?
Why are plan objectives so limited in scope?
21
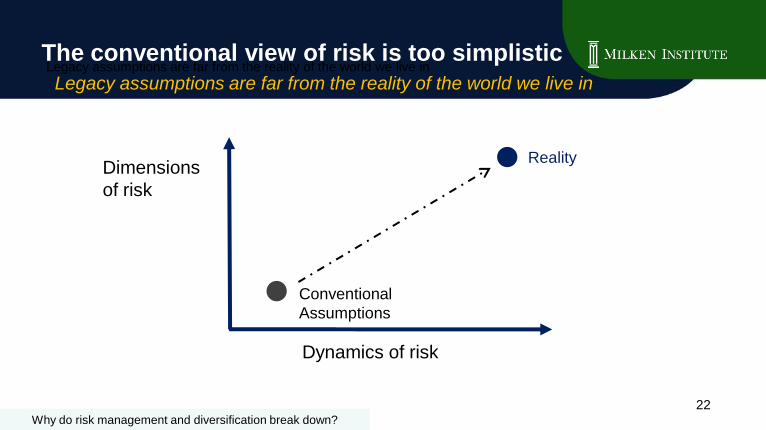
Dimensions
of risk
Dynamics of risk
Conventional
Assumptions
Reality
Legacy assumptions are far from the reality of the world we live in
Why do risk management and diversification break down?
22
The conventional view of risk is too simplistic
Legacy assumptions are far from the reality of the world we live in
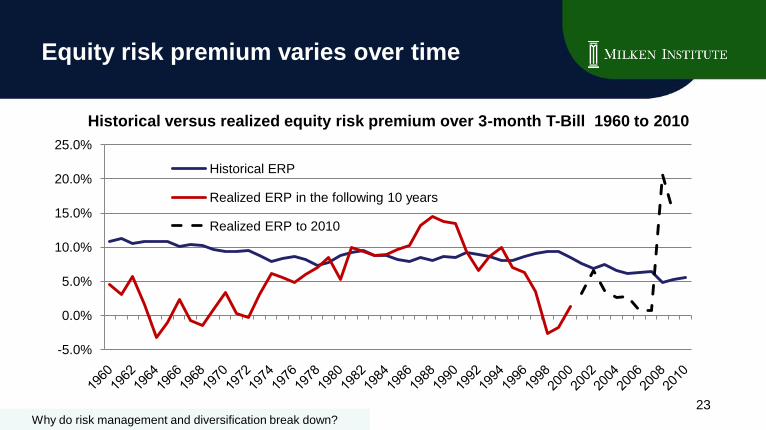
Equity risk premium varies over time
Historical versus realized equity risk premium over 3-month T-Bill 1960 to 2010
-5.0%
0.0%
5.0%
10.0%
15.0%
20.0%
25.0%
Historical ERP
Realized ERP in the following 10 years
Realized ERP to 2010
23Why do risk management and diversification break down?
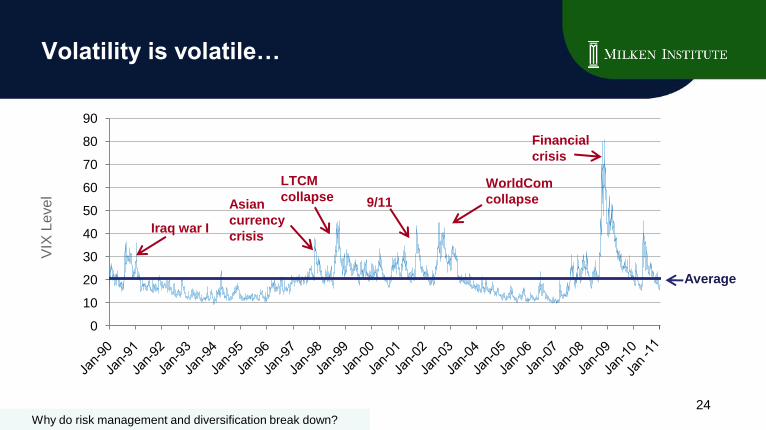
Volatility is volatile…
0
10
20
30
40
50
60
70
80
90
Iraq war I
Asian
currency
crisis
LTCM
collapse 9/11
WorldCom
collapse
Financial
crisis
Average
VIX
Leve
l
24Why do risk management and diversification break down?

Correlation is also volatile
Rolling 24-month correlation of S&P500 and long Government bond
-0.80
-0.60
-0.40
-0.20
0.00
0.20
0.40
0.60
0.80
Rolling 24-month Correlation Average Correlation25
Why do risk management and diversification break down?
0.00%
10.00%
20.00%
30.00%
40.00%
50.00%
60.00%
70.00%
Jun-9
2
Jan-9
3
Aug-9
3
Mar-
94
Oct-
94
Ma
y-9
5
Dec-9
5
Jul-96
Feb
-97
Sep-9
7
Apr-
98
Nov-9
8
Jun-9
9
Jan-0
0
Aug-0
0
Mar-
01
Oct-
01
Ma
y-0
2
Dec-0
2
Jul-03
Feb
-04
Sep-0
4
Apr-
05
Nov-0
5
Jun-0
6
Jan-0
7
Aug-0
7
Mar-
08
Oct-
08
Ma
y-0
9
Dec-0
9
Jul-10
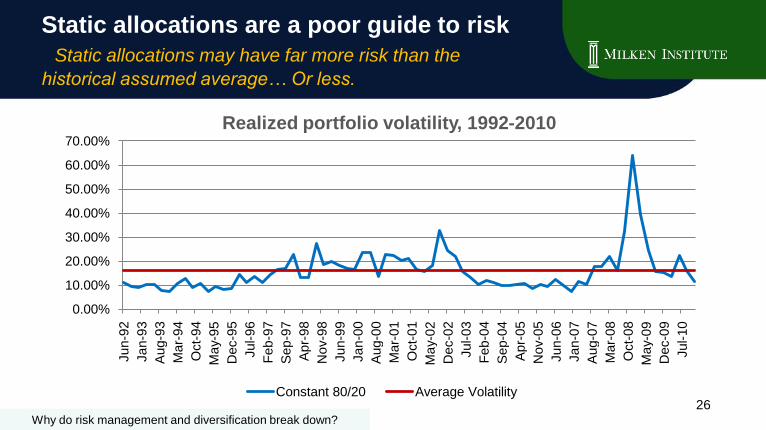
Constant 80/20 Average Volatility
Realized portfolio volatility, 1992-2010
26
Static allocations are a poor guide to risk
Static allocations may have far more risk than the
historical assumed average… Or less.
Why do risk management and diversification break down?
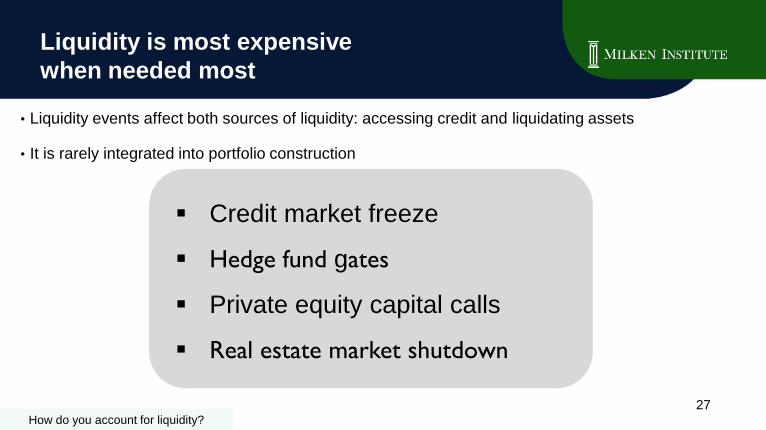
Liquidity is most expensive
when needed most
Credit market freeze
Hedge fund gates
Private equity capital calls
Real estate market shutdown
• Liquidity events affect both sources of liquidity: accessing credit and liquidating assets
• It is rarely integrated into portfolio construction
27How do you account for liquidity?
$-
$0.50
$1.00
$1.50
$2.00
$2.50
$3.00
60
70
80
90
100
110
120
130
1995 1996 1997 1998 1999 2000 2001 2002 2003 2004 2005 2006 2007 2008 2009 2010
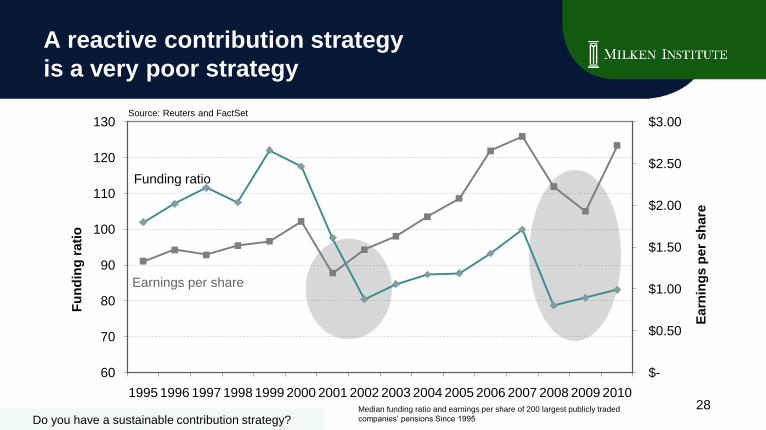
Do you have a sustainable contribution strategy?Median funding ratio and earnings per share of 200 largest publicly traded
companies’ pensions Since 1995
Source: Reuters and FactSet
Earn
ing
s p
er
sh
are
Fu
nd
ing
rati
o
Funding ratio
Earnings per share
28
A reactive contribution strategy
is a very poor strategy
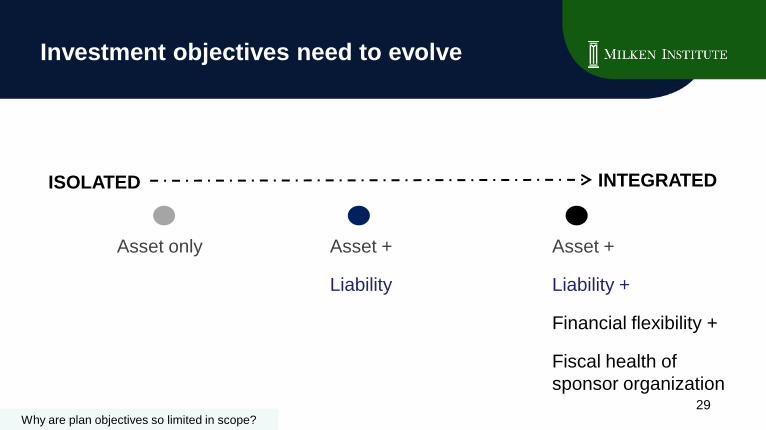
Investment objectives need to evolve
Asset only Asset +
Liability +
Financial flexibility +
Fiscal health of
sponsor organization
Asset +
Liability
ISOLATED INTEGRATED
Why are plan objectives so limited in scope?
29
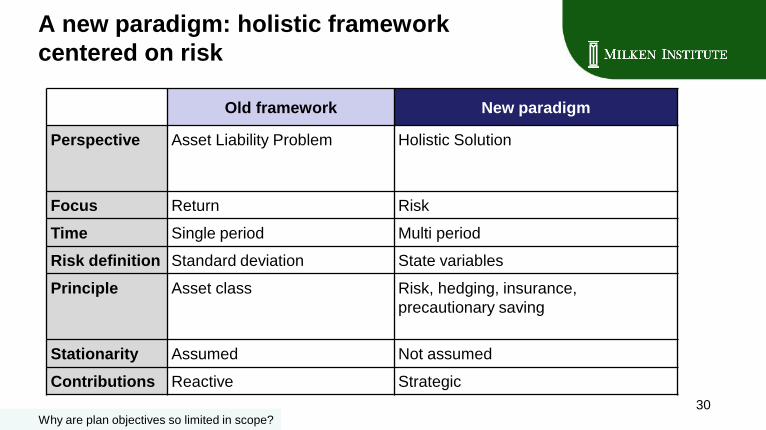
A new paradigm: holistic framework
centered on risk
Old framework New paradigm
Perspective Asset Liability Problem Holistic Solution
Focus Return Risk
Time Single period Multi period
Risk definition Standard deviation State variables
Principle Asset class Risk, hedging, insurance,
precautionary saving
Stationarity Assumed Not assumed
Contributions Reactive Strategic
Why are plan objectives so limited in scope?
30
I. The failure of conventional thinking
II. Dynamic risk investing: A new paradigm
III. Case study & implementation
Today’s discussion
31
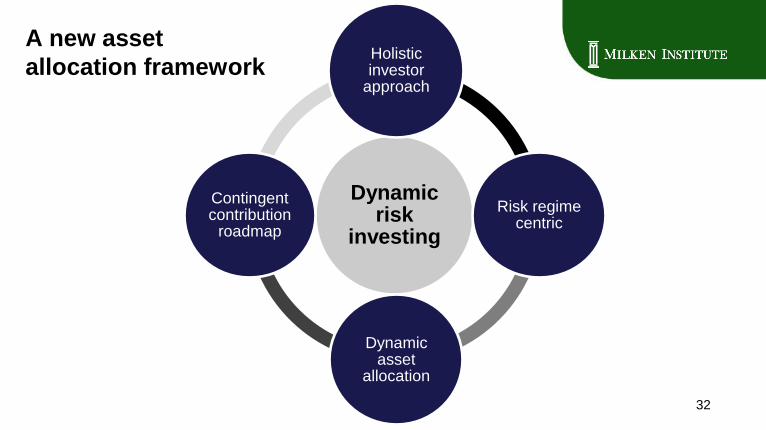
A new asset
allocation framework
32
Dynamic risk
investing
Holistic investor
approach
Risk regime centric
Dynamic asset
allocation
Contingent contribution
roadmap
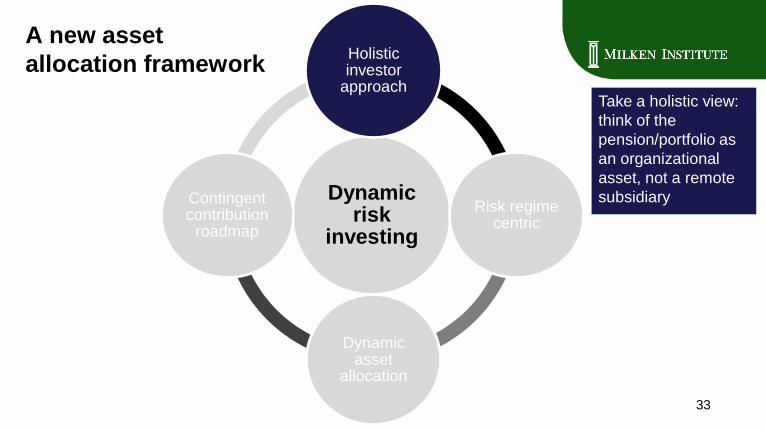
A new asset
allocation framework
Take a holistic view:
think of the
pension/portfolio as
an organizational
asset, not a remote
subsidiary
33
Dynamic risk
investing
Holistic investor
approach
Risk regime centric
Dynamic asset
allocation
Contingent contribution
roadmap
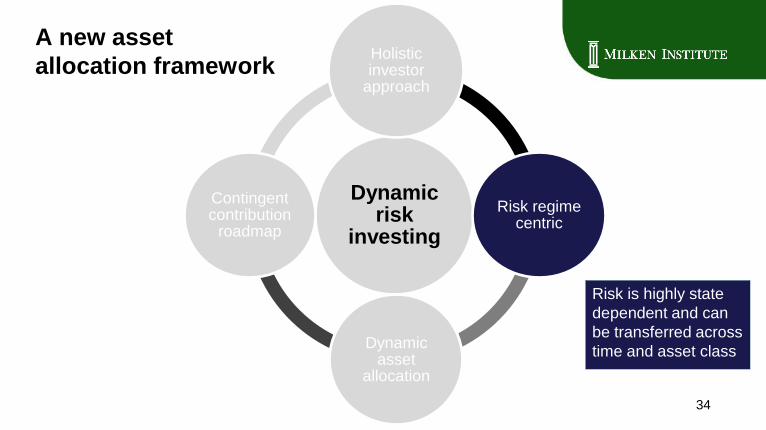
A new asset
allocation framework
Risk is highly state
dependent and can
be transferred across
time and asset class
Dynamic risk
investing
Holistic investor
approach
Risk regime centric
Dynamic asset
allocation
Contingent contribution
roadmap
34
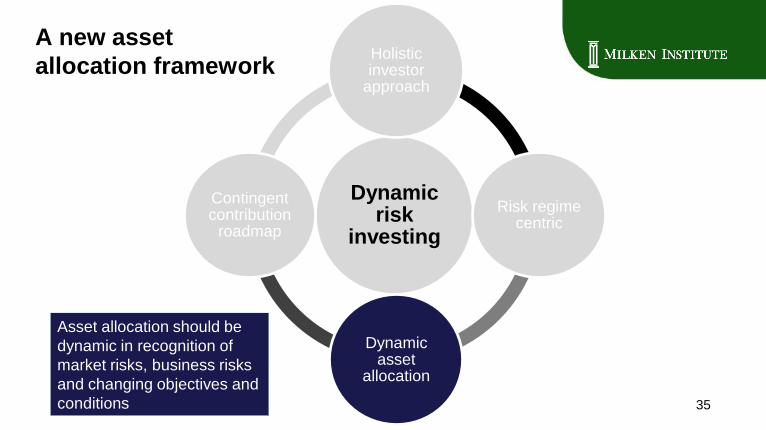
Asset allocation should be
dynamic in recognition of
market risks, business risks
and changing objectives and
conditions 35
A new asset
allocation framework
Dynamic risk
investing
Holistic investor
approach
Risk regime centric
Dynamic asset
allocation
Contingent contribution
roadmap
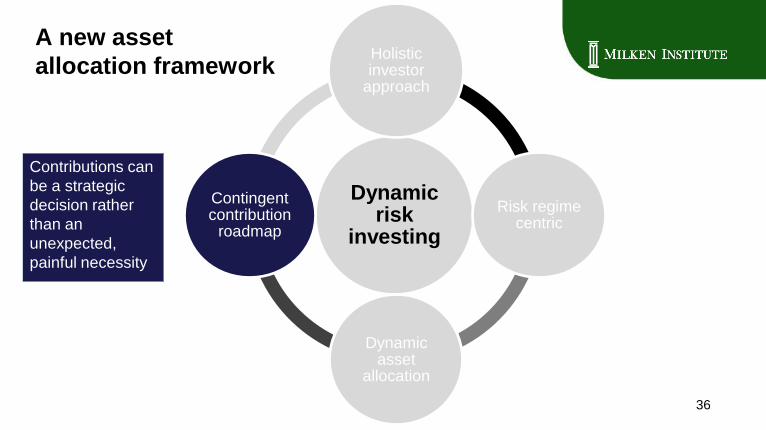
Contributions can
be a strategic
decision rather
than an
unexpected,
painful necessity
36
A new asset
allocation framework
Dynamic risk
investing
Holistic investor
approach
Risk regime centric
Dynamic asset
allocation
Contingent contribution
roadmap
Risk regime
framework
Dynamic multi-period
process
Forecast models
Alternatives
capabilities
– Non-Normal/Short
data histories
– Illiquid investments
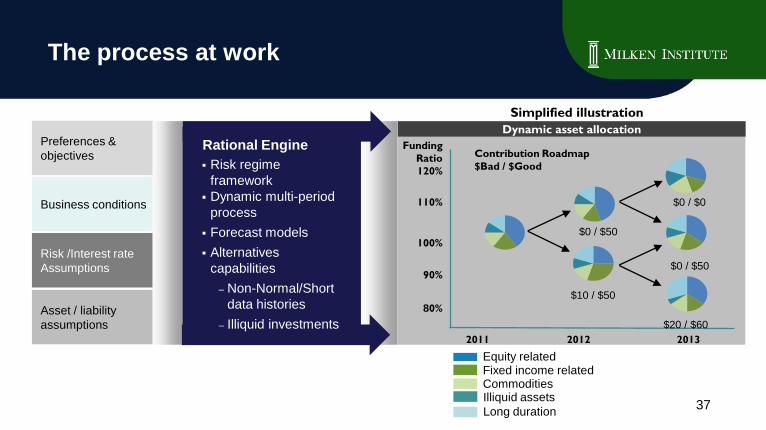
The process at work
Preferences &
objectives
Business conditions
Risk /Interest rate
Assumptions
Asset / liability
assumptions
Dynamic asset allocation
2011 2012 2013
Funding
Ratio
120%
110%
100%
90%
80%
Contribution Roadmap
$Bad / $Good
Simplified illustration
$0 / $50
$10 / $50
$0 / $0
$0 / $50
$20 / $60
Equity relatedFixed income relatedCommoditiesIlliquid assets
Long duration37
Rational Engine
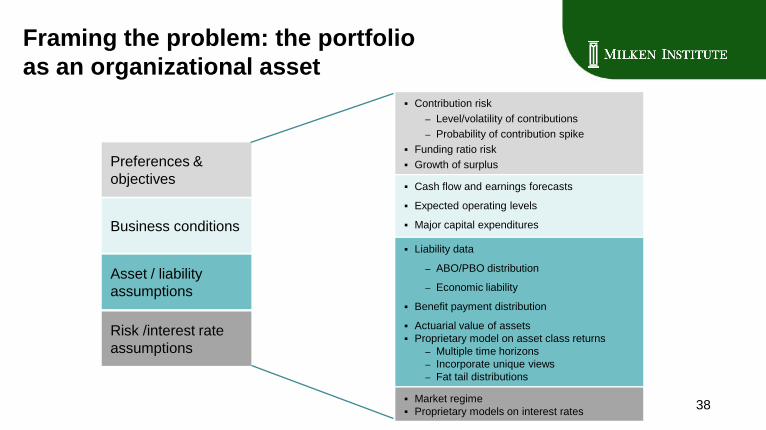
Framing the problem: the portfolio
as an organizational asset
Preferences &
objectives
Business conditions
Asset / liability
assumptions
Risk /interest rate
assumptions
Contribution risk
– Level/volatility of contributions
– Probability of contribution spike
Funding ratio risk
Growth of surplus
Cash flow and earnings forecasts
Expected operating levels
Major capital expenditures
Market regime
Proprietary models on interest rates
Liability data
– ABO/PBO distribution
– Economic liability
Benefit payment distribution
Actuarial value of assets
Proprietary model on asset class returns
– Multiple time horizons
– Incorporate unique views
– Fat tail distributions
38
Today’s discussion
39
I. The failure of conventional thinking
II. Dynamic risk investing: A new paradigm
III. Case study & implementation
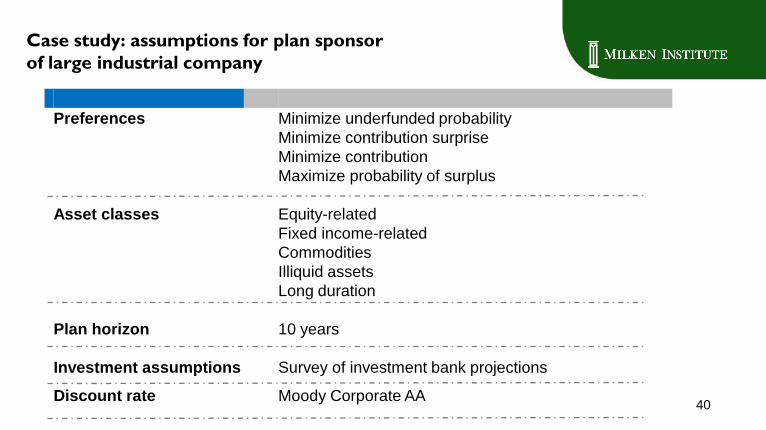
Case study: assumptions for plan sponsor
of large industrial company
Preferences Minimize underfunded probability
Minimize contribution surprise
Minimize contribution
Maximize probability of surplus
Asset classes Equity-related
Fixed income-related
Commodities
Illiquid assets
Long duration
Plan horizon 10 years
Investment assumptions Survey of investment bank projections
Discount rate Moody Corporate AA40
0
0.1
0.2
0.3
0.4
0.5
0.6
0.7
0.8
Pro
bability d
ensi
ty
Contribution ($ billion)
PV Cumulative Contribution
0.2 0.4 0.6 0.8 1.0 1.2 >1.2
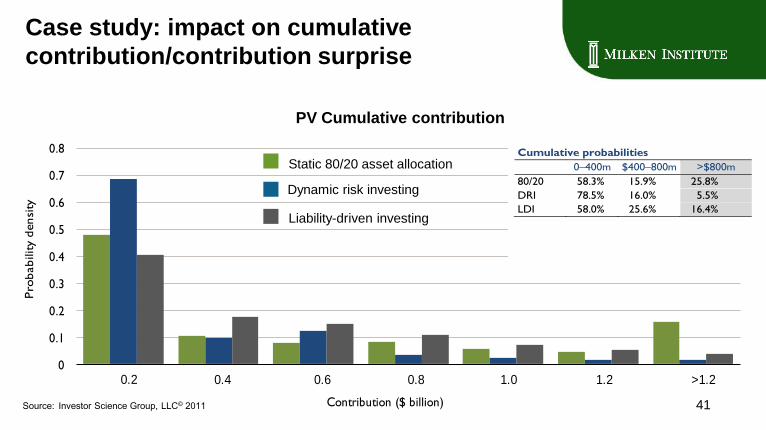
Case study: impact on cumulative
contribution/contribution surprise
Source: Investor Science Group, LLC© 2011 41
Cumulative probabilities
0–400m $400–800m >$800m
80/20 58.3% 15.9% 25.8%
DRI 78.5% 16.0% 5.5%
LDI 58.0% 25.6% 16.4%
Liability-driven investing
Static 80/20 asset allocation
Dynamic risk investing
PV Cumulative contribution
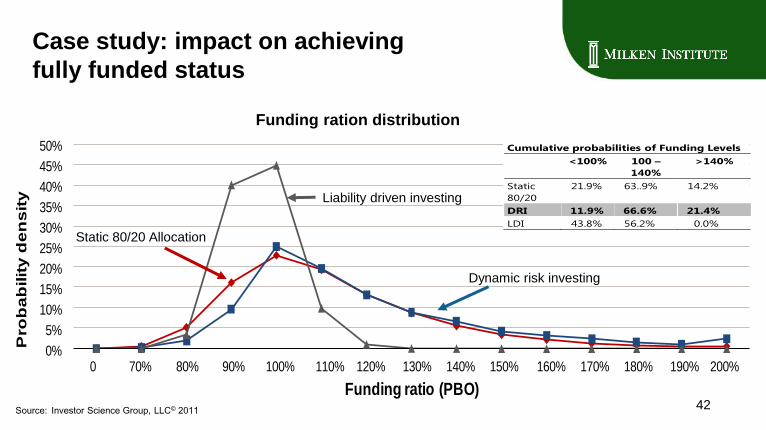
Case study: impact on achieving
fully funded status
0%
5%
10%
15%
20%
25%
30%
35%
40%
45%
50%
1 2 3 4 5 6 7 8 9 10 11 12 13 14 15
Pro
ba
bilit
y d
en
sit
y
Funding ratio (PBO)
Funding Ratio Distribution
0 70% 80% 90% 100% 110% 120% 130% 140% 150% 160% 170% 180% 190% 200%
Source: Investor Science Group, LLC© 2011
Liability driven investing
Static 80/20 Allocation
Dynamic risk investing
42
Cumulative probabilities of Funding Levels
<100% 100 –
140%
>140%
Static
80/20
21.9% 63..9% 14.2%
DRI 11.9% 66.6% 21.4%
LDI 43.8% 56.2% 0.0%
Funding ration distribution
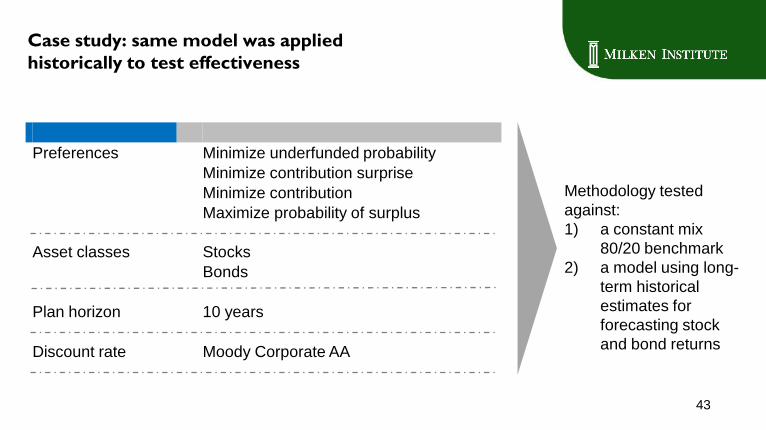
Case study: same model was applied
historically to test effectiveness
Preferences Minimize underfunded probability
Minimize contribution surprise
Minimize contribution
Maximize probability of surplus
Asset classes Stocks
Bonds
Plan horizon 10 years
Discount rate Moody Corporate AA
43
Methodology tested
against:
1) a constant mix
80/20 benchmark
2) a model using long-
term historical
estimates for
forecasting stock
and bond returns
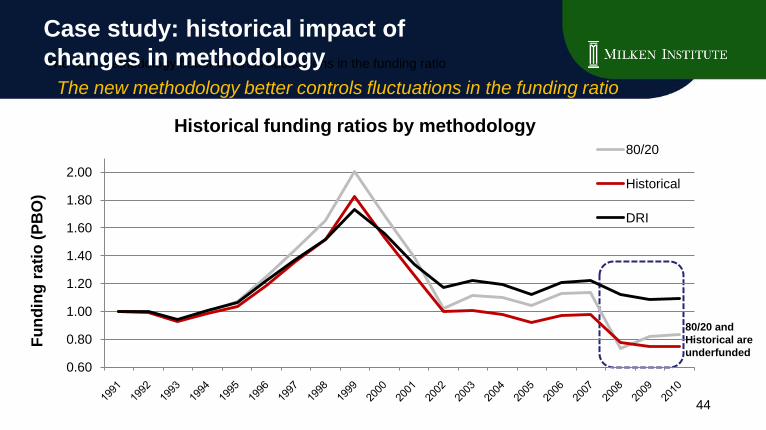
0.60
0.80
1.00
1.20
1.40
1.60
1.80
2.00
80/20
Historical
DRI
80/20 and
Historical are
underfunded
Historical funding ratios by methodology
Fu
nd
ing
ra
tio
(P
BO
)
The new methodology better controls fluctuations in the funding ratio
Case study: historical impact of
changes in methodology
The new methodology better controls fluctuations in the funding ratio
44
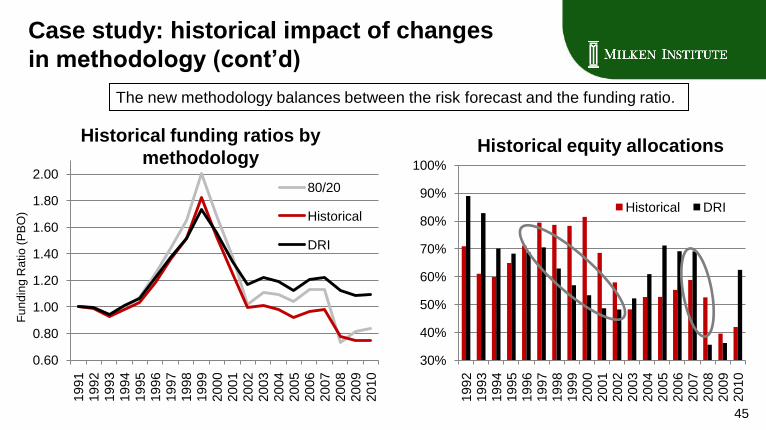
30%
40%
50%
60%
70%
80%
90%
100%
1992
1993
1994
1995
1996
1997
1998
1999
2000
2001
2002
2003
2004
2005
2006
2007
2008
2009
2010
Historical DRI
Case study: historical impact of changes
in methodology (cont’d)
Historical equity allocations
Fu
nd
ing
Ratio
(P
BO
)
Historical funding ratios by
methodology
The new methodology balances between the risk forecast and the funding ratio.
45
0.60
0.80
1.00
1.20
1.40
1.60
1.80
2.00
1991
1992
1993
1994
1995
1996
1997
1998
1999
2000
2001
2002
2003
2004
2005
2006
2007
2008
2009
2010
80/20
Historical
DRI
Takeaways
A tale of two companies:
» Conventional approach to asset-liability management
failed, plan dissolved
» Dynamic risk investing worked
A mind shift is necessary to understand and exploit risk
dynamically
Financial technology and decision framework innovation
allow us to harness the economic opportunities today 46
Speaker biography
Ken Yip is the founder and Chief Executive of Investor Science Group, a financial software and consulting firm
specializing in asset/liability management and investment solutions, designed primarily for large Pension Funds.
Before returning to Investor Science Group, Ken was Managing Director and head of the US Investment Solutions
Group at Credit Suisse Asset Management. Prior to founding the Investor Science Group in 2006, he co-founded
and was CIO of Thunder Bay Capital Management, New York, a multi-strategy quantitative hedge fund (AUM USD
110m). Before that, he was a Managing Director at Deutsche Asset Management and head of their Global Research
Center, where he was responsible for the development of next generation investment products and solution
processes to meet sophisticated asset/liability needs of major pension plan sponsors, corporations, endowment and
foundation, and wealthy families in the US, Europe, Australia and Asia.
Ken has been featured in Plan Sponsor magazine, The Wall Street Journal, and Australian Financial Review. He
has been an invited speaker at The Berkeley Program in Finance, The GARP Conference, Institutional Investor
Conference, GAIM Conference, CFA Societies, and Society of Actuaries Meetings.
Prior to joining the financial services industry, Ken was a Principal Research Scientist in the Artificial Intelligence
Laboratory and a visiting professor at MIT and before that was an Assistant Professor at Yale’s Department of
Computer Science, where he won the prestigious National Science Foundation Young Investigator Award, and the
Yale College Teaching Award for excellence in teaching undergraduate natural sciences. Ken holds a BS, MS, and
PhD in Computer Science from MIT.
Kenneth Yip, PhD
Founder, Investor Science Group, LLC
phone: 646 287 9478 email: [email protected]
47
Important legal information
There is no and will be no agreement, arrangement, or understanding that the information provided in connection herein will
be used as a primary basis for any investment decisions, including, without limitation, the purchase of any Investor Science
Group products or engagement of Investor Science Group consulting services. No person shall rely on this information as a
primary basis for any investment decision with respect to any employee benefit plan, including, without limitation, the
purchase of any Investor Science Group products or engagement of Investor Science Group consulting services on behalf of
such plan; and there is no, and will be no, agreement, arrangement, or understanding to the contrary.
This material has been prepared by Investor Science Group, LLC on the basis of publicly available information, internally
developed data and other third party sources believed to be reliable. However, no assurances are provided regarding the
reliability of such information. All opinions and views constitute judgments as of the date of writing, and are subject to change
at any time without notice. The investment views and market opinions/analyses expressed may not reflect those of Investor
Science Group, LLC as a whole and different views may be expressed based on different investment styles, objectives, views
or philosophies.
No graph or formula can, by itself, guarantee, promise or predict investment results. No graph or formula can
determine what securities should be bought or sold or when to buy or sell them, nor can it assist someone in making a
decision regarding security purchases or timing decisions. The data and information contained in this presentation is for
informational and illustrative purposes only. This material should not be viewed as a current or past recommendation or a
solicitation of an offer to buy or sell any securities or investment products or to adopt any investment strategy.
Investing entails risks, including possible loss of principal. Past performance is no guarantee of future results.
The use of leverage involves substantial risk. The more leverage that is employed by a market participant, the more likely a
substantial change will occur, either up or down, in the value of such market participant’s portfolio. The use of leverage to
acquire positions will subject a market participant to major losses in the event that market disruptions destroy the hedged
nature of such positions. 48