can a teacher really make a difference?
TRANSCRIPT
Can a Teacher Really Make a Difference?
James Reed CampbellGraduate School of EducationUniversity of Pennsylvania
Philadelphia, Pennsylvania 19174
Have you ever wondered what your classes are like with otherteachers? How about your best and your worst classes? Do otherteachers experience a similar sense of productivity with your bestclasses and, more importantly, a similar sense of difficulty with theuncooperative groups? For the difficult groups, are they equallyuncooperative with all their teachers? Can one teacher really makea difference with such a group?
In order to answer these questions, an interaction analysis studywas performed with two groups of students at extremes in the abilityrange in a suburban junior high school. One group was low in ability(mean IQ 85.5) and was considered by many to be the worst classin the school; and the other group was a high ability group (meanIQ 113) which was considered by the administration as one of thebest groups in the school. In terms of the groups’ interaction, thestudy attempted to isolate those elements of the class dialogue whichvaried or remained constant from teacher to teacher within the samegroup of youngsters. In the low ability group the subject areasrepresented were science, mathematics, and english. For the highability group the academic areas included science, mathematics, andsocial studies. For each group three different teachers were audiotapedand analyzed according to the Campbell-Rose (1973) Interaction System(CRIS).CRIS was developed within the framework of the ten-category
Flanders (1965) Interaction Analysis Category (FIAC) System. Thefirst digit of the CRIS system refers to one of the correspondingFIAC categories (Refer to Table I). By examining Table I the readerwill recognize that CRIS subscripts the teacher’s administration ofpraise, criticism, and his use of student ideas. Teacher questionsand all student-initiated dialogue are subdivided into cognitive memory,convergent, divergent, and evaluative categories. Confusion is alsosubdivided into productive and nonproductive categories, while silenceis isolated from both these variables. CRIS was constructed withinthe Flanders System so that all analyses could be performed in termsof the FIAC and then expanded to the more refined CRIS instrument.
Procedure
For each teacher a mean of 108 minutes of recording was tabulated.
657

658 School Science and Mathematics/
TABLE I: CAMPBELL-ROSE INTERACTION SYSTEM
Developed byJames Reed Campbell and Ryda D. Rose
Teacher Behaviors11 Teacher accepts student feelings or utilizes student emotion.20 Teacher uses short praise.21 Teacher encourages�short response.25 Teacher uses praise with reasons.30 Teacher accepts or uses student ideas�short response.31 Teacher accepts or uses student ideas�descriptive level.32 Teacher accepts or uses student ideas�inferential level.33 Teacher accepts or uses student ideas�generalization level.34 Teacher turns student ideas into a question for the class.41 Teacher asks cognitive memory question.42 Teacher asks convergent question.43 Teacher asks divergent question.44 Teacher asks evaluative question.54 Teacher asks rhetorical question�no answer accepted.55 Teacher lectures or gives his own opinion.60 Teacher gives directions.71 Teacher criticizes or rejects student answers�short response: "No," "Wrong,"
"That’s not right."72 Teacher rejects student ideas with reasons.73 Teacher criticizes or rejects student feelings or emotion�short response (disci-
plinary teacher behavior).74 Teacher criticizes or rejects student feelings or emotion with reasons (disciplinary
teacher behavior).
Student Behavior81 Student responds to teacher-initiated question on low level (cognitive memory
or convergent level).91 Student initiates question or comment on cognitive memory level.92 Student initiates question or comment on convergent level.93 Student initiates question or comment on divergent level.94 Student initiates question or comment on evaluative level.97 Student initiated argumentation (disciplinary backtalk).00 Silence01 Nonproductive confusion.02 Productive confusion.
A grand total of 4,974 tallies was cumulated for the low group, anda grand total of 7,958 tallies was tabulated for the high group.
Despite the differences in the total tabulation of tallies, the teamof observers spent one-third more time attempting to record dialoguein the low group. However, all three participating teachers wouldconduct group work for short periods of ten to thirty minutes andthen assign nonverbal seat work for the remainder of the forty-fiveminute period. The observers would simply have to stop recordingwhen seatwork commenced. The final tabulations represent an ade-quate sample of the verbal behavior which occurred in both groups.
Can a Teacher Really Make a Difference? 659
Results
Two levels of analyses will be used in this study. The first levelinvolves the analysis of the various interactive matrices and theiraccompanying ratios. This analysis has been called Microanalysis byCampbell (1973) because all the data have been compiled from thetwo unit sequences which are utilized in constructing the interactivematrices. The second level of analysis will involve the Macroanalysisprocess developed by Campbell. This process isolates the dominantpatterns derived from the interactive tallies. No matrices are involvedin this process since patterns are isolated directly.
Microanalysis
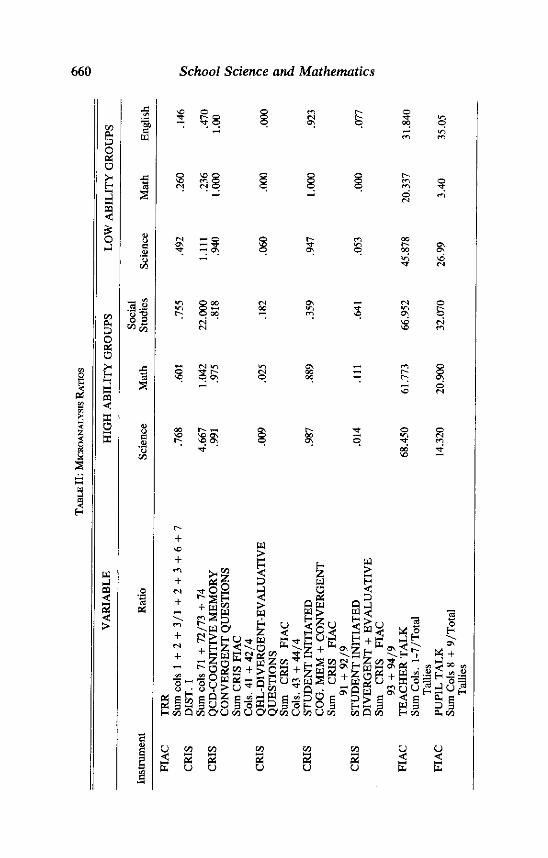
Microanalysis involves analyses based upon the interactive matricesof the six groups. Table II contains a series of ratios extracted fromthe columns, cells, or areas of these matrices.The first ratio in Table II is the TRR ratio. This ratio contains
the same variables as the familiar revised i/d ratio of the FlandersSystem (FIAC), but it follows the form i/i + d. The ’T’ is tabulatedby adding the teacher’s indirect categories (acceptance of ideas andfeelings and use of praise). The "d" is determined by tabulatingthe teacher’s direction and rejection behaviors. The TRR ratio is ameasure of the indirectness of the dialogue, the higher the ratio,the more indirect. Ratios of .600 are generally considered indirect,while ratios exceeding .700 are highly indirect. Ratios below .400are considered direct, and those below .300 are highly direct.The results of this study show that all the high ability classes had
indirect TRR ratios, however, the science and social studies teachershad highly indirect approaches. By contrast two of the low abilitygroups had highly direct TRR ratios, while the science teacher ofthis group had a somewhat neutral approach.
Several other indirect/direct ratios were also used to isolate dif-ferences between these two classes, but in all cases, the high abilitygroup teachers were found to be indirect, while the teachers of thelow ability group were found to be direct.The second ratio in Table II concerns a comparison of the teachers’
rejection of student ideas in relation to his or her rejection of behavior.The rejection of behavior is disciplinary behavior. The higher theratio, the more rejection is limited to ideas and not to the disciplinarybehavior of the youngsters. The three teachers of the high groupall had positive ratios. In fact, the social studies teacher had a veryhigh DIST 1 ratio. This means that disciplinary rejection is not dominantin the high group. This was also true for the science teacher of thelow group. However, the math and english teachers of the group
660School Science and Mathematics
S
1S2
|s§aS5
cp&§rt0
35<
2
20
0
5<ffiS
SOQ<
>
�g1M
^03S<uuc.s^’6CO
^32’§’-§^w
^03S
1.§^
I1
\o o Q m r-~. o�<^-(^.Q ^ r^i (^ ’^�<^^-; ’^t; 0 0 0^ 0 000
’ r-^ * ’ * ^ (^r^ m
’’Oc^O $ ^3 ^ c^Or^(MO o o o r^Tt
’- ’ - ’
S fn
fs) <�< ^^ ^^ (^»- (^T) 002^^^" ^ ^ ^ ^2^TT ’~^ CT\ ^3 CTN C5 00 0\
^ ’ * ’ ’ »r^ \Q�^Sr (^
�riOoo (N 0\ ^ (^0»nQ’-i oo w-i -<t >^r^r~-0oo �^-’ m so o\o
r^ ’ ’ ’ ’^o (N
(N SO (^1
^-<(M»n ^ o\ ’� ^2^00^ 0 00 »-< l^-C^
^* * ’ ’ r-; 0
^ (^
oot^»� ^ r^ ^ ooVOSOON 0 00 ^ TtC^I^SOON 0 ON 0 ’^W
’ Tl: ’ ’ ’ ’
S3
l^
+Mso r!
+ C . MW K. </3 5 ? ^+ Sg S S P^ ^o2 ^ o <,1^5^ < -(^ -^D
^ ^§a K3 gg g^ ^j .1
gefeeglE^dgE-lge^i^e^^e^Eg’""^aayOiaoWh^ao^-lOa E-ia3 p-l3 PoE-’w Q 1/3 0’U c^ U O^C^c^ U w U co co Q co ^ co Pi co
Ucoco co co co UU^22 2 2 2 ^S^Euu u u u fcfc

Can a Teacher Really Make a Difference? 661
both had high levels of disciplinary rejection.In terms of questions both groups used a predominance of cognitive
memory or convergent questions (QCD ratio). In fact, these typesof questions accounted for 100 per cent of all questions in two ofthe low group classes. The higher level divergent and evaluativequestions were used to some extent by the science teacher in thelow group, but were most extensively used by the social studies teacherin the high group. Similar findings are evident with the student-initiatedbehavior which was also categorized according to these levels. Over90 per cent of all student-initiated dialogue could be classified onthe cognitive memory and convergent levels for all of the low abilityclasses and for one of the high ability classes. Another high abilitygroup class approached the 90 per cent mark, and only the socialstudies teacher elicited widespread dialogue on divergent and evaluativelevels.
Since the student-initiated dialogue and the teacher’s questions wereboth subdivided according to the same set of cognitive levels, it ispossible to compare the cognitive level of the student-initiated dialoguewith the cognitive level of questions asked by the teacher. In mostcases the student-initiated talk was on a higher cognitive level thanthe percentages tabulated for the teacher’s questions.
In terms of variability, the high ability group differed significantlyfrom class to class, especially on divergent and evaluative levels.The cognitive level of the low ability group was somewhat homogeneousand did not vary significantly.
This table also contains the percentage of teacher talk used bythe six teachers. Not surprisingly, the teachers of the high groupapproached the two-thirds rule for teacher talk. Randers (1970) foundthat most teachers use approximately 68 per cent of teacher talk,and he has named this percentage "the two-thirds rule." The percent-ages of teacher talk in the three low ability classes were considerablylower�they averaged close to one-third of the dialogue. The reasonfor these differences were due to the amounts of nonproductiveconfusion which was tabulated for the low group. This is quantifiedby a 01/10 ratio which compares the percentage of all silence andconfusion which can be isolated as nonproductive. For the low group,two classes had values exceeding 95 per cent, while the high grouphad considerably lower tabulations.The final ratio on the table concerns the percentage of pupil talk.
Surprisingly, both groups had substantial tabulations in this area. Onlythe math teacher in the low group had a percentage which was verymuch different. Again, variability was greater for the low ability group.Summarizing the findings of this segment of the study we must
conclude that in terms of indirectness (nine indirect/direct ratios were
662 School Science and Mathematics
used) all teachers of the high ability group were indirect, while allbut one of the teachers of the low group were direct. Variabilitywas found to be greater for the low ability group on most measuresof indirectness. In terms of the cognitive level of the dialogue, wefind that the high ability classes utilized substantially more tabulationsof divergent and evaluative dialogue. Teacher talk was also muchhigher for the high ability group, while nonproductive confusion wasmuch more dominant in the low group.
Macroanalysis
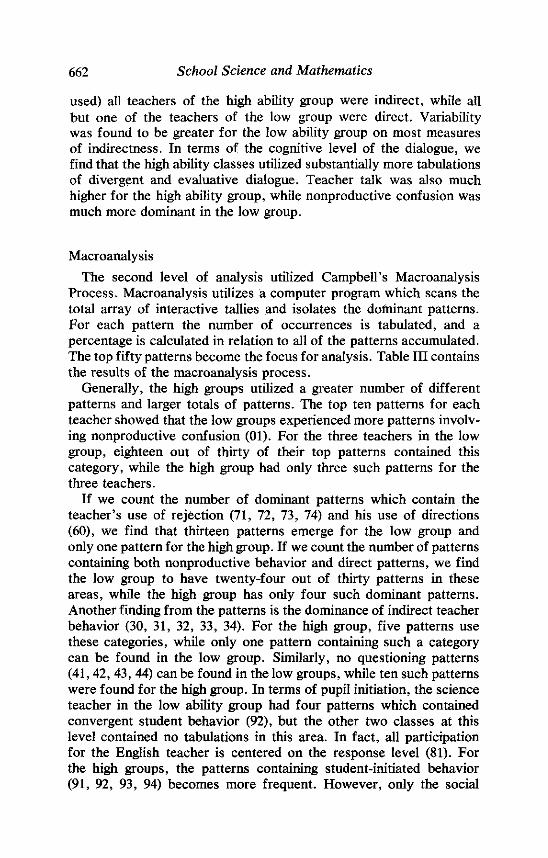
The second level of analysis utilized CampbelFs MacroanalysisProcess. Macroanalysis utilizes a computer program which scans thetotal array of interactive tallies and isolates the dofhinant patterns.For each pattern the number of occurrences is tabulated, and apercentage is calculated in relation to all of the patterns accumulated.The top fifty patterns become the focus for analysis. Table III containsthe results of the macroanalysis process.
Generally, the high groups utilized a greater number of differentpatterns and larger totals of patterns. The top ten patterns for eachteacher showed that the low groups experienced more patterns involv-ing nonproductive confusion (01). For the three teachers in the lowgroup, eighteen out of thirty of their top patterns contained thiscategory, while the high group had only three such patterns for thethree teachers.
If we count the number of dominant patterns which contain theteacher’s use of rejection (71, 72, 73, 74) and his use of directions(60), we find that thirteen patterns emerge for the low group andonly one pattern for the high group. If we count the number of patternscontaining both nonproductive behavior and direct patterns, we findthe low group to have twenty-four out of thirty patterns in theseareas, while the high group has only four such dominant patterns.Another finding from the patterns is the dominance of indirect teacherbehavior (30, 31, 32, 33, 34). For the high group, five patterns usethese categories, while only one pattern containing such a categorycan be found in the low group. Similarly, no questioning patterns(41,42, 43, 44) can be found in the low groups, while ten such patternswere found for the high group. In terms of pupil initiation, the scienceteacher in the low ability group had four patterns which containedconvergent student behavior (92), but the other two classes at thislevel contained no tabulations in this area. In fact, all participationfor the English teacher is centered on the response level (81). Forthe high groups, the patterns containing student-initiated behavior(91, 92, 93, 94) becomes more frequent. However, only the social

Can a Teacher Really Make a Difference?
.
i1|l
^
^
c/^
(^
10
fc$/-I
§8^i|0
0
5<
2a
00
§10
i<n0
§iC,
0
@
5�<
S
04-1
S1’S38C/3
04-4
^
04-1
’305
04-1
�5
I0
4-4
^
fc0
.§
^0
("�>’�imooosmc^»�ir^(N’’^�^^(^mmmr^r^r^’<T (^
^mc^r^r^r^Mf^mrsi*^0\’<tO\^^l>CT\’<!t^^mf^rslf^^r^fNfnr^»^0^’<^�0^rr^l^>(^’^t’’<t’<!f’nmr^r^r^^r^f^mr^^nO^��<!t0^r^»4nC�’�<!t’<t»^
o^^o�^�^-^^’l>o’-<oo^’<tt^^ot^m’n’n’^r^r^r^ ’� ’�<
l/^<�<(N)0(Sl(N(T-^»�lO’�l^O^soO^Or^msoopi/iT�ir^or’ir^^’�’T�’tS^O^soONOOor^O^-^r^r^or^Mr^’-ii�ir^(no’^’sO^o’^tmo’^t
m0(^mt^(^^-<0^t^r^-^^’tmrnmr^r^^l^. (N
«n»-<(N(S»-<r^»-<<^(^»^»n0^o\m<y\m0^tn(/^^-i(S)(^^-<(si^-i(s<ir»«r»^O’^-^r^C^ooOxn*^)u^^tN^^r’i’-ir’i^r^v^O’^^r^O\’^t"OV^O\
^t^^’^ON’^^ONOOr^«^f^f^f^<M(S(S’�i’�i’�i
Soooot^So^or^oooooF^ooooor^r^ooooooooor^ooo.r^oo
’-^^ONtnts’�iOsONt^r^^ri<5(N(s^(s^(S^-<^-’’-l’-<r^
’-^w^Q^�i^Qr^^-^’^-i1�4
o^^o^^t^9^9^x^ss89!^OV^Ot^O^O^OO^
^ a a s s a ?�; 2 s 2
5!!?S’?^S;’!?!oS;!f-^v^r^Qr^’^’^1^’-^’^0»n0s^50t^»^«n<^0^�|’^rl^^^’^r^<^<--lt^1�<0»^OS^DOO\»^0«nO
»^<Mf^’<t*^^r^ooa\o
§P^
^1W
§SgfflS
1^1fcafc0^
§
z
(M’sO
m5^
m(^(v^
§
^avo
(73
0<p
^fc0MPQS;D
^^�<e
SC^
p
^fc0@CQsz-1<
^

664 School Science and Mathematics
studies teacher has patterns on a divergent level (93). This patternranked second for this teacher.In addition to the fifteen most dominant patterns, the macroanalysis
process also enables us to isolate those three-tally patterns whichcontain transitions or interchanges among the teachers and theirstudents. One set of such patterns is the T-S-T patterns. These chainscontain two teacher statements (T’s) separated by a student statement(S). One T-S-T pattern that emerged was the familiar FIAC 4-8-3pattern. The "4" signifies a teacher question, the "S" signifies apredictable pupil response, and the "3" signifies the teacher’s useof the student’s idea. This FIAC pattern predominates in five outof six of the participating classes. The only teacher not to use thispattern was the science teacher of the low ability group. The scienceteacher of the high group used the pattern the most extensively.Unfortunately, this pattern does not represent any innovative interac-tion since it is limited to a rapid teacher question and a low levelstudent response. More productive patterns should include student-ini-tiated dialogue on highly cognitive levels. Only the social studiesteacher in the high ability group extensively utilized T-S-T patternswhich involved student-initiated dialogue (Categories 91, 92). Twoother teachers did use a limited number of T-S-T patterns involvingstudent-initiated dialogue; one was another teacher of the high group,and the other was the science teacher of the low group.Another type of three category patterns which contains interchanges
for the teacher and the students are the S-T-S patterns. These patternsinvolve two student statements separated by a teacher’s statement.
In terms of the S-T-S patterns, three of the teachers used theclarification pattern (92-34-92). This pattern involves the teacher’sinterrupting the student with an indirect clarification question (34).Surprisingly, the science teacher in the low group used this patternthe most extensively. This teacher was the only teacher of the lowgroup to use such a pattern. Furthermore, this individual exhibitedthe greatest repertoire of S-T-S patterns involving student-initiateddialogue.As a final note it is interesting to find that the math teachers in
both groups failed to use any S-T-S patterns.
Conclusions
The results of this study show that the interactive data from variousclasses within the same group do vary substantially. The degree ofvariation appears to be greater for a low ability group. The reasonfor the greater variation appears to be the differential effectivenessof the teachers. The science teacher in the low ability section did

Can a Teacher Really Make a Difference? 665
achieve a productive class in spite of the explosive nature of thisgroup. This feat must be considered an accomplishment. It certainlyprovided a sharp contrast to the interactive data produced by theother two teachers of this group. The observational team concludedthat these two classes accomplished little in their learning. Chaosand nonproductive behavior dominated both groups. Since the ob-servational team traveled with this group from teacher to teacher,the contrast between a productive class and a chaotic one becameall the more startling. These problem youngsters were like a packof hungry half-starved wolves with the math and English teachers,and like docile lambs with their science teacher. The schizophrenicnature of the group was a constant source of surprise to the observa-tional team. It should be added that this science teacher found thegroup to be a challenge and did develop a considerable affectionfor this group of youngsters.The high ability group experienced a greater degree of indirect
behavior but also less variation. The different classes were moresimilar, and all classes seemed to be productive. Here the differentialeffect of the individual teachers was not as great as that found inthe low group. Learning seemed to be taking place in all the classes.
This conclusion is somewhat surprisingwhenwe consider the numberof years of experience of the teachers in both groups. The districtpolicy of this school assigned their most experienced teachers to thislow ability group, and consequently, the mean number of years ofexperience for the teachers of this group was six years. The meannumber of years experience for the high group was two years. Thusthe experience factor did not help make the low group productive.Perhaps all the data of this study point to the tentative recommendationthat only specially motivated teachers with specific talents shouldbe assigned to teach the most difficult groups. Perhaps the high abilitygroups represent the least challenge, and possibly, learning takes placeregardless of the differential motivations and abilities of the teachers.Could it be that the high achieving, high ability students learn andprogress despite their teachers? Could it be that their own personalmotivation is sufficient for their academic growth? This is certainlynot the case for the problem students. These individuals face allacademic challenges with diminished resources and with very poortrack records. Their academic history is a long story of repeatedfailures. These are the youngsters that desperately need teachers whocan help them to make progress. It is here that teachers can reallymake a difference, not just in terms of academic success, but moreimportantly, in terms of helping to rectify the poor self-image theseyoungsters have acquired. This is where the greatest challenge isfound.
666 School Science and Mathematics
As a final note, it should be emphasized that a teacher’s inabilityto achieve productivity with one type of student does not mean thatthis teacher cannot function productively at another level. As anexample of this, the ineffective math and English teachers in thelow ability group were also observed teaching their highest abilitygroups. Here they were very indirect in terms of TRR ratios, andtheir classes showed imagination and very high motivation. At thislevel they were highly productive.
Perhaps all teachers are differentially effective with various typesof youngsters. Maybe this differential effectiveness should be deter-mined prior to assigning teachers to any specific level of youngsters.It certainly makes no sense to assign teachers "democratically" tosome classes at each ability level when they have proven themselvesto be ineffective with specific kinds of youngsters. The goal ofeducation should be to help each child progress to his fullest potentialand not to assign teachers as if no individual differences existedamong them. Although the democratic assignment of types of groupsappears to be a fair and worthwile process, it is simply not fair andworthwile in terms of the youngsters. Thus, the argument set forthin these conclusions is that the low ability discipline groups shouldreceive the top priority in a school, and only teachers who havedemonstrated proven effectiveness with them should be utilized. Inorder to make such a system work, a specific reward system mustbe established for teachers who are willing to put forth the extraeffort needed. Perhaps such rewards might include duty free assign-ments, smaller classes, fewer number of preparations, fewer classes,and "combat" pay.The challenge for education lies with the problem youngsters not
with the over-achieving and bright students.
REFERENCES
CAMPBELL, J. R. and R. D. ROSE. The Campbell-Rose Interaction System (CRIS), 1973,(mimeo).
CAMPBELL, J. R. Interpretive Ratios for the Campbell-Rose Interaction System (CRIS),1973, (mimeo).
CAMPBELL, J. R. "Macroanalysis a New Development for Interaction Analysis." Paperpresented to National Association for Researchers in Science Teaching, Detroit,1973.
FLANDERS, N. A. Interaction Analysis in the Classroom�A Manual for Observers.Michigan: University of Michigan, 1965.
FLANDERS, N. A. Analyzing Teacher Behavior. Reading, Mass.: Addison-Wesley Publish-ing Company, 1970.