camden county technical school-gtc … · camden county vocational sicklerville, nj 08081 camden...
TRANSCRIPT
1.00
Page 1 of 23
343 BERLIN CROSS KEYS ROAD
07-0700-040
CAMDENOVERVIEW
SICKLERVILLE, NJ 08081CAMDEN COUNTY VOCATIONAL
CAMDEN COUNTY TECHNICAL SCHOOL-GTC
State of New Jersey
09-12GRADE SPAN
2014-15
The New Jersey Department of Education (NJDOE) is pleased to present these annual reports of School Performance. These reports are designed to inform parents, educators and communities about how well a school is performing and preparing its students for college and careers.
In particular, the School Performance Reports seek to:
Focus attention on metrics that are indicative of college and career readiness. Benchmark a school's performance against other peer schools that are educating similar students, against statewide outcomes, and
against state targets to illuminate and build upon a school's strengths and identify areas for improvement. Improve educational outcomes for students by providing both longitudinal and growth data so that progress can be measured as part of
an individual school's efforts to engage in continuous improvement.
While the New Jersey School Performance Reports seek to bring more information to educators and stakeholders about the performance of schools, they do not seek to distill the performance of schools into a single metric, a single score, or a simplified conclusion. Instead, the intention is that educators and stakeholders will engage in deep, lengthy conversations about the full range of the data presented As educators know well, measuring school performance is both an art and a science. While the School Performance Report brings attention to important student outcomes, NJDOE does not collect data about other essential elements of a school, such as the provision of opportunities to participate and excel in extracurricular activities; the development of non-cognitive skills like time management and perseverance; the pervasiveness of a positive school culture or climate; or the attainment of other employability and technical skills, as many of these data are beyond both the capacity and resources of schools to measure and collect well.
To learn more about New Jersey’s school accountability system, please visit: <http://www.nj.gov/education/educators/>.
2.001.00
Page 2 of 23
343 BERLIN CROSS KEYS ROAD
07-0700-040
CAMDENDEMOGRAPHIC INFORMATION
SICKLERVILLE, NJ 08081CAMDEN COUNTY VOCATIONAL
CAMDEN COUNTY TECHNICAL SCHOOL-GTC
State of New Jersey
09-12GRADE SPAN
2014-15
Percent
Spanish 5.4%
Chinese 0.2%
Urdu 0.1%
Mon-Khmer languages 0.1%
Sino-Tibetan languages 0.1%
Other 0.2%
2014-15
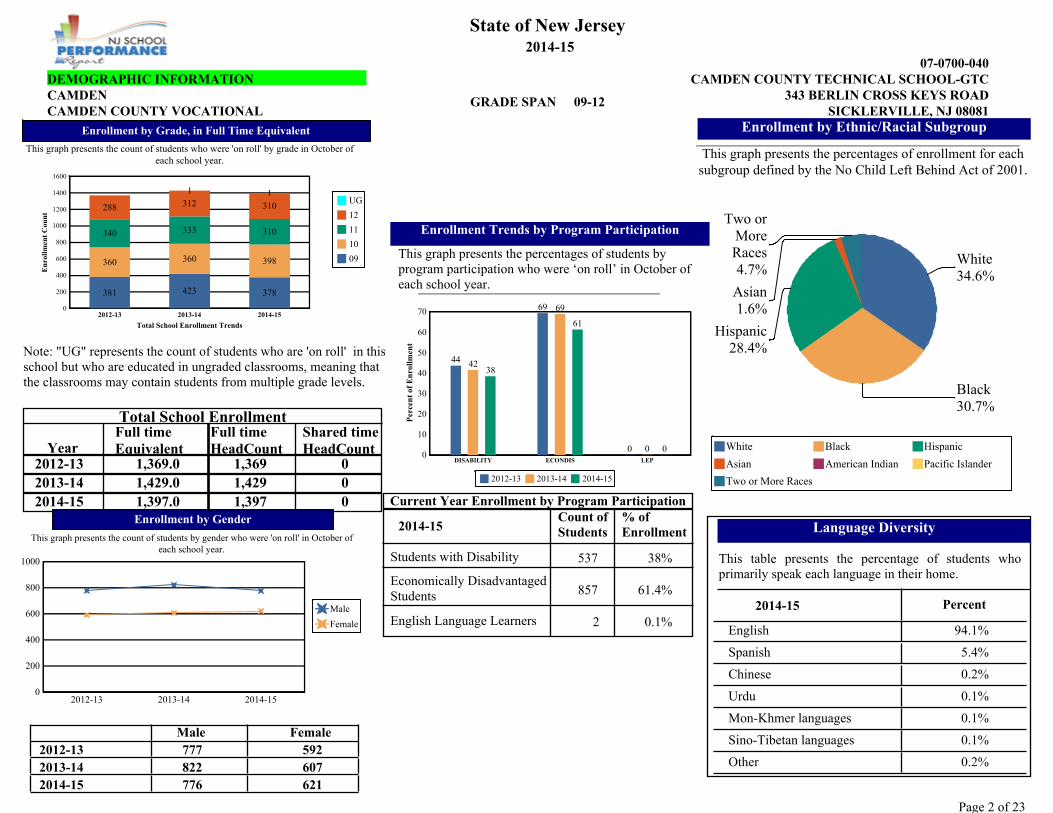
Language Diversity
This table presents the percentage of students who primarily speak each language in their home.
English 94.1%
2012-13 2013-14 2014-150
200
400
600
800
1000
Male
Female
Enrollment by Gender
This graph presents the count of students by gender who were 'on roll' in October ofeach school year.
6072013-146212014-15
5922012-13822776
Male Female777
Two orMoreRaces4.7%
Asian1.6%
White34.6%
Hispanic28.4%
Black30.7%
White Black Hispanic
Asian American Indian Pacific Islander
Two or More Races
This graph presents the percentages of enrollment for eachsubgroup defined by the No Child Left Behind Act of 2001.
Enrollment by Ethnic/Racial Subgroup
2012-13 2013-14 2014-15
Total School Enrollment Trends
En
roll
men
t C
oun
t
0
200
400
600
800
1000
1200
1400
1600
333
360
423
340 310
1
381
398360
3101
378
288 312 UG
12
11
10
09
Enrollment by Grade, in Full Time Equivalent
This graph presents the count of students who were 'on roll' by grade in October ofeach school year.
Note: "UG" represents the count of students who are 'on roll' in this school but who are educated in ungraded classrooms, meaning that the classrooms may contain students from multiple grade levels.
Year
Total School Enrollment
1,369.0 01,3691,429.0 01,4291,397.0 01,397
Full time Equivalent
Full time HeadCount
Shared time HeadCount
2012-132013-142014-15
Enrollment Trends by Program Participation
This graph presents the percentages of students by program participation who were ‘on roll’ in October of each school year.
DISABILITY ECONDIS LEP
Per
cen
t of
En
roll
men
t
0
10
20
30
40
50
60
7061
42
6969
0
38
0
44
0
2012-13 2013-14 2014-15
537 38%
857 61.4%
0.1%
2014-15
Current Year Enrollment by Program Participation% of Enrollment
Students with Disability
2
Count of Students
Economically Disadvantaged Students
English Language Learners
Page 3 of 23
343 BERLIN CROSS KEYS ROAD
07-0700-040
CAMDENSICKLERVILLE, NJ 08081CAMDEN COUNTY VOCATIONAL
CAMDEN COUNTY TECHNICAL SCHOOL-GTCACADEMIC ACHIEVEMENT
State of New Jersey
09-12GRADE SPAN
2014-15
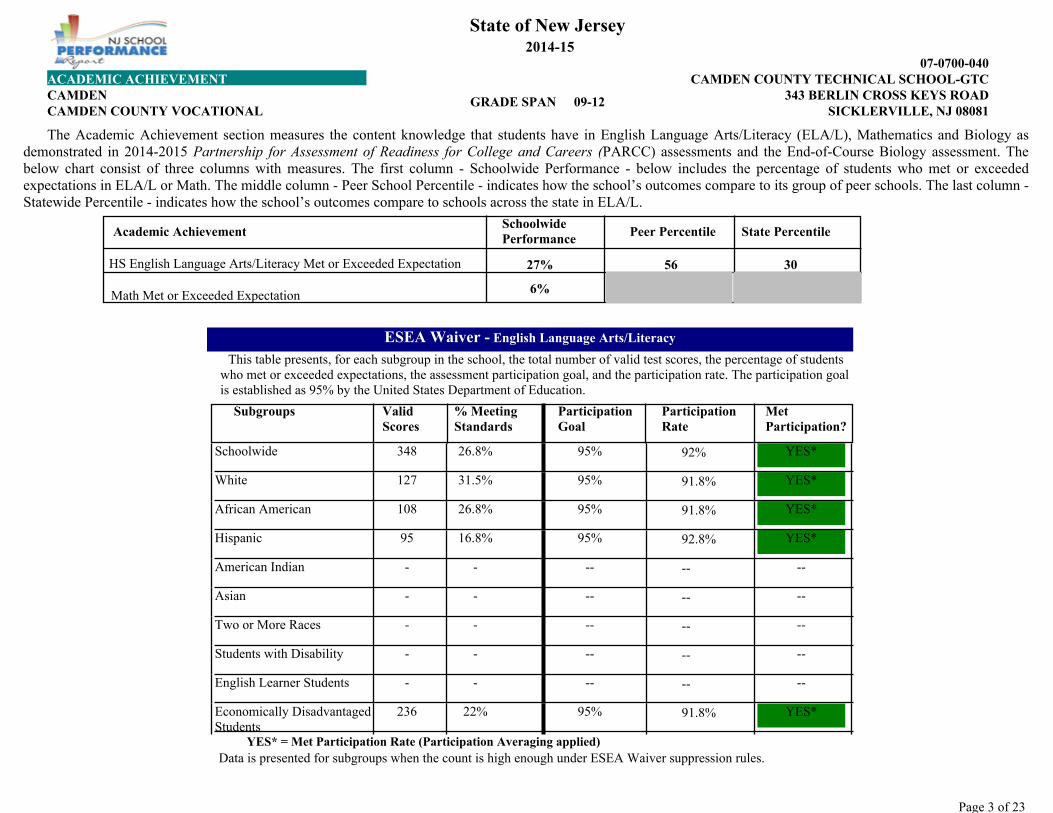
The Academic Achievement section measures the content knowledge that students have in English Language Arts/Literacy (ELA/L), Mathematics and Biology as demonstrated in 2014-2015 Partnership for Assessment of Readiness for College and Careers (PARCC) assessments and the End-of-Course Biology assessment. The below chart consist of three columns with measures. The first column - Schoolwide Performance - below includes the percentage of students who met or exceeded expectations in ELA/L or Math. The middle column - Peer School Percentile - indicates how the school’s outcomes compare to its group of peer schools. The last column - Statewide Percentile - indicates how the school’s outcomes compare to schools across the state in ELA/L.
6%
27% 3056
Academic Achievement Schoolwide Performance
HS English Language Arts/Literacy Met or Exceeded Expectation
Peer Percentile State Percentile
Math Met or Exceeded Expectation
This table presents, for each subgroup in the school, the total number of valid test scores, the percentage of students who met or exceeded expectations, the assessment participation goal, and the participation rate. The participation goal is established as 95% by the United States Department of Education.
92%
91.8%
91.8%
92.8%
--
--
--
--
--
91.8%
ESEA Waiver - English Language Arts/Literacy
95%348 26.8% YES*
95%127 31.5% YES*
95%108 26.8% YES*
95%95 16.8% YES*
--- - --
--- - --
--- - --
--- - --
--- - --
95%236 22% YES*
Data is presented for subgroups when the count is high enough under ESEA Waiver suppression rules.YES* = Met Participation Rate (Participation Averaging applied)
Met Participation?
Participation Goal
Valid Scores
Subgroups Participation Rate
% Meeting Standards
Schoolwide
White
African American
Hispanic
American Indian
Asian
Two or More Races
Students with Disability
English Learner Students
Economically Disadvantaged Students

Page 4 of 23
343 BERLIN CROSS KEYS ROAD
07-0700-040
CAMDENSICKLERVILLE, NJ 08081CAMDEN COUNTY VOCATIONAL
CAMDEN COUNTY TECHNICAL SCHOOL-GTCACADEMIC ACHIEVEMENT
State of New Jersey
09-12GRADE SPAN
2014-15
This table presents, for each subgroup in the school, the total number of valid test scores, the percentage of students who met or exceeded expectations, the assessment participation goal, and the participation rate. The participation goal is established as 95% by the United States Department of Education.
--
--
--
--
--
--
--
--
--
--
ESEA Waiver - Math
--- - --
--- - --
--- - --
--- - --
--- - --
--- - --
--- - --
--- - --
--- - --
--- - --
Data is presented for subgroups when the count is high enough under ESEA Waiver suppression rules.YES* = Met Participation Rate (Participation Averaging applied)
Met Participation?
Valid Scores
Subgroups Participation Rate
% Meeting Standards
Schoolwide
White
African American
Hispanic
American Indian
Asian
Two or More Races
Students with Disability
English Learner Students
Participation Goal
Economically Disadvantaged Students
Page 5 of 23
343 BERLIN CROSS KEYS ROAD
07-0700-040
CAMDENSICKLERVILLE, NJ 08081CAMDEN COUNTY VOCATIONAL
CAMDEN COUNTY TECHNICAL SCHOOL-GTCACADEMIC ACHIEVEMENT
State of New Jersey
09-12GRADE SPAN
2014-15
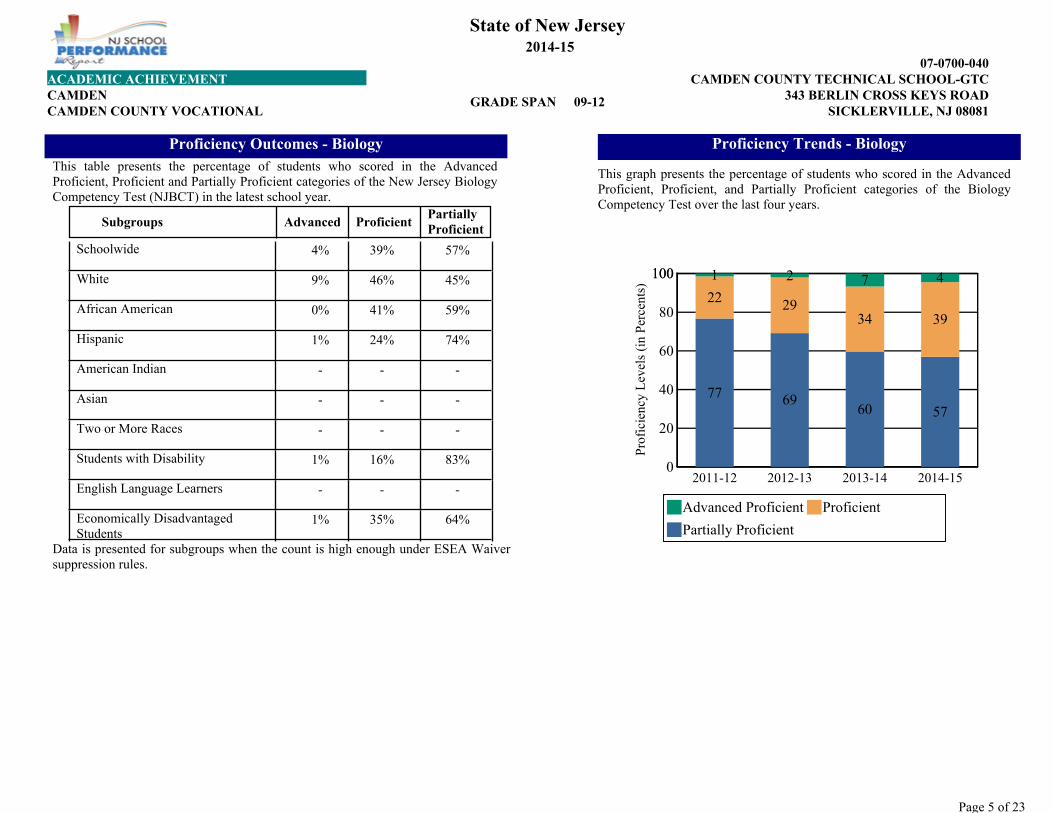
This table presents the percentage of students who scored in the Advanced Proficient, Proficient and Partially Proficient categories of the New Jersey Biology Competency Test (NJBCT) in the latest school year.
4% 57%39%
9% 45%46%
0% 59%41%
1% 74%24%
- --
- --
- --
1% 83%16%
- --
1% 64%35%
Proficiency Outcomes - Biology
Data is presented for subgroups when the count is high enough under ESEA Waiver suppression rules.
AdvancedSubgroupsPartially Proficient
Schoolwide
White
African American
Hispanic
American Indian
Asian
Two or More Races
Students with Disability
English Language Learners
Proficient
Economically Disadvantaged Students
2011-12 2012-13 2013-14 2014-15
Pro
fici
ency
Lev
els
(in
Per
cent
s)
0
20
40
60
80
100100 42
22
57
29
69
71
6077
3934
Advanced Proficient Proficient
Partially Proficient
Proficiency Trends - Biology
This graph presents the percentage of students who scored in the Advanced Proficient, Proficient, and Partially Proficient categories of the Biology Competency Test over the last four years.
Page 6 of 23
343 BERLIN CROSS KEYS ROAD
07-0700-040
CAMDENSICKLERVILLE, NJ 08081CAMDEN COUNTY VOCATIONAL
CAMDEN COUNTY TECHNICAL SCHOOL-GTCACADEMIC ACHIEVEMENT
State of New Jersey
09-12GRADE SPAN
2014-15
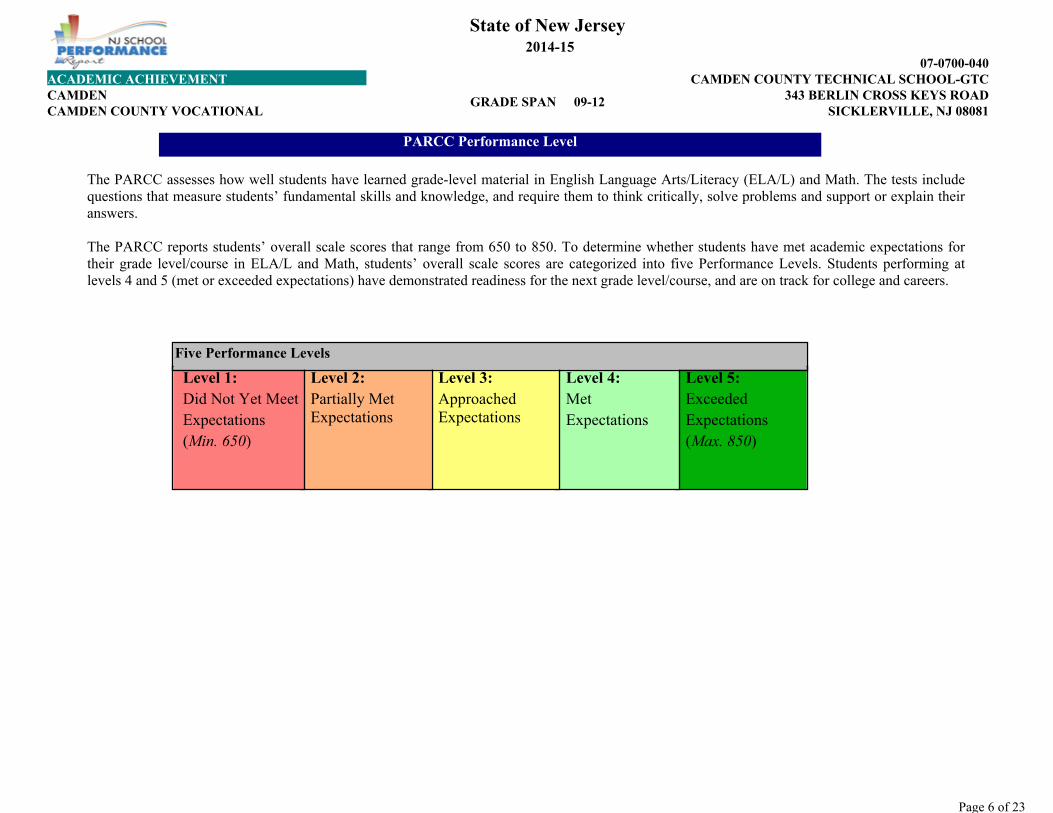
The PARCC assesses how well students have learned grade-level material in English Language Arts/Literacy (ELA/L) and Math. The tests include questions that measure students’ fundamental skills and knowledge, and require them to think critically, solve problems and support or explain their answers.
The PARCC reports students’ overall scale scores that range from 650 to 850. To determine whether students have met academic expectations for their grade level/course in ELA/L and Math, students’ overall scale scores are categorized into five Performance Levels. Students performing at levels 4 and 5 (met or exceeded expectations) have demonstrated readiness for the next grade level/course, and are on track for college and careers.
PARCC Performance Level
Level 5:Exceeded Expectations(Max. 850)
Level 4:Met Expectations
Level 3: Approached Expectations
Level 2: Partially Met Expectations
Level 1: Did Not Yet Meet Expectations(Min. 650)
Five Performance Levels
Page 7 of 23
343 BERLIN CROSS KEYS ROAD
07-0700-040
CAMDENSICKLERVILLE, NJ 08081CAMDEN COUNTY VOCATIONAL
CAMDEN COUNTY TECHNICAL SCHOOL-GTCACADEMIC ACHIEVEMENT
State of New Jersey
09-12GRADE SPAN
2014-15
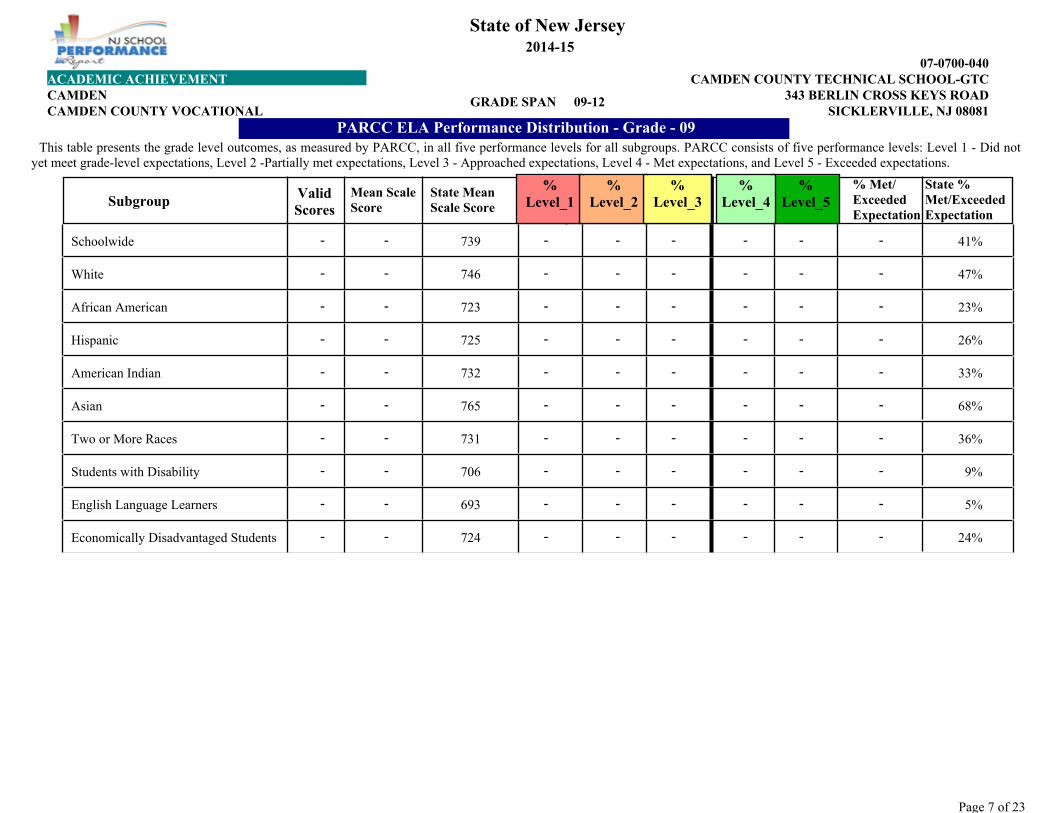
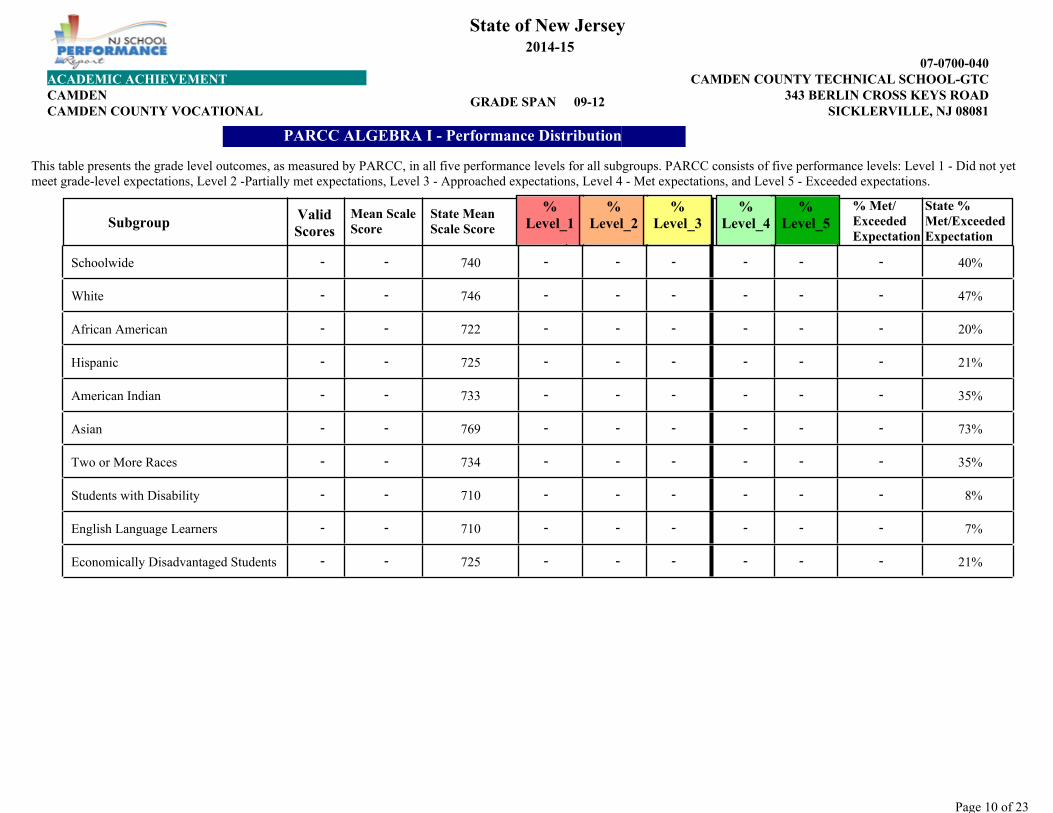
This table presents the grade level outcomes, as measured by PARCC, in all five performance levels for all subgroups. PARCC consists of five performance levels: Level 1 - Did not yet meet grade-level expectations, Level 2 -Partially met expectations, Level 3 - Approached expectations, Level 4 - Met expectations, and Level 5 - Exceeded expectations.
Schoolwide 41%739
White 47%746
African American 23%723
Hispanic 26%725
American Indian 33%732
Asian 68%765
Two or More Races 36%731
Students with Disability 9%706
English Language Learners 5%693
Economically Disadvantaged Students 24%724
PARCC ELA Performance Distribution - Grade - 09
- - - - - - - -
- - - - - - - -
- - - - - - - -
- - - - - - - -
- - - - - - - -
- - - - - - - -
- - - - - - - -
- - - - - - - -
- - - - - - - -
- - - - - - - -
SubgroupState % Met/Exceeded Expectation
State Mean Scale Score
Valid Scores
% Level_1
% Level_5
% Met/ Exceeded Expectation
Mean Scale Score
% Level_2
% Level_4
% Level_3
Page 8 of 23
343 BERLIN CROSS KEYS ROAD
07-0700-040
CAMDENSICKLERVILLE, NJ 08081CAMDEN COUNTY VOCATIONAL
CAMDEN COUNTY TECHNICAL SCHOOL-GTCACADEMIC ACHIEVEMENT
State of New Jersey
09-12GRADE SPAN
2014-15
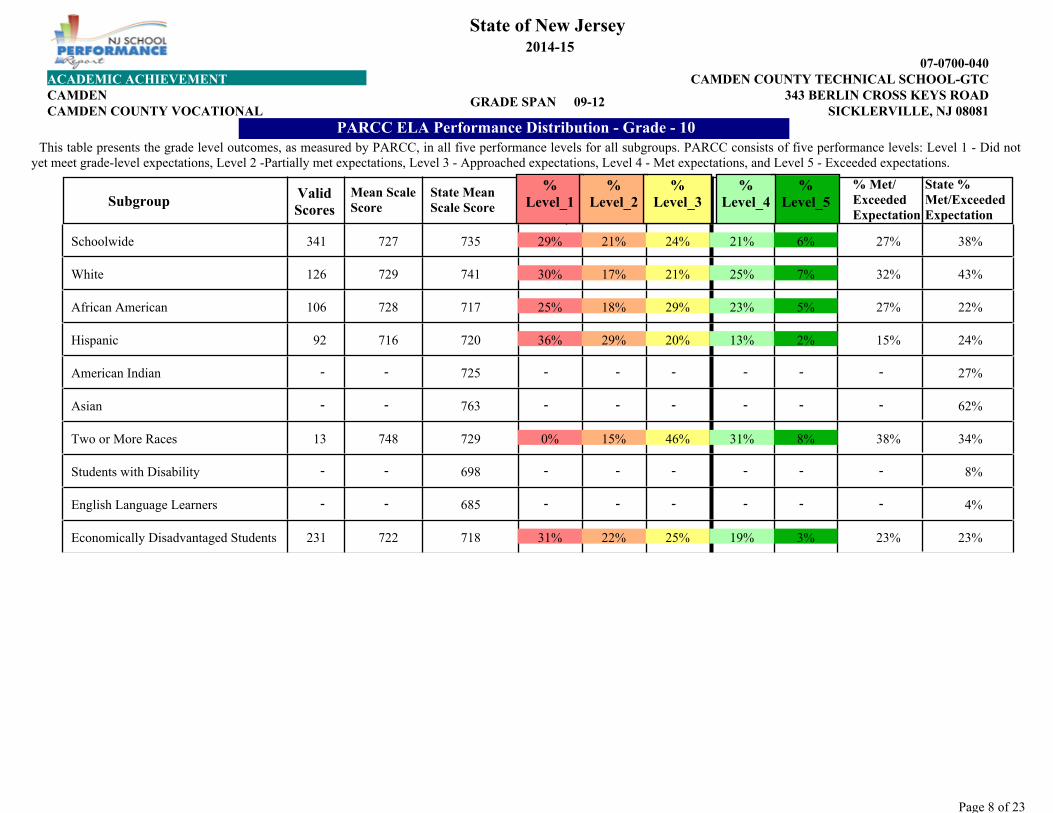
This table presents the grade level outcomes, as measured by PARCC, in all five performance levels for all subgroups. PARCC consists of five performance levels: Level 1 - Did not yet meet grade-level expectations, Level 2 -Partially met expectations, Level 3 - Approached expectations, Level 4 - Met expectations, and Level 5 - Exceeded expectations.
Schoolwide 341 27%727 38%735
White 126 32%729 43%741
African American 106 27%728 22%717
Hispanic 92 15%716 24%720
American Indian 27%725
Asian 62%763
Two or More Races 13 38%748 34%729
Students with Disability 8%698
English Language Learners 4%685
Economically Disadvantaged Students 231 23%722 23%718
PARCC ELA Performance Distribution - Grade - 10
- - - - - - - -
- - - - - - - -
- - - - - - - -
- - - - - - - -
29% 21% 24% 21% 6%
30% 17% 21%
25% 18% 29%
36% 29% 20%
0% 15% 46%
31% 22% 25%
SubgroupState % Met/Exceeded Expectation
State Mean Scale Score
Valid Scores
% Level_1
% Level_5
% Met/ Exceeded Expectation
Mean Scale Score
25% 7%
23% 5%
13% 2%
31% 8%
19% 3%
% Level_2
% Level_4
% Level_3
Page 9 of 23
343 BERLIN CROSS KEYS ROAD
07-0700-040
CAMDENSICKLERVILLE, NJ 08081CAMDEN COUNTY VOCATIONAL
CAMDEN COUNTY TECHNICAL SCHOOL-GTCACADEMIC ACHIEVEMENT
State of New Jersey
09-12GRADE SPAN
2014-15
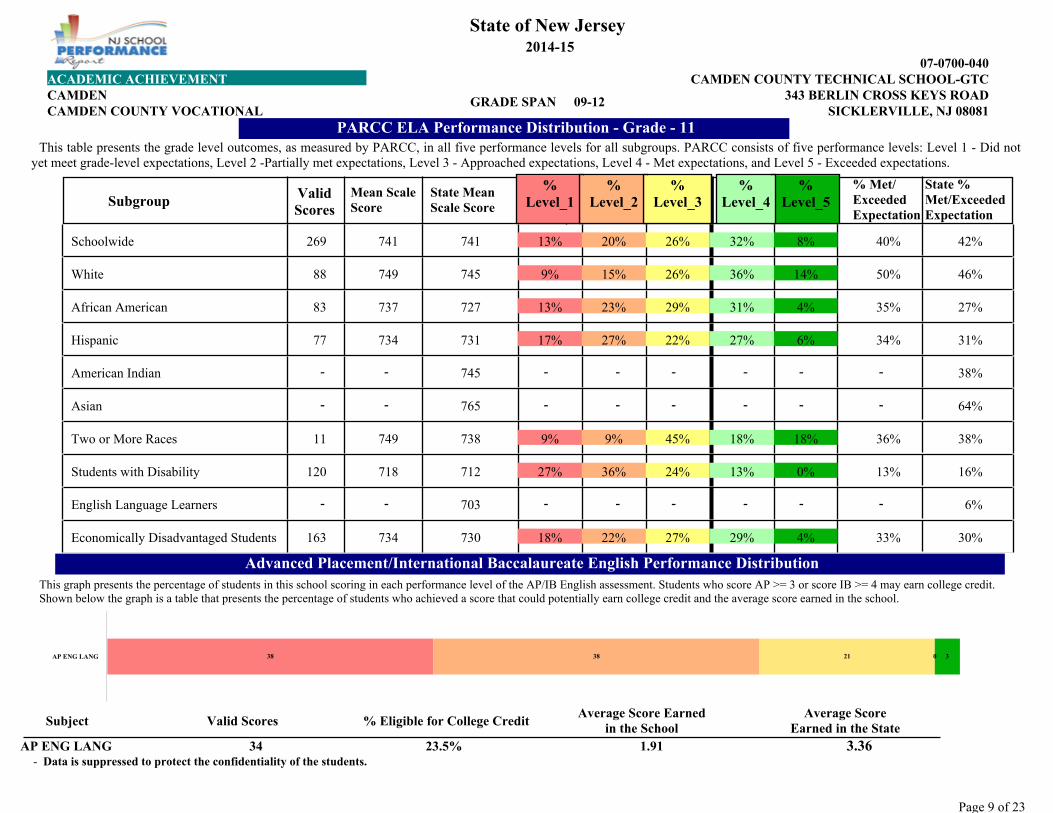
This table presents the grade level outcomes, as measured by PARCC, in all five performance levels for all subgroups. PARCC consists of five performance levels: Level 1 - Did not yet meet grade-level expectations, Level 2 -Partially met expectations, Level 3 - Approached expectations, Level 4 - Met expectations, and Level 5 - Exceeded expectations.
Schoolwide 269 40%741 42%741
White 88 50%749 46%745
African American 83 35%737 27%727
Hispanic 77 34%734 31%731
American Indian 38%745
Asian 64%765
Two or More Races 11 36%749 38%738
Students with Disability 120 13%718 16%712
English Language Learners 6%703
Economically Disadvantaged Students 163 33%734 30%730
PARCC ELA Performance Distribution - Grade - 11
- - - - - - - -
- - - - - - - -
- - - - - - - -
13% 20% 26% 32% 8%
9% 15% 26%
13% 23% 29%
17% 27% 22%
9% 9% 45%
27% 36% 24%
18% 22% 27%
SubgroupState % Met/Exceeded Expectation
State Mean Scale Score
Valid Scores
% Level_1
% Level_5
% Met/ Exceeded Expectation
Mean Scale Score
36% 14%
31% 4%
27% 6%
18% 18%
13% 0%
29% 4%
% Level_2
% Level_4
% Level_3
This graph presents the percentage of students in this school scoring in each performance level of the AP/IB English assessment. Students who score AP >= 3 or score IB >= 4 may earn college credit. Shown below the graph is a table that presents the percentage of students who achieved a score that could potentially earn college credit and the average score earned in the school.
AP ENG LANG 38 32138 0
Advanced Placement/International Baccalaureate English Performance Distribution
Average Score Earned in the School
Average Score Earned in the StateValid Scores % Eligible for College Credit Subject
- Data is suppressed to protect the confidentiality of the students. 3.36AP ENG LANG 23.5% 1.9134
Page 10 of 23
343 BERLIN CROSS KEYS ROAD
07-0700-040
CAMDENSICKLERVILLE, NJ 08081CAMDEN COUNTY VOCATIONAL
CAMDEN COUNTY TECHNICAL SCHOOL-GTCACADEMIC ACHIEVEMENT
State of New Jersey
09-12GRADE SPAN
2014-15
This table presents the grade level outcomes, as measured by PARCC, in all five performance levels for all subgroups. PARCC consists of five performance levels: Level 1 - Did not yet meet grade-level expectations, Level 2 -Partially met expectations, Level 3 - Approached expectations, Level 4 - Met expectations, and Level 5 - Exceeded expectations.
Schoolwide 40%740
White 47%746
African American 20%722
Hispanic 21%725
American Indian 35%733
Asian 73%769
Two or More Races 35%734
Students with Disability 8%710
English Language Learners 7%710
Economically Disadvantaged Students 21%725
PARCC ALGEBRA I - Performance Distribution
- - - - - - - -
- - - - - - - -
- - - - - - - -
- - - - - - - -
- - - - - - - -
- - - - - - - -
- - - - - - - -
- - - - - - - -
- - - - - - - -
- - - - - - - -
SubgroupState % Met/Exceeded Expectation
State Mean Scale Score
Valid Scores
% Level_1
% Level_5
% Met/ Exceeded Expectation
Mean Scale Score
% Level_2
% Level_4
% Level_3

Page 11 of 23
343 BERLIN CROSS KEYS ROAD
07-0700-040
CAMDENSICKLERVILLE, NJ 08081CAMDEN COUNTY VOCATIONAL
CAMDEN COUNTY TECHNICAL SCHOOL-GTCACADEMIC ACHIEVEMENT
State of New Jersey
09-12GRADE SPAN
2014-15
This table presents the grade level outcomes, as measured by PARCC, in all five performance levels for all subgroups. PARCC consists of five performance levels: Level 1 - Did not yet meet grade-level expectations, Level 2 -Partially met expectations, Level 3 - Approached expectations, Level 4 - Met expectations, and Level 5 - Exceeded expectations.
Schoolwide 21%728
White 24%731
African American 7%716
Hispanic 8%718
American Indian 12%722
Asian 54%751
Two or More Races 20%724
Students with Disability 4%709
English Language Learners 6%710
Economically Disadvantaged Students 8%718
PARCC GEOMETRY - Performance Distribution
- - - - - - - -
- - - - - - - -
- - - - - - - -
- - - - - - - -
- - - - - - - -
- - - - - - - -
- - - - - - - -
- - - - - - - -
- - - - - - - -
- - - - - - - -
SubgroupState % Met/Exceeded Expectation
State Mean Scale Score
Valid Scores
% Level_1
% Level_5
% Met/ Exceeded Expectation
Mean Scale Score
% Level_2
% Level_4
% Level_3

3.00
Page 12 of 23
343 BERLIN CROSS KEYS ROAD
07-0700-040
CAMDENSICKLERVILLE, NJ 08081CAMDEN COUNTY VOCATIONAL
CAMDEN COUNTY TECHNICAL SCHOOL-GTCACADEMIC ACHIEVEMENT
State of New Jersey
09-12GRADE SPAN
2014-15
This table presents the grade level outcomes, as measured by PARCC, in all five performance levels for all subgroups. PARCC consists of five performance levels: Level 1 - Did not yet meet grade-level expectations, Level 2 -Partially met expectations, Level 3 - Approached expectations, Level 4 - Met expectations, and Level 5 - Exceeded expectations.
Schoolwide 24%721
White 27%725
African American 8%701
Hispanic 10%706
American Indian 23%720
Asian 53%751
Two or More Races 21%716
Students with Disability 4%691
English Language Learners 6%694
Economically Disadvantaged Students 9%705
PARCC ALGEBRA II - Performance Distribution
- - - - - - - -
- - - - - - - -
- - - - - - - -
- - - - - - - -
- - - - - - - -
- - - - - - - -
- - - - - - - -
- - - - - - - -
- - - - - - - -
- - - - - - - -
SubgroupState % Met/Exceeded Expectation
State Mean Scale Score
Valid Scores
% Level_1
% Level_5
% Met/ Exceeded Expectation
Mean Scale Score
% Level_2
% Level_4
% Level_3
Page 13 of 23
343 BERLIN CROSS KEYS ROAD
07-0700-040
CAMDENCOLLEGE AND CAREER READINESS
SICKLERVILLE, NJ 08081CAMDEN COUNTY VOCATIONAL
CAMDEN COUNTY TECHNICAL SCHOOL-GTC
State of New Jersey
09-12GRADE SPAN
2014-15
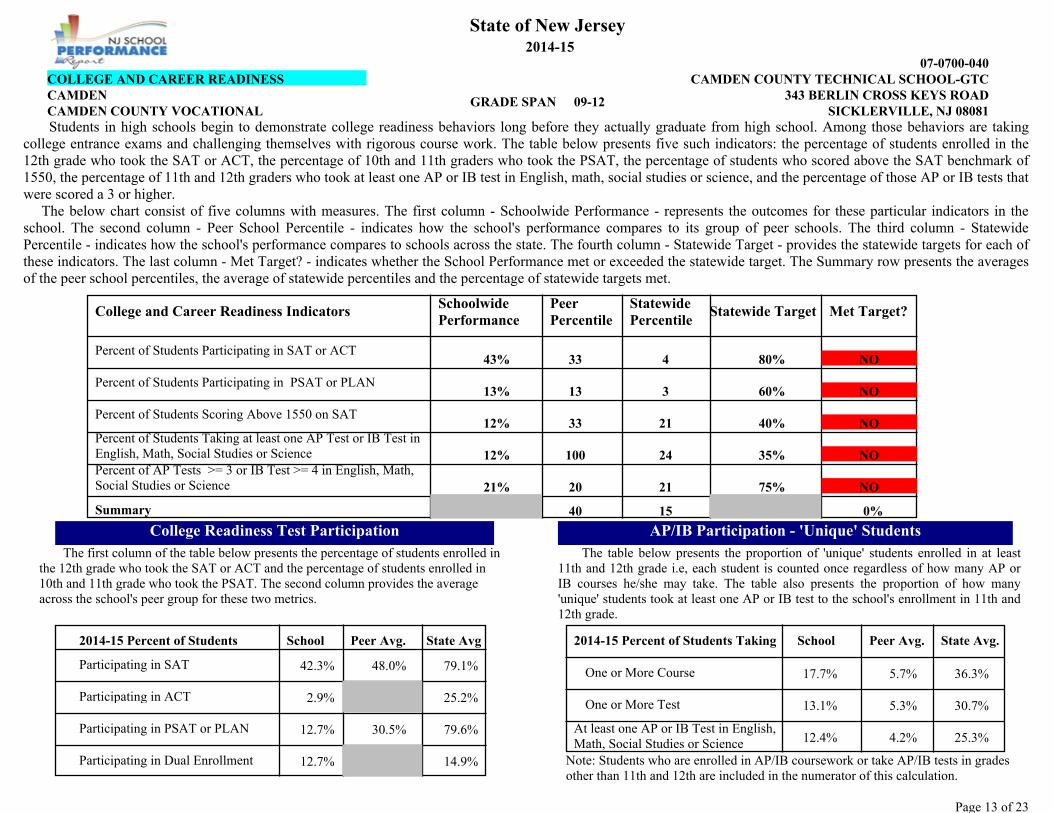
Students in high schools begin to demonstrate college readiness behaviors long before they actually graduate from high school. Among those behaviors are taking college entrance exams and challenging themselves with rigorous course work. The table below presents five such indicators: the percentage of students enrolled in the 12th grade who took the SAT or ACT, the percentage of 10th and 11th graders who took the PSAT, the percentage of students who scored above the SAT benchmark of 1550, the percentage of 11th and 12th graders who took at least one AP or IB test in English, math, social studies or science, and the percentage of those AP or IB tests that were scored a 3 or higher.
The below chart consist of five columns with measures. The first column - Schoolwide Performance - represents the outcomes for these particular indicators in the school. The second column - Peer School Percentile - indicates how the school's performance compares to its group of peer schools. The third column - Statewide Percentile - indicates how the school's performance compares to schools across the state. The fourth column - Statewide Target - provides the statewide targets for each of these indicators. The last column - Met Target? - indicates whether the School Performance met or exceeded the statewide target. The Summary row presents the averages of the peer school percentiles, the average of statewide percentiles and the percentage of statewide targets met.
College Readiness Test Participation AP/IB Participation - 'Unique' StudentsThe first column of the table below presents the percentage of students enrolled in
the 12th grade who took the SAT or ACT and the percentage of students enrolled in 10th and 11th grade who took the PSAT. The second column provides the average across the school's peer group for these two metrics.
The table below presents the proportion of 'unique' students enrolled in at least 11th and 12th grade i.e, each student is counted once regardless of how many AP or IB courses he/she may take. The table also presents the proportion of how many 'unique' students took at least one AP or IB test to the school's enrollment in 11th and 12th grade.
Note: Students who are enrolled in AP/IB coursework or take AP/IB tests in grades other than 11th and 12th are included in the numerator of this calculation.
Participating in SAT
Participating in ACT
42.3%
2.9%
17.7%
13.1%
79.1%
79.6%
36.3%
30.7%
25.3%
25.2%
48.0%
30.5%
5.7%
5.3%
4.2%12.7%
12.4%
12.7% 14.9%
100
33 21
13 3
33 4
24
0%
12%
43%
1540
75%
35%
40%
60%
80%
12%
21%
13%
2120
College and Career Readiness Indicators
Summary
Schoolwide Performance
Statewide Percentile
Met Target?
Percent of Students Scoring Above 1550 on SAT
Percent of Students Participating in PSAT or PLAN
Participating in PSAT or PLAN
Peer Avg.2014-15 Percent of Students School
One or More Test
One or More Course
Peer Avg.School State Avg.
Participating in Dual Enrollment
State Avg.
NO
NO
NO
NO
NOPercent of Students Participating in SAT or ACT
Percent of AP Tests >= 3 or IB Test >= 4 in English, Math, Social Studies or Science
2014-15 Percent of Students Taking
Peer Percentile
Statewide Target
Percent of Students Taking at least one AP Test or IB Test in English, Math, Social Studies or Science
At least one AP or IB Test in English, Math, Social Studies or Science
Page 14 of 23
343 BERLIN CROSS KEYS ROAD
07-0700-040
CAMDENCOLLEGE AND CAREER READINESS
SICKLERVILLE, NJ 08081CAMDEN COUNTY VOCATIONAL
CAMDEN COUNTY TECHNICAL SCHOOL-GTC
State of New Jersey
09-12GRADE SPAN
2014-15
2011-12 2012-13 2013-14 2014-15
Year
Par
tici
pat
ion
Rat
e
0
10
20
30
40
50
4238
46
35
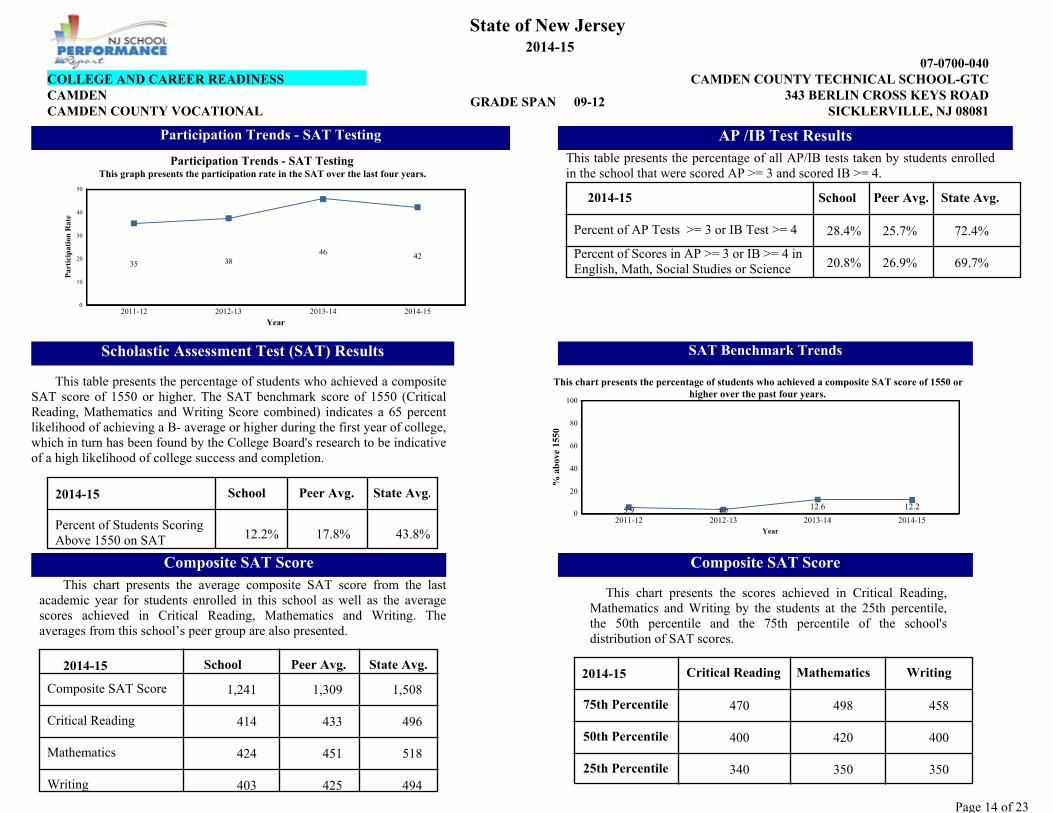
Participation Trends - SAT TestingThis graph presents the participation rate in the SAT over the last four years.
AP /IB Test ResultsParticipation Trends - SAT Testing
72.4%
69.7%
25.7%
26.9%
28.4%
20.8%
This table presents the percentage of all AP/IB tests taken by students enrolled in the school that were scored AP >= 3 and scored IB >= 4.
2014-15 State Avg.
Percent of AP Tests >= 3 or IB Test >= 4
School Peer Avg.
Percent of Scores in AP >= 3 or IB >= 4 in English, Math, Social Studies or Science
2011-12 2012-13 2013-14 2014-15Year
% a
bov
e 15
50
0
20
40
60
80
100
12.23.7
12.65.9
This chart presents the percentage of students who achieved a composite SAT score of 1550 orhigher over the past four years.
Scholastic Assessment Test (SAT) Results
This table presents the percentage of students who achieved a composite SAT score of 1550 or higher. The SAT benchmark score of 1550 (Critical Reading, Mathematics and Writing Score combined) indicates a 65 percent likelihood of achieving a B- average or higher during the first year of college, which in turn has been found by the College Board's research to be indicative of a high likelihood of college success and completion.
SAT Benchmark Trends
Composite SAT ScoreThis chart presents the average composite SAT score from the last
academic year for students enrolled in this school as well as the average scores achieved in Critical Reading, Mathematics and Writing. The averages from this school’s peer group are also presented.
This chart presents the scores achieved in Critical Reading, Mathematics and Writing by the students at the 25th percentile, the 50th percentile and the 75th percentile of the school's distribution of SAT scores.
Composite SAT Score
State Avg.
25th Percentile
12.2% 43.8%17.8%
1,241
414
424
403
1,309
433
451
425
1,508
496
518
494
470
400
340
498
420
350
458
400
350
2014-15
2014-152014-15
Peer Avg.
Composite SAT Score
Critical Reading
Mathematics
Writing
Critical Reading Writing
75th Percentile
50th Percentile
Peer Avg. State Avg.
School
Percent of Students Scoring Above 1550 on SAT
SchoolMathematics
Page 15 of 23
343 BERLIN CROSS KEYS ROAD
07-0700-040
CAMDENCOLLEGE AND CAREER READINESS
SICKLERVILLE, NJ 08081CAMDEN COUNTY VOCATIONAL
CAMDEN COUNTY TECHNICAL SCHOOL-GTC
State of New Jersey
09-12GRADE SPAN
2014-15
AP/IB Courses Offered
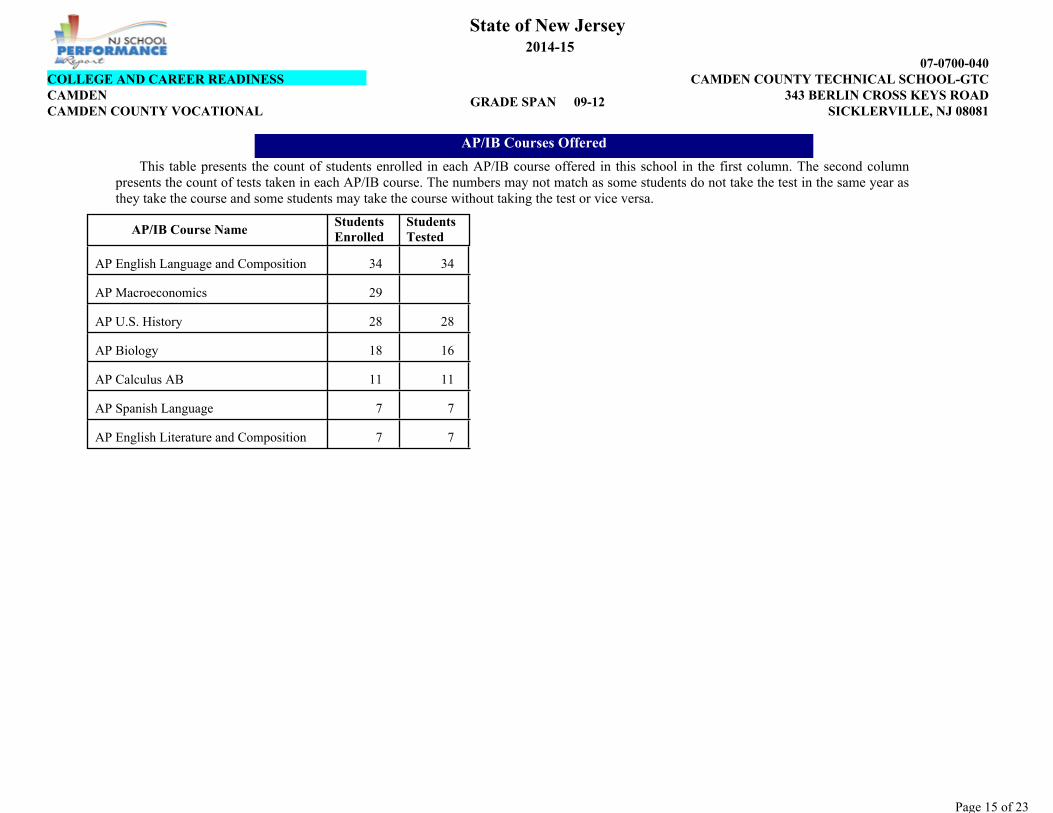
This table presents the count of students enrolled in each AP/IB course offered in this school in the first column. The second column presents the count of tests taken in each AP/IB course. The numbers may not match as some students do not take the test in the same year as they take the course and some students may take the course without taking the test or vice versa.
3434AP English Language and Composition
29AP Macroeconomics
2828AP U.S. History
1618AP Biology
1111AP Calculus AB
77AP Spanish Language
77AP English Literature and Composition
AP/IB Course NameStudents Enrolled
Students Tested
Page 16 of 23
343 BERLIN CROSS KEYS ROAD
07-0700-040
CAMDENCOLLEGE AND CAREER READINESS
SICKLERVILLE, NJ 08081CAMDEN COUNTY VOCATIONAL
CAMDEN COUNTY TECHNICAL SCHOOL-GTC
State of New Jersey
09-12GRADE SPAN
2014-15
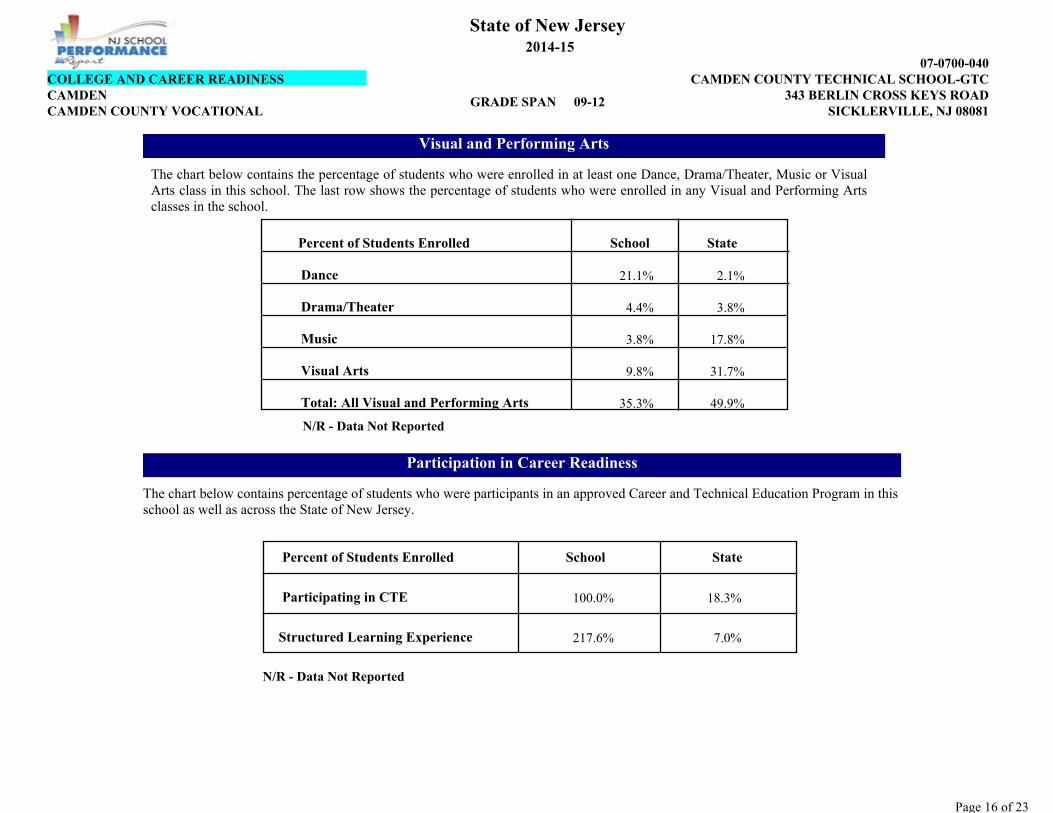
Visual and Performing Arts
The chart below contains the percentage of students who were enrolled in at least one Dance, Drama/Theater, Music or Visual Arts class in this school. The last row shows the percentage of students who were enrolled in any Visual and Performing Arts classes in the school.
N/R - Data Not Reported
Percent of Students Enrolled
Dance
Drama/Theater
Music
Visual Arts
Total: All Visual and Performing Arts
School State
2.1%
3.8%
17.8%
31.7%
49.9%
21.1%
4.4%
3.8%
9.8%
35.3%
Participation in Career Readiness
The chart below contains percentage of students who were participants in an approved Career and Technical Education Program in this school as well as across the State of New Jersey.
N/R - Data Not Reported
State School Percent of Students Enrolled
Participating in CTE
Structured Learning Experience
100.0% 18.3%
217.6% 7.0%
4.00
Page 17 of 23
343 BERLIN CROSS KEYS ROAD
07-0700-040
CAMDENSICKLERVILLE, NJ 08081CAMDEN COUNTY VOCATIONAL
CAMDEN COUNTY TECHNICAL SCHOOL-GTCGRADUATION AND POSTSECONDARY
State of New Jersey
09-12GRADE SPAN
2014-15
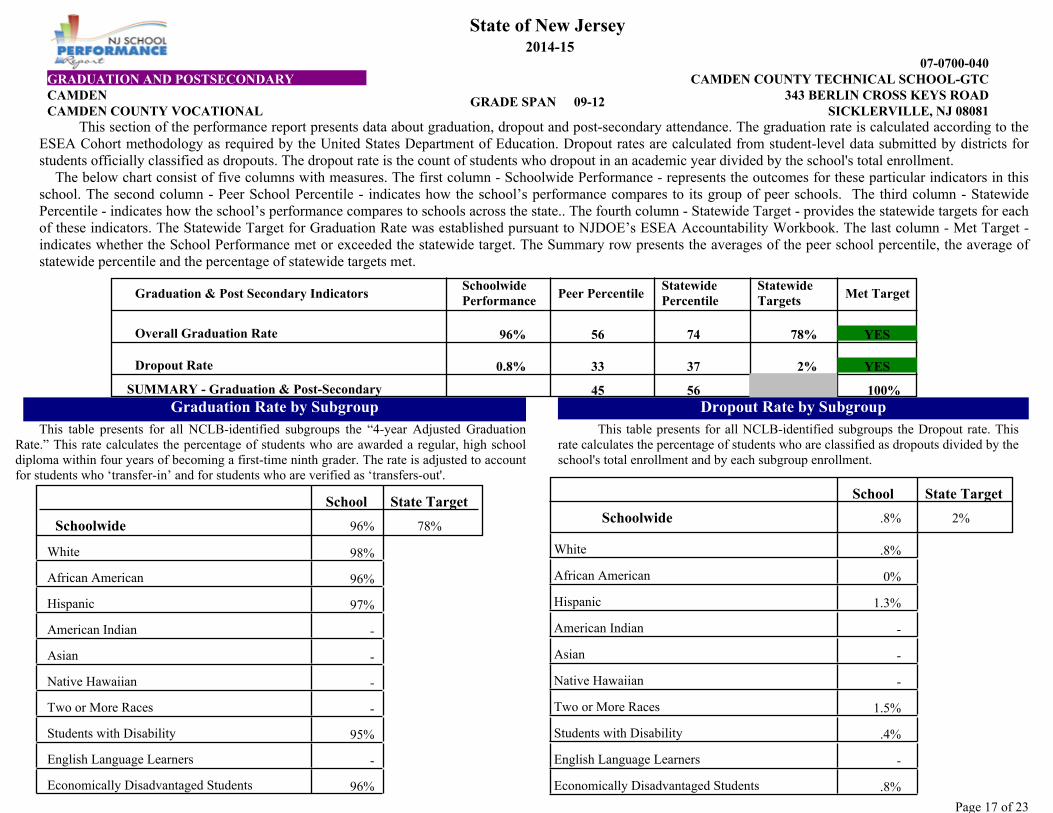
This section of the performance report presents data about graduation, dropout and post-secondary attendance. The graduation rate is calculated according to the ESEA Cohort methodology as required by the United States Department of Education. Dropout rates are calculated from student-level data submitted by districts for students officially classified as dropouts. The dropout rate is the count of students who dropout in an academic year divided by the school's total enrollment.
The below chart consist of five columns with measures. The first column - Schoolwide Performance - represents the outcomes for these particular indicators in this school. The second column - Peer School Percentile - indicates how the school’s performance compares to its group of peer schools. The third column - Statewide Percentile - indicates how the school’s performance compares to schools across the state.. The fourth column - Statewide Target - provides the statewide targets for each of these indicators. The Statewide Target for Graduation Rate was established pursuant to NJDOE’s ESEA Accountability Workbook. The last column - Met Target - indicates whether the School Performance met or exceeded the statewide target. The Summary row presents the averages of the peer school percentile, the average of statewide percentile and the percentage of statewide targets met.
96% 78%
2%
5645
0.8%
100%
74
37
56
33
Graduation & Post Secondary IndicatorsStatewide Percentile
Statewide Targets Met Target
SUMMARY - Graduation & Post-Secondary
Overall Graduation Rate
Dropout Rate
YES
YES
Schoolwide Performance Peer Percentile
98%
96%
97%
-
-
-
-
95%
-
96%
Graduation Rate by SubgroupThis table presents for all NCLB-identified subgroups the “4-year Adjusted Graduation
Rate.” This rate calculates the percentage of students who are awarded a regular, high school diploma within four years of becoming a first-time ninth grader. The rate is adjusted to account for students who ‘transfer-in’ and for students who are verified as ‘transfers-out'.
White
African American
Hispanic
American Indian
Asian
Native Hawaiian
Two or More Races
Students with Disability
English Language Learners
Economically Disadvantaged Students
School
Schoolwide
State Target
96% 78%
.8%
0%
1.3%
-
-
-
1.5%
.4%
-
.8%
Dropout Rate by SubgroupThis table presents for all NCLB-identified subgroups the Dropout rate. This
rate calculates the percentage of students who are classified as dropouts divided by the school's total enrollment and by each subgroup enrollment.
School State Target
Schoolwide .8% 2%
White
African American
Hispanic
American Indian
Asian
Native Hawaiian
Two or More Races
Students with Disability
English Language Learners
Economically Disadvantaged Students
Page 18 of 23
343 BERLIN CROSS KEYS ROAD
07-0700-040
CAMDENSICKLERVILLE, NJ 08081CAMDEN COUNTY VOCATIONAL
CAMDEN COUNTY TECHNICAL SCHOOL-GTCGRADUATION AND POSTSECONDARY
State of New Jersey
09-12GRADE SPAN
2014-15
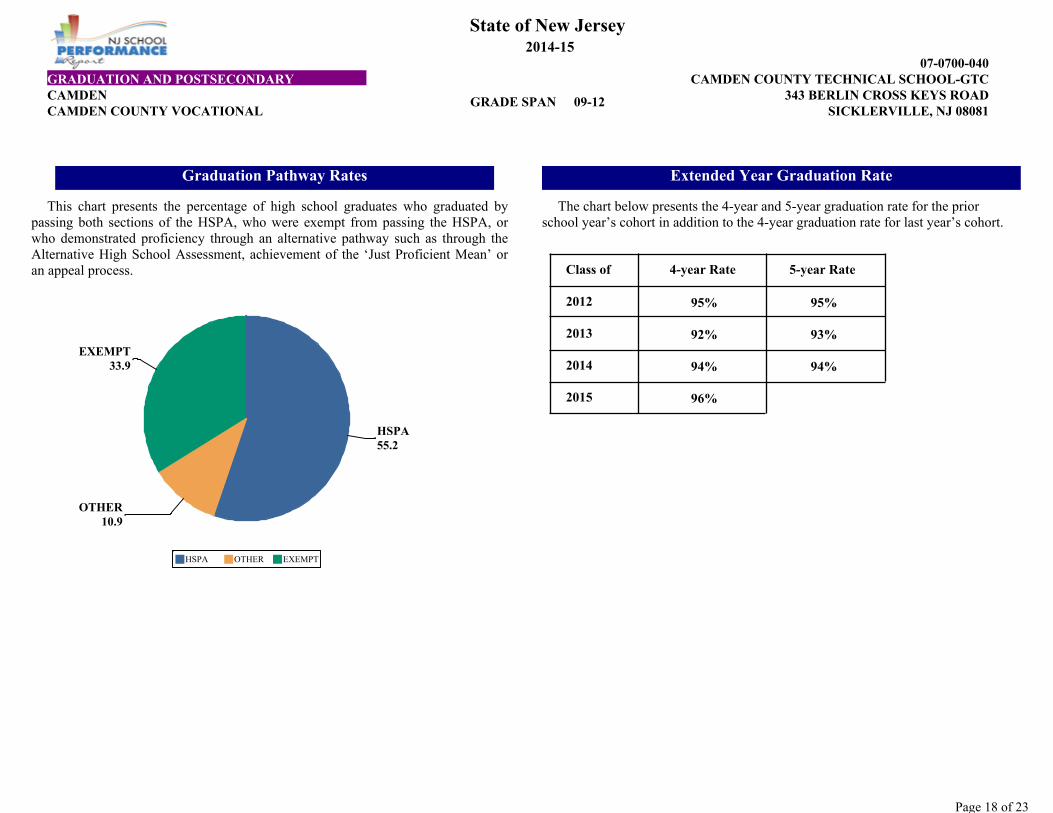
EXEMPT33.9
HSPA55.2
OTHER10.9
HSPA OTHER EXEMPT
Graduation Pathway Rates
This chart presents the percentage of high school graduates who graduated by passing both sections of the HSPA, who were exempt from passing the HSPA, or who demonstrated proficiency through an alternative pathway such as through the Alternative High School Assessment, achievement of the ‘Just Proficient Mean’ or an appeal process.
95% 95%
92%
94%
93%
96%
94%
Extended Year Graduation Rate
The chart below presents the 4-year and 5-year graduation rate for the prior school year’s cohort in addition to the 4-year graduation rate for last year’s cohort.
Class of 4-year Rate 5-year Rate
2012
2013
2014
2015
5.00
Page 19 of 23
343 BERLIN CROSS KEYS ROAD
07-0700-040
CAMDENSICKLERVILLE, NJ 08081CAMDEN COUNTY VOCATIONAL
CAMDEN COUNTY TECHNICAL SCHOOL-GTCGRADUATION AND POSTSECONDARY
State of New Jersey
09-12GRADE SPAN
2014-15
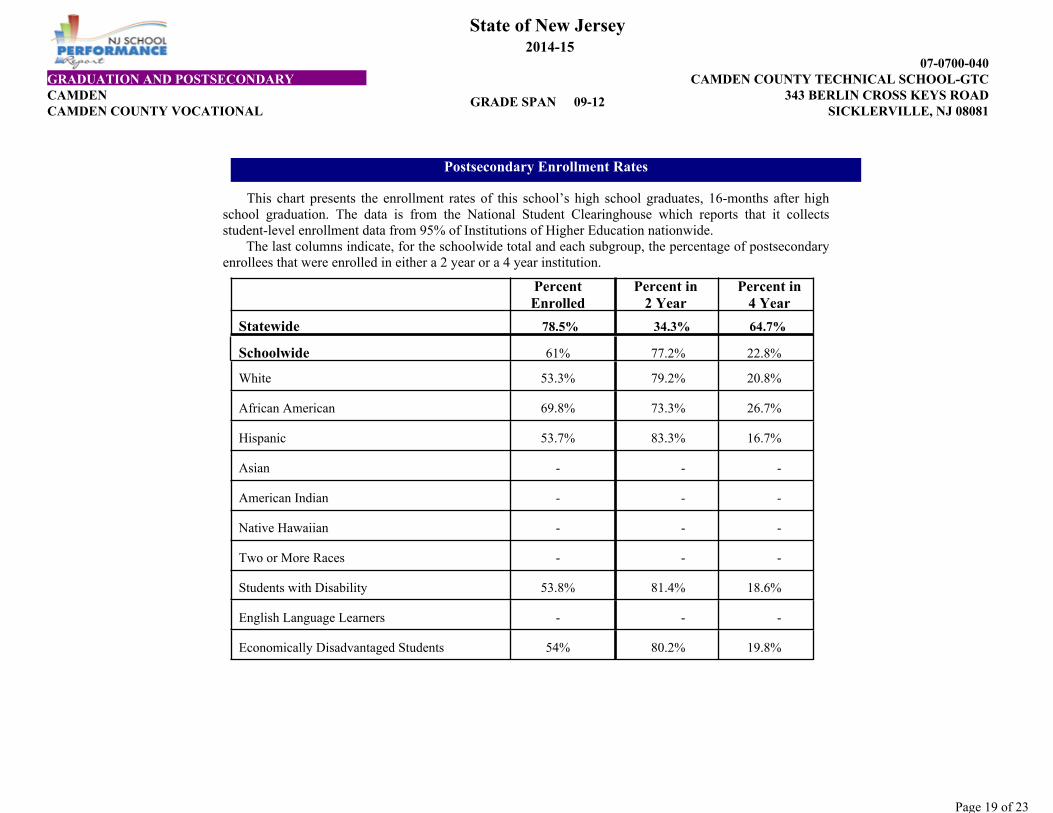
This chart presents the enrollment rates of this school’s high school graduates, 16-months after high school graduation. The data is from the National Student Clearinghouse which reports that it collects student-level enrollment data from 95% of Institutions of Higher Education nationwide. The last columns indicate, for the schoolwide total and each subgroup, the percentage of postsecondary enrollees that were enrolled in either a 2 year or a 4 year institution.
Statewide
Schoolwide 61% 77.2% 22.8%
53.3% 79.2% 20.8%
69.8% 73.3% 26.7%
53.7% 83.3% 16.7%
- - -
- - -
- - -
- - -
53.8% 81.4% 18.6%
- - -
54% 80.2% 19.8%
78.5% 34.3% 64.7%
Postsecondary Enrollment Rates
African American
Hispanic
Asian
American Indian
Native Hawaiian
Two or More Races
Students with Disability
English Language Learners
Economically Disadvantaged Students
Percent Enrolled
Percent in 2 Year
Percent in 4 Year
White
Page 20 of 23
343 BERLIN CROSS KEYS ROAD
07-0700-040
CAMDENWITHIN SCHOOL ACHIEVEMENT GAP
SICKLERVILLE, NJ 08081CAMDEN COUNTY VOCATIONAL
CAMDEN COUNTY TECHNICAL SCHOOL-GTC
State of New Jersey
09-12GRADE SPAN
2014-15
Grade Level - 10
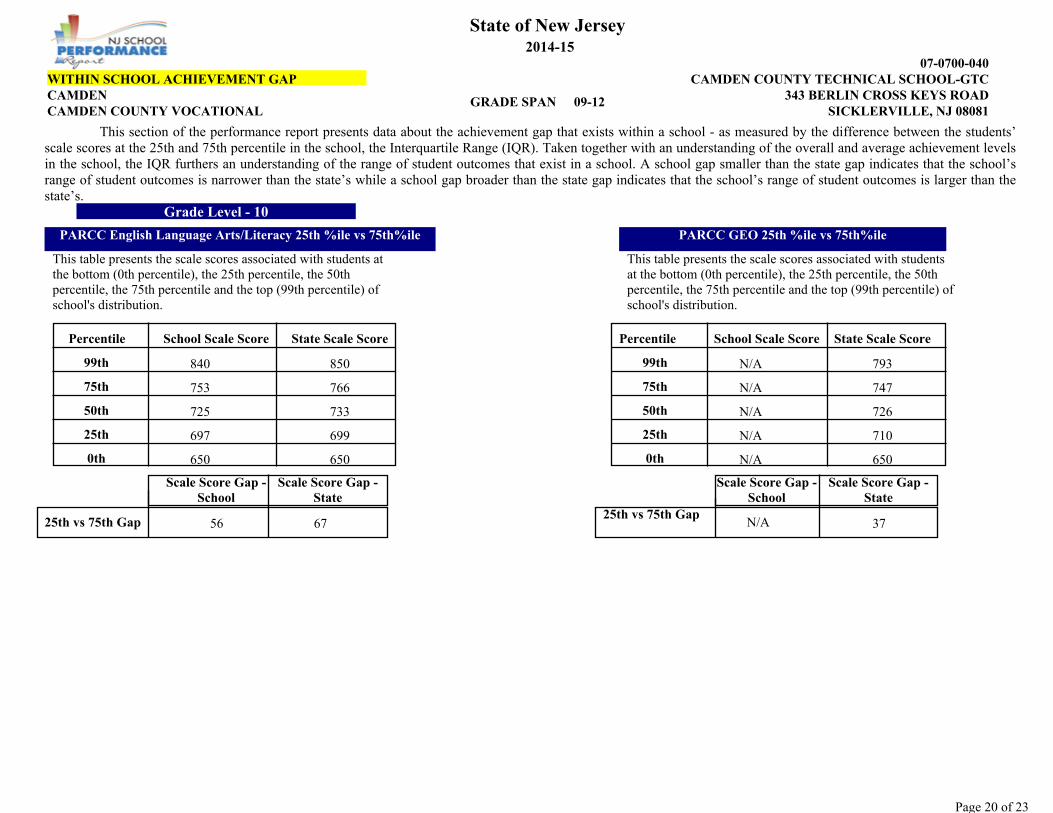
This section of the performance report presents data about the achievement gap that exists within a school - as measured by the difference between the students’ scale scores at the 25th and 75th percentile in the school, the Interquartile Range (IQR). Taken together with an understanding of the overall and average achievement levels in the school, the IQR furthers an understanding of the range of student outcomes that exist in a school. A school gap smaller than the state gap indicates that the school’s range of student outcomes is narrower than the state’s while a school gap broader than the state gap indicates that the school’s range of student outcomes is larger than the state’s.
PARCC English Language Arts/Literacy 25th %ile vs 75th%ile PARCC GEO 25th %ile vs 75th%ile
This table presents the scale scores associated with students at the bottom (0th percentile), the 25th percentile, the 50th percentile, the 75th percentile and the top (99th percentile) of school's distribution.
This table presents the scale scores associated with students at the bottom (0th percentile), the 25th percentile, the 50th percentile, the 75th percentile and the top (99th percentile) of school's distribution.
56 67 37
650
697
725
753
840 N/A
N/A
N/A
N/A
N/A650
699
733
766
850
650
710
726
747
793
0th
25th
50th
75th
99th
Percentile
0th
25th
50th
75th
99th
Scale Score Gap - State
25th vs 75th Gap
Scale Score Gap - State
State Scale Score
N/A
Scale Score Gap - School
25th vs 75th Gap
Scale Score Gap - School
Percentile School Scale Score School Scale Score State Scale Score
6.00
Page 21 of 23
343 BERLIN CROSS KEYS ROAD
07-0700-040
CAMDENWITHIN SCHOOL ACHIEVEMENT GAP
SICKLERVILLE, NJ 08081CAMDEN COUNTY VOCATIONAL
CAMDEN COUNTY TECHNICAL SCHOOL-GTC
State of New Jersey
09-12GRADE SPAN
2014-15
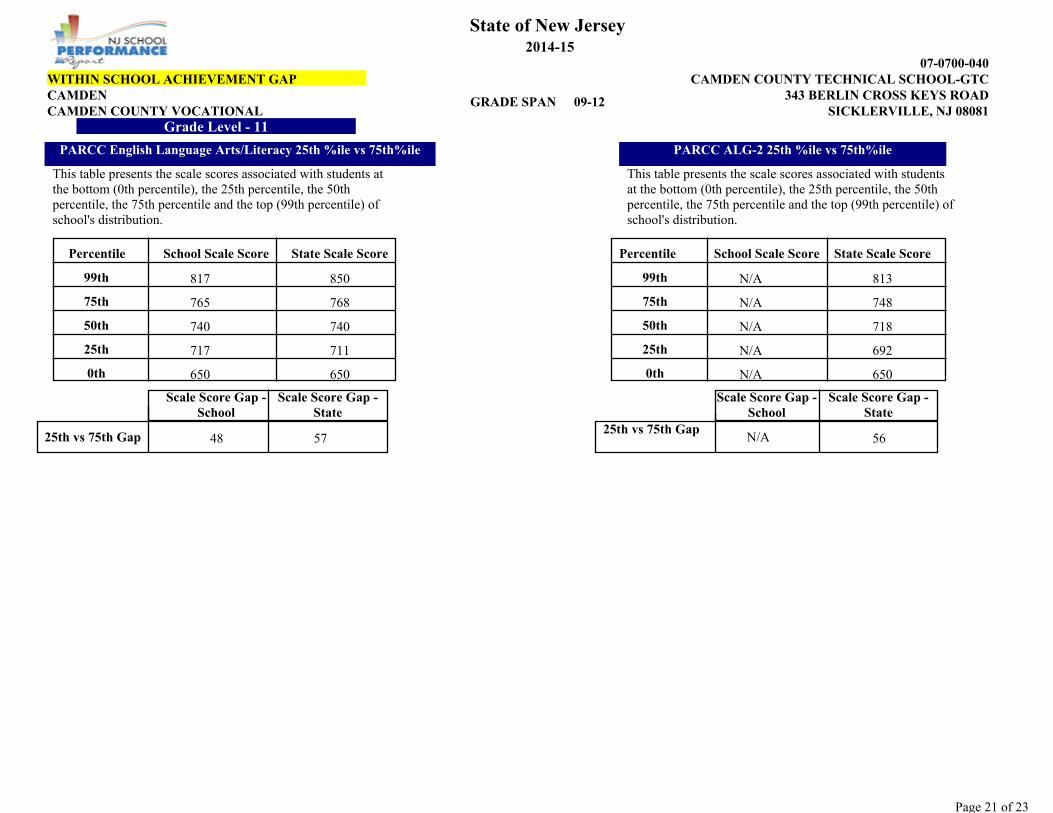
Grade Level - 11
PARCC English Language Arts/Literacy 25th %ile vs 75th%ile PARCC ALG-2 25th %ile vs 75th%ile
This table presents the scale scores associated with students at the bottom (0th percentile), the 25th percentile, the 50th percentile, the 75th percentile and the top (99th percentile) of school's distribution.
This table presents the scale scores associated with students at the bottom (0th percentile), the 25th percentile, the 50th percentile, the 75th percentile and the top (99th percentile) of school's distribution.
48 57 56
650
717
740
765
817 N/A
N/A
N/A
N/A
N/A650
711
740
768
850
650
692
718
748
813
0th
25th
50th
75th
99th
Percentile
0th
25th
50th
75th
99th
Scale Score Gap - State
25th vs 75th Gap
Scale Score Gap - State
State Scale Score
N/A
Scale Score Gap - School
25th vs 75th Gap
Scale Score Gap - School
Percentile School Scale Score School Scale Score State Scale Score
7.00
Page 22 of 23
343 BERLIN CROSS KEYS ROAD
07-0700-040
CAMDENSCHOOL CLIMATE
SICKLERVILLE, NJ 08081CAMDEN COUNTY VOCATIONAL
CAMDEN COUNTY TECHNICAL SCHOOL-GTC
State of New Jersey
09-12GRADE SPAN
2014-15
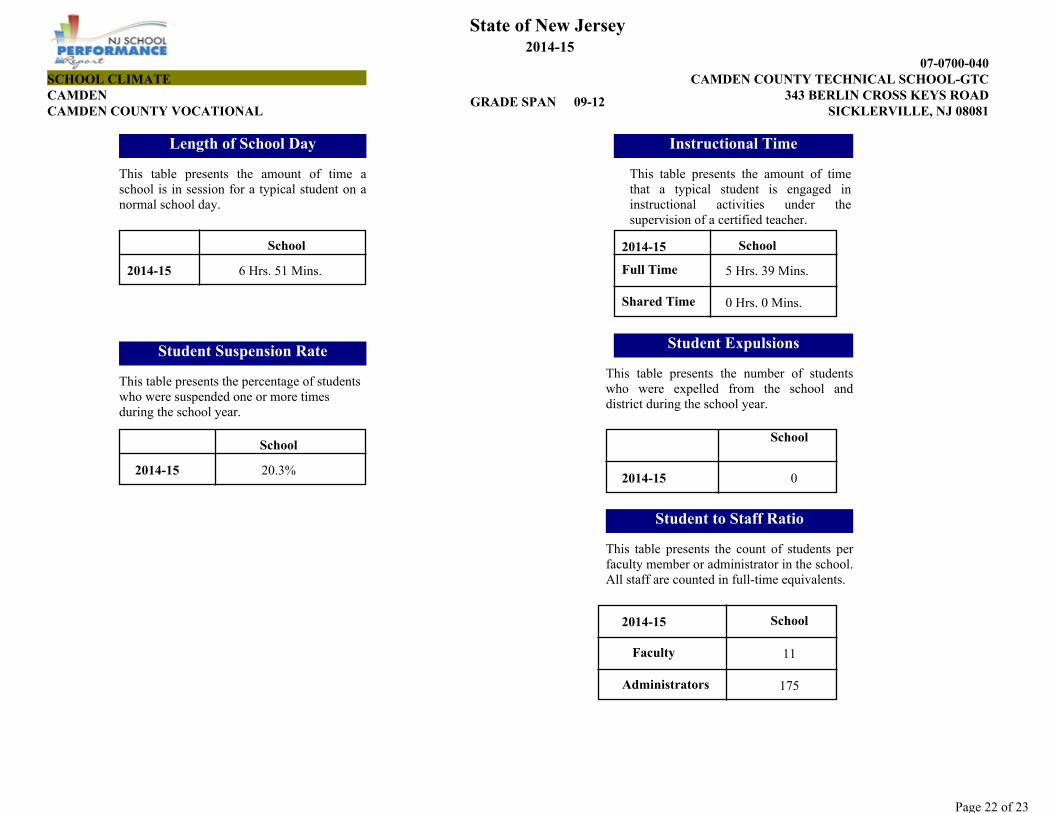
This table presents the amount of time that a typical student is engaged in instructional activities under the supervision of a certified teacher.
Length of School Day Instructional Time
Student Suspension Rate Student Expulsions
Student to Staff Ratio
This table presents the amount of time a school is in session for a typical student on a normal school day.
This table presents the percentage of students who were suspended one or more times during the school year.
This table presents the number of students who were expelled from the school and district during the school year.
This table presents the count of students per faculty member or administrator in the school. All staff are counted in full-time equivalents.
School
School
School
Faculty
Administrators
20.3%
11
175
0
5 Hrs. 39 Mins.
0 Hrs. 0 Mins.
6 Hrs. 51 Mins.2014-15
2014-15
2014-15
2014-15
2014-15
School
Full Time
Shared Time
School
Page 23 of 23
343 BERLIN CROSS KEYS ROAD
07-0700-040
CAMDENSICKLERVILLE, NJ 08081CAMDEN COUNTY VOCATIONAL
CAMDEN COUNTY TECHNICAL SCHOOL-GTCSCHOOL PEER GROUP
State of New Jersey
09-12GRADE SPAN
2014-15
SCHOOL NAMEDISTRICT NAMECOUNTY NAME
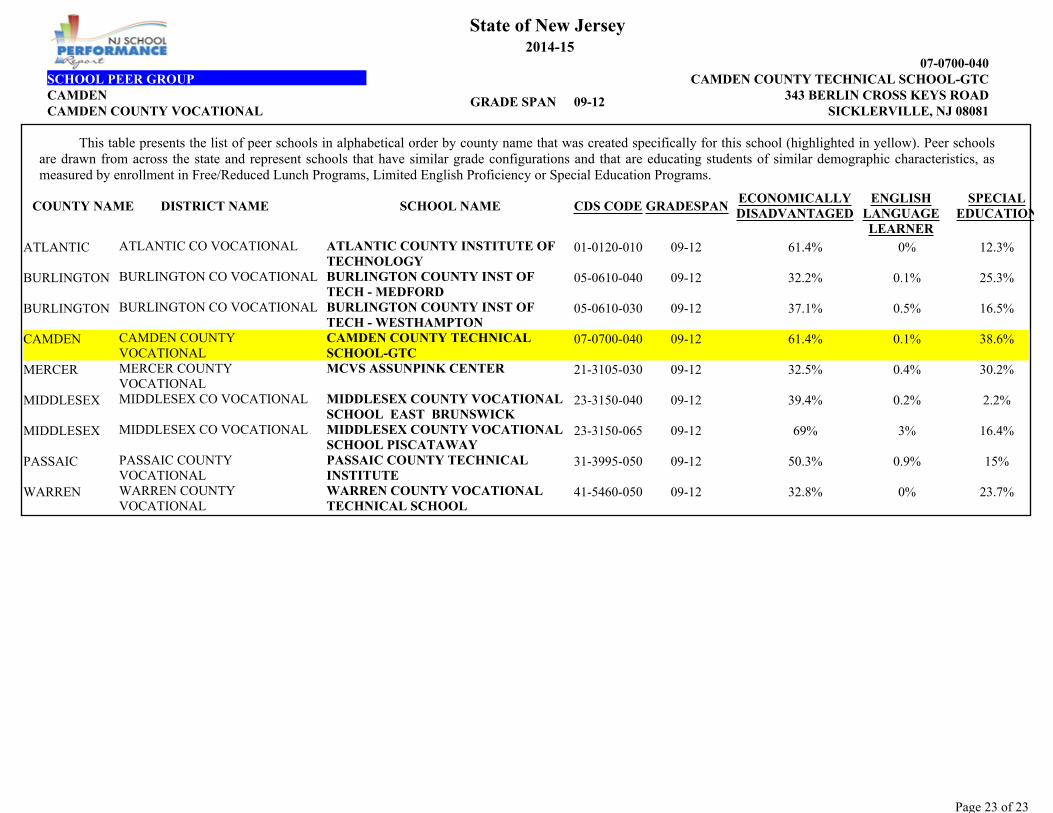
09-12ATLANTIC 61.4% 0% 12.3%01-0120-010
09-12BURLINGTON 32.2% 0.1% 25.3%05-0610-040
09-12BURLINGTON 37.1% 0.5% 16.5%05-0610-030
09-12CAMDEN 61.4% 0.1% 38.6%07-0700-040
09-12MERCER 32.5% 0.4% 30.2%21-3105-030
09-12MIDDLESEX 39.4% 0.2% 2.2%23-3150-040
09-12MIDDLESEX 69% 3% 16.4%23-3150-065
09-12PASSAIC 50.3% 0.9% 15%31-3995-050
09-12WARREN 32.8% 0% 23.7%41-5460-050
This table presents the list of peer schools in alphabetical order by county name that was created specifically for this school (highlighted in yellow). Peer schools are drawn from across the state and represent schools that have similar grade configurations and that are educating students of similar demographic characteristics, as measured by enrollment in Free/Reduced Lunch Programs, Limited English Proficiency or Special Education Programs.
GRADESPANECONOMICALLY DISADVANTAGED
SPECIAL EDUCATION
ATLANTIC COUNTY INSTITUTE OF TECHNOLOGY
ATLANTIC CO VOCATIONAL
BURLINGTON COUNTY INST OF TECH - MEDFORD
BURLINGTON CO VOCATIONAL
BURLINGTON COUNTY INST OF TECH - WESTHAMPTON
BURLINGTON CO VOCATIONAL
CAMDEN COUNTY TECHNICAL SCHOOL-GTC
CAMDEN COUNTY VOCATIONAL
MCVS ASSUNPINK CENTERMERCER COUNTY VOCATIONAL
MIDDLESEX COUNTY VOCATIONAL SCHOOL EAST BRUNSWICK
MIDDLESEX CO VOCATIONAL
MIDDLESEX COUNTY VOCATIONAL SCHOOL PISCATAWAY
MIDDLESEX CO VOCATIONAL
PASSAIC COUNTY TECHNICAL INSTITUTE
PASSAIC COUNTY VOCATIONAL
WARREN COUNTY VOCATIONAL TECHNICAL SCHOOL
WARREN COUNTY VOCATIONAL
ENGLISH LANGUAGE LEARNER
CDS CODE