cambridge industrial trustcambridge ... - listed...
TRANSCRIPT
Cambridge Industrial TrustCambridge Industrial Trust1Q2009 Results
24 April 2009
Presentation Outline
1Q09 Hi hli ht1Q09 Hi hli ht1Q09 Highlights1Q09 Highlights
1Q09 Financial Highlights1Q09 Financial Highlights
Risk ManagementRisk Management
1Q09 Financial Highlights1Q09 Financial Highlights
Strategy for 2009Strategy for 2009
2
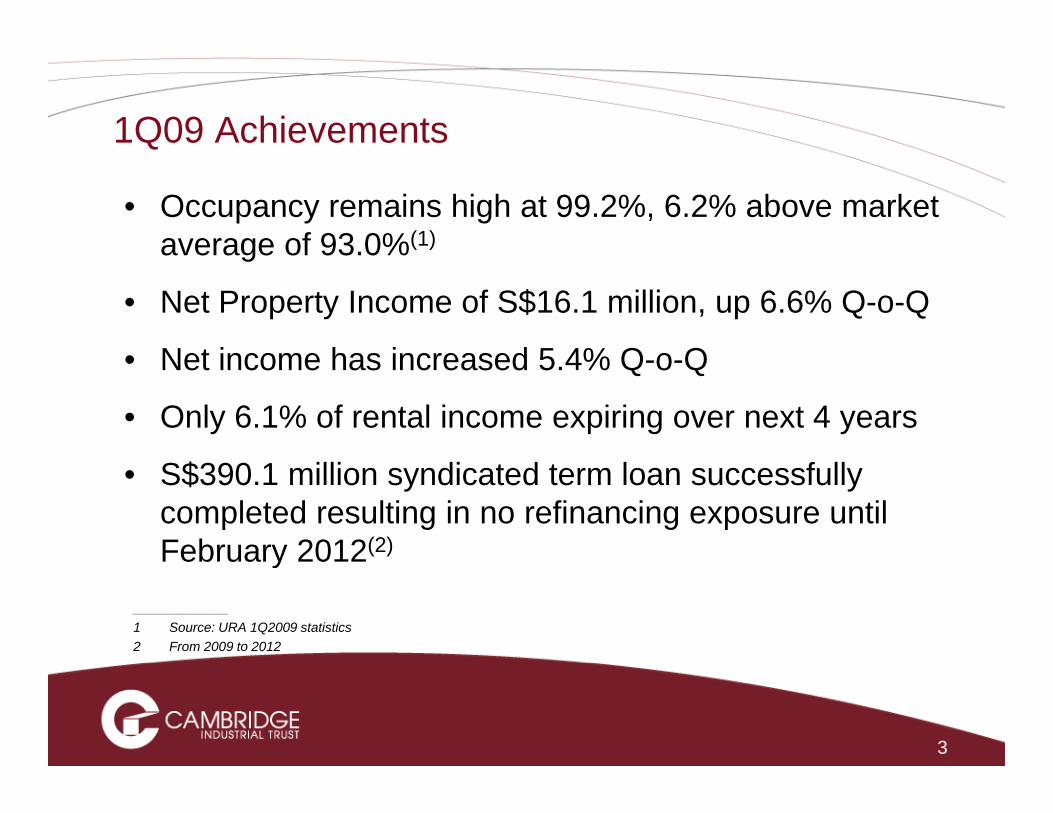
1Q09 Achievements
• Occupancy remains high at 99.2%, 6.2% above market average of 93.0%(1)average of 93.0%
• Net Property Income of S$16.1 million, up 6.6% Q-o-Q
• Net income has increased 5 4% Q o Q• Net income has increased 5.4% Q-o-Q
• Only 6.1% of rental income expiring over next 4 years
• S$390.1 million syndicated term loan successfully completed resulting in no refinancing exposure until February 2012(2)February 2012
_____________1 Source: URA 1Q2009 statistics2 From 2009 to 2012
3
Presentation Outline
1Q09 Hi hli ht1Q09 Hi hli ht1Q09 Highlights1Q09 Highlights
1Q09 Financial Highlights1Q09 Financial Highlights
Risk ManagementRisk Management
1Q09 Financial Highlights1Q09 Financial Highlights
Strategy for 2009Strategy for 2009
4
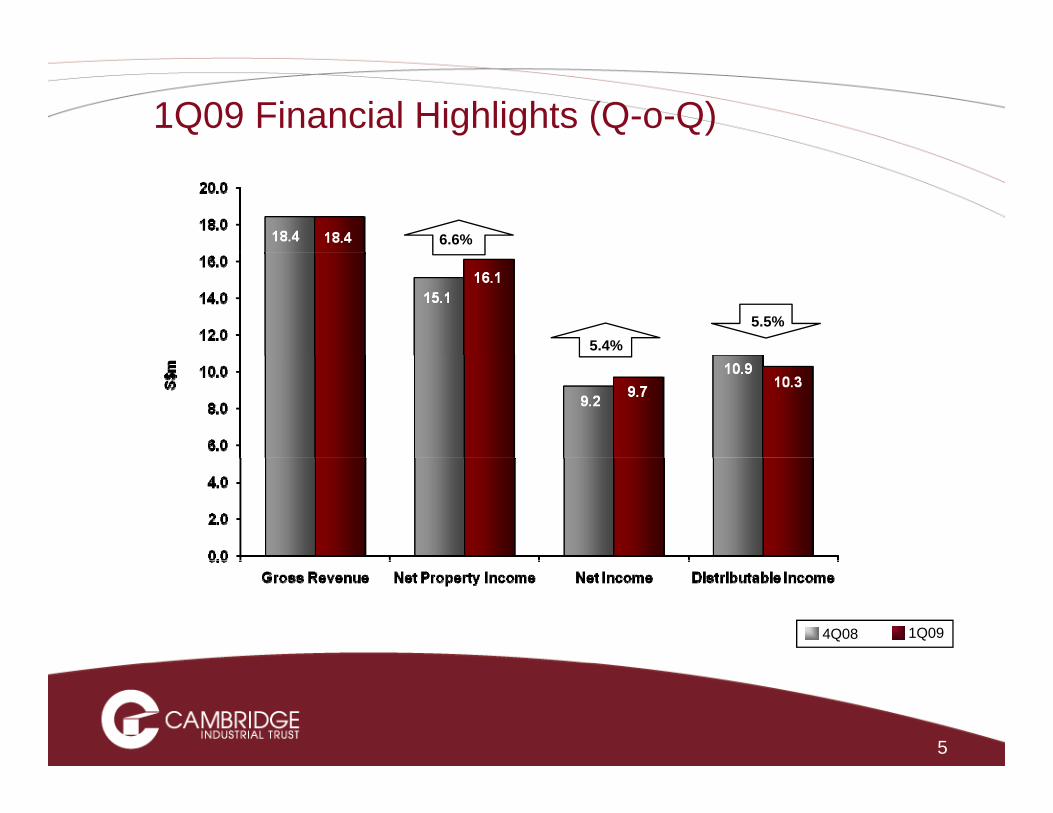
1Q09 Financial Highlights (Q-o-Q)
6.6%
5.4%5.5%
4Q08 1Q09
5
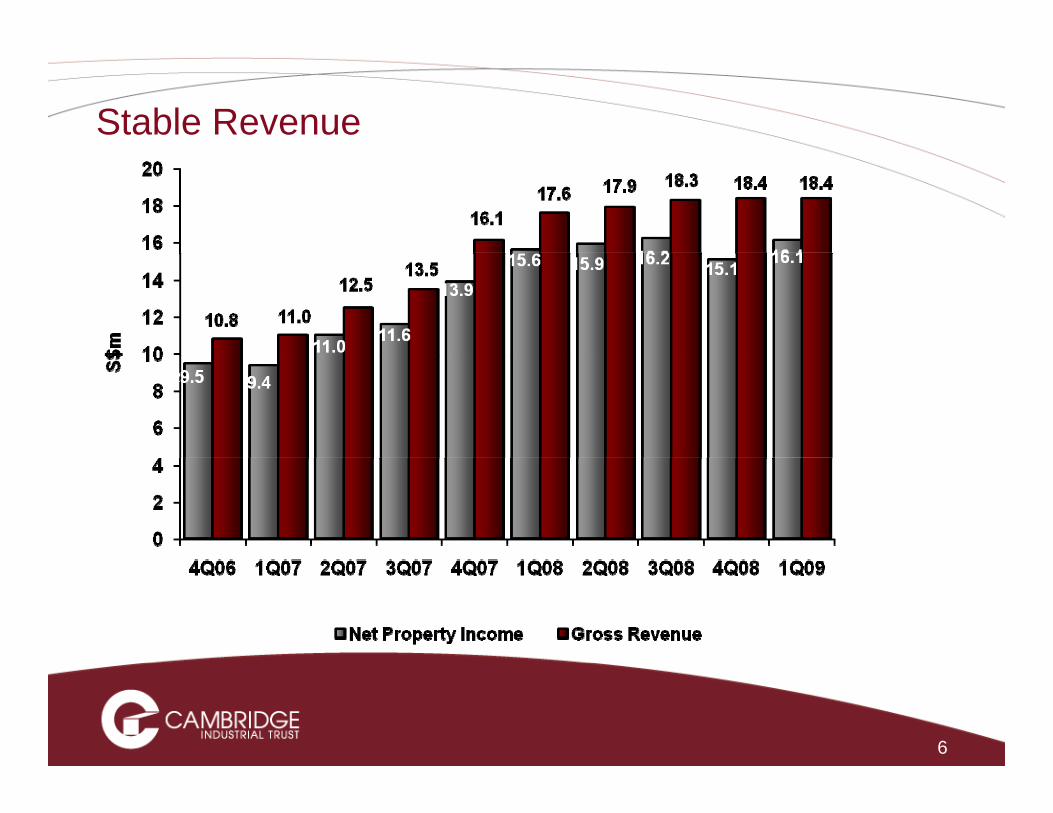
Stable Revenue
6
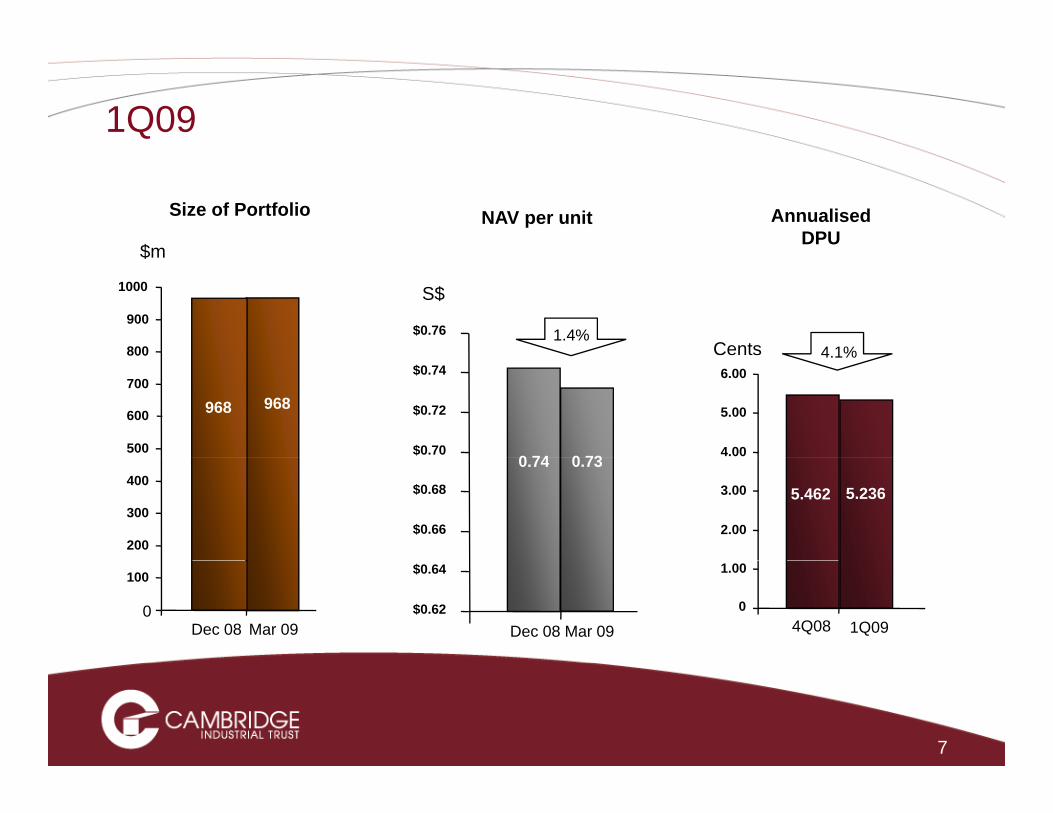
1Q09
NAV per unitSize of Portfolio Annualised DPU
$m
$0.76800
900
1000 S$
4 1%1.4%
$m
Cents
$0.70
$0.72
$0.74
0 74500
600
700
800
968968
4.00
5.00
6.004.1%
0 73
$0.66
$0.68
0.74
200
300
400
2.00
3.00 5.462 5.236
0.73
$0.62
$0.64
Dec 08 Mar 090
100
Dec 08 Mar 090
1.00
4Q08 1Q09
7
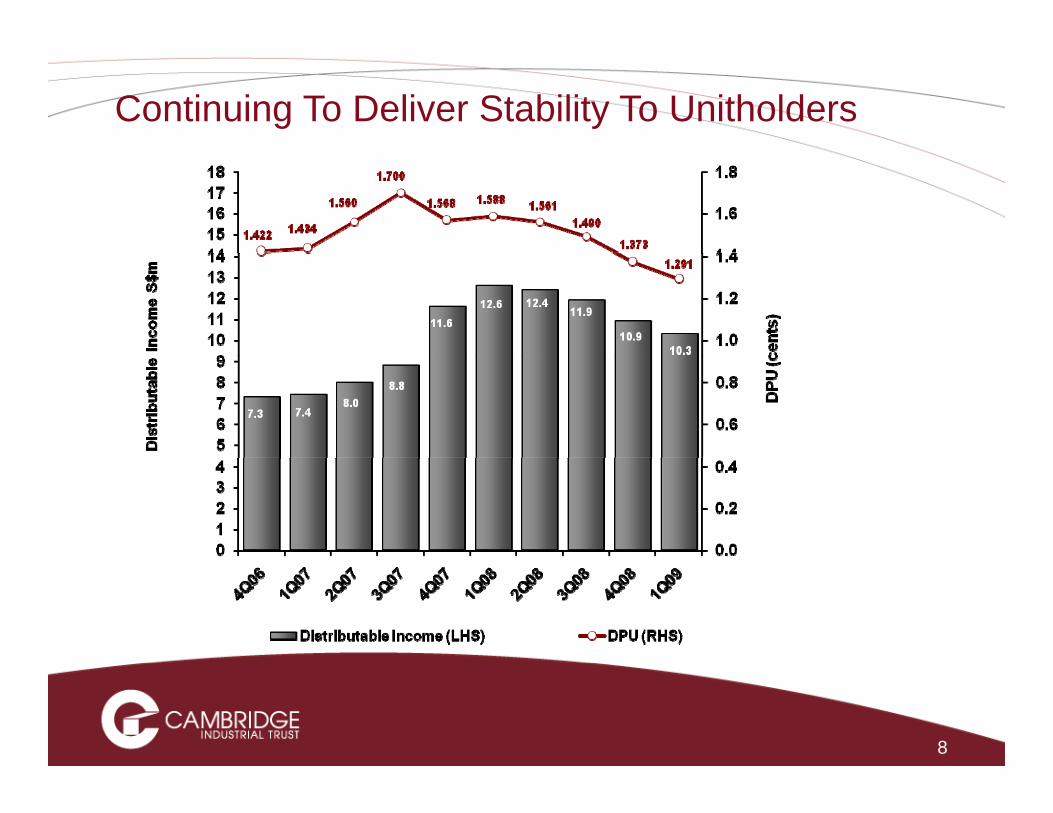
Continuing To Deliver Stability To Unitholders
8
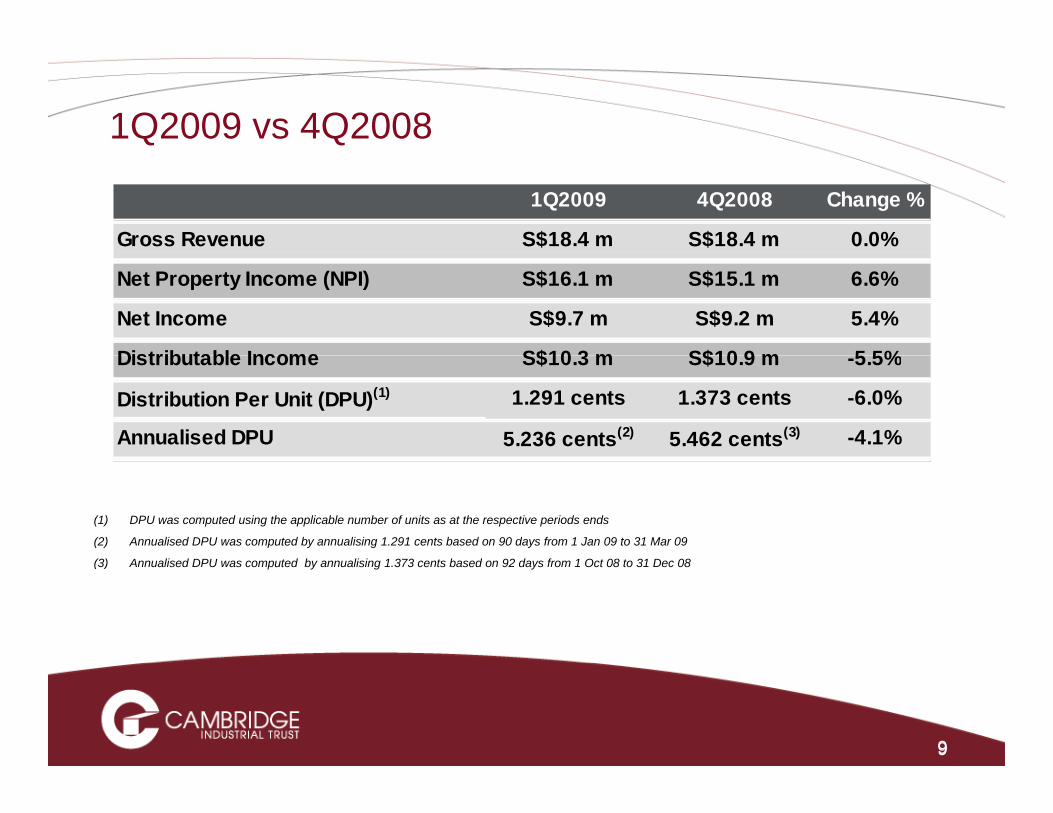
1Q2009 vs 4Q2008
1Q2009 4Q2008 Change %
Gross Revenue S$18.4 m S$18.4 m 0.0%
Net Property Income (NPI) S$16.1 m S$15.1 m 6.6%
Net Income S$9.7 m S$9.2 m 5.4%
Distributable Income S$10 3 m S$10 9 m 5 5%Distributable Income S$10.3 m S$10.9 m -5.5%
Distribution Per Unit (DPU)(1) 1.291 cents 1.373 cents -6.0%
Annualised DPU 5.236 cents(2) 5.462 cents(3) -4.1%
(1) DPU was computed using the applicable number of units as at the respective periods ends
(2) Annualised DPU was computed by annualising 1.291 cents based on 90 days from 1 Jan 09 to 31 Mar 09
(3) A li d DPU t d b li i 1 373 t b d 92 d f 1 O t 08 t 31 D 08(3) Annualised DPU was computed by annualising 1.373 cents based on 92 days from 1 Oct 08 to 31 Dec 08
99
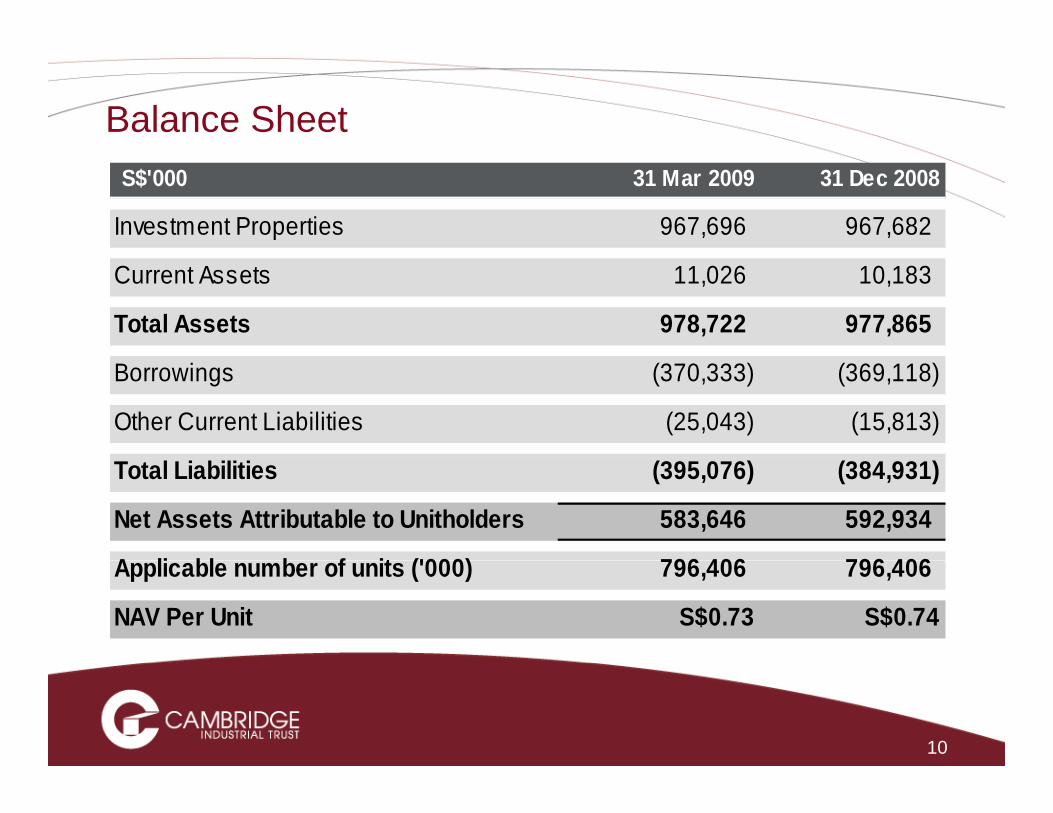
Balance SheetS$'000 31 Mar 2009 31 Dec 2008
Investment Properties 967,696 967,682
Current Assets 11,026 10,183
Total Assets 978,722 977,865
Borrowings (370,333) (369,118)
Other Current Liabilities (25,043) (15,813)
Total Liabilities (395,076) (384,931)
Net Assets Attributable to Unitholders 583,646 592,934
A li bl b f it ('000) 796 406 796 406Applicable number of units ('000) 796,406 796,406
NAV Per Unit S$0.73 S$0.74
10
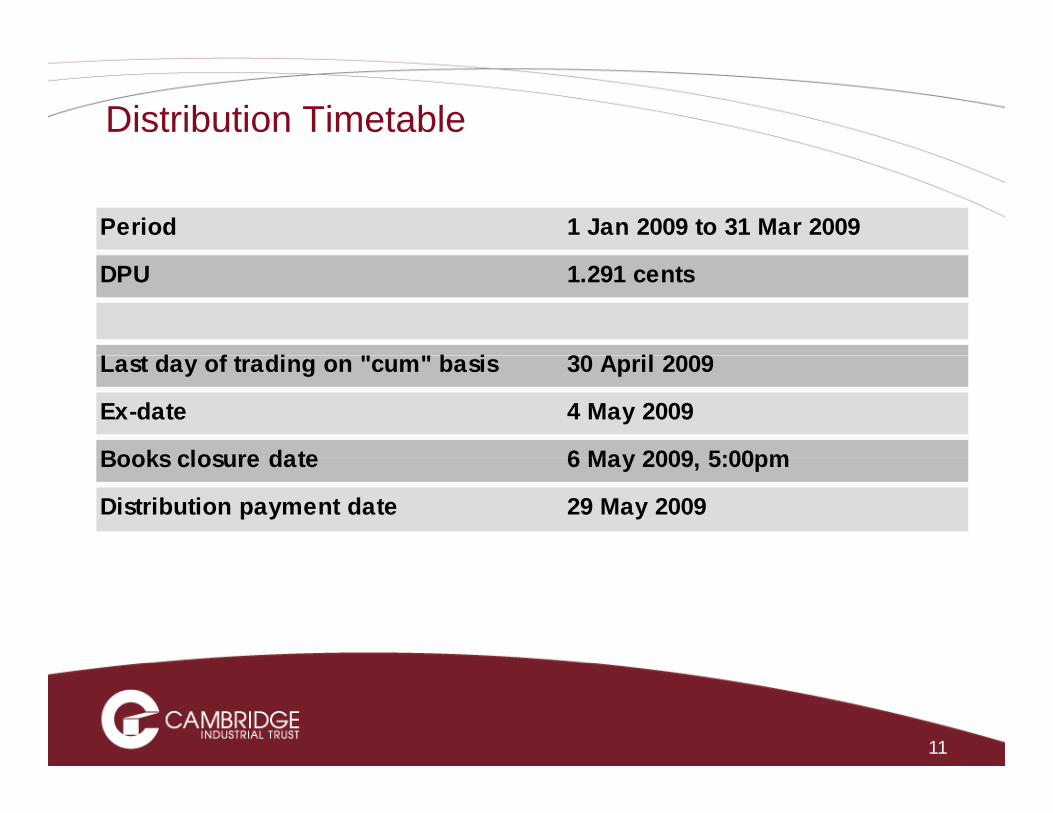
Distribution Timetable
Period 1 Jan 2009 to 31 Mar 2009
DPU 1.291 cents
L t d f t di " " b i 30 A il 2009Last day of trading on "cum" basis 30 April 2009
Ex-date 4 May 2009
Books closure date 6 May 2009 5:00pmBooks closure date 6 May 2009, 5:00pm
Distribution payment date 29 May 2009
11
Presentation Outline
1Q09 Hi hli ht1Q09 Hi hli ht1Q09 Highlights1Q09 Highlights
1Q09 Financial Highlights1Q09 Financial Highlights
Risk ManagementRisk Management
1Q09 Financial Highlights1Q09 Financial Highlights
Strategy for 2009Strategy for 2009
12
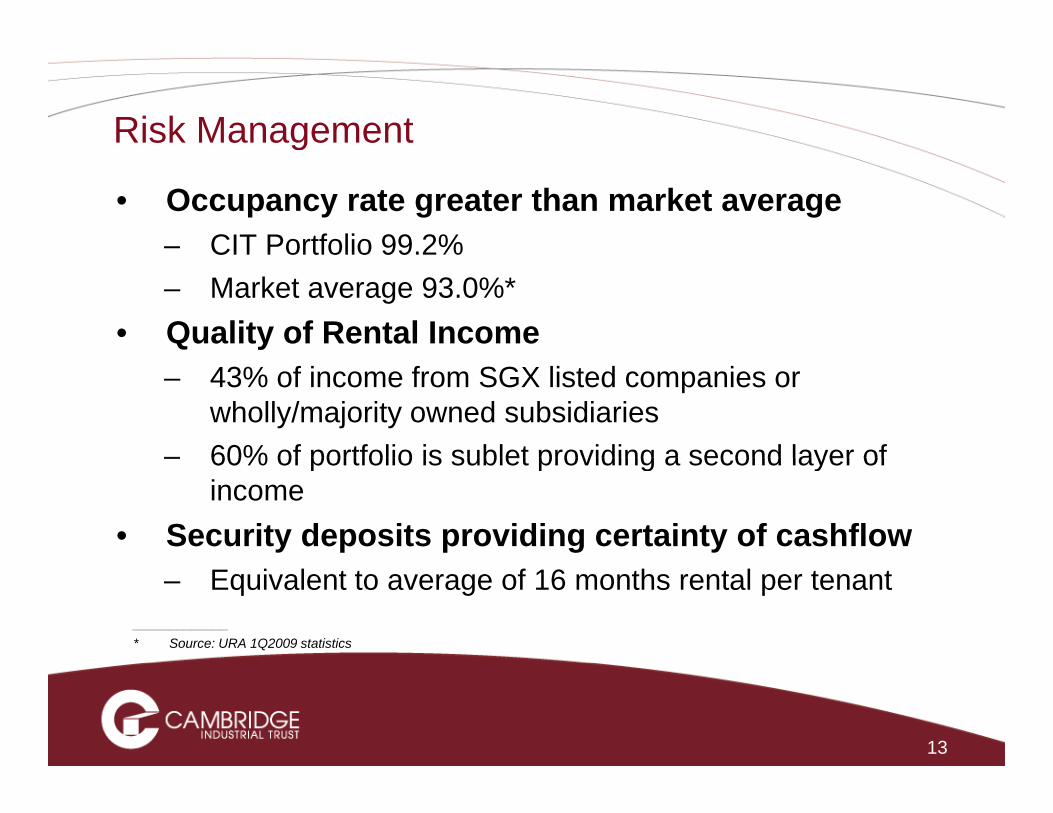
Risk Managementg
• Occupancy rate greater than market average– CIT Portfolio 99.2%CIT Portfolio 99.2%– Market average 93.0%*
• Quality of Rental Income– 43% of income from SGX listed companies or
wholly/majority owned subsidiaries– 60% of portfolio is sublet providing a second layer of– 60% of portfolio is sublet providing a second layer of
income• Security deposits providing certainty of cashflow
– Equivalent to average of 16 months rental per tenant_____________* Source: URA 1Q2009 statistics
13
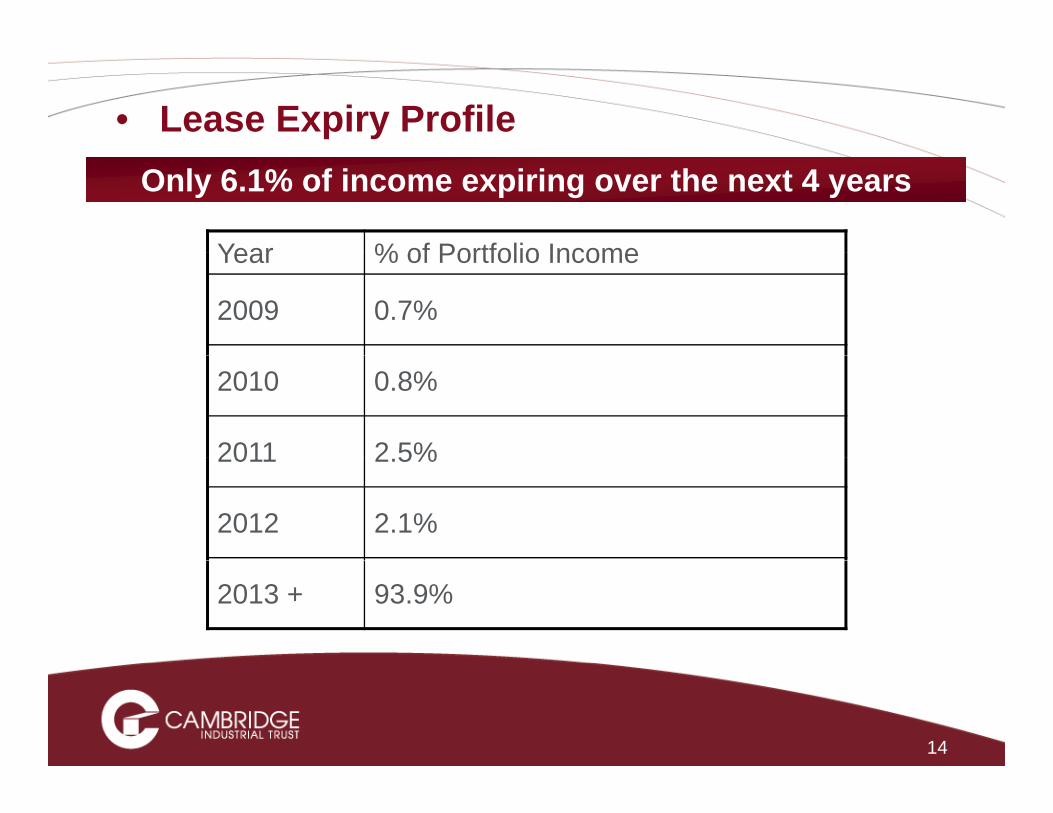
• Lease Expiry Profile
Year % of Portfolio Income
Only 6.1% of income expiring over the next 4 years
Year % of Portfolio Income
2009 0.7%
2010 0.8%
2011 2 5%2011 2.5%
2012 2.1%
2013 + 93.9%
14
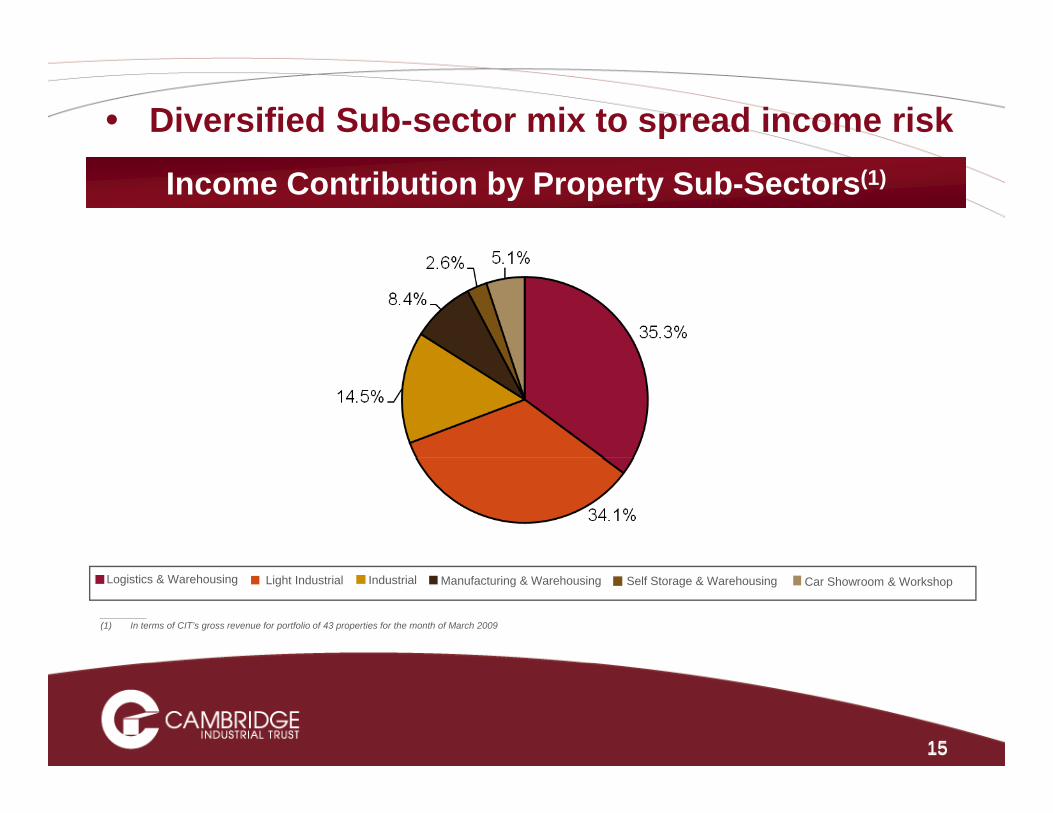
• Diversified Sub-sector mix to spread income risk
Income Contribution by Property Sub-Sectors(1)
_________(1) In terms of CIT’s gross revenue for portfolio of 43 properties for the month of March 2009
Logistics & Warehousing Light Industrial Industrial Manufacturing & Warehousing Self Storage & Warehousing Car Showroom & Workshop
1515
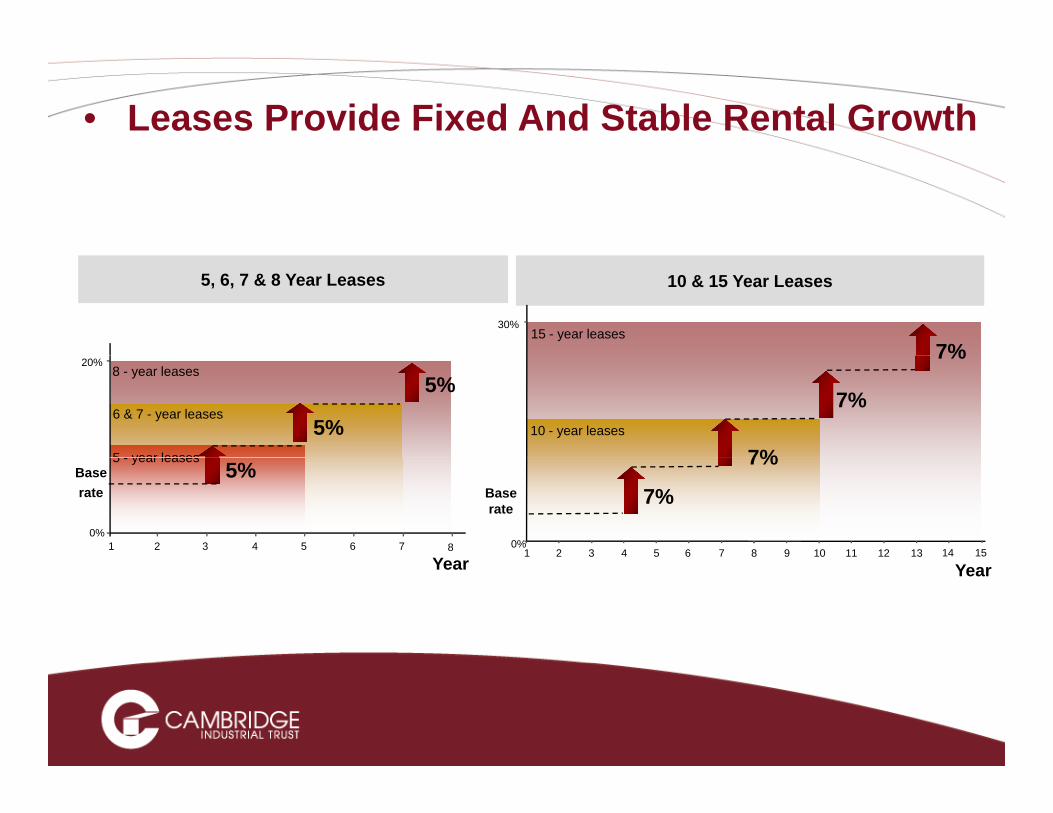
• Leases Provide Fixed And Stable Rental Growth
5, 6, 7 & 8 Year Leases 10 & 15 Year Leases
30%15 - year leases
7%
7%
7%10 - year leases
7%8 - year leases
6 & 7 - year leases
5 year leases
20%
5%
5%
Baserate
7%
7%
0%1 2 3 4 5 6 7 8 9 10 11 12 13
Baserate
5%
0%1 2 3 4 5 6 7
5 - year leases
8 14 15Year YearYear
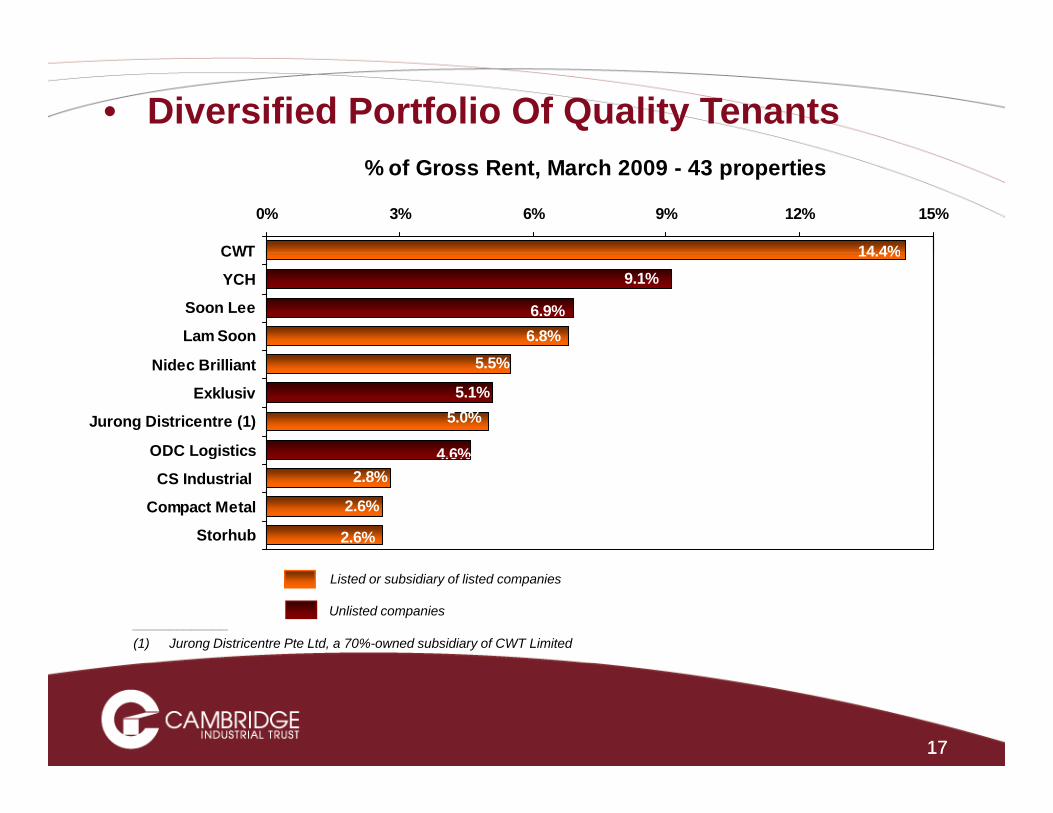
• Diversified Portfolio Of Quality Tenants
14 4%
0% 3% 6% 9% 12% 15%
CWT
% of Gross Rent, March 2009 - 43 properties
6.8%6.9%
9.1%
14.4%CWT
YCH
Soon Lee
Lam Soon
4.6%
5.0%5.1%
5.5%Nidec Brilliant
Exklusiv
Jurong Districentre (1)
ODC Logistics
2.6%
4.6%
2.6%
2.8%g
CS Industrial
Compact Metal
Storhub
_____________(1) Jurong Districentre Pte Ltd, a 70%-owned subsidiary of CWT Limited
Listed or subsidiary of listed companies
Unlisted companies
1717
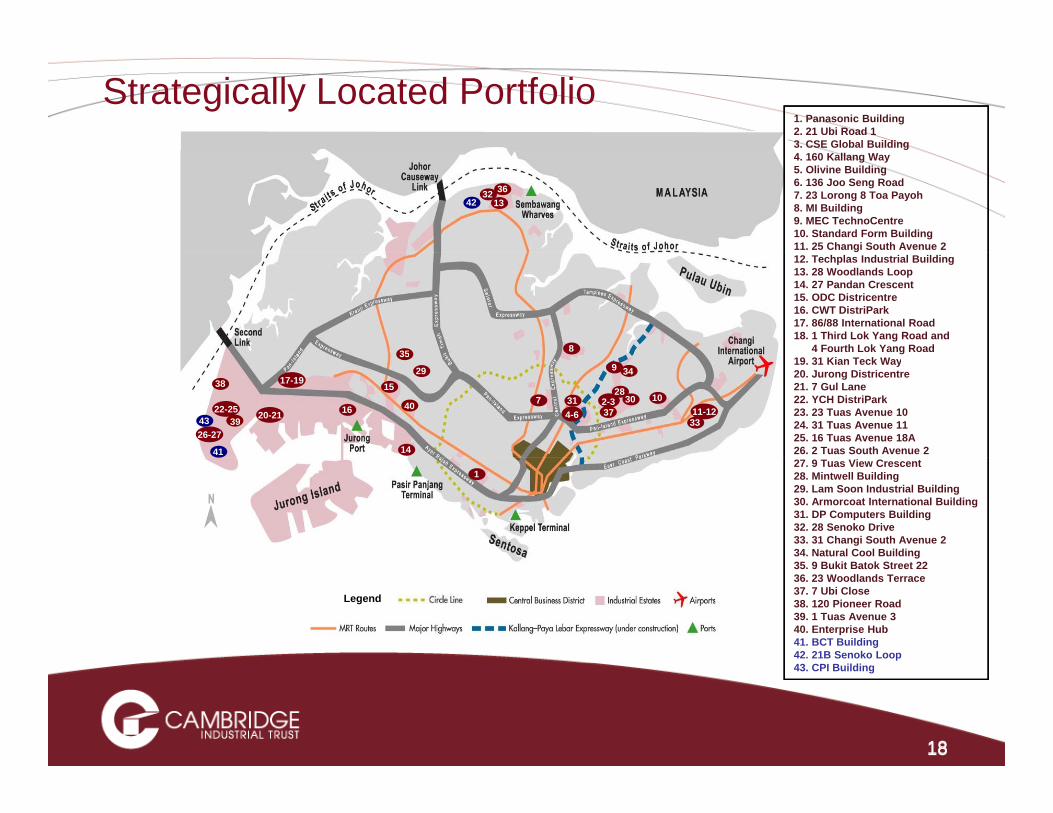
Strategically Located Portfolio1. Panasonic Building2. 21 Ubi Road 13. CSE Global Building
321336
42
4. 160 Kallang Way5. Olivine Building6. 136 Joo Seng Road7. 23 Lorong 8 Toa Payoh8. MI Building9. MEC TechnoCentre10. Standard Form Building11. 25 Changi South Avenue 2
835
12. Techplas Industrial Building13. 28 Woodlands Loop14. 27 Pandan Crescent15. ODC Districentre16. CWT DistriPark17. 86/88 International Road18. 1 Third Lok Yang Road and
4 Fourth Lok Yang Road
1510
14
16
17-19
20-2122-25
26-27
9
7 2-311-124-6
29
283031
33
34
37
35
3940
38
41
43
19. 31 Kian Teck Way20. Jurong Districentre21. 7 Gul Lane22. YCH DistriPark23. 23 Tuas Avenue 1024. 31 Tuas Avenue 1125. 16 Tuas Avenue 18A26. 2 Tuas South Avenue 2
127. 9 Tuas View Crescent28. Mintwell Building29. Lam Soon Industrial Building30. Armorcoat International Building31. DP Computers Building32. 28 Senoko Drive33. 31 Changi South Avenue 234. Natural Cool Building35. 9 Bukit Batok Street 2236. 23 Woodlands Terrace37. 7 Ubi Close38. 120 Pioneer Road39. 1 Tuas Avenue 340. Enterprise Hub41. BCT Building42. 21B Senoko Loop
Legend
1818
43. CPI Building
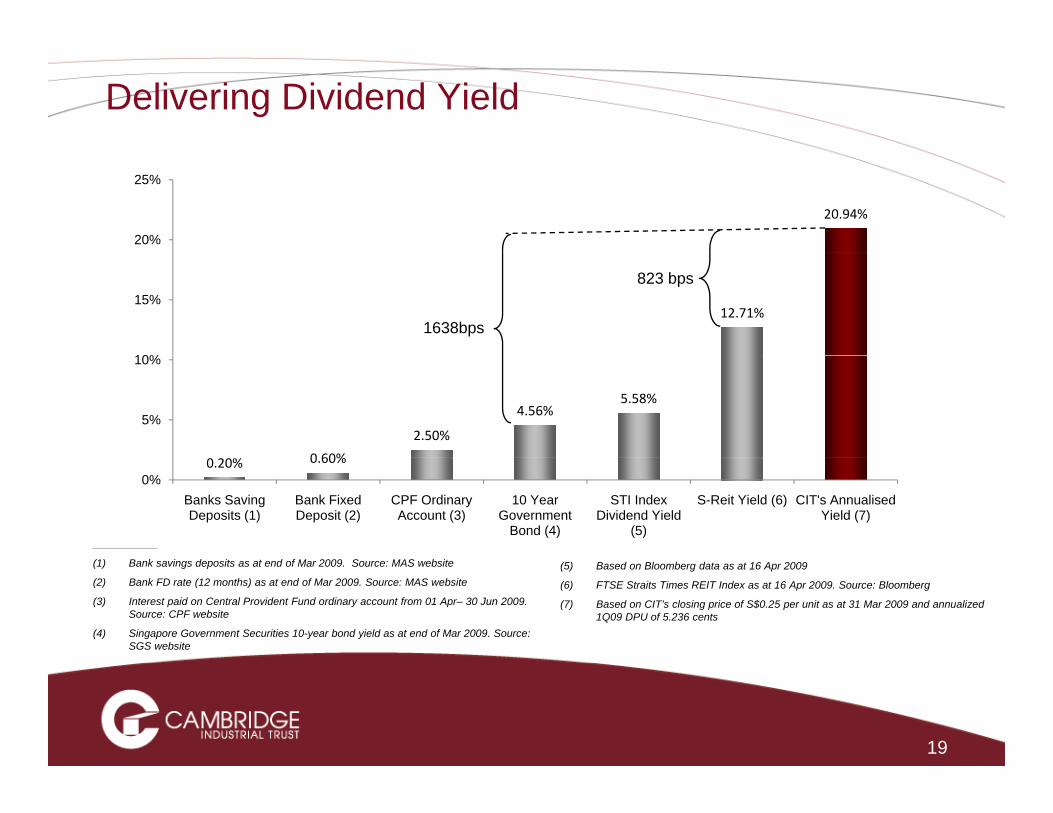
Delivering Dividend Yield
20.94%
20%
25%
12.71%
10%
15%
1638bps
823 bps
0 60%
2.50%
4.56%5.58%
5%
10%
___________
(1) B k i d it t d f M 2009 S MAS b it
0.20% 0.60%
0%Banks Saving Deposits (1)
Bank Fixed Deposit (2)
CPF Ordinary Account (3)
10 Year Government
Bond (4)
STI Index Dividend Yield
(5)
S-Reit Yield (6) CIT's Annualised Yield (7)
(1) Bank savings deposits as at end of Mar 2009. Source: MAS website
(2) Bank FD rate (12 months) as at end of Mar 2009. Source: MAS website
(3) Interest paid on Central Provident Fund ordinary account from 01 Apr– 30 Jun 2009. Source: CPF website
(4) Singapore Government Securities 10-year bond yield as at end of Mar 2009. Source: SGS website
(5) Based on Bloomberg data as at 16 Apr 2009
(6) FTSE Straits Times REIT Index as at 16 Apr 2009. Source: Bloomberg
(7) Based on CIT’s closing price of S$0.25 per unit as at 31 Mar 2009 and annualized 1Q09 DPU of 5.236 cents
19
Presentation Outline
1Q09 Hi hli ht1Q09 Hi hli ht1Q09 Highlights1Q09 Highlights
1Q09 Financial Highlights1Q09 Financial Highlights
Risk ManagementRisk Management
1Q09 Financial Highlights1Q09 Financial Highlights
Strategy for 2009Strategy for 2009
20
Key Strategies
Prudent Capital ManagementManagement
Asset Acquisition d Di t t
Proactive Asset and Divestment Management
21
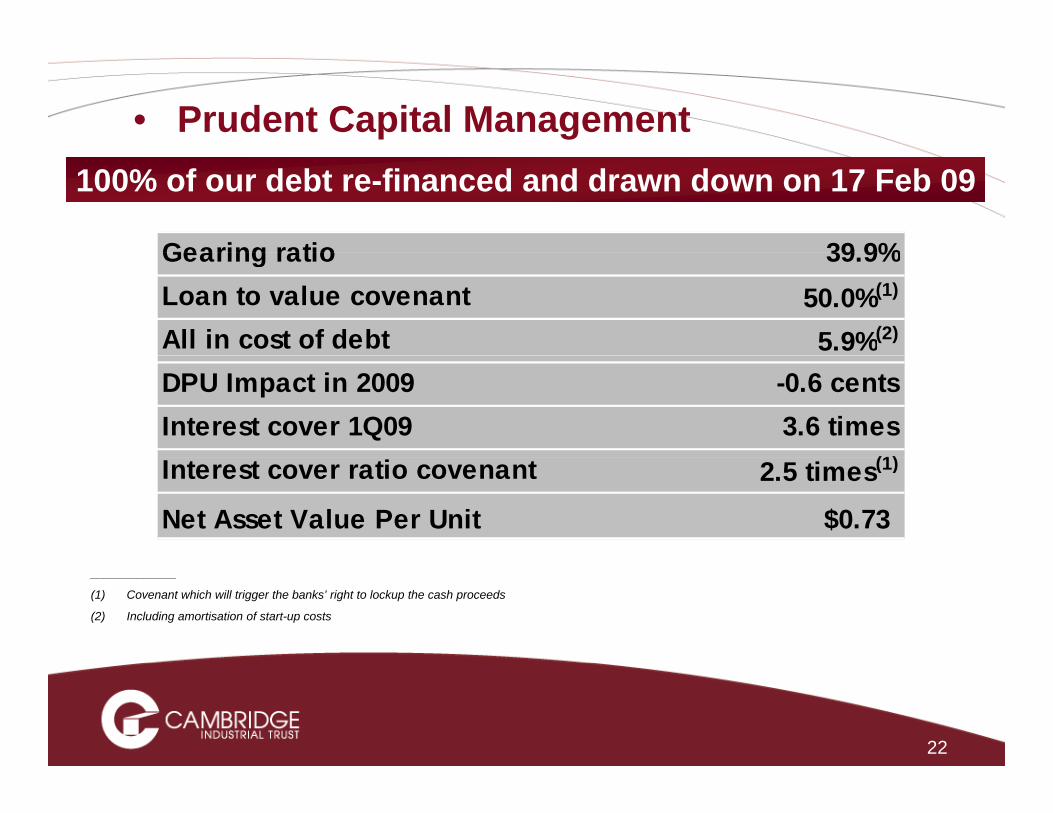
• Prudent Capital Management
Gearing ratio 39 9%
100% of our debt re-financed and drawn down on 17 Feb 09
Gearing ratio 39.9%Loan to value covenant 50.0%(1)
All in cost of debt 5.9%(2)
DPU Impact in 2009 -0.6 centsInterest cover 1Q09 3.6 times
(1)Interest cover ratio covenant 2.5 times(1)
Net Asset Value Per Unit $0.73
_____________
(1) Covenant which will trigger the banks’ right to lockup the cash proceeds
(2) Including amortisation of start-up costs
22
• Proactive Asset ManagementCIT objective is to be the ‘Best of Class’ manager of industrial real estate
– CIT will achieve this by intensively managing its portfolio of assets and working closely with tenants to ensure they meet g y ytheir lease obligations
– Improve efficiency of space to maximise rental income
– A&A works catering to tenants’ needs and maximisation of plot ratios
– Lease renegotiation to dilute tenancy and long term expiry g y g p yprofile concentration
23
• Assets Acquisition and Divestment
Di ti f ll d f i t
Maintaining an investment grade portfolio
– Divesting of smaller, underperforming assets
– Exploring development projects that are value accretiveaccretive
24
Thank You
CAMBRIDGE INDUSTRIAL TRUST MANAGEMENT LIMITED61 ROBINSON ROAD, #12-01 ROBINSON CENTRE, SINGAPORE 068893TEL: (65) 6222 3339 FAX: (65) 6827 9339 WWW.CAMBRIDGEINDUSTRIALTRUST.COM
Chris Calvert Chief Executive Officer DID: (65) 6827 9333 chris calvert@cambridgeitm comChris Calvert Chief Executive Officer DID: (65) 6827 9333 [email protected]
Tay Chiew Sheng Manager, Investor Relations DID: (65) 6827 9330 [email protected]
25
Important NoticeThe value of units in CIT (“Units”) and the income derived from them may fall as well as rise. Units are not investments, liabilitiesor obligations of, or deposits in, Cambridge Industrial Trust Management Limited ("Manager"), RBC Dexia Trust ServicesSingapore Limited (in its capacity as trustee of CIT) ("Trustee"), or any of their respective related corporations and affiliates(including but not limited to National Australia Bank Limited, nabInvest Capital Partners Pty Ltd, or other members of the NationalAustralia Bank group) and their affiliates (individually and collectively "Affiliates"). An investment in Units is subject to equityinvestment risk including the possible delays in repayment and loss of income or the principal amount invested Neither CIT theinvestment risk, including the possible delays in repayment and loss of income or the principal amount invested. Neither CIT, theManager, the Trustee nor any of the Affiliates guarantees the repayment of any principal amount invested, the performance ofCIT, any particular rate of return from investing in CIT, or any taxation consequences of an investment in CIT. Any indication of CITperformance returns is historical and cannot be relied on as an indicator of future performance.
Investors have no right to request that the Manager redeem or purchase their Units while the Units are listed. It is intended thati t l d l i th i U it th h t di Si E h S iti T di Li it d (th “SGX ST”) Li ti finvestors may only deal in their Units through trading on Singapore Exchange Securities Trading Limited (the “SGX-ST”). Listing ofthe Units on the SGX-ST does not guarantee a liquid market for the Units.
This presentation may contain forward-looking statements that involve assumptions, risks and uncertainties. Actual futureperformance, outcomes and results may differ materially from those expressed in forward-looking statements as a result of anumber of risks, uncertainties and assumptions. Representative examples of these factors include (without limitation) general, p p p ( ) gindustry and economic conditions, interest rate trends, cost of capital and capital availability, competition from similardevelopments, shifts in expected levels of occupancy or property rental income, changes in operating expenses (includingemployee wages, benefits and training costs), governmental and public policy changes and the continued availability of financingin amounts and on terms necessary to support future CIT business. You are cautioned not to place undue reliance on theseforward-looking statements, which are based on the Manager’s current view of future events.
This presentation is for informational purposes only and does not have regard to your specific investment objectives, financialsituation or your particular needs. Any information contained in this presentation is not to be construed as investment or financialadvice, and does not constitute an offer or an invitation to invest in CIT or any investment or product of or to subscribe to anyservices offered by the Manager, the Trustee or any of the Affiliates.
26